


Introduction
Power lines are known to cause a huge number of bird deaths worldwide each year (Bevanger Reference Bevanger1998, APLIC 2006, Lehman et al. Reference Lehman, Kennedy and Savidge2007, Jenkins et al. Reference Jenkins, Smallie and Diamond2010). Electrocutions on pylons seem to be the major cause of bird mortality, but collisions with wires also cause many deaths (APLIC 1994, Bayle Reference Bayle1999, Janss Reference Janss2000). While electrocutions have been thoroughly investigated (Ferrer et al. Reference Ferrer, De La Riva and Castroviejo1991, Janss and Ferrer Reference Janss and Ferrer1999, Reference Janss and Ferrer2001, Mañosa Reference Mañosa2001, APLIC 2006, Lehman et al. Reference Lehman, Kennedy and Savidge2007), we still have a limited understanding of the causes and implications of collision, due to the complex nature of this problem and methodological and practical constraints (Bevanger Reference Bevanger1998, Reference Bevanger, Ferrer and Janss1999).
Collisions mostly occur with transmission lines carrying tensions ≥110 kV, probably due to the greater number of conductors, the presence of undetectable earth wires, higher tower heights and larger distances between towers (Alonso et al. Reference Alonso, Alonso and Muñoz-Pulido1994, Bevanger Reference Bevanger1994, Fernández-García Reference Fernández-García1998, Janss and Ferrer Reference Janss and Ferrer1998). Less is known about the situations in which birds collide with power lines. Most casualties seem to occur either on leading lines defined by macroforms (e.g. mountain ranges, coastlines or plains) that are important for long-distance bird movements, or on short flight lanes between foraging and roosting areas, which depend on habitat characteristics and topographical features in relation to the behaviour and habitat requirements of the target species (Bevanger Reference Bevanger1994). In any case, flight height appears to be a crucial factor in determining bird collision with linear infrastructures such as power lines (Bevanger Reference Bevanger1994, McLeod et al. Reference McLeod, Whitfield and McGrady2002a,Reference McLeod, Whitfield, Fielding, Haworth and McGradyb, Madders and Whitfield Reference Madders and Whitfield2006).
The bird species that are most likely to collide with wires are those that are less able to cope with artificial obstacles (Bevanger Reference Bevanger1994). Typically, these species include ground-dwelling species (e.g. bustards and capercaillies), waterbirds (e.g. wildfowl and shorebirds), thermal soarers (e.g. storks and cranes) and birds that form large flocks (e.g. gulls) (Bevanger Reference Bevanger1998, Janss Reference Janss2000), although the overall importance of collisions at population level remains unknown (Bevanger Reference Bevanger1998, Alonso and Alonso Reference Alonso, Alonso, Ferrer and Janss1999, Bevanger Reference Bevanger, Ferrer and Janss1999). Despite being thermal soarers, eagles and vultures are generally reported as collision victims in low numbers, probably due to a low number of span crossings a day and their solitary habits (Janss Reference Janss2000). Nevertheless, despite the relatively low number of collision accidents involving raptors, the conservation significance of such accidents may be very serious in the case of endangered species. Thus, it is known that collision is the second commonest cause of mortality (18–23%) in the endangered Bearded Vulture Gypaetus barbatus in Europe (BirdLife International 2004, Margalida et al. Reference Margalida, Heredia, Razin and Hernández2008). On the other hand, few studies on raptor collisions with power lines have been conducted to date because of methodological and practical constraints. Consequently, little information is available on the environmental and technical features that determine this kind of mortality and their consequences at population level (Bevanger Reference Bevanger1998, Alonso and Alonso Reference Alonso, Alonso, Ferrer and Janss1999, Bevanger Reference Bevanger, Ferrer and Janss1999, Madders and Whitfield Reference Madders and Whitfield2006).
Bonelli’s Eagle Hieraaetus fasciatus is a bird of prey whose population is in decline in numbers and range throughout Europe. Around 80% of the European breeding population is concentrated in Spain, where its numbers have decreased by 50% over the last three decades as a result of high adult and pre-adult mortality (Real and Mañosa Reference Real and Mañosa1997, BirdLife International 2004, Del Moral Reference Del Moral2006). Real et al. (Reference Real, Grande, Mañosa and Sánchez-Zapata2001) performed an initial estimate of causes of death in Bonelli’s Eagle in Spain and found that the main cause was interaction with power lines (58%), either by electrocution (55%) or collision (3%), although the overall importance of collision was higher in some regions such as Catalonia (6%), Andalucía (7%) and northern Spain (14%). Nonetheless, Mañosa and Real (Reference Mañosa and Real2001) found that collisions might in fact have caused up to 17% of deaths, which implies that the demographic consequences of collisions could be decisive for the conservation of this species, above all in the case of territorial birds (Real and Mañosa Reference Real and Mañosa1997).
To evaluate the importance of collision on Bonelli’s Eagle mortality, Mañosa and Real (Reference Mañosa and Real2001) undertook a different approach that consisted of first classifying the spans of transmission lines near nest areas as being of either High or Low Collision Risk and then correlating their classifications with turnover rates at different territories. The results indicated that High Collision Risk spans near nests (1 km) appeared to be positively correlated with territorial turnover rates, which may indicate that they cause the deaths of adults when they collide with wires. Nevertheless, some bias could exist in the methodology used since the collision risk category was ascribed to spans on the basis of the authors’ knowledge of eagle behaviour in relation to habitat and topography, rather than being based on a standardised tracking methodology, whereas potential casualties with distribution lines were not considered. Direct observational data from telemetry can provide more objective and specific knowledge of the areas used by territorial eagles and of birds’ flight behaviour when crossing power lines, which will help provide a better understanding of collision events and thus help implement appropriate conservation measures.
We used data from 21 radio- or satellite-tagged territorial Bonelli’s Eagles to study collisions with power lines in this species. The objectives of this study were: (i) to determine the factors that influence flight height and span crossings by eagles; (ii) to analyse the relationships between the territorial risk of collision ascribed to each different power line type and territorial t turnover rates; and (iii) to provide recommendations for mitigating power line collision casualties.
Materials and methods
Telemetry data
The study area was located in Catalonia (north-east Spain) where 15 Bonelli’s Eagle territories in the provinces of Barcelona and Tarragona were selected. To study bird movements on two spatial scales, during 2002–2006 we radio-tagged 18 birds from 12 territories (11 males and seven females) with terrestrial transmitters with activity switch (TW-3 32–40 g, Biotrack Ltd., Wareham, Dorset, BH20 5AX, UK) and battery-powered for 2–3 years. Each individual was radio-tracked by a field observer for between 16 and 49 complete days (beginning after sunrise and then until sunset) regularly distributed throughout a whole year using an Icom R10 receiver (Icom Inc, Osaka, Japan), 10 × 50 binoculars, a 20–60 × 72 telescope and a 4 × 4 vehicle. During the tracking period, the observer continuously recorded the location, the flight height level and behaviour of the eagle and obtained data on its position every hour. All locations, whether by direct observation or triangulation, were plotted in situ on a paper topographic map. As well, to delimit the home ranges of three further territories, during 2006–2007 we equipped three adult males with solar-powered GPS satellite transmitters (Microwave Telemetry, Inc. PTT-100 45 g Argos/GPS) that gave several daily locations. All radio-tracking and high accuracy GIS satellite locations were subsequently transcribed onto a topographic digital map in ESRI shape format for ArcView GIS v. 3.1.
Individual home ranges were defined as the 100% Minimum Convex Polygon (MCP; Mohr Reference Mohr1947) and we considered the fixed kernel density contours at 95%, 80% and 50% to describe the different probability use of home ranges (Worton Reference Worton1989, Seaman and Powell Reference Seaman and Powell1996, Kenward Reference Kenward2001, Laver and Kelly Reference Laver and Kelly2008). Home range sizes were developed with Ranges 7 software using 150 hourly locations that were considered independent (Swihard and Slade Reference Swihard and Slade1985, Seaman and Powell Reference Seaman and Powell1996, Kenward Reference Kenward2001) and a width factor of H = 1 for kernel probabilities. MCP and kernel areas were afterwards exported to shape format for ArcView GIS v. 3.1, as this software was used for all GIS analyses.
Span collision risk
We carried out two spatial approaches to model the factors influencing the risk of eagles colliding with power lines and analysed (i) eagles’ flight heights and (ii) the crossings of power line spans made by eagles.
To study the factors influencing flight height we used 4,454 observed flight locations obtained by radio-tracking. Flight locations were classified according to a height level estimated by the field observer as either ≤ 50 m from the ground, which was considered the critical height for colliding with power lines, or higher. We used five environmental variables to characterise flight locations: habitat (HAB) and topographic position (TOP) if the location was exact, and presence of urban areas (URB), motorways or dual carriageways (MOT) and railways (RAI) within a 500 m radius of the bird’s location.
To study the factors influencing span crossings by eagles the electricity companies Red Eléctrica de España (REE), owner of 220–400 kV transmission lines, and FECSA-ENDESA, owner of ≤ 66 kV distribution and 110 kV transmission lines, provided exact cartography of power lines in shape format. In order to avoid potential biases due to differential power line length and distribution between territories, we performed a sample of 500 line segments with a fixed length of 200 m, randomly distributed throughout the MCP of each radio-tracked individual. The line segment samples were generated using the DNR Sampling Tool v. 2.8 extension for ArcView GIS v. 3.1, available at the Minnesota Department of Natural Resources website (http://www.dnr.state.mn.us/). Both random line segments and power line spans were classified as being crossed over by an eagle or not. Eagle flights were inferred from joining consecutive continuous radio-tracking locations (Figure 1). Random line segments and power line spans were also characterised by six spatial and environmental variables: eagle home range use (HRU), habitat (HAB) and topographic position (TOP) of the central point of the section, and presence of urban areas (URB), motorways or dual carriageways (MOT) and railways (RAI) within a 500 m radius of the centre of the section.
Representative example of an eagle’s flights inferred from joining consecutive continuous radio-tracking locations. 50%, 80% and 95% kernel areas are displayed from dark to light grey.

To classify random line segments and power line spans into one eagle home range use (HRU) category, we used MCP and kernel areas obtained for each individual. Thus, four mutually exclusive HRU categories were considered (ranked from least to most used areas): MCP, kernel 95%, kernel 80% and kernel 50%.
Habitat (HAB) was obtained from the Map of Catalan Habitats 1:50,000 (CHC50) updated in 2003, published by the Catalan Government’s Department of the Environment (Vigo et al. Reference Vigo, Carreras and Ferré2005) and available at the website (http://mediambient.gencat.cat/). We reclassified CHC50 habitat categories into six habitat groups: urban areas, forest, scrubland, farmland or grassland, cliffs and continental water bodies.
To classify the landscape into topographic categories (TOP) we used a digital elevation model (DEM) with a spatial resolution of 30 m, which was generated by the Cartographic Institute of Catalonia (ICC) from topographical 1:5,000 scale maps (BT-5M v. 2.0) and the Topographic Position Index (TPI) v. 1.2 extension, available at Jenness Enterprises’ website (http://www.jennessent.com/). We defined a pixel neighbourhood circle of 500 m radius and three topographic categories as follows: valley or plain (TPI value < 0.5, slope ≤ 5°), slope (−0.5 < TPI value < 0.5, slope > 5°) and ridge (TPI value > 0.5).
The positions of motorways or dual carriageways (MOT) and railways (RAI) were obtained from the ICC topographical 1:5,000 scale maps (BT-5M v. 2.0) available at the website (http://www.icc.cat/).
Modelling procedure
We used logistic regression (Hosmer and Lemeshow Reference Hosmer and Lemeshow2000) to model factors influencing the risk of eagles colliding with power lines. The best model selection was done on the basis of the information theoretic (IT) approach (Burnham and Anderson Reference Burnham and Anderson2002, Whittingham et al. Reference Whittingham, Stephens, Bradbury and Freckleton2006). For a set of competitive models, the AIC weight (ωAIC) was calculated for each model and the total of all the AIC weights add up to one. In a dataset in which there was a clear best model, one model would have a very high ωAIC and all the others would have very low weights. If there is no single model that clearly outperforms all others (ωAIC < 0.9), the IT methodology may be used to perform an average model, in which the parameter estimates of all models are combined, the contribution of each model being proportional to its ωAIC.
The set of competitive models used for analysing the factors influencing eagles flying at the critical height level for colliding with power lines was made up of 32 models resulting from all possible permutations of the five variables considered. When analysing the factors influencing the line segments being crossed by eagles, 63 models resulted from all the possible combinations of the six variables considered. If standard errors (SE) were small (1.96*SE < coefficient estimate, for a 95% confidence level), the parameter estimate was considered to be reliable for predicting the outcome or interpreting the model (Burnham and Anderson Reference Burnham and Anderson2002). Odds ratios (OR) were used to describe the probability of either eagles flying at the critical height level for colliding with power lines or the line segments being crossed by eagles associated to a parameter category in relation to the reference category. An odds ratio of 1 implies that this probability is the same in both groups; an odds ratio of 1.5 for a parameter category means that the probability is 1.5 times higher for this category in relation to the reference category (Hosmer and Lemeshow Reference Hosmer and Lemeshow2000).
The discriminatory ability of models was evaluated using the receiver operating characteristic (ROC) technique. The area under the ROC curve (AUC) ± standard error (SE) was calculated on a non-parametric assumption basis (Manel et al. Reference Manel, Williams and Ormerod2001) and varies from 0.5 to 1.0 (Fielding and Bell Reference Fielding and Bell1997, Pearce and Ferrier Reference Pearce and Ferrier2000).
To validate the random line segments model, we applied the obtained logistic regression equation to the power line spans situated in the territories, taking into account span lengths. Therefore, model evaluation was undertaken with a different sample to the one used to develop the model (Pearce and Ferrier Reference Pearce and Ferrier2000). Validation was assessed by comparing the AUC values of both samples (random line segments and power line spans) and the calibration or proportion of crossed spans expected by the model with the real observed proportion for each parameter category (Pearce and Ferrier Reference Pearce and Ferrier2000). All data analyses were run using SPSS v. 14.0 for Windows.
Territorial collision risk and turnover rates
To analyse the relationship between territorial risk of collision and turnover rates we classified power line spans as belonging to one of three types (Table 1) based on technical aspects (provided by electricity companies) such as voltage, the number of conductors, the presence of earth wires and pylon heights (Alonso et al. Reference Alonso, Alonso and Muñoz-Pulido1994, Bevanger Reference Bevanger1994, Fernández-García Reference Fernández-García1998, Janss and Ferrer Reference Janss and Ferrer1998).
Technical characteristics of the three power line types considered.

To estimate the risk of collision of each particular power line span, the probabilities obtained by models resulting from the two spatial approaches were multiplied together.
To estimate the territorial risk of collision ascribed to different power line types, we summed each span’s risk of collision for a determinate type within the 95%, 80% and 50% kernel areas of an individual bird. Kernel areas are not considered mutually exclusive, so the 95% kernel also includes the 80% and the 50% areas. When we had data for two individuals in the same territory we calculated the sum of the spans’ risk of collision and then obtained the average.
To estimate territorial turnover rates, during 1990–2008 the studied territories of Bonelli’s Eagle were checked at the start of every breeding season for the presence of breeders and age estimation of breeding individuals based on plumage characteristics (Forsman Reference Forsman1999). The turnover rate was computed for each territory as the total number of birds that either disappeared from that territory from one year to the next or were replaced by a bird of another age in relation to the total number of individuals and years considered (Real and Mañosa Reference Real and Mañosa1997, Carrete et al. Reference Carrete, Sánchez-Zapata, Martínez, Sánchez and Calvo2002). We excluded from the computation of turnover rate any eagles found dead in which the cause of death was not attributable to power lines.
Finally, we used Spearman’s rank correlation coefficient to analyse whether the territorial collision risk ascribed to different power line types was correlated with territorial turnover rates. Sequential Bonferroni adjustment for multiple test comparisons were conducted adopting a global experimentwise error of 0.1 (Rice Reference Rice1989, Chandler Reference Chandler1995). Data analyses were run using SPSS v. 14.0 for Windows.
Results
Flight height
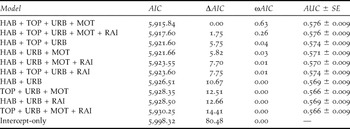
Given the data and set of candidate models to explain flight height, no single model clearly outperformed all others (Table 2) and so an average model was obtained (Table 3).
Logistic regression models for territorial eagles flying at the critical height level for colliding (n = 4,454). Models are ranked from best to worst according to ΔAIC. We only show here the best ten of the 32 models (plus the intercept-only model) in order to make the table more manageable. AUC is the area under ROC curve and SE is the standard error. HAB: habitat; TOP: topographic position; URB: presence of urban areas within a 500 m radius; MOT: presence of motorways or dual carriageways within a 500 m radius; RAI: presence of railways within a 500 m radius.
Average logistic regression model for territorial eagles flying at the critical height level for colliding (n = 4,454). N is the sample size for a particular parameter category. HAB: habitat; TOP: topographic position; URB: presence of urban areas within a 500 m radius; MOT: presence of motorways or dual carriageways within a 500 m radius; RAI: presence of railways within a 500 m radius.

Only URB, HAB and MOT had a clear effect on eagles’ flight height, since all their coefficient estimates were higher than 1.96*SE for a 95% confidence level (Table 3). The presence of urban areas nearby (URB) appeared to be associated with a reduction of 0.529 times in the probability of an eagle flying at a critical height (Table 3; Figure 2). This probability varied according to habitat types (HAB), which was respectively 1.469, 1.427 and 1.275 times higher in cliffs, farmland or grassland, and scrubland than in forest (Table 3; Figure 2). No flights were detected in urban areas and so this habitat category was not considered. The presence of motorways nearby (MOT) appeared to be associated with an increase of 1.519 times in the probability of an eagle flying at the critical height (Table 3; Figure 2).
Percentage of radio-tracking flight locations (n = 4,454) at a low critical height for colliding with power lines (black bars) and at a higher height (white bars) according to average model (Table 2). HAB: habitat; TOP: topographic position; URB: presence of urban areas within a 500 m radius; MOT: presence of motorways or dual carriageways within a 500 m radius; RAI: presence of railways within a 500 m radius.

The parameters topographic categories (TOP) and presence of nearby railways (RAI) did not have a clear effect on eagles’ flight height, since all their coefficient estimates were not higher than 1.96*SE for a 95% confidence level (Table 3).
In spite of most of the parameters having a clear effect on eagles’ flight height, the AUC value for the average model (Table 3) indicated poor discriminatory ability (0.576 ± 0.009).
Span crossings
Given the data and set of candidate models, no single plausible model explained the crossings by eagles of the randomly created segment samples (Table 4). Thus, we performed an average model (Table 5) that showed crossings were mainly determined by home range use (HRU). Indeed, we noticed that models not including home range use (HRU) strongly increased the AIC value up to 11,979.78 and the AUC value dropped to 0.627 ± 0.006. However, models not including HRU strongly decreased the AIC value compared to the only-intercept model, and they still had a considerable discriminatory ability, indicating the importance of other parameters than HRU to explain the crossings by eagles of the randomly created segment samples.
Logistic regression models for random segment samples (n = 9,000) crossed by eagles’ flights. Models are ranked from best to worst according to ΔAIC. We only show here the best 10 of the 63 models (plus the intercept-only model) in order to make the table more manageable. AUC is the area under ROC curve and SE is the standard error. HRU: eagle home range use; HAB: habitat; TOP: topographic position; URB: presence of urban areas within a 500 m radius; MOT: presence of motorways or dual carriageways within a 500 m radius; RAI: presence of railways within a 500 m radius.

Average logistic regression model for random segment samples (n = 9,000) crossed by eagles’ flights. N is the sample size for a particular parameter category. HRU: eagle home range use; HAB: habitat; TOP: topographic position; URB: presence of urban areas within a 500 m radius; MOT: presence of motorways or dual carriageways within a 500 m radius; RAI: presence of railways within a 500 m radius.

Only HRU, the presence nearby of urban areas (URB) and railways (RAI) had a clear effect on crossings by eagles of the randomly created segment samples, since all their coefficient estimates were higher than 1.96*SE for a 95% confidence level (Table 5). With regard to HRU, segments placed within the 80% and 95% kernel areas and the MCP turned out to be respectively 0.422, 0.114 and 0.032 times less likely to be crossed than those within the 50% kernel area (Table 5; Figure 3). URB and RAI appeared to be associated with a reduction of 0.806 and 0.650 times in the probability of crossings (Table 5; Figure 3).
Expected percentage of power line spans crossed by eagles according to average model (Table 4; black bars) compared to observed percentage crossed by eagles during the radio-tracking period (white bars). HRU: eagle home range use; HAB: habitat; TOP: topographic position; URB: presence of urban areas within a 500 m radius; MOT: presence of motorways or dual carriageways within a 500 m radius; RAI: presence of railways within a 500 m radius.

Habitat (HAB) appeared to have a strong relative contribution to the average model, as this parameter was always included in the best models for random segment samples crossed by eagles (Table 4). Nevertheless, only scrubland had a clear effect on crossings by eagles of the randomly created segment samples, since the coefficient estimate for scrubland was higher than 1.96*SE for a 95% confidence level, and segments placed in scrubland are 1.138 times more likely to be crossed than if placed in forest (Table 5). Despite this, habitat categories could be ranked according to an increasing probability of crossings (Table 5): cliffs, forest, urban areas, farmland or grassland, and scrubland, although the calibration of the agreement between predicted and observed percentages of occurrence was not good for urban areas or cliffs (Figure 3).
The presence nearby of motorways (MOT) and topography (TOP) did not have a clear effect on crossings by eagles of the randomly created segment samples, since all their coefficient estimates were lower than 1.96*SE for a 95% confidence level (Table 5).
The AUC value for the average model obtained by means of random segment samples (Table 5) was 0.806 ± 0.005 and 0.762 ± 0.007 when applying logistic regression equations to real power line spans, results that reveal in both cases the good discrimination ability of the model. Accordingly, the expected percentage of power line spans crossed by eagles according to the average model (Table 5) fits the observed percentage crossed by eagles during the radio-tracking period, thereby validating the model in all cases except for habitat categories urban areas and cliffs (Figure 3).
Territorial collision risk and turnover rates
Territorial turnover rates appear to be correlated mainly with the collision risk ascribed to transmission lines with earth wires (type 1) and a combination of transmission lines and double circuit distribution lines (types 1 and 2), above all in the areas most used by eagles (Table 6). Taking into account a sequential Bonferroni adjustment, only a combination of transmission lines (with or without earth wires) and double circuit distribution lines (types 1 and 2) in the 50% kernel appear significantly correlated with the turnover rate. Single circuit distribution lines (type 3) are not correlated with turnover rate.
Spearman rank correlation coefficient (r s) between power line types collision risk (CR) and turnover rates for period 1990–2008 in 15 Bonelli’s Eagle territories. *indicates statistical significance according to sequential Bonferroni adjustment.

Discussion
Bonelli’s Eagle lives in Mediterranean landscapes (Del Hoyo et al. Reference Del Hoyo, Elliott and Sargatal1994, Muñoz et al. Reference Muñoz, Real, Márcia and Vargas2005) subject to high human pressure that contain several types of linear infrastructure (e.g. power lines) that may lead to fatal casualties in birds. Collision with power lines is known to be the third highest cause of mortality for this species and so knowledge of the factors involved is crucial when implementing conservation actions (Mañosa and Real Reference Mañosa and Real2001). The probability of a bird colliding with wires depends on its behaviour at two spatial scales: its flight height and the flight lanes that it potentially uses to cross linear infrastructure such as power lines, aspects that may be determined by a number of different environmental and biological factors (Bevanger Reference Bevanger1994, McLeod et al. Reference McLeod, Whitfield and McGrady2002a,Reference McLeod, Whitfield, Fielding, Haworth and McGradyb, Madders and Whitfield Reference Madders and Whitfield2006).
Our results show that the most important determining factor in Bonelli’s Eagle collisions with power lines is the species’s home range use. As seen in Figure 1, flight frequencies sharply decline from the most-used areas to the least-used (kernels 50%, 80% and 95%, and outside the kernel 95% but within the MCP). Thus, power lines placed in the most-used areas present higher flight frequencies, a finding that is associated with collision risk (Alonso et al. Reference Alonso, Alonso and Muñoz-Pulido1994, Alonso and Alonso Reference Alonso, Alonso, Ferrer and Janss1999, Janss Reference Janss2000) that was reduced in kernel 80%, kernel 95% and MCP respectively to 0.421, 0.114 and 0.032 times in comparison to risk associated to the 50% kernel area. The eccentricity of some individual home ranges reflects flight lanes between foraging and breeding or roosting areas (Figure 1) (Bevanger Reference Bevanger1994, Bosch et al. Reference Bosch, Real, Tintó, Zozaya and Castell2010). Consequently, some spans placed quite close to the nest may never be crossed by eagles, whereas more distant spans may have a higher collision risk if they are located directly along these flight lanes.
Our study also shows that eagles fly preferentially and at a lower height over open habitats (shrublands, farmlands and grasslands) in comparison to forested habitats (see also Carrete et al. Reference Carrete, Sánchez-Zapata, Martínez, Sánchez and Calvo2002). According to our models, the risk of collision with a particular span placed in scrubland could be 1.451 times higher than if placed in forest, or 1.532 times higher when placed in farmlands or grasslands than if placed in forest. These open areas are known to be the most frequently used foraging habitats by eagles and correspond with habitats preferred by European Rabbit Oryctolagus cuniculus, Red-legged Partridge Alectoris rufa and other species considered as important prey items for Bonelli’s Eagle within the study area (Real Reference Real1991, Arroyo et al. Reference Arroyo, Ferreiro, Garza, Chancellor, Meyburg and Ferrero1998; Rico-Alcázar et al. Reference Rico-Alcázar, Martínez, Morán, Navarro and Rico2001, Moleón et al. Reference Moleón, Sánchez-Zapata, Real, García-Charton, Gil-Sánchez, Palma, Bautista and Bayle2009). Open habitats also favour prey detection and predator hunting success (Ontiveros et al. Reference Ontiveros, Pleguezuelos and Caro2005) and allow birds to fly at a lower height (Bevanger Reference Bevanger1994). Eagles also fly at a lower height over cliffs, used by eagles for breeding, roosting and soaring on updrafts created by these discontinuities in the landscape, so their dominant and more elevated situation in their territories could be the reason why eagles usually do not tend to exceed their altitude (Ontiveros Reference Ontiveros1999, Rico-Alcázar et al. Reference Rico-Alcázar, Martínez, Morán, Navarro and Rico2001, Muñoz et al. Reference Muñoz, Real, Márcia and Vargas2005, López-López et al. Reference López-López, García-Ripollés, Aguilar, García-López and Verdejo2006). The same reason might explain why eagles do not appear to often fly over cliffs, since they generally fly from these dominant spots down to the lower areas they use for foraging. Therefore, power lines crossing open hunting habitats and cliffs should be considered as having a high collision risk. On the other hand, other factors might interfere with predictions on flight height, such as weather conditions, season and time of day (Bevanger Reference Bevanger1994), as Bonelli’s Eagle depend on thermal updrafts for soaring due to the low aspect ratio of their wings (Parellada et al. Reference Parellada, De Juan and Alemany1984).
Power lines located near urban areas were 0.806 times less crossed and, when this occurred, the probability of birds flying at a low height was reduced to 0.529, in accordance with the high sensitivity to human presence known for this species, as is known for human disturbances near nests (Ontiveros Reference Ontiveros1999, Gil-Sánchez et al. Reference Gil-Sánchez, Moleón, Otero and Bautista2004, López-López et al. Reference López-López, García-Ripollés, Aguilar, García-López and Verdejo2006). The effect of other factors related to human disturbance on eagles’ flight behaviour are not so clear and therefore should not be used to predict the risk of collision with power lines. Nevertheless, placing power lines near railways also seems to reduce the risk of collision, although not to the same extent as urban areas, probably because railways are merely a non-continuous disturbance in comparison to human presence near urban areas. On the other hand, it is surprising that eagles seem to fly at a lower height (1.519 times) near motorways and dual carriageways. Bautista et al. (Reference Bautista, Calmaestra, Viñuela, Hiraldo and Ferrer2001) suggest that some raptors may hunt near motorways, especially if rabbit densities are particularly high along edges, due probably to reduced human hunting pressure, good microhabitats and the availability of optimal soil in which to build warrens.
Our study shows that topographic position is not a determining factor in predicting the risk of collision with power lines, although there is a slight tendency for eagles to fly at a lower height over ridges. This could be a consequence of the location of ridges near nests, in crossing passes or in open rocky areas used for foraging or soaring on updrafts (Fa et al. Reference Fa, Sharples and Bell1999, Gortázar et al. Reference Gortázar, Villafuerte, Escudero and Marco2002, Virgós et al. Reference Virgós, Cabezas-Díaz, Malo, Lozano and López-Huertas2003, Martí and Del Moral Reference Martí and Del Moral2003, Calvete et al. Reference Calvete, Estrada, Angulo and Cabezas-Ruiz2004). In this sense, McLeod et al. (Reference McLeod, Whitfield, Fielding, Haworth and McGrady2002b) reported a clear preference of Golden Eagles Aquila chrysaetos for flying over ridges.
Territorial turnover rates appeared correlated mainly with the risk of collision ascribed to transmission lines with earth wires, which indicates that these might cause the death of Bonelli’s Eagles by collision. This kind of line with a large number of conductors, presence of undetectable earth wires and high tower heights are also reported to cause the most collision casualties for other bird species (Alonso et al. Reference Alonso, Alonso and Muñoz-Pulido1994, Bevanger Reference Bevanger1994, Fernández-García Reference Fernández-García1998, Janss and Ferrer Reference Janss and Ferrer1998, Bevanger Reference Bevanger, Ferrer and Janss1999, Bevanger and Brøseth Reference Bevanger and Brøseth2001, Reference Bevanger and Brøseth2004, Garrido and Fernández-Cruz Reference Garrido and Fernández-Cruz2003). This correlation was more significant when power lines of this type were located in the areas most frequently used by eagles, suggesting that most collisions involving territorial eagles may occur along flight lanes between foraging and breeding or roosting areas (Bevanger Reference Bevanger1994), above all near nests, as found by Mañosa and Real (Reference Mañosa and Real2001). In addition, the presence of transmission lines without earth wires or double circuit distribution lines in the 50% kernel area increases the correlation with turnover rates, which may indicate that power lines with a large number of conductors and tall towers (even if they have no earth wires) are also associated with eagle collisions. In these cases, it would be preferable to avoid constructing new power lines in the areas most frequently used by eagles, as bad weather would reduce the ability of birds to cope with connectors even if they are clearly detectable (Bevanger Reference Bevanger1994).
Single circuit distribution lines, however, were not correlated with turnover rates, probably because this kind of line is mainly involved in electrocutions and these casualties occur on a small percentage of poles with a specific technical design and surrounding habitat combinations (Ferrer et al. Reference Ferrer, De La Riva and Castroviejo1991, Janss and Ferrer Reference Janss and Ferrer1999, Reference Janss and Ferrer2001, Mañosa Reference Mañosa2001, APLIC 2006, Lehman et al. Reference Lehman, Kennedy and Savidge2007). Moreover, of the seven dead birds found by radio-tracking, two (28.6%) were electrocuted, one (14.3%) collided with power lines and four (57.1%) died from other causes (including one collision with a single wire fence). This suggests that collision might be underestimated in relation to electrocution, since distribution lines are intensively monitored (Mañosa and Real Reference Mañosa and Real2001, Real et al. Reference Real, Grande, Mañosa and Sánchez-Zapata2001) and electrocuted birds are easily detected under the distribution poles, whereas birds involved in collisions are difficult to detect, due to the rugged terrain with thick vegetation usually found under the spans (Bevanger Reference Bevanger1998, Alonso and Alonso Reference Alonso, Alonso, Ferrer and Janss1999, Bevanger Reference Bevanger, Ferrer and Janss1999). Therefore, collision might play an important role in the conservation of this species (Real and Mañosa Reference Real and Mañosa1997, Real et al. Reference Real, Grande, Mañosa and Sánchez-Zapata2001).
Conservation implications
Models of flight behaviour and home range use can be useful tools for predicting the risk of collision in a particular bird species, as in the case of models developed for wind farms (McLeod et al. Reference McLeod, Whitfield and McGrady2002a,Reference McLeod, Whitfield, Fielding, Haworth and McGradyb, Madders and Whitfield Reference Madders and Whitfield2006). In this sense, telemetry techniques allow kernel areas to be obtained, which properly correspond to flight frequencies (and consequently to the risk of collision) rather than fixed radii around the nest, so the first approach is preferred for implementing adequate conservation measures (Bosch et al. Reference Bosch, Real, Tintó, Zozaya and Castell2010). Predictive models could be used not only for careful route planning, the most effective way to minimise collisions (Bevanger Reference Bevanger1994), but also for implementing measures such as wire marking, especially on transmission lines with earth wires, aimed at mitigating the risk of collision. Thus, according to our model, the most dangerous spans for Bonelli’s Eagle collision are those situated in the areas more frequently used by eagles, that is, breeding and roosting areas (cliffs) and open hunting habitats (scrubland, farmland and grassland) far away from the human disturbance of urban areas, and along the flight lanes between foraging and breeding or roosting areas.
On the other hand, telemetry would also enable the recovery of corpses for an unbiased estimate of the overall importance of collision as a cause of death (Heisey and Fuller Reference Heisey and Fuller1985, González et al. Reference González, Margalida, Mañosa, Sánchez, Oria, Molina, Aranda, Caldera and Prada2007, Margalida et al. Reference Margalida, Heredia, Razin and Hernández2008). In addition, the success of implemented measures could be evaluated by comparing the territorial turnover rates before and after implementation or by comparing the turnover rates of territories with and without implemented measures.
Acknowledgements
Radio and satellite tracking of birds was supported by the project SITXELL (2001–2006) of the Àrea d’Espais Naturals of the Diputació de Barcelona, and the research project CGL2004-03189 of the Subdirección General de Proyectos de Investigación of the Ministry of Education and Science of the Spanish Government. We are indebted to Red Eléctrica de España, S.A. (REE), who gave financial support for this study, and especially to Jorge Roig, Mercedes Gil, Roberto Arranz, Diego Fernández and Javier Moreno. We also wish to thank Victor García Matarranz from the Ministerio de Medio Ambiente for his technical support in capturing and tagging eagles with terrestrial or GPS satellite transmitters, and to Francesc Parés for carrying out fieldwork. The long-term monitoring of the Bonelli’s Eagle population in Catalonia was sponsored by Fundació Miquel Torres. The electricity companies REE and FECSA-ENDESA provided information about power lines.



