


1. Introduction
The Pan-African Dahomeyide belt occupying the southeastern margin of the West African Craton records a complete orogenic cycle during the Cryogenian-Ediacaran period and consists of features, including basement complex, passive margin, oceanic terrane and active margin (arc-crust and post-collisional basins) (Figure 1(a) and (b); Attoh and Nude, Reference Attoh and Nude2008; Attoh et al. Reference Attoh, Samson, Agbossoumondé, Nude and Morgan2013; Aidoo et al. Reference Aidoo, Nude, Sun, Liang and Zhang2021; Kwayisi et al. Reference Kwayisi, Elburg and Lehmann2022 a). The Dahomeyide belt forms the central segment of the West Gondwana Orogen (inset Figure 1(a)) and formed during the subduction-collision phases of the Pan-African orogeny (Attoh and Nude, Reference Attoh and Nude2008; Guillot et al. Reference Guillot, Agbossoumondé, Bascou, Berger, Duclaux, Hilairet, Ménot and Schwartz2019; Aidoo et al. Reference Aidoo, Nude, Sun, Liang and Zhang2021). Based on lithology and tectonics, this belt has been divided into an internal nappes zone, suture zone and external nappes zones (Duclaux et al. Reference Duclaux, Ménot, Guillot, Agbossoumondé and Hilairet2006; Attoh and Nude, Reference Attoh and Nude2008; Kwayisi et al. Reference Kwayisi, Lehmann and Elburg2020). In a plate tectonic scenario, the upper and lower plates of the Dahomeyide belt are represented by the internal and external nappes zones, respectively (Figure 1(c)), and separated by a well-defined suture zone of ultrahigh pressure-high pressure eclogite and granulite rocks (Figure 1(b) and (c); Attoh and Morgan, Reference Attoh and Morgan2004; Attoh and Nude, Reference Attoh and Nude2008). The internal nappes zone (Figure 1(b) and (c)) corresponds to the active margin of the Dahomeyide belt that recorded arc-related and post-collisional magmatism and intracontinental extensional volcanism and sedimentation during the Pan-African orogeny (Kalsbeek et al. Reference Kalsbeek, Affaton, Ekwueme, Frei and Thrane2012; Attoh et al. Reference Attoh, Samson, Agbossoumondé, Nude and Morgan2013; Ganade de Araujo et al. Reference Ganade de Araujo, Cordani, Agbossoumounde, Caby, Basei, Weinberg and Sato2016). The internal nappes zone is made up of granitoids and supracrustal rocks formed due to the east-dipping subduction and continent-continent collision between the West African Craton and the Benin-Nigerian Shield (BNS) and extensional-related volcanic and sedimentary rocks formed after collision (e.g., Attoh and Nude Reference Attoh and Nude2008; Attoh et al. Reference Attoh, Samson, Agbossoumondé, Nude and Morgan2013; Ganade de Araujo et al. Reference Ganade de Araujo, Cordani, Agbossoumounde, Caby, Basei, Weinberg and Sato2016; Guillot et al. Reference Guillot, Agbossoumondé, Bascou, Berger, Duclaux, Hilairet, Ménot and Schwartz2019). The granitoids constitute the bulk of the internal nappes zone, with the supracrustal and extensional-related rocks being only minor (Kalsbeek et al. Reference Kalsbeek, Affaton, Ekwueme, Frei and Thrane2012; Attoh et al. Reference Attoh, Samson, Agbossoumondé, Nude and Morgan2013; Ganade de Araujo et al. Reference Ganade de Araujo, Cordani, Agbossoumounde, Caby, Basei, Weinberg and Sato2016).
(a) Schematic geological map of the West African Craton (insert is the map of West Gondwana Orogen; after Ganade de Araujo et al. Reference Ganade de Araujo, Cordani, Agbossoumounde, Caby, Basei, Weinberg and Sato2016), (b) Geological map of Dahomeyide belt (modified after Kwayisi et al. Reference Kwayisi, Lehmann and Elburg2022 b), (c) Cross-section of the Dahomeyide belt, showing the lower plate (i.e., external nappes zone, to the west), upper plate (internal nappes zone (Active margin), to the east), separated by the suture zone (modified after Guillot et al. Reference Guillot, Agbossoumondé, Bascou, Berger, Duclaux, Hilairet, Ménot and Schwartz2019).

Two major types of granitoids occur in the internal nappes zone of the Dahomeyide belt. (i) migmatites, and (ii) gneisses (Table 1: Attoh et al. Reference Attoh, Samson, Agbossoumondé, Nude and Morgan2013) intruded by granites and granodiorites (Kalsbeek et al. Reference Kalsbeek, Affaton, Ekwueme, Frei and Thrane2012; Attoh et al. Reference Attoh, Samson, Agbossoumondé, Nude and Morgan2013). Kalsbeek et al. (Reference Kalsbeek, Affaton, Ekwueme, Frei and Thrane2012) obtained U-Pb zircon ages of 547 ± 15 Ma and 666 – 592 Ma for the intrusive granitoids and the migmatites, respectively. Similarly, U-Pb ages of 620 – 589 Ma have been obtained for the migmatites by Attoh et al. (Reference Attoh, Samson, Agbossoumondé, Nude and Morgan2013). The 589 – 547 Ma age corresponds to post-collisional magmatism, with the 666 – 620 Ma corresponding to arc-related magmatism (Kalsbeek et al. Reference Kalsbeek, Affaton, Ekwueme, Frei and Thrane2012; Attoh et al. Reference Attoh, Samson, Agbossoumondé, Nude and Morgan2013; Ganade de Araujo et al. Reference Ganade de Araujo, Cordani, Agbossoumounde, Caby, Basei, Weinberg and Sato2016). These ages suggest an approximately 100 Ma span of arc-related and post-collisional magmatism during the Pan-African orogeny between Mid-Cryogenian at 670 and late Ediacaran at 540 Ma (Kalsbeek et al. Reference Kalsbeek, Affaton, Ekwueme, Frei and Thrane2012).
Compiled lithological, metamorphic, P-T, age and tectonic data on the internal nappes zone of the Dahomeyide belt

* Attoh et al. (Reference Attoh, Samson, Agbossoumondé, Nude and Morgan2013).
† Ganade de Araujo et al. (Reference Ganade de Araujo, Cordani, Agbossoumounde, Caby, Basei, Weinberg and Sato2016).
‡ Nude (Reference Nude1995).
§ Kalsbeek et al. (Reference Kalsbeek, Affaton, Ekwueme, Frei and Thrane2012).
∥ Kalsbeek et al. (Reference Kalsbeek, Frei, Schersten, Frei, Gerdes and Kalvig2020).
Very little is known about the structural evolution of the granitoids of the internal nappes zone (i.e., active margin) of the Dahomeyide belt in Ghana. Hence, it becomes difficult to interpret the tectonic evolution of these units in relation to the Pan-African orogeny. However, elsewhere in the Parakou-Nikki region of northern Benin, five deformational phases have been interpreted and linked to various stages of the Pan-African orogeny (Chala et al. Reference Chala, Tairou, Wenmenga, Kwékam, Affaton, Kalsbeek, Tossa and Houéto2015). This work, therefore, seeks to shed light on the structural evolution by integrating field, geophysical and structural data of the Dahomeyide internal nappes zone and examine their significance in the overall crustal growth and evolution of the Dahomeyide belt and implications to the Pan-African orogeny. Besides, there is no petrographical and geochemical data on the post-collisional granitoids to constrain their source, tectonic setting and petrogenetic evolution. Hence, the major and trace element concentration of the post-collisional granitoids and also new geochemical data of the arc-related granitoids (i.e., the gneisses and migmatites) are presented to infer their source, tectonic setting and petrogenetic evolution.
2. Geological setting
The internal nappes zone (i.e., active margin) of the Pan-African Dahomeyide belt represents the south-western portion of the Benin-Nigerian Shield, which is the south-western limit of the Saharan metacraton (Figure 1(a); Abdelsalam et al. Reference Abdelsalam, Liégeois and Stern2002; Chala et al. Reference Chala, Tairou, Wenmenga, Kwékam, Affaton, Kalsbeek, Tossa and Houéto2015). The other zones of the Pan-African Dahomeyide belt are the external and the suture zones (Guillot et al. Reference Guillot, Agbossoumondé, Bascou, Berger, Duclaux, Hilairet, Ménot and Schwartz2019; Kwayisi et al. 2020; 2022b). The external nappes zone represents the lower plate, whereas the internal nappes zone is the upper plate of the Pan-African Dahomeyide belt. The suture zone is the vestiges of the Pharusian oceanic crust, formed during the Pan-African oceanic accretionary phase (Duclaux et al., Reference Duclaux, Ménot, Guillot, Agbossoumondé and Hilairet2006; Attoh and Morgan, Reference Attoh and Morgan2004; Agbossoumondé et al. Reference Agbossoumondé, Ménot and de Araujo2017; Kwayisi et al. Reference Kwayisi, Elburg and Lehmann2022 a). The internal nappes zone occurs to the immediate east of the suture zone, where they are separated by tectonic contacts (Figure 1(b)). The internal nappes zone is made up of a complex of meta-granitoid basement, underlying volcano-sedimentary Neoproterozoic supracrustals, and invaded by several generations of arc-related Pan-African and post-collisional granitoids (Table 1; Figure 1(b); Affaton et al. Reference Affaton, Rahaman, Trompette, Sougy, Dallmeyer and Lécorché1991; Attoh et al. Reference Attoh, Samson, Agbossoumondé, Nude and Morgan2013; Ganade de Araujo et al. Reference Ganade de Araujo, Cordani, Agbossoumounde, Caby, Basei, Weinberg and Sato2016). Attoh et al. (Reference Attoh, Samson, Agbossoumondé, Nude and Morgan2013) subdivided the meta-granitoid basement of the internal nappes zone into two, namely dioritic gneiss, characterized by hornblende as the main mafic mineral and occasional garnet and migmatite with biotite as the dominant mafic mineral (Table 1). U-Pb zircon ages of 666 – 620 Ma corresponding to arc-related magmatism have been obtained for the migmatites (Figure 1(b); Kalsbeek et al. Reference Kalsbeek, Affaton, Ekwueme, Frei and Thrane2012; Attoh et al. Reference Attoh, Samson, Agbossoumondé, Nude and Morgan2013; Ganade de Araujo et al. Reference Ganade de Araujo, Cordani, Agbossoumounde, Caby, Basei, Weinberg and Sato2016). The migmatites have been postulated as juvenile crust representing the arc terrane that formed due to subduction and oceanic closure during the Pan-African orogeny (Attoh et al. Reference Attoh, Samson, Agbossoumondé, Nude and Morgan2013). However, older U-Pb zircon crystallization ages ranging from 2.14 to 2.19 Ga were recorded for the dioritic gneisses (Attoh et al. Reference Attoh, Samson, Agbossoumondé, Nude and Morgan2013). The Paleoproterozoic ages signify the involvement of older crust (Saharan Metacraton), representing the basement of the Benin-Nigerian Shield, in the Pan-African Dahomeyide belt (Duclaux et al. Reference Duclaux, Ménot, Guillot, Agbossoumondé and Hilairet2006; Attoh et al. Reference Attoh, Samson, Agbossoumondé, Nude and Morgan2013). The migmatites are intruded by post-collisional granitoids dated at 589 – 547 Ma, corresponding to post-collisional magmatism (Kalsbeek et al. Reference Kalsbeek, Affaton, Ekwueme, Frei and Thrane2012; Attoh et al. Reference Attoh, Samson, Agbossoumondé, Nude and Morgan2013).
3. Field relations and petrography
Field observations and petrographical investigations reveal that two main lithological units dominate the internal nappes zone of southeastern Ghana. These are (i) deformed meta-granitoids made up of migmatites and gneisses and (ii) undeformed granitoids, herein referred to as intrusive granitoids composed dominantly of granite and minor granodiorite. Amphibolite, pegmatite, aplite and quartz veins also occur. Figure 2 is a geological map of southeastern Ghana, showing the extent and distribution of the rocks in the study area. The deformed meta-granitoids dominate over the intrusive granitoids in terms of volume. Widespread in the internal nappes zone are the migmatites (Figure 2).
Geological map of southeast Ghana showing the lithological distribution and structural relationships of the rocks of the study area. Insert are the pole to plane plots of the S1, S2 and S3 foliations.

In general, the migmatite consists of alternating leucosomes and melanosomes, thus representing typical stromatic migmatite (Figure 3(a)). The migmatite is coarse-grained and contains microcline (45%), quartz (30%), plagioclase (15%), biotite (7%), muscovite (2%) and garnet (1%), with epidote, titanite, zircon and rutile as accessory minerals. This rock shows micro-folds defined by bent quartz grains (Figure 3(b)). Myrmekites of K-feldspar in plagioclase are present as small spots disseminated in some plagioclases or invading K-feldspar and plagioclase from their margins (Figure 3(c)). The gneisses are made up of felsic augen, biotite and hornblende-biotite gneisses. The felsic augen gneiss shows coarse-grained augen feldspars in a porphyroblastic texture (Figure 3(d)). Generally, the rock appears light grey with a porphyroblastic and myrmekite texture. It consists of quartz (30%), plagioclase (25%), orthoclase (15%), microcline (15%), biotite (12%), hornblende (2%) and sericite (1%) in a preferred orientation (Figure 3(e)). The porphyroblasts are essentially orthoclase. In contrast, biotite occurs as interstitial or inclusions in orthoclase. Inclusions of quartz occur in the microcline and orthoclase, while sericite occurs as inclusions or secondary minerals in the plagioclase and microcline. The biotite gneiss (Figure 3(f)) has a coarse-grain texture and well-defined foliations. This rock consists of quartz (40%), microcline (25%), plagioclase (20%), biotite (10%), muscovite (4%), sericite (1%) and accessory phases, including titanite, zircon and garnet (Figure 3(g)). Garnet contains inclusions of quartz and micro-fractures, filled with elongate biotite. The hornblende-biotite gneiss has a coarse-grain texture and a pale ash-grey colour (Figure 3(h)). It consists of plagioclase (33%), quartz (20%), orthoclase (20%), biotite (15%), hornblende (5%), microcline (3%), garnet (2%) and calcite (1%) with accessory muscovite and epidote (Figure 3(i)). Inclusions of quartz and muscovite occur in the plagioclase.
Field photos and photomicrographs of the gneisses and migmatite of the internal nappes zone (a) Migmatite consists of alternating leucosomes and melanosomes, thus representing typical stromatic migmatite, (b) Migmatite showing micro-folds defined by bent quartz grains (crossed polars), (c) Myrmekite texture invading microcline and plagioclase at their margins, (d) Felsic augen gneiss with coarse-grained augen feldspars (crossed polars), (e) Foliation in the felsic augen gneiss defined by elongated quartz and biotite (crossed polars), (f) Biotite gneiss with phaneritic texture and well-defined foliations, (g) Foliation in biotite gneiss defined by biotite minerals (crossed polars), (h) Hornblende-biotite gneiss and (i) Hornblende-biotite gneiss with coarse hornblende minerals (crossed polars). Bt = biotite, Grt = garnet, Hbl = hornblende, Mc = microcline, Or = orthoclase, Pl = plagioclase, Qz = quartz. Mineral abbreviation is from Whitney and Evans (Reference Whitney and Evans2010).

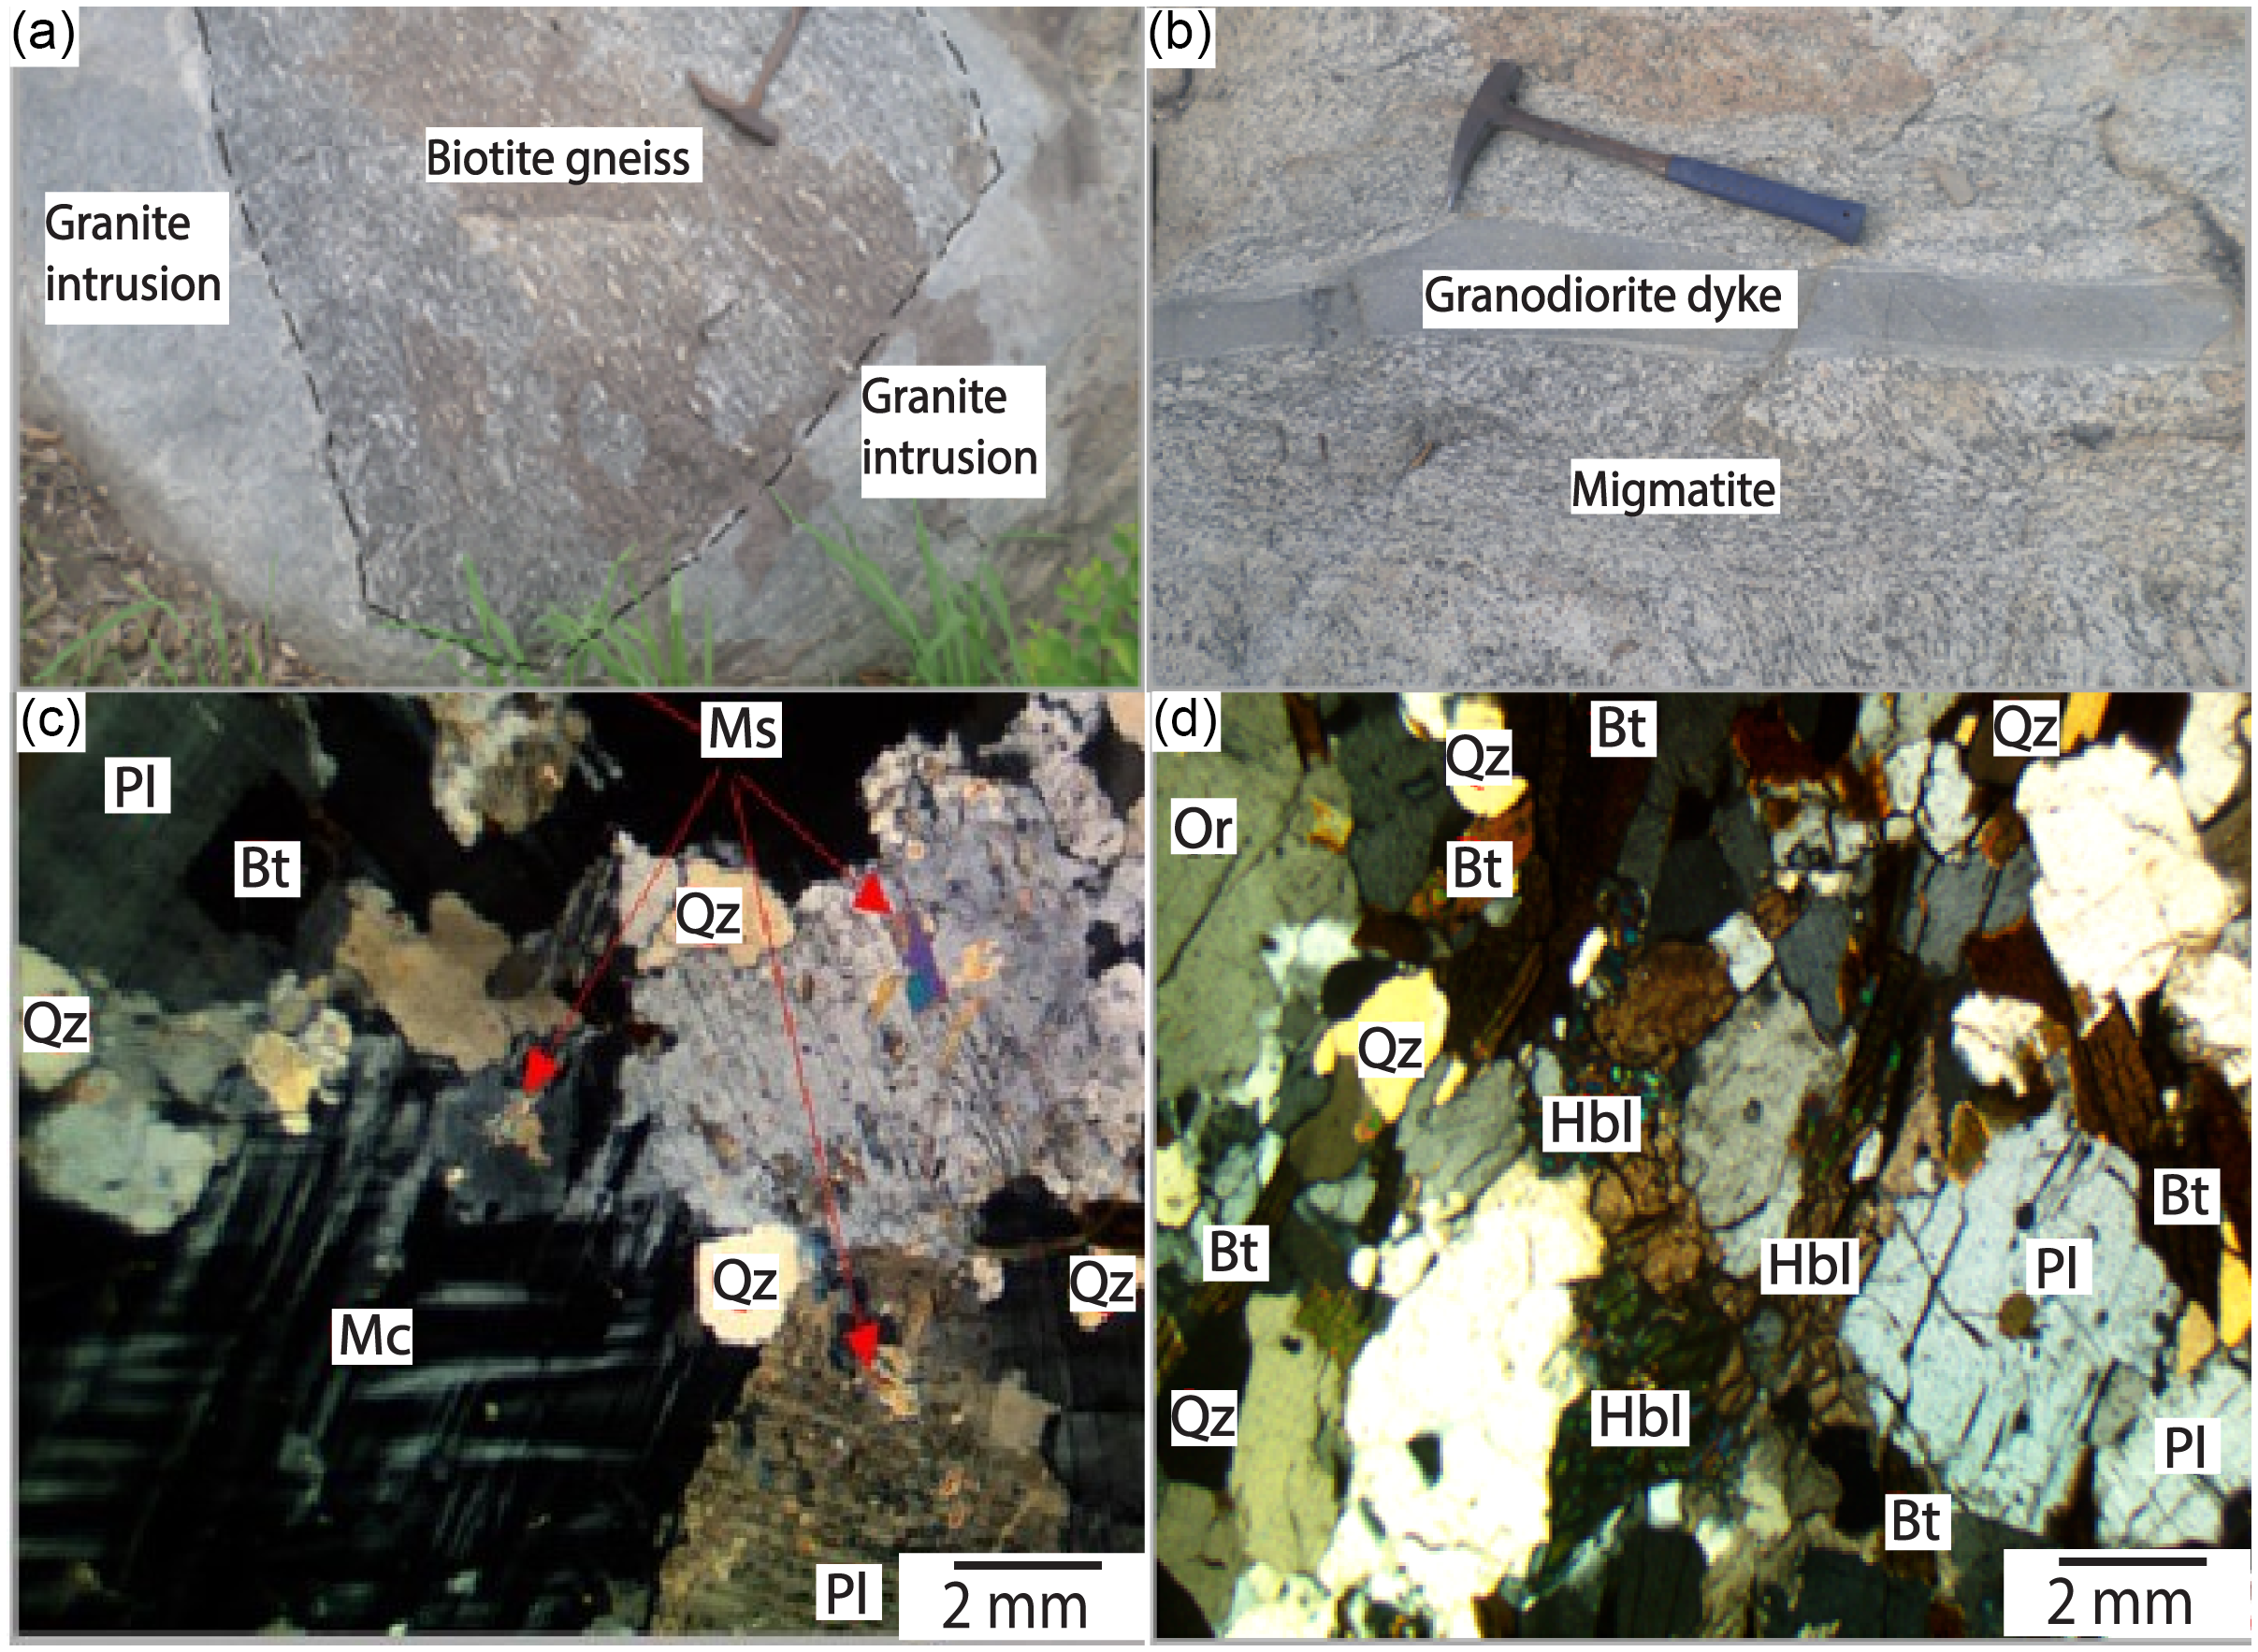
Within the internal nappes zone, but distinctly different from the typical deformed migmatites and gneisses, are intrusive bodies of granitic and granodioritic rocks (intrusive granitoids) with sharp lithological boundaries with the migmatites and gneisses (Figures 4(a) and (b)). They are distinguished by being typically undeformed or only weakly deformed. The granite occurs as large and massive bodies within the biotite gneiss (Figure 4(a)), whereas the granodiorite occurs as a dyke within the migmatite and felsic augen gneiss, generally oriented north-south and discordant to the general foliations of the host rock (Figure 4(b)). The granite (Figure 4(c)) is leucocratic, characterized by phaneritic texture, and consists of microcline (45%), quartz (25%), plagioclase (20%), biotite (6%), muscovite (2%), sericite (2%), epidote (1%) and garnet occurring as accessory minerals. Micro-fractures occur in the quartz, biotite inclusions in the microcline and quartz in plagioclase. Muscovite and sericite are secondary minerals derived from the alteration of feldspars. The granodiorite is medium to coarse-grained with characteristic myrmekitic textures. It consists of quartz (30%), plagioclase (25%), biotite (15%), orthoclase (12%), hornblende (12%), calcite (4%) and microcline (2%) (Figure 4(d)). Some of the quartz grains occur as minor fine inclusions in the plagioclase, hornblende and biotite.
Field photos and photomicrographs of the intrusive bodies of the internal nappes zone. (a) Large intrusion of granite bodies into the biotite gneiss, (b) Dykes of granodiorite within the migmatite (c) Leucocratic granite characterized by phaneritic texture (crossed polars) and (d) Granodiorite showing medium to coarse-grained with characteristic myrmekitic textures (crossed polars).
4. Structures and deformation
The structural elements of the Dahomeyide internal nappes zone of southeastern Ghana are characterized by four deformational events (D1, D2, D3, and D4), which are well-developed in the gneisses and migmatites. An earlier D1 phase formed NE-SW S1 foliations and asymmetric quartz porphyroblasts and was associated with F1 isoclinal folds (Figures 5(a) and (b)). The plot to poles for the S1 foliations also shows that the foliations generally dip to the southeast and are concentrated closer to the sphere than the centre and, therefore, indicate low to moderate dip angles to the southeastern direction (Figure 2).
(a) Northeast-Southwest (NE-SW) S1 foliations in the migmatite folded by F2 kink folds (b) Quartz porphyroblasts showing top-to-the-NE shearing, (c) F2 fold (drag folds), and penetrative top-to-the-NW dextral (C-S fabrics) shear plane (C2) (d) Near horizontal NW-dipping L2 stretching lineation, (e) C3 sinistral top-to-the-NW shear (C-S fabrics) planes with generally NW-SE strike and (f) Late joints cutting through the migmatite and some veins. Most of the outcrops occur as platforms thus, features were viewed on the horizontal surface.

D2 phase corresponds to the formation of S2 foliations (NW-SE striking cleavages), F2 folds (drag folds), kink folds and coeval with penetrative top-to-the-NW dextral (C-S fabrics) shear plane (C2) as well as the formation of older generational joints in the gneisses and migmatites (Figures 2, 5(a) and (c)–(e)). The stereographic projections (plot to pole) of these planes show a general concentration close to the centre of the circle, indicating moderate to high dips for the cleavages (Figure 2). The presence of kink folds is also an indication of the high intensity of the D2 event. The D2 event also produced small-scale Z-shaped drag and parasitic folds.
D3 event is a shearing event with a top-to-the-NW sinistral (C-S fabric) shear plane (C3; Figures 2 and 5(f))). These small-scale faults are observed only in the migmatites and gneisses. The C3 shear fault planes generally strike in the NW-SE directions with low to moderate dips to the southwest. The C3 faults displaced S1 foliations, the C2 dextral shear faults, the F2 folds and the older joints and developed the low NNE dipping S3 foliations (Figure 2).
A final D4 event resulted in the formation of the younger generational joint and fault planes striking in East-West (E-W) and Northnorthwest-Southsoutheast (NNW-SSE) directions (Figure 5(f)). The effects of this deformation are observed in the aplite veins and granodiorite dyke.
5. Geophysical data processing and interpretation
5.1. Geophysical data processing
The aeromagnetic geophysical survey data for the study area was obtained from the Ghana Geological Survey Authority, Accra. This data was acquired between February and November 1997 by the Geological Survey of Finland. The survey was flown in the E-W direction with a nominal line separation set at 400 m and a terrain clearance of 70 m. The data was grid using the bi-directional gridding method because it strengthens trends perpendicular to the survey line directions. The disadvantage, however, is that tie-line data cannot be incorporated into the interpolation method.
The total magnetic intensity grid (TMI) obtained from the gridding was enhanced by applying appropriate filters such as reduce to the equator (RTE), first vertical derivative (1VD), tilt derivative (TD) and automatic gain control (AGC). The RTE filter was applied on the TMI grid to reposition anomalies directly over their sources (Milligan and Gunn, Reference Milligan and Gunn1997; Kwayisi et al. Reference Kwayisi, Lehmann and Elburg2020; Dzikunoo et al. Reference Dzikunoo, Kazapoe and Agbetsoamedo2021). The RTE was chosen over the reduced to-pole because of the study area’s low latitude position. An inclination of −13.17 and a declination of −5.23 were applied in the filtering; the final result was then inverted using a multiplication factor of −1.
Akin to the RTE operation, the analytic signal (AS) centres anomalies directly over causative bodies (Gunn, Reference Gunn1997). Additionally, it is useful in low magnetic latitudes because of its independence from ambient fields and the direction of source body magnetization (Gunn, Reference Gunn1997). Ridges or peaks in the AS-TMI anomaly map coincide with faults, shear zones and lithological contacts. The 1VD filter was applied to the RTE grid to enhance shallow geological structures by accentuating short-wavelength (high wave-number) anomalies that are caused by surface and near-surface geological bodies (Paine, Reference Paine1986). The 1VD filter also enhances the edges of anomalies to determine the boundaries of geological bodies easily. This filter allows for the visualization of the change in the measured parameters as distance to source (survey height) changes. It is ideal to perform the 1VD filter on the RTE-TMI grid because the output will show the zero contour values directly over the edges of the magnetic source bodies (Kwayisi et al. Reference Kwayisi, Lehmann and Elburg2020; Dzikunoo et al. Reference Dzikunoo, Kazapoe and Agbetsoamedo2021).
The AGC and TD were applied on the RTE grid. The AGC works to enhance minor structural trends, making them more discernible. Its application works with some rescaling applications to reduce the dynamic range of magnetic data to avoid substantial anomalies and mask subtle anomalies. The TD, conversely, defines the extent of the edges of the various sources (Oruc and Selim, Reference Oruc and Selim2011). The enhancement highlights short wavelengths. The processed geophysical maps were opened in an ArcGIS environment for detailed interpretation. Geophysical maps were used to identify lineaments, which include folds, faults and thrusts. This was done by observing certain characteristics such as displacement in a noticeable linear feature, a sudden change in amplitude, duplication of magnetic signals, truncation of a primarily linear magnetic domain by a curvilinear feature and a curved magnetic pattern (Kwayisi et al. Reference Kwayisi, Lehmann and Elburg2020).
5.2. Geophysical data interpretation
The TMI map shows a sort of division of magnetic intensities, with the area to the north showing higher magnetic intensities than the area to the south (Figure 6(a)). The RTE shows a similar distribution of the magnetic signatures with a better definition of some features. The RTE grid was then inverted (Figure 6(b)), giving high anomalies the appropriate pink colour for straightforward interpretation and comparison. The general NE-SW feature trend is likely related to the S1 NE-SW foliations observed on the field (Figures 2, 6(a) and (b)).
(a) Total Magnetic Intensity map of the internal nappes zone of the Dahomeyide belt with NE-SW striking high and low magnetic intensities corresponding to different geological terrains, (b) Inverted Reduced-to-the-equator map of the internal nappes zone, giving high anomalies the appropriate pink colour for straightforward interpretation and comparison, (c) Analytic signal map that is useful in centring anomalies directly over causative bodies, and showing NE-SW trending region with high magnetic anomalies and traces of structures and (d) First Vertical Derivative map showing major thrust faults as a result of cyclic map repetition of the same magnetic signal. (e) Automatic gain control map exhibiting intermittent high and low magnetic signatures in the mid-portion and southeastern corner of the study area. These correspond to biotite gneiss and intrusive granitoids, and (f) dominantly NW-SE striking and few E-W striking faults and joints are observed on the Tilt derivative map.

The AS map and the RTE-inv both show a central NE-SW trending region with high magnetic anomalies and traces of structures (Figures 6(b) and (c)). The NNE-facing nose of a tight chevron fold is seen at the southwesternmost end of the study area and within the demarcated shear zone (Figure 6(d)). This is linked to F1 folding event that resulted in the NE-SW S1 foliation. A major thrust/shear plane runs through the central portion of the study area (Figure 6(d)). The thrusting is observed as a repetition of the magnetic anomalies. These observed thrust/shear depict top-to-the-NW movement and thus may be associated with both dextral strike-slip and sinistral strike-slip movement of D2 and D3 events. In fact, observed dextral and sinistral fault plane falls within this zone (Figure 2). The dextral strike-slip and sinistral strike-slip movements are thus, related to D2 and D3 deformational events that developed the C2 and C3 shear planes, respectively, observed in the field (Figure 5).
Lithologically, biotite gneiss and intrusive granitoid (granite and granodiorite) rocks seem to occupy the shear zone with some enclaves of garnet amphibole gneiss (Agyei-Duodu et al. Reference Agyei-Duodu, Loh, Boamah, Baba, Hirdes, Toloczyki and Davis2009). These exhibit intermittent high and low magnetic signatures in the mid-portion and southeastern corner of the study area in the AGC map (Figure 6(e)). Late dominantly NW-SE striking and few E-W striking faults and joints are observed on the TD map (Figure 6(f)). These late faults and joints correspond to the late D4 deformational event observed in the field.
6. Geochemical characteristics
6.1. Analytical procedure
Representative samples of migmatites (3), gneisses (8), intrusive granitoids (5) and pegmatite (1) were analyzed for major and trace element concentrations at the ALS laboratory in Vancouver, Canada. Analytical techniques followed the protocol of the procedures at the ALS laboratory (see Kwayisi et al. Reference Kwayisi, Agra, Dampare, Asiedu, Amponsah and Nude2017). The major and trace elements analyses were carried out by Inductively Coupled Plasma-Atomic Emission Spectrometry and multi-elements fusion Inductively Coupled Plasma Mass Spectrometry, respectively. Loss on ignition was determined at 1000°C. Elements with concentration >1 wt. % recorded 1 – 3% analytical uncertainty, whereas those in low concentrations (<1 wt. %) recorded uncertainty of 10%. On the whole, precision was better than 5%.
6.2. Major and trace element concentrations
Major and trace element concentrations for representative samples of the granitoids of the internal nappes zone (i.e, active margin) of the Dahomeyide belt are presented in Table 2. The gneisses vary in terms of their major element concentrations. The biotite-hornblende gneiss has the lowest SiO2 (63.6 – 66.5 wt. %) content, followed by the biotite gneiss (SiO2 = 69.1 – 70.8 wt. %) with the felsic augen gneiss having the highest SiO2 (76.2 wt. %) content. However, the concentrations of the ferromagnesian elements are highest in the biotite-hornblende gneiss (Fe2O3t = 4.65 – 5.44 wt. %, and MgO = 1.79 – 2.07 wt. %), and lowest in the felsic augen gneiss (Fe2O3t = 1.11 wt. %, and MgO = 0.12 wt. %). The biotite gneiss, on the other hand, has intermediate content of the ferromagnesian elements (Fe2O3t = 2.45 – 4.47 wt. %, and MgO = 0.61 – 0.74 wt. %). The migmatites show lower concentrations of SiO2 (61.7 – 66.3 wt. %) than the gneisses; nonetheless, they have higher contents of the ferromagnesian elements (Fe2O3t = 4.07 – 6.70 wt. %, and MgO = 1.43 – 2.88 wt. %) than the gneisses. The intrusive granitoids have SiO2 content of 64.7 – 74.0 wt. %, Fe2O3 of 1.49 – 3.65 wt. %, and MgO of 0.29 – 1.13 wt. %. The pegmatite also has a SiO2 content of 71.9 wt. %, Fe2O3 of 0.99 wt. % and MgO of 0.22 wt. %. The migmatites and biotite-hornblende gneiss have low K2O/Na2O values (K2O/Na2O = 0.2 – 0.7 and 0.1 – 0.5, respectively). The biotite gneiss, intrusive granitoids, felsic augen gneiss and pegmatite have high K2O/Na2O values (K2O/Na2O = 0.5 – 1.3, 0.7 – 1.4, 1.3, and 3.9), respectively.
Major and trace element data of internal nappes zone of the Dahomeyide belt

All the samples plotted in the igneous field on the SiO2 vs. TiO2 diagram (Figure 7(a)). The intrusive granitoid, pegmatite and felsic augen gneiss are slightly peraluminous. However, the biotite-hornblende and biotite gneisses show both metaluminous and weak peraluminous signatures (Figure 7(b)). Generally, the rocks have typical I-type signatures (Figure 7(b)). The intrusive granitoids, biotite gneiss, pegmatite and felsic augen gneiss are classified as granite, except one sample each of the intrusive granitoid and biotite gneiss that plot as quartz monzonite (Figure 7(c)). The migmatites show variable compositions as they plot as granodiorite, monzonites and on the boundary line between monzonite and quartz-monzonite (Figure 7(c)). The biotite-hornblende gneiss shows major element compositions akin to granodiorite. On the feldspar normative diagram after O’Connor (Reference O’Connor1965) (Figure 7(d)), the intrusive granitoids and biotite gneiss dominantly plot as granite, with one sample each plotting as trondjhemite. The pegmatite and felsic augen gneiss are classified as granite, with the biotite-hornblende gneiss plotting entirely as tonalite. The migmatites are classified as granodiorite and tonalite. The felsic augen gneiss, biotite gneiss, migmatite and intrusive granitoids are High-K calc-alkaline in nature (Figure 7(e)). However, one sample of each of the biotite gneiss and migmatite shows Medium-K calc-alkaline and Low-K tholeiite signature, respectively. The biotite-hornblende gneiss has Low-K tholeiite and Medium-K calc-alkaline signatures (Figure 7(e)). The migmatite, biotite-hornblende gneiss and pegmatite are magnesian, whereas the intrusive granitoids and biotite gneiss are both magnesian and ferroan (Figure 7(f)). The felsic augen gneiss plots in the ferroan field (Figure 7(f)).
Major element classification diagrams of the gneisses, migmatite and intrusive granitoids of the internal nappes zone (a) Plot of SiO2 vs. TiO2 (Tarney Reference Tarney1977), (b) Plot of A/CNK (molar Al2O3/(CaO + Na2O + K2O)) vs. ANK (molar Al2O3/(Na2O + K2O)) (Maniar and Piccoli Reference Maniar and Piccoli1989), (c) Total alkalis vs silica (Middlemost 1985), (d) Or-Ab-An ternary diagram (O’Connor, Reference O’Connor1965), (e) K2O vs. SiO2 diagram (after Peccerillo and Taylor Reference Peccerillo and Taylor1976) and (f) SiO2 vs. FeOt/(FeOt+MgO) diagram (after Frost and Frost Reference Frost and Frost2008).

The granitoids of the internal nappes zone of the Dahomeyide belt show a wide range of trace element concentrations. These wide variations of trace element concentrations have resulted in distinct REE patterns on the chondrite-normalized REE diagram by Palme and O’Neill (Reference Palme and O’Neill2014). The biotite gneiss shows gentle negative slopes with enrichment of the Light Rare Earth Elements (LREE) relative to the Heavy Rare Earth Elements (HREE) and pronounced negative Eu anomalies (Figure 8(a); La/Yb = 12.2 – 32.3; Eu/Eu* = 0.4 – 0.5). The migmatites and biotite-hornblende gneiss depict similar REE patterns characterized by LREE enrichment and nearly flat HREE (Figures 8(b) and (c); La/Yb = 5.5 – 9.3 and 5.3 – 7.4, respectively). However, the migmatites show more noticeable Eu anomalies than the biotite-hornblende gneiss (Figure 8(b); Eu/Eu* = 0.6 and 0.7, respectively). Although the REE pattern for the felsic augen gneiss resembles that of the migmatites, the HREEs are slightly depleted in the felsic augen gneiss with pronounced Eu anomalies compared to the migmatites (Figure 8(d); La/Yb = 9.2; Eu/Eu* = 0.4). The intrusive granitoids show a steep negative slope depicted by enrichment of the LREE and a significant depletion of the HREE and pronounced negative Eu anomalies (Figure 8(e); La/Yb = 40.9 – 47.4; Eu/Eu* = 0.3 – 0.6). Conversely, the pegmatite shows LREE enrichment, HREE depletion and positive Eu anomaly (Figure 8(f); La/Yb = 34.9; Eu/Eu* = 1.0). On the incompatible multi-element normalized to primitive mantle diagrams, the biotite gneiss is enriched in the LILE relative to the HFS with negative peaks in Ba, Nb-Ta, Sr P and Ti (Figure 9(a)). The patterns depicted by the migmatites and biotite-hornblende gneiss are characterized by both LILE enrichment and depletion and nearly flat HFS, with negative peaks in Nb-Ta, P and Ti (Figures 9(b) and (c)). Their overall trace element concentration is lower than the biotite gneiss. The felsic augen gneiss shows an incompatible trace elements pattern comparable to the biotite gneiss (Figure 9(d)) except for the positive peak in K. The intrusive granitoids show enrichment of the LILE and a significant depletion of the HFS and pronounced negative Nb-Ta, P and Ti peaks (Figure 9(e)). The pegmatite, on the other hand, shows LILE enrichment, HFS depletion, positive K and Sr peaks and negative Nb-Ta, P and Ti peaks (Figure 9(f)).
Chondrite-normalized REE diagrams of (a) biotite gneiss, (b) Migmatites, (c) biotite-hornblende gneiss, (d) felsic augen gneiss, (e) intrusive granitoids and (f) pegmatite. Chondrite and primitive normalizing values are from Palme and O’Neill, (Reference Palme and O’Neill2014).

Primitive mantle-normalized diagrams of (a) biotite gneiss, (b) Migmatites, (c) biotite-hornblende gneiss, (d) felsic augen gneiss, (e) intrusive granitoids and (f) pegmatite. Chondrite and primitive normalizing values are from Palme and O’Neill (Reference Palme and O’Neill2014).

7. Discussion
7.1. Significance of the deformational events to the Pan-African orogeny
From a broader perspective, our detailed structural analysis suggests that the internal nappes zone of the Dahomeyide belt, southeastern Ghana, has been affected by a major NW-SE shortening followed by NW-SE thrusting and a later extension event (orogenic collapse). These shortening, thrusting and extension events are expressed as four deformation phases (D1-D4), which occurred during various stages of the Pan-African orogeny. The D1 phase is widespread and represents NW-SE Pan-African shortening associated with the regional phase of crustal movement that resulted in westward nappe piling during the Pan-African continent-continent collision between the West African Craton (WAC) and BNS. Attoh et al. (Reference Attoh, Corfu and Nude2007) and Kwayisi et al. (Reference Kwayisi, Lehmann and Elburg2020) have suggested that the transition from continental subduction to continent-continent collision resulted in a change in orogenic structural grain from N-S to NE-SW fabric. Rotation of regional E-W shortening direction to NW-SE shortening direction produced the NE-SW fabrics between 600 and 580 Ma. The presence of asymmetric quartz porphyroblasts indicates a shearing component with a general dextral top-to-the-NE sense of movement during the D1 event.
The D2 deformational regime followed the D1 shortening shear deformation, representing a Pan-African thrusting event as a result of progressive NW-SE shortening. Thrusting resulted in the transposition of the D1 fabrics. The D2 deformation is a ductile shear deformation that formed S2 foliations (cleavages), F2 folds, kink folds and coeval with C2 shear faults. The main kinematic indicators associated with the D2 event are the near horizontal NW-dipping L2 stretching lineation and small-scale C2 shear faults with a top-to-the-NW dextral sense of movement observed in the field and processed aeromagnetic data (Figures 5(c), (d) and 6(d)). D2 corresponds probably with west-verging thrusting and exhumation of the HP rocks between 590 and 580 Ma (Attoh et al. Reference Attoh, Dallmeyer and Affaton1997; Affaton et al. Reference Affaton, Kröner and Seddoh2000). The main S1 foliations are observable in microscopic and mesoscopic scales and are much more spectacular than the younger S2 foliations. This means the D1 event was rather intense, with better-preserved structures than the D2 event. This interpretation is backed by shallow inter-limb angle and parallel limbed isoclinal folds associated with the D1 tectonic phase.
The D3 event corresponds to a shear deformational regime in which the sinistral shear faults were produced. The D4 brittle tectonic event marked the last deformational and geological event in the evolutionary sequence of the internal nappes zone of the Dahomeyide belt. The significance of the D3 and D4 deformational events is unclear; however, D3 could be a continuation of the thrusting phase of the Pan-African orogeny since it shares similar structural grains as D2, whereas D4 may be linked to the extensional-related volcanic and sedimentary rocks formed after Pan-African continent-continent collision (Ganade de Araujo et al. Reference Ganade de Araujo, Cordani, Agbossoumounde, Caby, Basei, Weinberg and Sato2016).
7.2. Tectonic setting
Petrographical investigation revealed that the rocks had undergone very minimal alteration and that, coupled with the very low Loss on Ignition (LOI) values (<1.05 wt. %), suggests insignificant elemental mobility; thus, the major and trace element compositions can be utilized in tectonic setting and petrogenetic interpretations. The internal nappes zone has been proposed to be a juvenile arc crust with pockets of reworked Paleoproterozoic rocks intruded by post-collisional granitoids, representing the active margin of the Dahomeyide belt (Kalsbeek et al. Reference Kalsbeek, Affaton, Ekwueme, Frei and Thrane2012; Attoh et al. Reference Attoh, Samson, Agbossoumondé, Nude and Morgan2013). Field, petrographical and structural data reveal two main rock categories. These are (i) deformed rocks made up of gneisses and migmatites and (ii) undeformed rocks comprising mainly intrusive granitoids of granite and granodiorite composition (Figures 2, 3, and 4). Several tectonic discrimination diagrams, coupled with trace element patterns and ratios, have been used to assess the tectonic setting of the formation of these granitoids. The overall trace element patterns of the studied granitoids are characterized by enrichment of LILE and depleted HFS, with negative peaks of Nb-Ta, Sr, P and Ti (Figure 9). These geochemical features are typically considered as indications of subduction processes (Spandler and Pirard, Reference Spandler and Pirard2013; Kelemen et al. Reference Kelemen, Hanghoj and Greene2014). Except for three samples of biotite gneiss that plot in the within-plate granitoid field, all the other samples plot in the field defined by volcanic-arc and syn-collisional granitoids (Figure 10(a)). The Zr verses (Nb/Zr)N diagram by Thiéblemont and Tégyey (Reference Thiéblemont and Tégyey1994) suggests the pegmatite, felsic augen gneiss, biotite gneiss and majority of the intrusive granitoids show geochemical signatures typical of granitoids derived from continent-continent collision, i.e. active margin environment (Figure 10(b)). The biotite-hornblende gneiss, migmatites and two samples of biotite gneiss plot within the arc-array and the field defined by continental arc (Figure 10(c)). Although the felsic angen gneiss, pegmatite, biotite gneiss and intrusive granitoids plot in the continental arc field, they plot slightly away from the arc-array field (Figure 10(c)). This geochemical feature may suggest significant crustal contamination of the intrusive granitoids and pegmatite, and to some extent, the biotite and felsic augen gneisses.
Tectonic discriminant diagrams for the rocks of the internal nappes zone of the Dahomeyide belt (a) Nb vs. Y after Pearce et al. (Reference Pearce, Harris and Tindle1984), (b) Zr vs. (Nb/Zr)N diagram of Thiéblemont and Tégyey (Reference Thiéblemont and Tégyey1994), (c) Th/Yb vs. Nb/Yb with reference fields modified after Pearce (Reference Pearce2008) and (d) R1-R2 (after Batchelor and Bowden, Reference Batchelor and Bowden1985).

R1 (4Si-11(Na+K)-2(Fe+Ti)) verse R2 (6Ca+2Mg+Al) tectonic discriminating diagram (after Batchelor and Bowden, Reference Batchelor and Bowden1985) (Figure 10(d)) puts the rocks of the internal nappes zone into various orogenic phases consistent with field and petrographical evidence. On this diagram, the biotite-hornblende gneiss shows pre-collisional signatures. At the same time, the migmatites straddle between pre and syn-collisional settings, with the biotite and felsic augen gneisses showing syn-collisional features. The intrusive granitoids plot in the late orogenic field, with the pegmatite plotting between syn-collision and an orogenic granite boundary (Figure 10(d)). Typical collisional features such as foliations and folds, which occur in most of the gneisses and migmatites, represent the compressive stages of orogenesis. The deformed rocks (gneisses and migmatites) of the internal nappes zone with dominant axial planar foliations indicate their formation in a collisional setting or were affected by the Pan-African collisional process. The continental-arc signatures imply continental subduction processes in their formation. The intrusive granitoids and pegmatite are undeformed, implying late- to post-orogenic emplacement; thus, the continental-arc features could result from contamination during their evolution.
7.3. Petrogenesis
7.3.1. Lithological evolution
Petrographical and geochemical studies indicate that the rocks of the internal nappes zone are gneisses, migmatite and intrusive granitoids of granite, granodiorite and tonalite with minor trondjhemite compositions, formed during and after the Pan-African subduction-collision events. The gneisses and migmatites are pre- to syn-collisional granitoids, whereas the intrusive granitoids are post-collisional. Results of this study show that the migmatites are the most abundant rock in the Pan-African Dahomeyide internal nappes zone in southeastern Ghana, suggesting widespread migmatization during the Pan-African orogeny. The migmatites consist of biotite-rich gneissic melanosomes and feldspar-rich granitic leucosomes, resulting in lithological heterogeneity. Johnson et al. (Reference Johnson, Fischer and White2013) suggested that granitic leucosomes with abundant K-feldspar represent areas dominated by segregated crystal melt. Sawyer Reference Sawyer(1999) also described melanosomes as evident sites of melt formation, while leucosomes are sites of melt collection. From field and petrographical data, these features are characteristics of the migmatites of the Dahomeyide internal nappes zone, which suggests the migmatites resulted from partial melting of pre-existing rocks (gneisses) following Kornprobst (Reference Kornprobst2002). Consequently, the lithological heterogeneity observed in the migmatites may be due to partial melting of the gneisses. Geochemical classification diagrams indicate that the migmatites and biotite-hornblende gneiss evolved from similar granodioritic-tonalitic protolith (Figures 7(c) and (d)). Thus, the migmatites might have evolved from the biotite-hornblende gneiss through crustal anataxis during amphibolite facies metamorphism (Table 1), as described by Nude (Reference Nude1995).
Field relations, including cross-cutting relationships, gradational and sharp lithological contact, and inclusions, among others, have been used to establish the relative formation period of the gneisses, migmatite and intrusive granitoids of the internal nappes zone. The leucosomes slightly cut across the melanosomes in the migmatites, implying that the former is relatively younger than the latter. Textural evidence shows that the melanosome is rich in biotite but more depleted in feldspars and quartz than the leucosome. The felsic augen gneiss may have formed due to the gradual mineral growth associated with metamorphism and shearing. Gradational boundaries between the migmatites and gneisses imply a gradual transition from gneiss to migmatite with increasing temperature and the onset of partial melting. Pockets of gneisses occur within the intrusive granitoids, and this, coupled with the sharp contacts between the intrusive granitoids and gneisses (Figures 4(a) and (b)), indicate an intrusive relationship between the two. Besides, the gneisses are significantly deformed, whereas the intrusive granitoids are undeformed. The intrusive granitoids, biotite gneiss and felsic augen gneiss share similar lithological compositions, i.e., granite and granodiorite (Figure 7(c) and (d)). This may be a manifestation of the derivation of the intrusive granitoids from the partial melting of the biotite and felsic augen gneisses. This could explain the similar REE, LILE and HFS patterns depicted by the intrusive granitoids and the biotite gneiss on the REE and multi-element diagrams (Figures 8 and 9). In addition, these rocks show similar tectonic setting characteristics (Figure 11). The cross-cutting relationship between the pegmatite veins and migmatitic layers indicates a relatively younger age of the pegmatite than the migmatites.
SiO2 vs. Mg# plot for the rocks of the internal nappes zone of the Dahomeyide belt for petrogenetic interpretation. Fields of mantle, subducted oceanic crust, pure oceanic crust, delaminated lower crust, thick lower crust and metabasalt and eclogite melts are from Wang et al. (Reference Wang, Xu, Jian, Bao, Zhao, Li, Xiong and Ma2006).

7.3.2. Magma source and depth of emplacement
Major and trace elements geochemical data in Table 2 show low Mg (Mg# = 14.77-44.5), very low Ni (1-19ppm) and Cr (10-50ppm) contents for the gneisses, migmatite and intrusive granitoids. These features suggest the formation of the gneisses, migmatite and intrusive granitoids from evolved magmas rather than primary magmas whose Mg# >65, Cr >1000 ppm, and Ni >400-500 ppm (Winter, Reference Winter2001). The rocks of the internal nappes zone of the Dahomeyide belt, southeastern Ghana, are generally I-type granitoids with metaluminous and weak peraluminous features (Figure 7(b)). The intrusive granitoids, biotite and felsic gneisses and some of the migmatite are High-K calc-alkaline in nature. Partial melting of crustal rocks, or subduction-influenced mantle, has been proposed to generate High-K calc-alkaline granitoids (Gläser et al. Reference Gläser, Grosche, Voudouris and Haase2022). The High-K calc-alkaline signature and their I-type nature may suggest the melting of older igneous crustal materials. Besides, the intrusive granitoids show similar lithological compositions and trace element characteristics as the biotite gneiss, indicating partial melting of the latter to form the former. The Low-K tholeiite, metaluminous and I-type signatures of the biotite-hornblende gneiss and one sample of the migmatites suggest the melting of intermediate to mafic rocks. All the rocks of the internal nappes zone have Mg# values akin to granitoids derived from the lower crust (Figure 11).
The gneisses, migmatite and intrusive granitoids show LREE enrichment relative to HREE with a pronounced Eu negative (Eu/Eu*) anomaly, except for the pegmatite, which has a positive Eu anomaly. The REE pattern, together with the negative Ba, Sr and Eu anomalies, might be associated with residual plagioclase at the source or formation of their magmas in an oxidized environment, such as the continental crust (Rudnick and Gao, Reference Rudnick, Gao, Holland and Turekian2014). The continental crust is typically enriched in LREE and LILE but strongly depleted in Ti, Nb and Ta (Rollinson (Reference Rollinson1993), as is the case of the gneisses, migmatite and intrusive granitoids of the internal nappes zone (Figures 8 and 9). The depletion in Ti, Nb and Ta, evident on the primitive mantle normalized multi-element plot (Figure 9), together with weak positive Zr-Hf anomalies exhibited by the rocks, are diagnostic characteristics of the continental crust, while the depletion in Ba suggests an active margin source (Elburg, Reference Elburg2010; Rudnick and Gao, Reference Rudnick, Gao, Holland and Turekian2014). Negative Nb-Ta and Ti anomalies suggest relative enrichment of other elements by fluids or melt from a subducting plate in an arc setting (Elburg, Reference Elburg2010). The low Sr/Y ratios, with corresponding high Yb >1.5 ppm and Y >10 ppm content for the rocks of the internal nappes zone, support the melting of crustal material in their formation. On the SiO2 verse Mg# (Figure 11), the migmatites and biotite-hornblende gneiss plot in the region of delaminated lower crust-derived granitoids, whereas the biotite and felsic augen gneisses, intrusive granitoids and pegmatite plot in the field of thick lower crust-derived granitoids. This suggests the melting of a delaminated and/or thickened lower crust to form the gneisses, migmatite and intrusive granitoids.
Field studies have revealed that the gneisses and migmatites are deformed, with deformation features defined by foliations, folds, thrust and shear zone. These deformational features have been attributed to major shortening, shearing and thrusting events during the Pan-African orogeny. Such structures provide a historical record of deep (middle to lower) crustal level emplacement and deformation of the rocks (Opare-Addo et al. Reference Opare-Addo, Browning and John1993). Thus, it is likely that the depth of emplacement of these rocks is ≤ 35 km (lower crust) (Hacker et al. Reference Hacker, Kelemen and Behn2015; Aidoo et al. Reference Aidoo, Sun, Liang and Nude2020; Aidoo et al. Reference Aidoo, Nude, Sun, Liang and Zhang2021). This is confirmed by the SiO2 verse Mg# diagram (Figure 11), where the granitoids show geochemical characteristics of delaminated and/or thick lower crust.
7.4. Implications for crustal growth and evolution of the Dahomeyide belt active margin
Petrographical investigation and geochemical signatures suggest that the gneisses, migmatite and intrusive granitoids of the internal nappes zone, which represents the active margin of the Dahomeyide belt, are I-type, metaluminous and weakly peraluminous granitoids of tonalite, granodiorite and granite signatures formed during pre-, syn- and post-collisional orogenic setting. In this study, the biotite-hornblende gneiss formed during the pre-orogenic phase of the Pan-African orogeny in an arc setting. This gneiss may correspond to the basement of the Benin-Nigerian shield (Duclaux et al. Reference Duclaux, Ménot, Guillot, Agbossoumondé and Hilairet2006; Attoh et al. Reference Attoh, Samson, Agbossoumondé, Nude and Morgan2013). Older U-Pb zircon crystallization ages ranging from 2.14 to 2.19 Ga recorded for the hornblende gneiss have been interpreted to suggest the involvement of older Paleoproterozoic crust (Saharan Metacraton), representing the basement of the Benin-Nigerian Shield, in the Pan-African Dahomeyide belt (Duclaux et al. Reference Duclaux, Ménot, Guillot, Agbossoumondé and Hilairet2006; Attoh et al. Reference Attoh, Samson, Agbossoumondé, Nude and Morgan2013). The biotite-hornblende gneiss in this study shows tonalite and granodiorite composition. Hence, the Paleoproterozoic basement of the Benin-Nigerian Shield evolved from I-type, metaluminous, tonalitic-granodioritic magma emplaced in a continental-arc setting. This was later deformed and remobilized (migmatized) during the Pan-African orogeny.
Tectonic discriminations suggest continental arc and continent-continent collision for the migmatites and biotite gneiss, respectively (Figure 10). Plate convergence (both ocean and continental subduction) and arc magmatism formed approximately 670 to 630 Ma, followed by continent-continent collision of the WAC with the BNS between 620 and 610 Ma, which is characterized by HP metamorphism have been proposed as the geodynamic evolution of the Dahomeyide belt (Attoh, Reference Attoh1998; Agbossoumondé et al. Reference Agbossoumondé, Ménot and Guillot2001; Duclaux et al. Reference Duclaux, Ménot, Guillot, Agbossoumondé and Hilairet2006; Attoh and Nude, Reference Attoh and Nude2008; Ganade de Araujo et al. Reference Ganade de Araujo, Cordani, Agbossoumounde, Caby, Basei, Weinberg and Sato2016). A double subduction system (island arc and active continental margin) occurred in the north (Benin and northern Togo), which evolved into a single subduction system (continental subduction) in the south (Ghana; Guillot et al. Reference Guillot, Agbossoumondé, Bascou, Berger, Duclaux, Hilairet, Ménot and Schwartz2019). This was followed by a continent-continent collision between the WAC and the Benin-Nigerian Shield (Kwayisi et al. Reference Kwayisi, Lehmann and Elburg2020). Thus, the migmatites might have formed during the continental subduction phase of the Pan-African orogeny and later metamorphosed and deformed during the continent-continent collision between the WAC and BNS. This occurred due to the partial melting of the continental crust (i.e. the biotite-hornblende gneiss) of tonalite and granodiorite affinity at a depth of ≤35 km (Figure 11). This implies that large-scale migmatization occurred during the convergence process of the Pan-African orogeny through crustal anatexis.
Geochemical features of the intrusive granitoids and some of the biotite gneiss indicate High-K calc-alkaline granitoids formed by partially melting the thick lower crust in a post-collisional setting. According to Liégeois et al. (Reference Liégeois, Navez, Hertogen and Black1998), a post-collisional environment characterized by substantial motions along shear zones could have resulted in the re-melting of an earlier continental crust due to subduction in the lithospheric mantle or lower crust. Furthermore, Lu et al. (Reference Lu, McCuaig, Li, Jourdan, Hart, Hou and Tang2015) and Eglinger et al. (Reference Eglinger, Thebaud, Zeh, Davis, Miller, Parra-Avila, Loucks, McCuaig and Belousova2017) revealed that High-K calc-alkaline and shoshonitic granitoids are frequently placed in arc and post-collisional settings, preceded by a crustal thickening phase. The Dahomeyide belt post-collisional magmatism occurred between 580 and 540 Ma (Kalsbeek et al. Reference Kalsbeek, Affaton, Ekwueme, Frei and Thrane2012; Attoh et al. Reference Attoh, Samson, Agbossoumondé, Nude and Morgan2013; Ganade de Araujo et al. Reference Ganade de Araujo, Cordani, Agbossoumounde, Caby, Basei, Weinberg and Sato2016; Guillot et al. Reference Guillot, Agbossoumondé, Bascou, Berger, Duclaux, Hilairet, Ménot and Schwartz2019). Thus, the active margin of the Dahomeyide belt evolved during the subduction-collisional and post-collisional phases of the Pan-African orogeny between the Cryogenian and Ediacaran periods (670 – 540 Ma). This evolution witnessed large-scale migmatisation, crustal thickening and granitoid intrusions through partial melting of the thickened continental crust. The growth of the active margin occurred through tonalite-granodiorite magmatism due to the partial melting of the delaminated lower crust. This was followed by large-scale migmatization due to the remobilization of pre-existing crustal rocks during continental subduction. Then, crustal thickening due to continent-continent collision followed by melting of the thickened crust to form the intrusive granitoids (granite and granodiorite).
8. Conclusion
Integrated field, petrographical, geophysical, structural and geochemical studies of granitoids from the internal nappes zone (i.e., active margin) of the Dahomeyide belt are presented in this research. Two main lithological units, (i) deformed meta-granitoids made up of migmatites and gneisses and (ii) undeformed granitoids, including granite and granodiorite, dominate the internal nappes zone of southeastern Ghana. These granitoids have been affected by four deformation phases (D1-D4) during a major NW-SE shortening followed by NW-SE dextral-sinistral thrusting and a later extensional event during the Pan-African orogeny. Petrographical and geochemical studies indicate that the gneisses, migmatite and intrusive granitoids of the internal nappes zone are of granite, granodiorite and tonalite composition, formed during and after the Pan-African subduction-collision events. The gneisses and migmatite with dominant foliations and folds indicate their formation in a collisional setting or were affected by the Pan-African collisional process because these features are associated with compressive processes. The continental-arc signatures of the gneisses and migmatites imply continental subduction processes in the formation of their protolith. The intrusive granitoids are undeformed, implying late- to post-orogenic emplacement; thus, the continental-arc features could result from contamination during their evolution. The active margin of the Dahomeyide belt evolved during the subduction-collisional and post-collisional phases of the Pan-African orogeny. This evolution witnessed large-scale migmatization and granitoid intrusions through partial melting of thickened continent crust.
Acknowledgement
The authors thank the Department of Earth Science Capacity Building Project for supporting this research financially.


 Open access