


In 2008, Rebecca Morton and Kenneth Williams (Reference Morton, Williams and Box-Steffensmaier2008; see also Reference Morton and Williams2010) first predicted the advent of experimental political science, following initial work by James Druckman et al. (Reference Druckman2006) documenting the use, development and growth of different experimental designs in the field.Footnote 1 The value of the application of experimental designs in social science research certainly lies in their ability to allow scholars to establish causality. However, while most well-designed experimental studies will allow inferring to the study population at hand, establishing high internal validity, generalizing to a broader population (i.e. external validity) is much harder to achieve (Barabas and Jerit Reference Barabas and Jerit2010; Gaines et al. Reference Gaines2007; Mullinix et al. Reference Mullinix2015). Survey experiments might offer a solution to overcome this issue by allowing the embedding of experimental treatments into questionnaires asked of representative probability samples of populations in a survey environment (Lavine Reference Lavine and Renwick2002), potentially combining the best of two worlds. If well designed and well implemented, population-based survey experiments should allow researchers to benefit from the ability to draw causal conclusions and to generalize to the broader population in question.
This article begins by empirically describing the use of survey experiments over the past 20 years. Next, it discusses the core assumptions of survey experiments and introduces commonly used designs applied in political science and its cognate disciplines. Finally, the article evaluates the use of survey experiments in the field by looking at the method through the lenses of the so-called Total Survey Error Paradigm (inter alia, Andersen et al. Reference Andersen1979; Groves and Lyberg Reference Groves and Lyberg2010; Weissberg Reference Weissberg2009), a framework from survey methodology assuming that error can occur at every stage of the survey process. As one core component of a survey experiment is the implementation of the experiment in a survey questionnaire, it seems appropriate to employ this framework for evaluation. The article provides guidance for researchers working with secondary data generated on the basis of survey experiments and to those interested in running survey experiments for their own research.
The advent of the survey experiment
In line with the prediction of the advent of experimental social science, the popularity of survey experiments as a method of data collection appears to be on the rise as well. Figure 1 shows the number of publications mentioning ‘survey experiment*’, restricting the search to ‘Social Science’ and the time period from 1990 to 2021,Footnote 2 as captured by the citation base Scopus. Overall, Scopus registered a total of n = 7,638 publications mentioning ‘survey experiment*’ in the title, abstract, key words or text body. The timeline shows a clear trend: while the number of publications mentioning ‘survey experiment*’ was rather low from 1990 until 2010, ranging from 10 (1990) to 73 (2010), a steep increase can be observed from 2011 onwards, when the mentioning of ‘survey experiment*’ first exceeded a count of 100 publications. Scopus first registered over 1,000 articles mentioning ‘survey experiment*’ in Social Science for the year 2020 (n = 1,212). This number further increased to n = 1,836 publications in 2021.Footnote 3
Number of Publications Mentioning ‘survey experiment*’ in the Social Sciences from 1990 to 2021
Source: Scopus.

To provide further evidence of their popularity, a similar search was conducted looking at the number of publications mentioning ‘survey experiment*’ in six leading political science journals in the time period (t) from 1990 to 2021: the American Political Science Review (APSR, total n t = 485), the British Journal of Political Science (BJPS, total n t = 392), Political Analysis (PA, total n t = 234), the Journal of Politics (JOP, total n t = 126), the European Political Science Review (EPSR, total n t = 122) and the American Journal of Political Science (AJPS, total n t = 94).Footnote 4 Overall, these journals registered a cumulative total n t of 1,555 publications mentioning ‘survey experiment*’ in the given time period. To present the data effectively, Figure 2 has been split: the top graph displays distributions for the APSR (solid line), BJPS (dashed line) and PA (dotted line) and the trend lines on the lower graph the patterns for the JOP (solid line), ESPR (dashed line) and AJPS (dotted line).
Number of Publications Mentioning ‘survey experiment*’ in Leading Political Science Journals from 1990 to 2021
Sources: APSR, BJPS, PA, JOP, EPSR, AJPS.
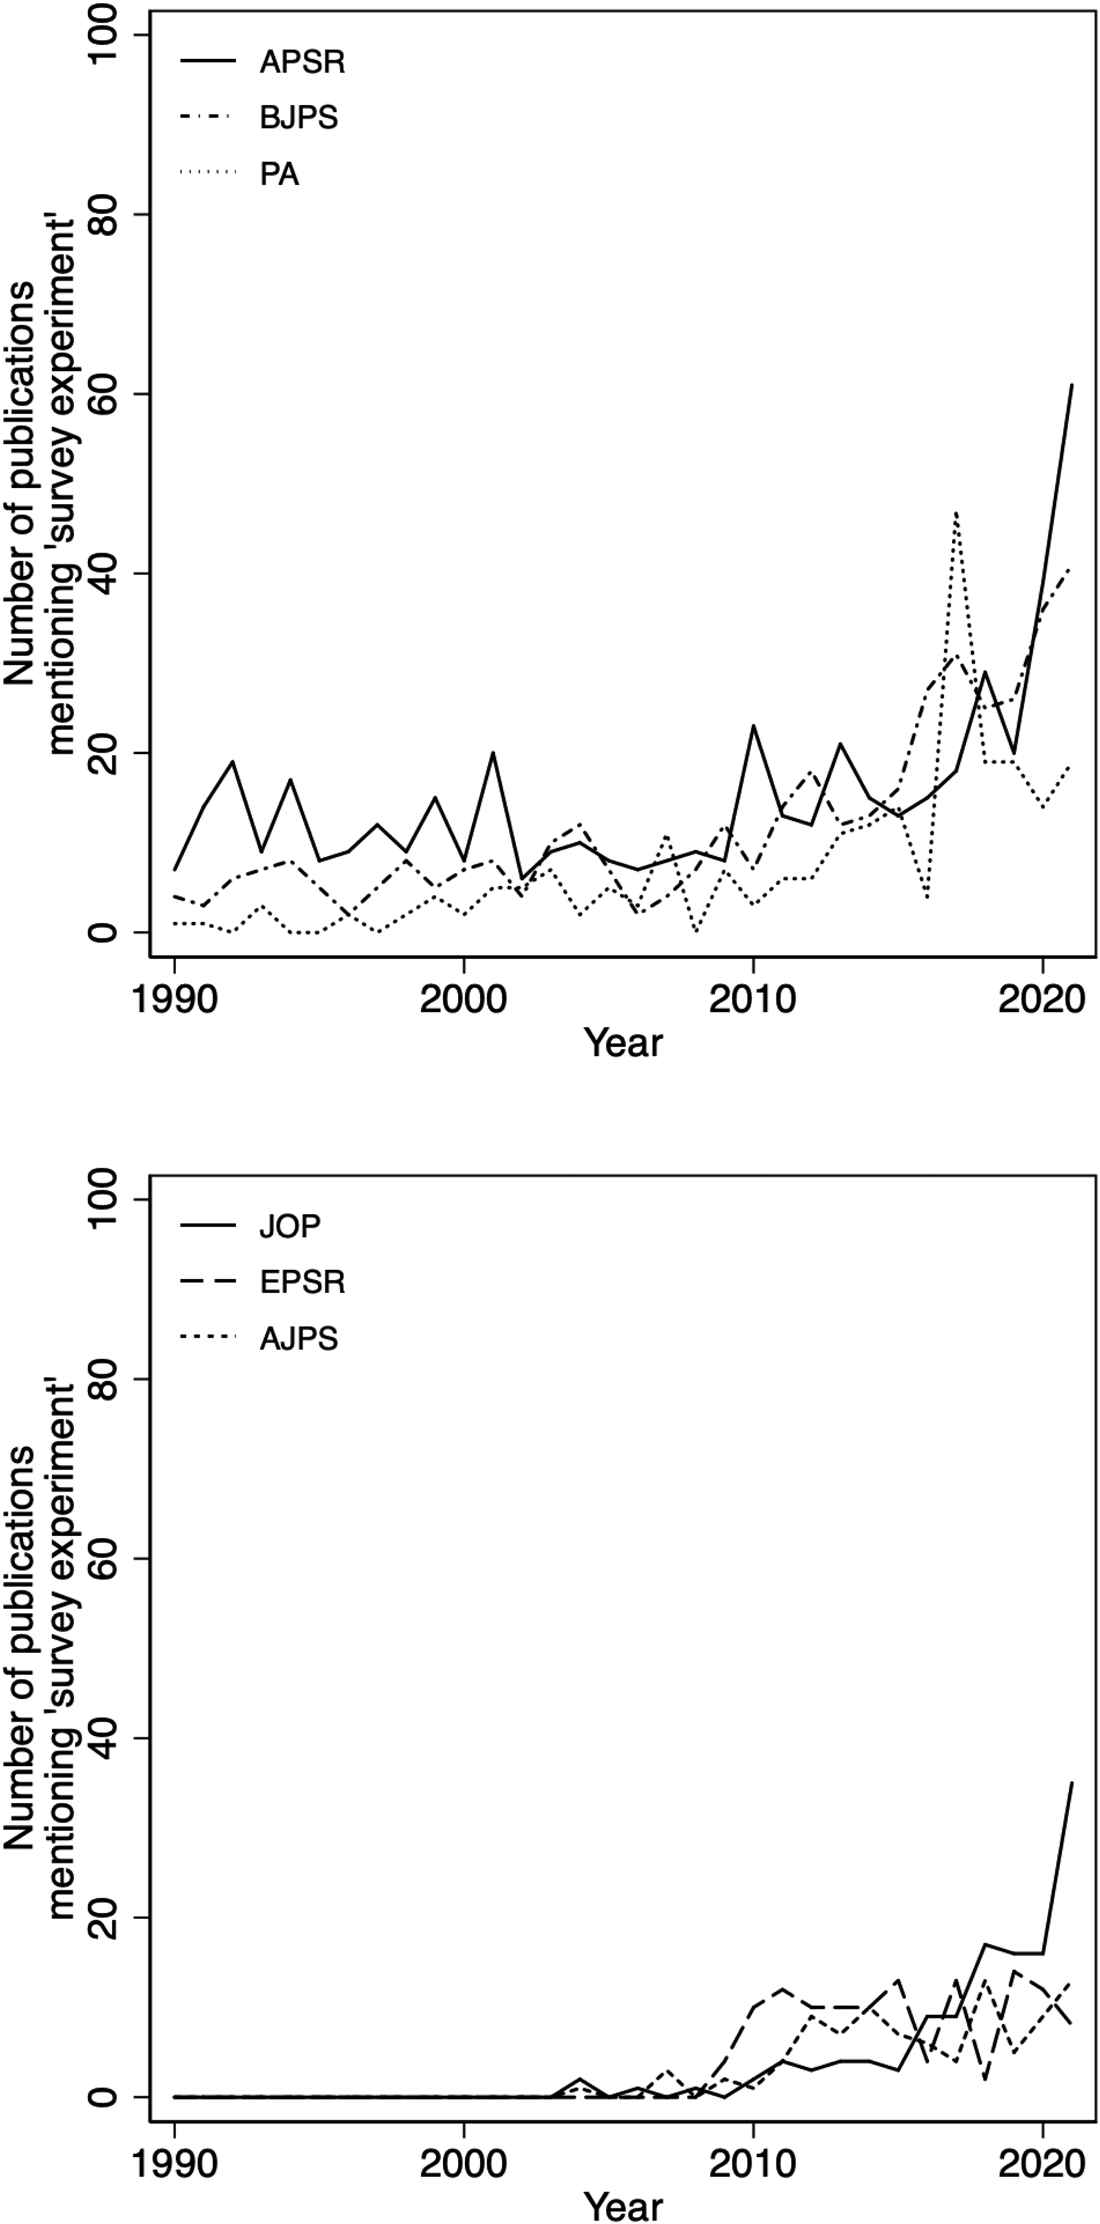
Starting at the top, the number of publications tagged as ‘survey experiment*’ in the APSR, BJPS and PA seem roughly to follow the overall trend reported in Figure 1. It appears that the AJPR is most open to publishing research on ‘survey experiment*’ throughout the time period, followed by the BJPS (dashed line) and PA (dotted line). All three journals started publishing small numbers of survey experimental research in the 1990s and observe an increase in publications since 2010.
Looking at the JOP (solid line), the EPSR (dashed line) and the AJPS (dotted line) on the lower graph, it is noteworthy that none of the three journals seems to have published research on survey experiments until the early 2000s. An increase, albeit much flatter compared with the APSR, BJPS and PA, can also be observed for the JOP, EPSR and AJPS. Only the JOP seems to follow the overall trend observed in Figure 1 over the past decade.
In general, an upward trend can be observed in most recent years across these six important and top-ranked journals following the overall trend reported in Figure 1, seemingly pointing towards the advent of survey experiments.Footnote 5 To further evaluate this observation, it is important to have a closer look at the logic of the survey experiment and different designs, as in the next section.
On the logic of survey experiments
As the name indicates, survey experiments combine experimental designs with survey methodology. Arguably, survey experiments can be considered rather an experimental than a survey method (Mutz Reference Mutz2011: 3), in which the dominant method is the experiment – allowing manipulation of core variables in a controlled environment to establish causality – and the survey element is a means to achieve representativeness and thus the power of generalization. However, both methods provide important leverage to researchers interested in testing causal mechanisms with a wider applicability. It is thus important to reflect on the experimental as well as the survey component to better understand the advantages and possible pitfalls of combining both methods.
Experiments allow researchers to investigate the cause and effect of a treatment in a controlled environment (see e.g. King et al. Reference King1994). To achieve this the researcher needs to ensure random assignment of participants to control and treatment groups. By stipulating one independent variable (x) in each of the treatment groups and comparison with the relevant control group, the experimental design allows the researcher to identify whether the treatment caused a change in the dependent variable (y).
Traditionally many experiments take place in an artificial lab environment and are thus somewhat detached from real-world settings, which is a drawback for political scientists interested in studying real-world phenomena (e.g. Bol Reference Bol2019, for an overview). Carefully designed and well-implemented lab experiments may have high internal validity; that is, researchers can be confident that the results hold for the specific sample of subjects investigated in the particular study. However, they lack external validity – that is, the power to generalize the findings to a broader population – as the underlying samples do not provide researchers with the statistical power of probability to do so.
Natural and field experiments may allow researchers to achieve applications in the real world, as they either rely on natural random assignment to control and treatment groups by real-world event groups, or implement random assignment on a larger scale but in a real-world context. David Kirk (Reference Kirk2009) provides an example of a natural experiment on residential change and recidivism in different districts after Hurricane Katrina. Alan Gerber and Donald Green (Reference Gerber and Green2000) present a large-scale field experiment on voter canvassing. However, both natural and field experiments may undermine the assumption of a controlled environment because they take place in the real world. Researchers are unlikely to control every single factor that may influence the treatment and control groups. In addition, both can be labour and time intensive and expensive, and thus more difficult to realize for scientific research in a timely manner (see e.g. Gerber and Green Reference Gerber and Green2000: 661).
Observational methods, such as surveys, are useful to collect opinion and behavioural data on a larger scale and, given that they rely on probability sampling methods, give high leverage to draw conclusions about the broader population underlying the sample.Footnote 6 However, high-quality surveys employing probability sampling methods suffer from similar drawbacks to other methods: they are time and labour intensive, and can be very expensive (see e.g. Sniderman Reference Sniderman2018). Furthermore, surveys are not free from other obstacles, which may affect the survey estimates, as discussed later in the section on potential representation and measurement errors in survey experiments.
While no method of data collection is ever perfect, embedding experimental designs in a survey environment offers an opportunity to achieve both high internal and external validity for research. The former (internal validity) can be achieved by randomly assigning survey respondents into an appropriate number of subsamples of the survey,Footnote 7 at least one control group and the required number of treatment groups, arguably, fulfilling the condition of a controlled experimental environment. The latter (external validity) can be achieved by implementing questions that manipulate respective variables in each group into the survey questionnaire that is then asked of a probability sample of the target population.
Direct and indirect treatments
Diana Mutz (Reference Mutz2011) posits that we can broadly distinguish direct from indirect treatments for the sole purpose of systematically structuring experimental designs, even though dividing designs into direct and indirect treatments is not always that straightforward.
Direct treatments include manipulations that are integrated in the question wording itself. Indirect treatments may rely on other unobtrusive ways to manipulate a variable during the data collection or that allow us to estimate any potential differences between control and treatment group post data collection, such as applying basic probability theory. A discussion of popularly implemented direct and indirect treatments along with examples is provided below.Footnote 8
Direct treatments
The simplest survey experimental design is the direct manipulation of the question wording in the treatment group(s) while comparing the difference in the survey estimate to the traditional wording in the control group. As such, the survey experiment may help to improve the way in which a certain concept is measured, which seems especially valuable when sensitive questions are concerned. Such questions include those that may be perceived as intrusive, may have the potential for negative consequences if behaviour or attitudes are disclosed, or those that suffer from social desirability bias (e.g. Krumpal Reference Krumpal2013; Tourangeau et al. Reference Tourangeau2000).
One of the first survey experiments of this kind has been reported by Hadley Cantril and S.S. Wilks (Reference Cantril and Wilks1940): a study by the Roper Institute embedded split-ballot designs that randomly assigned survey respondents to treatment and control groups to test the potential of reducing item non-response. The findings revealed a significant reduction in item non-responses to attitudinal questions about political events when popular politicians' names associated with the event were prompted in the question in the treatment groups.
Similar experiments aimed to reduce misreporting in surveys above all due to social desirability bias – that is, the habit of overreporting positive and desirable behaviour or beliefs and of underreporting negative and undesirable ones (e.g. Phillips and Clancy Reference Phillips and Clancy1972). For instance, scholars experimented with offering introductions to questions to give them cognitive cues when an event took place, or implemented face-saving response alternatives allowing them the opportunity to admit to undesirable behaviour in a less threatening way. Scholars have proposed alterations in these directions to measure self-reported electoral turnout more accurately (e.g. Belli et al. Reference Belli2006; Kuhn and Vivyan Reference Kuhn and Vivyan2018; Zeglovits and Kritzinger Reference Zeglovits and Kritzinger2014) and engagement beyond voting (e.g. Persson and Solevid Reference Persson and Solevid2014), behaviours prone to overreporting. Moreover, experimentation with a novel way to capture party identification suggested that partisanship in Britain is much lower than previously anticipated and that models employing traditional items as a predictor are biased by overreporting (Sanders et al. Reference Sanders2002).
Other research showed that the way in which political issues are framed matters. For example, different cues such as time, place and scope affect what the public considers to be important political problems, with a future outlook, considering the world as whole and a wider scope triggering a stronger focus on global issues such as the environment (Yeager et al. Reference Yeager2011). Playing with different actors endorsing or discouraging particular campaigns or action also appears to have an impact. For instance, prompting a religious or international actor in support of a women's quota in Jordan appears to increase support for the quota more generally (Bush and Jamal Reference Bush and Jamal2015). Similar research on the advancing peace process in Colombia indicates that rebel endorsement of the peace process diminishes public support (Matanock and Garbiras-Díaz Reference Matanock and Garbiras-Díaz2018).
Direct treatments may also involve hypothetical scenarios in anchoring vignettes.Footnote 9 Christiane Atzmüller and Peter Steiner (Reference Atzmüller and Steiner2010: 128) note that a ‘vignette is a short, carefully constructed [i.e. hypothetical] description of a person, object, or situation, representing a systematic combination of characteristics’. While the vignette in the control group provides a neutral frame, different characteristics can be changed in the vignettes received by the treatment groups. One benefit of vignette designs is that they allow changing more than one characteristic at a time and respondents may receive several different vignettes (Atzmüller and Steiner Reference Atzmüller and Steiner2010). For instance, a two-by-two design would allow manipulating two variables that can take two different characteristics (values) – a total of four possible combinations that should be asked in four experimental groups. Arguably, imposing a hypothetical element and asking several vignettes of the same respondent can also involve trade-offs given detachment from the real world and possible respondent learning effects (Lavine Reference Lavine and Renwick2002, see also the section on potential measurement and representation error).
Some applications of vignette designs in politics include studying corruption, immigration and the impact of different media frames on public opinion about policy issues (e.g. Kaufmann Reference Kaufmann2019; Öhberg and Naurin Reference Öhberg and Naurin2016; Tomz Reference Tomz2007; Turper Reference Turper2017; Weitz-Shapiro and Winters Reference Weitz-Shapiro and Winters2017). For instance, when studying corruption in Brazil, Rebecca Weitz-Shapiro and Matthew Winters (Reference Weitz-Shapiro and Winters2017) describe a hypothetical mayor in scenarios varying elements of the credibility of the information source reporting a case of corruption. Their research finds that respondents overall reacted negatively to corruption allegations, but more sophisticated respondents were more likely to question the credibility of the information sources reporting the corruption allegations. Sedef Turper (Reference Turper2017) describes a design tapping into public support for the admission of immigrants to the Netherlands, where the experimenter varied economic prospects and criminal background characteristics of the immigrants. This study finds that both economic and safety considerations greatly influence public support for individual immigrants. A more recent example of a vignette design applied in a political context is presented by Eric Kaufmann (Reference Kaufmann2019): his paper suggests that hostility towards immigrants and support for right-wing populism in Britain declines when survey respondents are primed that immigrants will blend in with the ethnic majority. Patrik Öhberg and Elin Naurin (Reference Öhberg and Naurin2016) use a vignette design to show that politicians are less willing to listen and respond to citizens' contact attempts if they do not coincide with the politician's party's position. Moreover, the results reveal that politicians display a higher willingness to listen but not necessarily respond if the policy request is in line with their party's view. Vignette designs have also been implemented to study public opinion towards foreign policy threats. Tomz (Reference Tomz2007) implemented scenarios in survey experiments manipulating the regime type, motivation, power or severity of a military threat, and interest of the potential attacker on the United States. The study provides evidence that the public are less supportive of leaders that became involved in a conflict but backed down compared to those that never committed to get involved in the first place. This research posits that the country's international reputation is a crucial mechanism for the public.
Sometimes viewed as an extension to vignette designs, perhaps as a vignette+, conjoint experiments share similar characteristics, as they also vary in several different characteristics at the same time (Hainmueller et al. Reference Hainmueller2015).Footnote 10 In political science, conjoint experiments have experienced a revival with the work of Jens Hainmueller and Daniel Hopkins (Reference Hainmueller and Hopkins2015) studying Americans' attitudes towards immigrants. The study presented a table with two different immigrant profiles varying nine different characteristics of the person (the immigrant) described. Respondents were then asked which of the two immigrants they would give priority to be admitted to the United States, employing a forced-choice response format as well as a question for each profile capturing respondents' rating whether the immigrant should or should not be admitted at all. The design has since been applied to further studies of immigration elsewhere (e.g. Duch et al. Reference Duch2022; Marx and Schumacher Reference Marx and Schumacher2018), but also to other political contexts, such as preferences for political candidates in Japan (Horiuchi et al. Reference Horiuchi2020) and support for supreme justice nominations (Sen Reference Sen2017), or support for environmental policies (Huber et al. Reference Huber2019; Wicki et al. Reference Wicki2020).
Indirect treatments
Survey experiments may also implement indirect treatments, which means that researchers do not manipulate the survey questions directly, but implement an, arguably, unobtrusive way of measuring the concept of interest. Inherently, the control and treatment groups may be used to give leverage to estimate the prevalence of an attitude or behaviour after data collection. Popular indirect survey experimental methods include the list experiment, randomized response techniques and other computerized methods.
One popular, indirect method is the so-called list experiment (Droitcour et al. Reference Droitcour and Biemer1991).Footnote 11 Relying on split samples, the control group receives a list of unobtrusive items and the treatment group the same list with an additional sensitive item. Respondents are asked to provide a count of items indicating how many apply to them, as opposed to which items apply to them. The researcher is then able to estimate the prevalence of an attitude or behaviour in the aggregate by taking the mean difference of the long list and the short list. The technique has initially been applied to the political context by James Kuklinski et al. (Reference Kuklinski1997) studying sentiments towards race in America. Their studies showed that prejudice towards Black families prevails and is more dominant among White Southern men. Other studies expanded this research, investigating attitudes and feelings towards African Americans and political candidates' religion, race or gender (Heerwig and McCabe Reference Heerwig and McCabe2009; Redlawsk et al. Reference Redlawsk2010; Streb et al. Reference Streb2008) and voting behaviour (Comşa and Postelnicu Reference Comşa and Postelnicu2013; Holbrook and Krosnick Reference Holbrook and Krosnick2010; Kuhn and Vivyan Reference Kuhn and Vivyan2018; Thomas et al. Reference Thomas2017).
Indirect treatments also include so-called Randomized Response Techniques (RRTs; Boruch Reference Boruch1971; Greenberg et al. Reference Greenberg1969; Horvitz et al. Reference Horvitz1968; Warner Reference Warner1965), which employ randomization devices, such as coins, dice or even online tools, to obscure survey respondents' answers to protect them from disclosing their individual responses. If the probabilities of these devices are known, researchers are able to estimate the prevalence of the sensitive item on aggregate. Further extensions to RRTs aim to avoid the use of randomization devices, which might alert survey respondents that something unusual is happening, by implementing elements of randomization within the question wording (Non-Randomized Response Approach; Tan et al. Reference Tan2009; Yu et al. Reference Yu2008).Footnote 12 This can be achieved by featuring a sensitive and a non-sensitive question but asking respondents to give a joint answer to both. Their response can be that they would answer both questions in the same way or differently. As the probabilities of the two questions are known, given that they are asked as dichotomous items, researchers are able to estimate the prevalence of the sensitive behaviour or attitude. These methods have been applied to voting behaviour (Gschwend et al. Reference Gschwend2018; Kuhn and Vivyan Reference Kuhn and Vivyan2018; Lehrer et al. Reference Lehrer2019; Waubert de Puiseau et al. Reference Waubert de Puiseau2017), prejudice against women (Hoffmann and Musch Reference Hoffmann and Musch2019), xenophobia, antisemitism and Islamophobia (Johann and Thomas Reference Johann and Thomas2017; Krumpal Reference Krumpal2012), and corruption (Corbacho et al. Reference Corbacho2016; Oliveros and Gingerich Reference Oliveros and Gingerich2020).
Other innovative, computerized techniques that could be classified as survey experiments have also been developed to understand cognitive processes underlying political behaviour and attitudes (Lavine Reference Lavine and Renwick2002). To achieve this, survey respondents are often directed to a separate tool where they are asked to complete computerized tasks. For example, so-called Implicit Association Tests (Greenwald et al. Reference Greenwald1998) and their variants allow measuring subconscious, implicit attitudes towards specific groups or events, as opposed to explicitly asking and measuring them (see e.g. Banse et al. Reference Banse2001; Johann and Thomas Reference Johann and Thomas2018; Johann et al. Reference Johann2018; Ksiazkiewicz and Hedrick Reference Ksiazkiewicz and Hedrick2013; Schaap et al. Reference Schaap2019). While these methods offer a wide variety of designs, it is beyond the scope of this article to elaborate on these in detail. The value of these methods has been re-emphasized by Julian Schaap et al. (Reference Schaap2019), who note that, in combination with more conventional methods, these techniques are a fruitful tool to study sociopolitical habits.
Potential errors undermining the logic of survey experiments
As demonstrated above, survey experiments can take a variety of designs and shapes. To recap, the core benefit of survey experiments is to make use of the controlled environment of an experimental design to study cause and effect with the power to generalize to a wider population given it is embedded in a survey sample based on probability methods.
To address potential error sources systematically, this article employs the so-called Total Survey Error paradigm (TSE; Andersen et al. Reference Andersen1979; Groves and Lyberg Reference Groves and Lyberg2010; Weissberg Reference Weissberg2009). It posits that any survey estimate is influenced by potential error sources affecting representation and measurement. The former refers to all errors that might affect the representativeness of the sample, such as coverage of the population in sampling frames, sampling error when drawing the sample or respondent selection, as well as non-response error due to survey respondents choosing not to take part in the survey or specific questions of the survey. The latter indicates that problems regarding the robustness of a measure might occur, such as measuring something other than the anticipated concept (validity), being able to repeatedly measure the same concept (reliability), but also error due to respondent or possible interviewer behaviour, or to error incurred when processing the data.
Many of the issues identified by the TSE can be extended to crucial error sources of experimental designs, such as potential flaws leading to unreliable and invalid measures, or effects on representativeness from mistakes in the randomization or assignment to treatment and control groups. The discussion below outlines how potential measurement and representation errors may undermine the success of survey experiments. A summary of this discussion can be found in Table 1.
Potential Errors Undermining the Success of a Survey Experiment

Measurement error
The left panel of Table 1 summarizes some common concerns about measurement error, such as unreliable or invalid measures, lack of control group(s), interviewer and respondent effects, question order effects and processing errors.
Measurement error begins at the design stage of the survey experiment. Researchers need to ensure that they design measures that are valid (i.e. measure the intended concept) and reliable (i.e. they do this repeatedly). While the experimental component's benefit is that it establishes causality, special attention needs to be paid to research design. Some designs may suffer a lack of either validity or reliability. One example may be conjoint experiments as it might be unclear what researchers actually measure with the various combinations of characteristics. While this might seem straightforward when people's profiles are studied (e.g. immigrant or political candidates), it could be less clear when more complex concepts, situations or policies are studied that are already more difficult to define. Another concern relates to list experiments and (non-)randomized response techniques. Even though many studies claim to better estimate sensitive behaviour, prior research has raised concerns about the effectiveness of designs, suggesting that their success depends on the level of sensitivity of the item and its incidence in the population (Thomas et al. Reference Thomas2017; Wolter and Laier Reference Wolter and Laier2014). Unfortunately, the true value of an incidence remains unknown in the social-political world, so validation studies are often not an option (Landsheer et al. Reference Landsheer1999). While this is circumvented by asking an additional direct question for comparison, assuming that the experimental condition will result in a better estimate, an increasing number of studies raise concerns about the validity and reliability of results (Höglinger, and Diekmann Reference Höglinger and Diekmann2017; Jerke et al. Reference Jerke2022; Schnell and Thomas Reference Schnell and Thomas2021).
While careful pretesting of the question wording, items, and scenarios will help designing valid and reliable measures for an experimental design, simply adopting experimental designs from another context will be risky. Relatedly, Paul Sniderman (Reference Sniderman2018) raises the question whether a survey experiment is necessary. If we already know the factors determining public preferences – for example, attitudes towards specific groups – a survey experiment may not be necessary as ‘the whole point of performing an experiment is that we do not already know the answer’ (Sniderman Reference Sniderman2018: 266). As attitudes change over time and may be affected by external events, continuous monitoring and updating may be required.
Another mechanism related to measurement error is the lack of control group(s). These are essential to evaluate whether a treatment had an effect. Missing control group(s), however, may render the results to be at least ambiguous (Gaines et al. Reference Gaines2007: 3) or lead to an entire failure of the experimental component. For instance, what information does the researcher gain from comparing several groups of respondents receiving different frames about a political candidate or event without the ability to compare to a group of survey respondents who have received neutral information?
In the psychology of the survey response, Thomas B. Jabine et al. (Reference Jabine1984) recommend that all survey respondents need to be able to: (1) comprehend survey questions in the same way; (2) retrieve the relevant information required to answer the question on the basis of the question posed; (3) use this retrieved information to make a judgement about how to answer the question; and (4) translate this judgement into the relevant response option offered by the survey question. Experimental design embedded in a survey may increase the cognitive burden for the survey respondents if they undermine some core principles of question and response category design (see e.g. Yaacoub et al. Reference Yaacoub2004; see also Sniderman Reference Sniderman2018), creating potential respondent effects. Some designs ask respondents to remember a lot of information in lengthy introductions or instructions, such as non-randomized response techniques, vignettes or conjoint designs, which might lead to information inequality as some respondents forget or misunderstand instructions and thus cannot complete the task as intended. Other designs require respondents to complete several tasks at the same time, such as quietly remembering their responses to several items and at the same time performing a little mathematical task by adding up numbers, such as list experiments or randomized response techniques, potentially leading to misunderstanding, frustration and inaccurate responses. Some even involve a physical task, such as flipping a coin or completing a computerized test, which may distract survey respondents from the actual task of providing an accurate answer. One study on the Crosswise Model has made an attempt to systematically investigate some of the cognitive burdens for respondents (see also Jerke et al. Reference Jerke2019). Furthermore, hypothetical scenarios (Mutz Reference Mutz2011: 54), as prompted in vignettes and conjoint experiments, may be too hard to grasp for some respondents. In sum, survey respondents might be alerted by unusual tasks (Krumpal et al. Reference Krumpal and Engel2015) and some subgroups of the sample might be better equipped to complete the tasks depending on some demographic characteristics, such as education (Schnell et al. Reference Schnell1988), undermining the success of a survey experiment.
In a similar way, experimental designs may be prone to interviewer effects (Mangione et al. Reference Mangione1992; O'Muircheartaigh and Campanelli Reference O'Muircheartaigh and Campanelli1998) if the experiment was implemented in an interviewer-assisted survey. Interviewers, even though briefed for each specific survey, may feel as intimidated by the more complex designs, anticipating questions from the respondents that they are often not allowed to answer given the standardized survey protocol. They may also suffer from reading out long scenarios or instructions, stumble over the wording of the instructions while reading them, or feel uncomfortable or embarrassed about asking about certain concepts, thinking about sexual preference, radical views, illegal behaviours. Serious bias may be induced in the data if interviewers skip entire questions, sensitive items or read out experimental instructions or profiles incorrectly. Indirect treatments may especially be quite susceptible to interviewer effects, even if experienced interviewers work on the survey project, if they do not understand the experimental component or fail to read out the experimental design as prompted – for example, randomized and non-randomized response techniques but also conjoint tables. Cultural backgrounds might be relevant for seemingly straightforward designs, such as a list experiment. Even though the sensitive item is presumably covered up by unobtrusive items, interviewers still have to read out all items, including the sensitive one, which could be embarrassing and they may decide not to read out the sensitive item or to skip the question altogether.
Careful consideration is required when deciding where in the survey questionnaire an experiment is best embedded to avoid question order effects (inter alia Bradburn and Mason Reference Bradburn and Mason1964; Krosnick and Alwin Reference Krosnick and Alwin1987; McFarland Reference McFarland1981; Rasinski et al. Reference Rasinski and Cooper2012): the idea that prior questions might affect survey respondents' answers to subsequent questions. This might be harmful for the success of a survey experiment. For example, previous questions may prime respondents to think about a topic or to frame a topic in particular way and thus bias the experimental measure. One example is questions on the perceptions of economic performance of a country just before implementing an experimental design on redistribution policy. Thinking about the question order is particularly relevant when several survey experiments – multiple treatments – are included in the questionnaire asked of the same subsamples, as the presence of several treatments may result in confounding or interaction effects between different treatments (see Atzmüller, and Steiner Reference Atzmüller and Steiner2010, for evidence on confounding effects in vignette designs). In addition, relying on multiple treatments implemented in the same overall experimental design might trigger learning effects; that is, respondents may understand the experimental setting and consciously give answers that are not accurate if they have concerns about the experimental setting.
Consider a series of list experiments being posed to survey respondents. Even though each one of them may be unique in its design, the relevant subgroups may understand the logic of the experiment, feel less protected and, as a result, give an answer that does not accurately describe their attitude or behaviour. Related might be the question about the duration of treatments (see e.g. Gaines et al. Reference Gaines2007); that is, for how long a particular treatment lasts for respondents. To date, there is no straightforward answer to this question. When planning to implement multiple experiments or treatments in the same survey questionnaire, general advice might be to separate these by placing several other unrelated survey questions between the different experiments.
Furthermore, real-world events occurring during the field period may bias the experimental measure. Consider a head of state suddenly resigning in the middle of the field period, a war starting or a pandemic leading to potential lockdowns. Such events may alter public opinion drastically and have an even more significant impact on experiments embedded in a survey. For instance, Rune Slothuus (Reference Slothuus2016) notes that the real world may give a pre-treatment – that is, some additional knowledge about a component of the experimental design naturally received before the experimental condition applies.
Depending on the mode of data collection, but also on the procedures applied to clean the survey data, processing error might bias the survey estimates and thus also the measure of any survey experiment. For instance, any mode of data collection that is not computer assisted requires a machine or human to transfer the results from the questionnaire into a spreadsheet. Both machines and human coders may make mistakes in the process by accident or in the worst case on purpose. For the experimental design, the transfer can be specifically challenging given that unique variables may have to be created for specific combinations of experimental groups. Think for example of an identifier that records different combinations of a conjoint table. Furthermore, standard data-cleaning exercises by human coders might result in unwanted edits, or in the addition or deletion of information or cases (un)consciously.
Taking measurement error further, most of the above outlined errors can be more severe considering survey experiments that are run in a longitudinal or comparative framework, raising the question whether survey experiments can work in the same way across different cultures, at different times, and possibly even over time.
Representation error
The right panel of Table 1 summarizes potential sources of representation error, including non-probability samples, flawed random assignment, (item) non-response and break-offs, and other effects relating to the survey mode, among other things.
Arguably, the most concerning aspect when thinking about representation error is the nature of the survey sample. Scholars have suggested that survey experiments are a useful method of gaining access to the processes that underlie opinion formation, if embedded in probability samples of a wider population (Lavine Reference Lavine and Renwick2002: 242; see also Druckman et al. Reference Druckman2006; Gaines et al. Reference Gaines2007; Mutz Reference Mutz2011; Sniderman Reference Sniderman2018). Probability samples of populations should result in accurate estimates, given that errors due to general coverage, sampling and non-response are minimized (Cornesse et al. Reference Cornesse2020). As such, the presence of a sample drawn on the basis of probability methods is essential to the success of a survey experiment and scholars' ability to generalize to a wider population with confidence. However, this is not the case for many survey experiments.
Given the associated costs of population-based probability sampling, many research projects opt for cheaper online or other solutions relying on non-probabilityFootnote 13 or large-N convenience samples.Footnote 14 More complex experimental designs such as high numbers of vignettes or conjoint experiments may especially benefit from the ease of programming the survey component and experimental groups, particularly in an online environment, but lose the power to infer. One suggestion to indicate that a survey study is based on non-probability methods is to speak of indications rather than estimates (Baker et al. Reference Baker2013; Matthews Reference Matthews2008). Admittedly, the change in language does not solve the core problem of the lack of a probability mechanism that allows researchers to generalize.Footnote 15
Thinking about the experimental groups in the survey setting, one question concerns how large experimental groups need to be for the researcher to be able to make inferences with confidence – that is, the question of statistical power (see O'Keefe Reference O'Keefe2007, for a discussion on statistical power and power analysis). The American Association for Public Opinion Research (AAPOR Reference AAPOR2017) suggests that a larger overall sample is required to conduct meaningful analysis given that the margin of error in the subgroups is generally larger than those of the overall survey. However, scholars have argued that some experimental designs also require larger sample sizes (see e.g. Ulrich et al. Reference Ulrich2012, for (non-)randomized responses techniques; Acharya et al. Reference Acharya2018, for conjoint experiments).
While the existence of control groups is essential, as argued above, researchers also want to be wary about the possibility of erroneous randomization. One way of checking whether random assignment to control and treatment groups in the survey environment has worked correctly is to inspect the overall distribution of core characteristics in the control and treatment groups is similar. However, Brian Gaines et al. (Reference Gaines2007) further argue that while randomization appears to be standard practice, this does not necessarily include randomizing survey experiments to the full extent. For instance, several experiments may be asked in the same split samples with the possibility that the treatments cancel each other out. Some designs may also require randomization of individual elements, which is prone to error (see Düval and Hinz Reference Düval and Hinz2020 for a test on conjoint surveys).
Further to checking whether the random assignment worked in the first place, one aspect Paul Lavrakas et al. (Reference Lavrakas and Lavrakas2019) raise is that it is also important to account for possible differences in non-response rates and break-offs in the randomly assigned groups, which may lead to bias if they are systematic. As such researchers may wish to check whether any of the subsample suffer high (item) non-responses or display unnaturally high break-off rates. This may also be related to the positioning of the experiment in the survey. Experiments asked early on in the survey questionnaire may result in higher overall break-off rates, potentially biasing the experimental measure and other survey questions. From the survey perspective, it might thus be preferable to implement experimental components towards the end of the questionnaire. Randomization is certainly easier to achieve in computer-assisted survey environments compared to other modes and in interviewer-assisted surveys compared to self-administered modes.Footnote 16 Flawed random assignment can affect the internal and external validity of the survey experiment and make the findings vulnerable to criticism.
Other aspects with the potential to affect the representativeness of a survey experiment include survey modes that, by default, may exclude a particular subgroup of a population. For instance, respondents with certain health conditions may be excluded from online modes as described by Rainer Schnell et al. (Reference Schnell2017). Linking this argument to Lavrakas et al. (Reference Lavrakas and Lavrakas2019), survey experiments may be particularly prone to representation error, especially when they rely on technologically novel methods that have the potential to exclude subgroups systematically. Lastly, for survey experiments relying on computerized tasks, sample bias may occur when linking respondents to a new platform or tool in a computerized experimental setting. Barriers such as additional log-in details or simply a failing internet connection may lead to representation issues if respondents lose connections or decide to break off systematically.
In sum, the core challenge of survey experiments is maintaining the intention of achieving higher external validity and thus overcoming the barrier of implementing them on non-probability samples. A survey experiment implemented on a non-probability or convenience sample remains above all an experiment (Mutz Reference Mutz2011). However, even if respondents are sampled on the basis of probability methods, representation and measurement error may affect the success of the experiment.
Avoiding potential errors when designing and implementing survey experiments
By paying careful attention to the pitfalls of survey experiments, researchers may be able to tackle potential errors biasing the results of their data collection. Table 2 summarizes some guiding principles and might serve as a reminder for those planning to design and implement experimental designs in a survey.Footnote 17
Avoiding Error in Survey Experiments

To protect the value of the survey experiment, it is advisable to obtain probability samples of the target population of interest. As Paul Sniderman (Reference Sniderman2018) notes, the cost of survey interviews is considerable, which is why many researchers may believe that they have no other choice than opting for non-probability or convenience samples, undermining the value of creating external validity. However, some field organizations offer the opportunity to buy space in multi-topic surveys, which could be a viable option for researchers at a lower cost.Footnote 18
Careful design of the experimental component is essential for the success of data collection. One central aspect is that the researcher is able to design a reliable and valid measurement of the attitude or behaviour in question. As such, it is important not to copy blindly experimental designs presented elsewhere, but to rethink and re-examine the intended design with regard to the specific context and population. For example, adopting unobtrusive items for a list experiment and applying them to a different context could be problematic as the items should be designed to cover up the sensitive item and be applicable to the specific context.
Diligent pretesting of the experimental component and its embedding in the survey questionnaire remain essential. Are respondents able to understand, digest and respond to the survey experiment or do we expect possible subgroup differences given different cognitive abilities of specific subgroups? Pretesting may also help with identifying how long treatment effects last, which could be relevant in multi-topic or multi-experimental surveys, and whether randomization of groups and experimental items, such as in conjoint designs, works correctly. While we often consider pretesting a method to improve measurement, its value for avoiding representation error for survey experiments needs to be highlighted. Quantitative pretesting can reveal whether split samples in a computer-administered survey were randomly assigned, might give an indication if respondents break-off at the beginning, during or directly after survey experiment, and – depending on the size of the pretest sample – also give an indication of the overall response rate in the experimental groups (see also Mutz and Permantle Reference Mutz and Pemantle2015). Furthermore, if directing to another experimental platform is necessary, such as in computerized experiments tapping into cognitive processes or political psychology, researchers are able to check whether the respective links, potential passwords and connections work, so that respondents can continue completing the survey questionnaire without problems or interruptions.
Even though seemingly obvious, the existence of control group(s) could be forgotten, which at least makes the experimental measure ambiguous (Gaines et al. Reference Gaines2007) if not useless. Again, careful pretesting of the survey questionnaire in the relevant mode will help avoid this pitfall. Checks may involve whether control groups are included in the questionnaire, if random assignment to control and treatment group works in the readily programmed computerized or paper questionnaire, and if the final data spreadsheet includes relevant helper variables that allow identification of respective items. Of course, this also requires budgeting for pretesting the experimental measurement and the final survey questionnaire.
Qualitative pretesting in expert discussions certainly helps inform and shape the overall design. Cognitive interviews with participants representing the target population may give further insights into how the anticipated respondents process the experimental design and its logic, the instructions, the question wording, and allow researchers to learn how challenging the tasks at hand might be (see, e.g. Jerke et al. Reference Jerke2019 for a reported pretest on (non-)randomized response designs). Additional quantitative pretestsFootnote 19 will allow the investigation of any notable response patterns, such as indications of possible subgroup differences, and may inform potential question order, spillover or other effects. They may allow an exploration of how long it takes to complete the survey questionnaire in general, and the experimental component in particular. For instance, did respondents speed through the questionnaire, did they take too long to complete it, or did they spend about the right time on the experimental design?
Depending on the survey mode and mechanism of administration, potential interviewer briefings focusing on the experimental component are advisable. Researchers should be able to pick up on any complications, discomfort or resistance interviewers may have and be able to give clear instructions as to what is expected from the interviewers in the survey situation. One-to-one practice tests of the survey experiment will further reveal if the interviewers stumble over question wordings, instructions or complex designs.
Conclusion
This article has provided empirical evidence that publications using survey experiments as a method of data collection in political science and international relations are on the rise, pointing towards the advent of survey experiments in politics and international relations. Undoubtedly, there is value in survey experimental research, given that researchers can create a controlled environment within a survey that is asked of probability samples of the target population aiming to measure attitudes or behaviours that cannot be captured otherwise. Many experiments looking at phenomena in the field focus on measuring attitudes or behaviours that appear to be sensitive in nature, such as attitudes towards immigration/immigrants, corruption, attitude formation depending on endorsement of policies and many more. Studies have contributed to capturing and disentangling the formation and explanations of attitudes towards specific groups (e.g. Gilens et al. Reference Gilens1998; Hainmueller and Hopkins Reference Hainmueller and Hopkins2015; Johann and Thomas Reference Johann and Thomas2018; Kuklinski et al. Reference Kuklinski1997), allowed insights into the definition and mechanism of corruption (Corbacho et al. Reference Corbacho2016; Oliveros and Gingerich Reference Oliveros and Gingerich2020; Weitz-Shapiro and Winters Reference Weitz-Shapiro and Winters2017) or have contributed to understanding how the endorsement of policies by political actors shapes support for these policies among the public (e.g. Bush and Jamal Reference Bush and Jamal2015; Matanock and Garbiras-Díaz Reference Matanock and Garbiras-Díaz2018).
Unfortunately, the value of survey experiments can be undermined by weak external validity, given the lack of probability samples. One main factor is the cost of obtaining these high-quality samples, which forces researchers to opt for cost-efficient options. One risk may be that large-N non-probability and convenience samples dominate research using survey experiments and likely pose a threat to the effectiveness of combining experimental with survey methods. Without intending to diminish the efforts made by scholars implementing survey experiments on lower-quality samples, it is important to raise awareness that this strategy contradicts the core idea of combining the strengths of experimental and survey methods: to gain high internal and external validity. Even though efforts are made to develop corrective mechanisms to enhance the inferential power and representativeness of non-probability samples (see e.g. Buelens et al. Reference Buelens2018; Maslovskaya and Lugtig Reference Maslovskaya and Lugtig2022), the issue remains that these kinds of samples do not allow researchers to draw inferences with confidence. As such, a survey experiment implemented on these samples remains (just) an experiment, as Mutz (Reference Mutz2011) posits.
Further challenges of survey experimental methods include their value, the challenges and the pitfalls when comparative studies are concerned (see e.g. Naumann et al. Reference Naumann2018; Strebel et al. Reference Strebel2019). Different cultural backgrounds, languages and methods may pose challenges for measurement and representation. Whether or not an experimental design can be translated 1:1 to another context remains debatable. Similarly, longitudinal or panel surveys may offer the opportunity to provide further insights into the methodological development of survey experiments. For example, they may shed light on the duration of treatments, potential learning effects by respondents, and allow researchers to better investigate response latencies of automatic versus controlled types of processing (Lavine Reference Lavine and Renwick2002). Content-related panel experiments, however, may likewise suffer from potential learning or confounding effects of different treatments. Finally, common standards are required to report the design and results of (survey) experiments (see Gerber et al. Reference Gerber2014, for a proposal).
In sum, if designed and implemented carefully, with high-quality probability samples, survey experiments can be a powerful, enriching and fun method of data collection in political science and international relations.
Acknowledgements
The author would like to thank the editors for the invitation to contribute this article and their fruitful editorial comments that helped shaped this review. Special thanks to Adrian Millican and Theofanis Exadaktylos for their feedback on previous drafts.


 Open access