


Austerity has been one of the central themes of public policy and political conflict in the past decade (Alesina, Favero and Giavazzi Reference Alesina, Favero and Giavazzi2019a). But its structural foundations go back decades. Since the 1990s, population ageing and the legacies of welfare state expansion have increasingly limited fiscal space, which has forced several democracies to pursue fiscal adjustment (Pierson Reference Pierson1998). However, the broad public support that welfare states continue to enjoy is expected to deter incumbents from cutting social spending, even if it yields long-term benefits (Pierson Reference Pierson1996, 179).
The evidence on the impact of fiscal adjustments on the welfare state is mixed, largely due to varying choices in measurement and estimation methods. Jacques (Reference Jacques2021) focuses on the interdependent budget shares of several spending components, showing that governments shelter expenditures that cater to large constituencies, while shifting the burden of adjustment to public investment. Armingeon, Guthmann and Weisstanner (Reference Armingeon, Guthmann and Weisstanner2016), by contrast, find that fiscal adjustments trigger reductions in aggregate social spending but only in the case of large adjustment plans. This uncertainty about the fiscal effects of austerity is problematic for two reasons: first, determining whether and when fiscal adjustments reduce unproductive expenditures, which is their key success criterion (Alesina and Perotti Reference Alesina and Perotti1995, 239), is crucial for policy evaluation. Second, understanding the impact of austerity on the welfare state is all the more pressing because it often underpins its theoretical link to political polarization (Fetzer Reference Fetzer2019; Hübscher, Sattler and Wagner Reference Hübscher, Sattler and Wagner2023; Baccini and Sattler Reference Baccini and Sattler2024).
In this letter, I show that fiscal consolidations are more effective in reducing social expenditures than previously understood. To explain this and to reconcile the findings of previous studies, I highlight the importance of timing in fiscal adjustment plans and the welfare reforms they encompass. Fiscal consolidations often occur in response to fiscal crises, facilitating reforms that were previously difficult to implement politically (Alesina, Ardagna and Trebbi Reference Alesina, Ardagna and Trebbi2006; Haffert Reference Haffert2019). As consolidations are carried out as multi-year plans (Alesina, Favero and Giavazzi Reference Alesina, Favero and Giavazzi2019b), governments cut public investment first, but implement welfare reforms in the later stages of the adjustment plan. Austerity’s short-run effects, therefore, may differ substantially from its effects in the long run.
To ascertain the effects of fiscal adjustment, I estimate cumulative multipliers via local projections (Jordà Reference Jordà2005). Local projections (LPs) regress future outcomes on current covariates (Montiel Olea and Plagborg-Møller Reference Montiel Olea and Plagborg-Møller2021, 1789) to identify the effects of shocks in distant periods. This approach offers several advantages: as LPs estimate multipliers for each individual period, they capture austerity’s heterogeneous effects over time and indicate whether spending reductions are sustained in the long run. By extending the LP estimator to account for state dependencies, we can also examine the macroeconomic conditions that facilitate successful adjustments.
Taking into account the timing and distribution of spending cuts reveals three novel insights into the effectiveness of fiscal adjustments in achieving welfare reforms: first, social spending reductions accumulate throughout the adjustment plan and persist over time, whereas investment is cut most sharply in the short run. This partly explains the disproportionate impact of austerity on public investment observed in previous studies. Second, examining a broader set of welfare state items, I show that fiscal adjustment reduces spending on both old and new social policies (Garritzmann, Busemeyer and Neimanns Reference Garritzmann, Busemeyer and Neimanns2018). Yet striking differences emerge within the two clusters: fiscal consolidations strongly reduce spending on healthcare, a cornerstone of social consumption, and leave pensions relatively untouched. Conversely, consolidations persistently lower education spending, whereas other components of social investment remain sheltered. Thus, governments do not universally target cutbacks according to the expected strength of welfare constituencies. Finally, I demonstrate that fiscal adjustments are associated with larger reductions in social spending in the long run if they are implemented under conditions of fiscal and financial distress. This indicates that crises provide windows of opportunity for lasting reforms of welfare state spending.
The Timing of Austerity
Welfare reform has been a central theme in policy debates for decades, yet social spending has continued to grow unabated. This trend has, in many ways, affirmed the idea that welfare entitlements in advanced democracies have become ‘immovable objects’ in the face of enduring support from electorates and interest groups (Pierson Reference Pierson1998). However, as welfare state maturation, demographic shifts, and other macroeconomic trends drive social spending upward, ascertaining the success of fiscal reforms in curbing welfare expenditures presents significant empirical challenges.
The existing empirical literature offers divergent perspectives on the effectiveness of fiscal adjustments in reducing welfare state spending. Consistent with the argument that self-interested incumbents refrain from cutting popular spending items, Jacques (Reference Jacques2021) shows that consolidations predominantly reallocate budget shares from public investment to pensions and healthcare spending, while social investment and labour market transfers remain unaffected by fiscal reform. This echoes previous evidence from Breunig and Busemeyer (Reference Breunig and Busemeyer2012). By contrast, Armingeon, Guthmann and Weisstanner (Reference Armingeon, Guthmann and Weisstanner2016, 639) show that large adjustments effectively reduce social spending, especially under left-wing incumbents, although average adjustments leave the welfare state unscathed.
However, given their heterogeneity in social spending concepts and empirical strategies, these studies do not offer a conclusive account of the fiscal ramifications of austerity. Although Jacques (Reference Jacques2021, 565) also shows that fiscal adjustments do not reduce pension and healthcare spending on aggregate, the evidence presented relies on interdependent budget shares rather than overall expenditure levels (cf. Breunig and Busemeyer Reference Breunig and Busemeyer2012). As a result, the aggregate impact of fiscal adjustments on social spending and its components remains elusive. Armingeon, Guthmann and Weisstanner (Reference Armingeon, Guthmann and Weisstanner2016), in turn, estimate the response of aggregate social spending to fiscal adjustment plans, but do not break down the effects across different components of social spending. Furthermore, their binary classification of large or small adjustment plans omits essential information about the scope of austerity (Alesina, Favero and Giavazzi Reference Alesina, Favero and Giavazzi2019a, 212). Finally, although both studies estimate long-run multipliers, neither provides a systematic analysis of how austerity’s effects unfold over time.
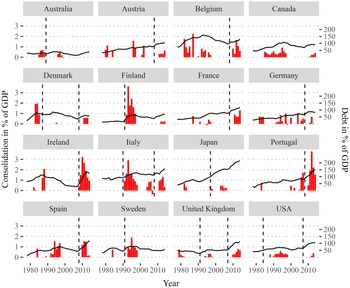
Against this background, I argue that two crucial facets of fiscal adjustment have received too little attention so far, but are important for understanding their long-term impact on the welfare state. First, large fiscal adjustments are frequently implemented during periods of macroeconomic turmoil (Jordà and Taylor Reference Jordà and Taylor2016). Since the 1970s, such adjustments have been particularly pervasive in the aftermath of financial crises, which diminish revenues and require costly bank bailouts (Schularick Reference Schularick2012). Figure 1 shows that financial crises and rising budget deficits precede the most ambitious fiscal adjustment plans, including the consolidations following the Great Recession or Sweden’s fiscal recalibration in the 1990s (Haffert Reference Haffert2019). Although secular forces of population ageing fuel the need for consolidation (Pierson Reference Pierson1998), they mostly translate into policy in times of severe fiscal distress.
Austerity, public debt, and financial crises.
Note: Left axis shows spending-led fiscal adjustments in per cent of GDP (red bars) (Alesina, Favero and Giavazzi Reference Alesina, Favero and Giavazzi2019a); right axis shows public debt in percentage of GDP (black line (Armingeon et al. Reference Armingeon, Wenger, Wiedermeier, Isler, Knöpfel, Weisstanner and Engler2020)); financial crisis dummies from Jordà, Schularick and Taylor (Reference Jordà, Schularick, Taylor, Eichenbaum and Parker2017) with imputation for Austria (Romer and Romer Reference Romer and Romer2019) are indicated with a dashed vertical line.

Economic and fiscal crises transform the politics of fiscal adjustment in ways that facilitate welfare state retrenchment. This shift arises because the costs of these crises make voters more willing to accept reforms previously stalled by distributional conflict (Drazen and Grilli Reference Drazen and Grilli1993; Alesina, Ardagna and Trebbi Reference Alesina, Ardagna and Trebbi2006). Recent evidence has shown that fiscal crises and rising budget deficits increase support for austerity and social spending cuts among voters and party elites (Roth, Settele and Wohlfahrt Reference Roth, Settele and Wohlfahrt2022; Bansak, Bechtel and Margalit Reference Bansak, Bechtel and Margalit2021; Barnes and Hicks Reference Barnes and Hicks2018; Haffert Reference Haffert2019; Bremer and McDaniel Reference Bremer and McDaniel2020; Romer and Romer Reference Romer and Romer2019), despite enduring mass support for welfare spending and opposition to austerity (Bremer and Bürgisser Reference Bremer and Bürgisser2023; Hübscher, Sattler and Truchlewski Reference Hübscher, Sattler and Truchlewski2023; Hübscher, Sattler andWagner Reference Hübscher, Sattler and Wagner2021; Jacques and Haffert Reference Jacques and Haffert2021). Further, when mature welfare states are forced into fiscal adjustment, the significant budget share dedicated to the welfare state makes cutbacks hard to avoid (Armingeon, Guthmann and Weisstanner Reference Armingeon, Guthmann and Weisstanner2016, 630).
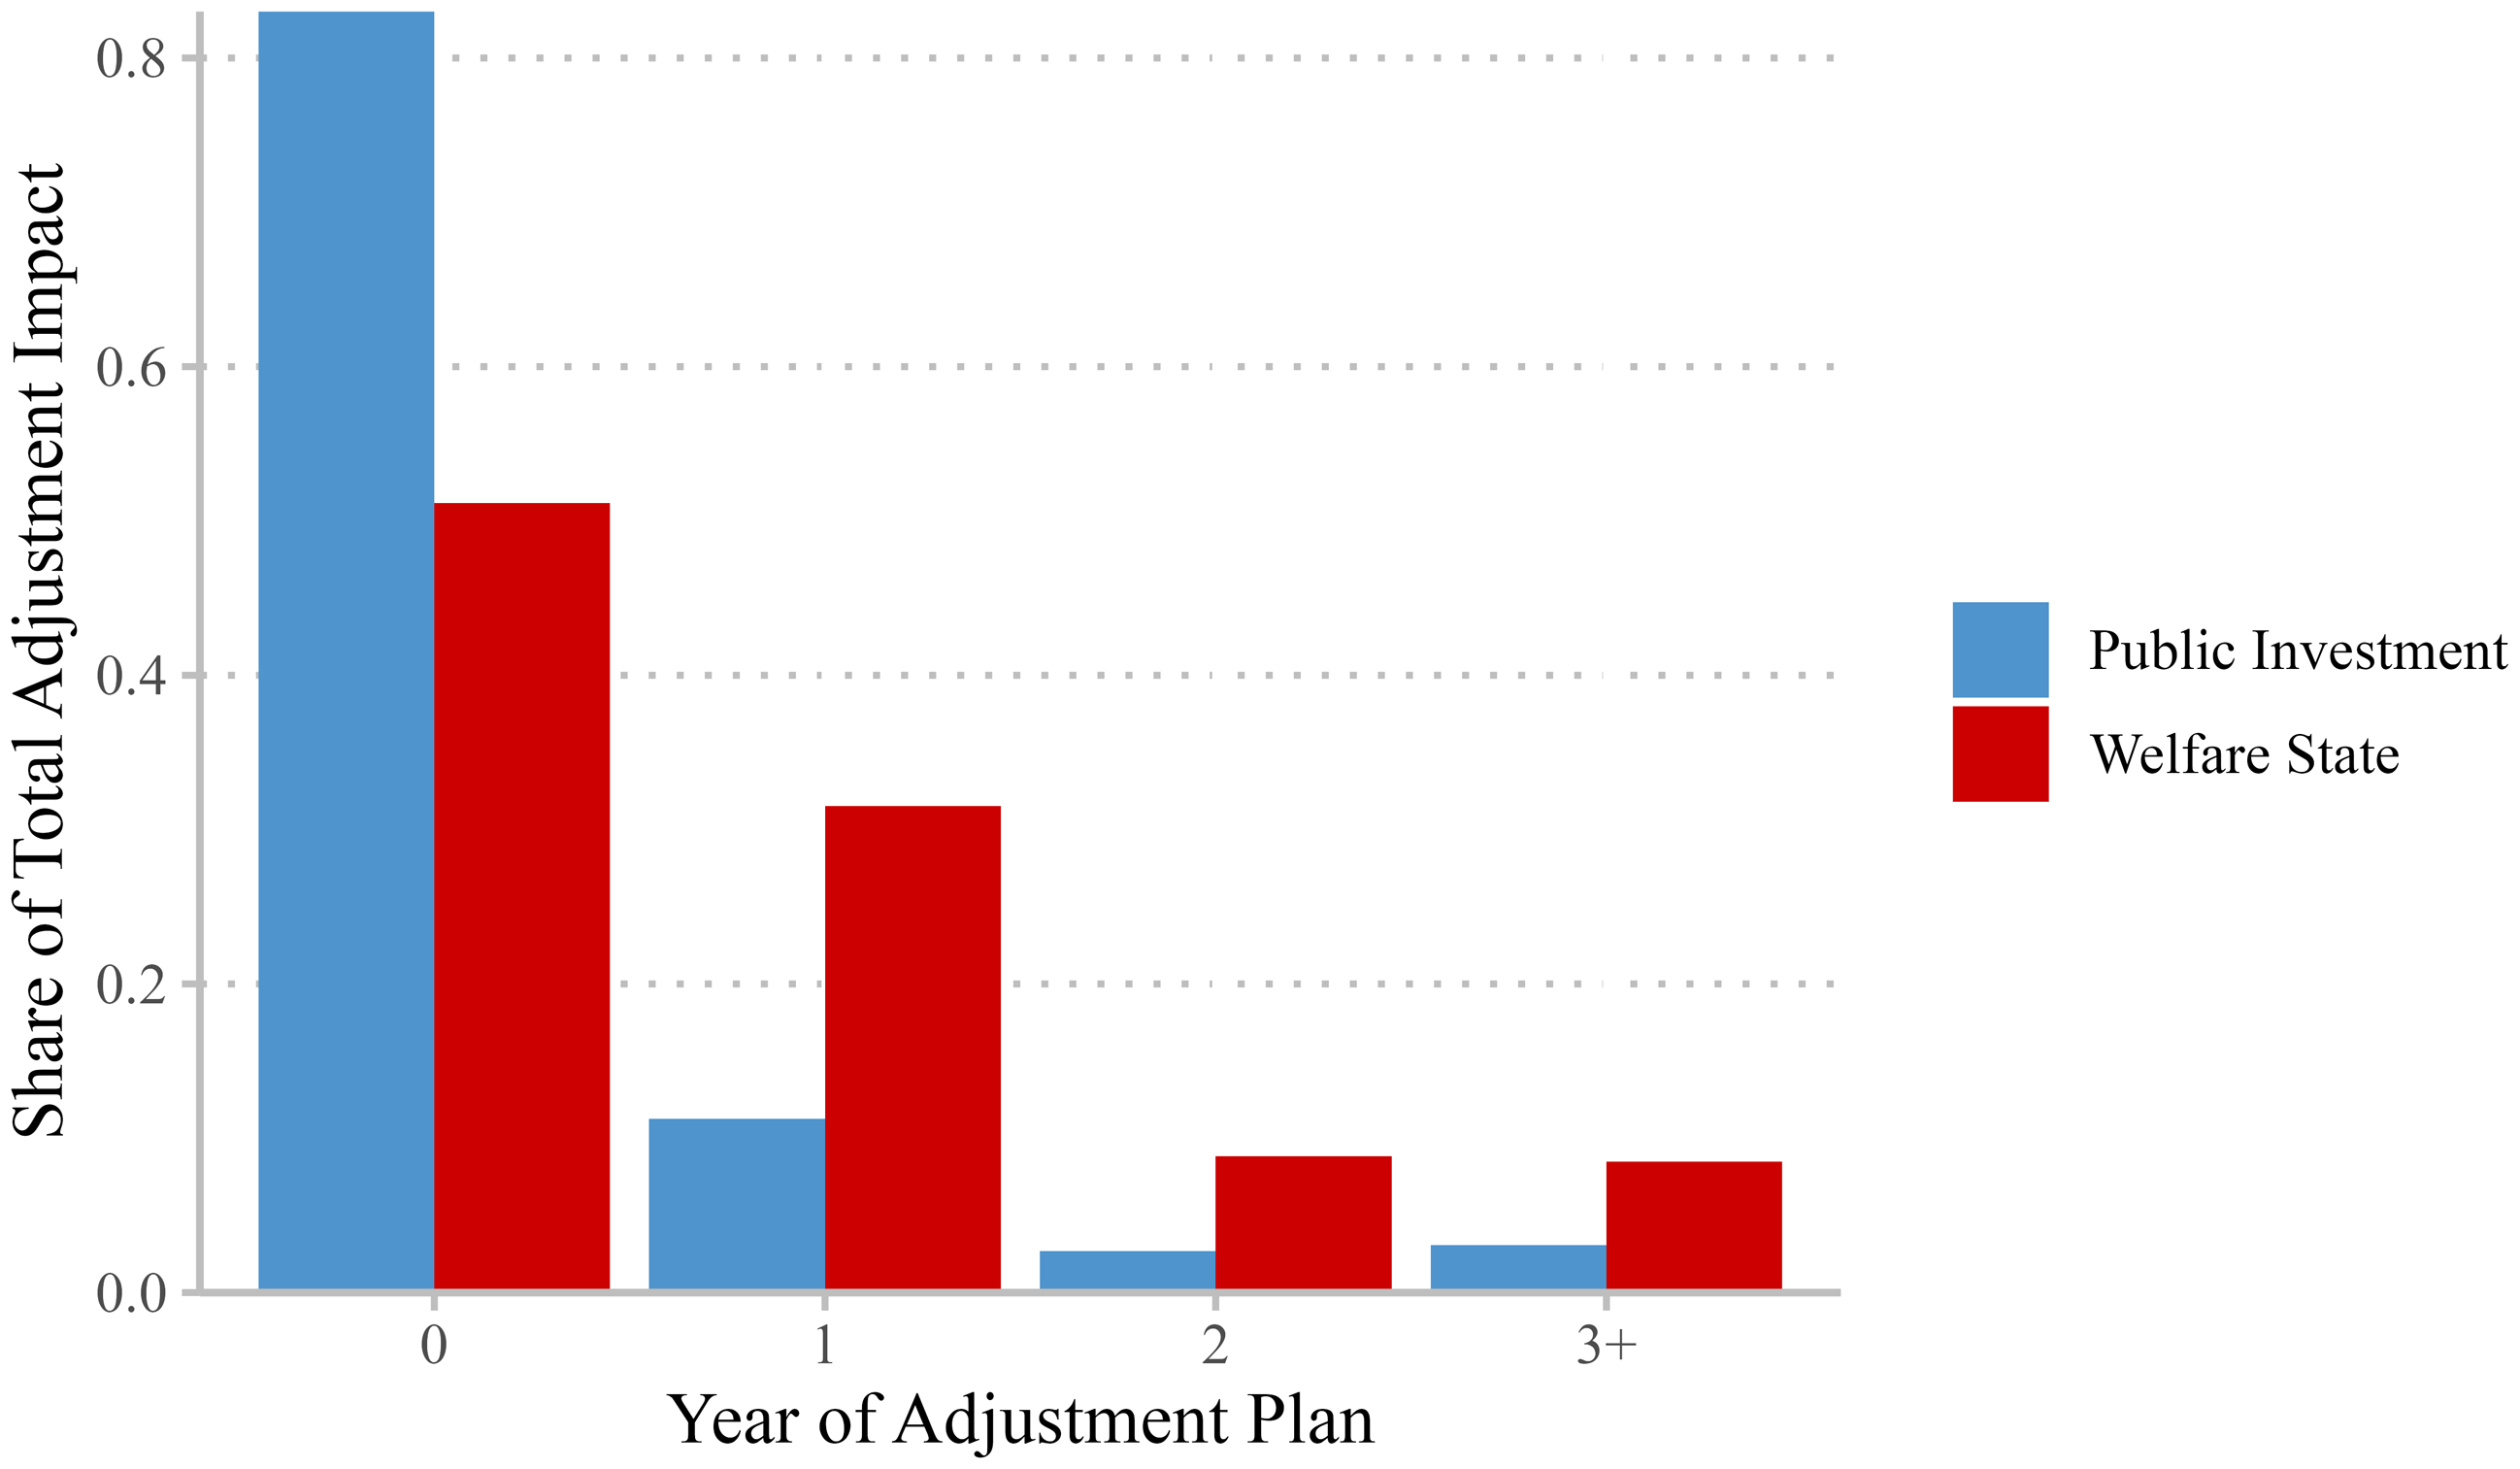
Second, fiscal consolidations are also often multi-year affairs. That is, governments devise fiscal adjustment plans in which substantial spending cuts come into effect in future budgetary periods (Alesina, Favero and Giavazzi Reference Alesina, Favero and Giavazzi2019b). The composition of the plans recorded by Alesina, Favero and Giavazzi (Reference Alesina, Favero and Giavazzi2019a) shows that 83 per cent of investment cuts occur in the initial year of fiscal adjustment. By contrast, around 50 per cent of social spending cuts constitute policy announcements that are implemented in future periods (Figure 2). The distribution of cutbacks may represent strategic decisions by governments to postpone reductions in social spending or institutional barriers to welfare reform (Breunig and Busemeyer Reference Breunig and Busemeyer2012, 924). In both scenarios, the immediate effects of fiscal adjustment plans on public spending are likely to vary from their impact in the long run. For this reason, I outline an empirical strategy to estimate the effects of fiscal adjustment over time.
Distribution of public investment and welfare state spending cuts by year of the fiscal adjustment plan.
Note: Share of total cutbacks by category across the fiscal adjustment plan; welfare state includes health, pensions, unemployment, family, education, and other benefits; public investment includes investment and R&D expenditures.

How to Estimate Austerity’s Effects over Time
To ascertain the effects of fiscal adjustment on social spending over time, I use time-series cross-sectional data for sixteen advanced economies between 1978 and 2018. I identify fiscal consolidations with the narrative approach (cf. Jacques Reference Jacques2021) and rely on the collection of adjustment plans from Alesina, Favero and Giavazzi (Reference Alesina, Favero and Giavazzi2019c).Footnote 1 Alesina, Favero and Giavazzi (Reference Alesina, Favero and Giavazzi2019a) leverage budget and policy documents to identify fiscal consolidations that represent exogenous changes of taxes and spending concerned with long-term growth and budget deficit reduction (Alesina, Favero and Giavazzi Reference Alesina, Favero and Giavazzi2019b, 146–148). They decompose consolidations into unexpected adjustments implemented in the year of the policy announcement, expected adjustments approved in earlier periods, and announced adjustments for future years. I use the sum of the expected and unexpected fiscal impact, quantified as a percentage of GDP. Finally, I focus on spending adjustments, hence excluding tax increases.
I collect data on social expenditures as a percentage of GDP between 1980 and 2018 (OECD 2021a). To quantify the impact of fiscal adjustment on the welfare state, I focus on social spending but also consider its components. Further, I group various components into clusters of social investment and social consumption. As education expenditures are not included in the OECD definition of social spending but are the most important social investment item, I use data on education spending from Armingeon et al. (Reference Armingeon, Wenger, Wiedermeier, Isler, Knöpfel, Weisstanner and Engler2020), from which I collect all remaining controls.Footnote 2 For a benchmark of social spending cuts, I also shed light on physical public investment in the shape of gross fixed capital formation (GFCF) and research and development (R&D) spending (IMF 2017; OECD 2021b).
Local Projections
Existing studies estimate the effects of fiscal adjustment on government spending with dynamic models and compute short- and long-run multipliers (Jacques Reference Jacques2021; Armingeon, Guthmann and Weisstanner Reference Armingeon, Guthmann and Weisstanner2016). Short-run multipliers capture the immediate impact of fiscal adjustment, while long-run multipliers inform its cumulative impact over time. As dynamic models such as the autoregressive distributed lag model (ARDL) estimate intermediate and long-run multipliers with recursive iterations of the short-run model (Teulings and Zubanov Reference Teulings and Zubanov2014, 498), they potentially misidentify the heterogeneous effects of fiscal adjustment over time. In an ARDL $(p,q)$
, where the dependent variable is regressed on
$(p,q)$
, where the dependent variable is regressed on $p = 1$
lags of itself, an independent variable, and its lags
$p = 1$
lags of itself, an independent variable, and its lags $q = 1$
(De Boef and Keele Reference De Boef and Keele2008, 193), the dynamic multiplier declines geometrically at a rate determined by the autoregressive coefficient in period
$q = 1$
(De Boef and Keele Reference De Boef and Keele2008, 193), the dynamic multiplier declines geometrically at a rate determined by the autoregressive coefficient in period $t + 2$
and the direction of the effect remains unchanged after that. For this reason, models with parsimonious lag orders might fail to capture important temporal variations in how fiscal adjustment affects different expenditure components over the intermediate and long term. This might occur if governments, for example, cut social spending in the later stages of the adjustment plan or reverse unpopular cutbacks in the future.
$t + 2$
and the direction of the effect remains unchanged after that. For this reason, models with parsimonious lag orders might fail to capture important temporal variations in how fiscal adjustment affects different expenditure components over the intermediate and long term. This might occur if governments, for example, cut social spending in the later stages of the adjustment plan or reverse unpopular cutbacks in the future.
Following Jordà (Reference Jordà2005), I turn to local projections (LPs), which are frequently applied in macroeconomic research for their flexibility in estimating dynamic effects over time (Jordà and Taylor Reference Jordà and Taylor2016). In contrast to ARDLs, LPs estimate separate coefficients for each horizon and forecast the outcome $y$
locally at each point
$y$
locally at each point $t + h$
(Jordà Reference Jordà2005, 161–162; Adämmer Reference Adämmer2019, 421). I specify the standard LP estimator in eq: Equation 1, where subscripts
$t + h$
(Jordà Reference Jordà2005, 161–162; Adämmer Reference Adämmer2019, 421). I specify the standard LP estimator in eq: Equation 1, where subscripts $i$
and
$i$
and $t$
denote countries and years. Horizon
$t$
denote countries and years. Horizon $h$
is measured in years after the initial fiscal adjustment.
$h$
is measured in years after the initial fiscal adjustment. ${A_{i,t}}$
is the continuous indicator of spending-based fiscal adjustment and
${A_{i,t}}$
is the continuous indicator of spending-based fiscal adjustment and ${C_{i,t - k}}$
is a vector of controls. I control for unemployment and real GDP growth at
${C_{i,t - k}}$
is a vector of controls. I control for unemployment and real GDP growth at $t + 0$
and with two lags to capture variation in social spending due to the economic environment. I add the population share of the elderly as a control when analyzing healthcare and pensions.
$t + 0$
and with two lags to capture variation in social spending due to the economic environment. I add the population share of the elderly as a control when analyzing healthcare and pensions.
 $$\matrix{ {{\Delta _h}{y_{i,t}} = \alpha _i^h + {\beta ^h}{A_{i,t}} + \sum\limits_{k = 0}^2 \delta _k^h{\kern 1pt} {C_{i,t - k}} + e_{i,t}^h} \hfill \cr } $$
I estimate cumulative multipliers where the endogenous variable at horizon $h = 0,1, \ldots, H - 1$
is defined as
$h = 0,1, \ldots, H - 1$
is defined as ${y_{i,t + h}} - {y_{i,t - 1}}$
, which I write as
${y_{i,t + h}} - {y_{i,t - 1}}$
, which I write as ${\Delta _h}{y_{i,t}}$
(Jordà and Taylor Reference Jordà and Taylor2016). In the baseline specification,
${\Delta _h}{y_{i,t}}$
(Jordà and Taylor Reference Jordà and Taylor2016). In the baseline specification, $H$
is set to 8.Footnote
3
Cumulative multipliers derive from the difference between future outcomes at
$H$
is set to 8.Footnote
3
Cumulative multipliers derive from the difference between future outcomes at $t + h$
and outcomes at their pre-treatment value
$t + h$
and outcomes at their pre-treatment value ${y_{i,t - 1}}$
. For instance, the first horizon at
${y_{i,t - 1}}$
. For instance, the first horizon at $h = 0$
regresses the difference in social spending
$h = 0$
regresses the difference in social spending $y$
between
$y$
between $t + 0$
and
$t + 0$
and $t - 1$
on the treatment at
$t - 1$
on the treatment at $t + 0$
. At
$t + 0$
. At $h = 7$
, the difference between social spending between
$h = 7$
, the difference between social spending between $t + 7$
and
$t + 7$
and $t - 1$
is still regressed on the treatment at
$t - 1$
is still regressed on the treatment at $t + 0$
. The local estimates thereby capture the heterogeneous impact of austerity throughout the adjustment period. For the analysis, I plot the cumulative multipliers
$t + 0$
. The local estimates thereby capture the heterogeneous impact of austerity throughout the adjustment period. For the analysis, I plot the cumulative multipliers ${\beta ^0}, \ldots, {\beta ^7}$
throughout eight horizons. I use panel-corrected standard errors to account for serial correlation and heteroskedasticity. Computationally, I build on the ‘lpirfs’ package in R (Adämmer Reference Adämmer2019).
${\beta ^0}, \ldots, {\beta ^7}$
throughout eight horizons. I use panel-corrected standard errors to account for serial correlation and heteroskedasticity. Computationally, I build on the ‘lpirfs’ package in R (Adämmer Reference Adämmer2019).
Using local projections, I can ascertain whether fiscal adjustment has lasting effects on social spending up to eight years after the initial treatment. However, the estimated multipliers may not reflect the response to a one-unit (or 1 per cent of GDP-sized) consolidation treatment. If adjustment plans span multiple years (Alesina, Favero and Giavazzi Reference Alesina, Favero and Giavazzi2019b, 147–148), the response of $y$
over horizon
$y$
over horizon $t + h$
will contain multiple fiscal impulses that occur within the horizon (Teulings and Zubanov Reference Teulings and Zubanov2014, 505). To recover estimates interpretable as one-unit responses, I follow Teulings and Zubanov (Reference Teulings and Zubanov2014) and use the corrected local projections estimator, which includes leads of each consolidation treatment
$t + h$
will contain multiple fiscal impulses that occur within the horizon (Teulings and Zubanov Reference Teulings and Zubanov2014, 505). To recover estimates interpretable as one-unit responses, I follow Teulings and Zubanov (Reference Teulings and Zubanov2014) and use the corrected local projections estimator, which includes leads of each consolidation treatment ${A_{i,t}}$
between the initial shock and the finite forecast horizon
${A_{i,t}}$
between the initial shock and the finite forecast horizon $H - 1$
as controls: At
$H - 1$
as controls: At $h = 0$
, I estimate the impact of the consolidation shock
$h = 0$
, I estimate the impact of the consolidation shock ${A_{i,t}}$
on
${A_{i,t}}$
on ${y_{i,t + 0}} - {y_{i,t - 1}}$
. For the next horizon, the outcome defined as
${y_{i,t + 0}} - {y_{i,t - 1}}$
. For the next horizon, the outcome defined as ${y_{i,t + 1}}\! - {y_{i,t - 1}}$
is not only affected by
${y_{i,t + 1}}\! - {y_{i,t - 1}}$
is not only affected by ${A_{i,t}}$
, but also by the additional consolidation treatment implemented at
${A_{i,t}}$
, but also by the additional consolidation treatment implemented at $h = 1$
,
$h = 1$
, ${A_{i,t + 1}}$
. Then,
${A_{i,t + 1}}$
. Then, ${y_{i,t + 2}} - {y_{i,t - 1}}$
is regressed on
${y_{i,t + 2}} - {y_{i,t - 1}}$
is regressed on ${A_{i,t + 0}}$
,
${A_{i,t + 0}}$
, ${A_{i,t + 1}}$
, and
${A_{i,t + 1}}$
, and ${A_{i,t + 2}}$
, and so on. As the estimate of
${A_{i,t + 2}}$
, and so on. As the estimate of ${\beta _{l = 0}}$
therefore identifies only the response of social spending to a one-unit shock at
${\beta _{l = 0}}$
therefore identifies only the response of social spending to a one-unit shock at $t = 0$
, I can infer whether a single adjustment has persistent effects over time.Footnote
4
$t = 0$
, I can infer whether a single adjustment has persistent effects over time.Footnote
4
Results
I now present the baseline results on the effects of fiscal adjustment on social spending. The standard local projection estimates in panel (a) of Figure 3 show that fiscal adjustment causes a substantial decline in social spending. In the first horizon $h = 0$
, the multiplier indicates that fiscal adjustment reduces social spending by 0.37 percentage points. This effect nearly triples by the eighth horizon, showing that austerity has lasting effects on social spending that are not fully discernible in its early stages. The multipliers suggest that a fiscal adjustment equivalent to 1 per cent of GDP can reduce social spending by up to 1.2 per cent of GDP in the long run.
$h = 0$
, the multiplier indicates that fiscal adjustment reduces social spending by 0.37 percentage points. This effect nearly triples by the eighth horizon, showing that austerity has lasting effects on social spending that are not fully discernible in its early stages. The multipliers suggest that a fiscal adjustment equivalent to 1 per cent of GDP can reduce social spending by up to 1.2 per cent of GDP in the long run.
Cumulative responses of social spending to fiscal adjustment; LP estimates.
Note: Bands represent 90 and 95 per cent confidence intervals; LP estimates of A i,t following Equation 1 and corrected LPs (see Appendix). Controls for unemployment rate and real GDP growth. The table is available in the Appendix.

The LP estimates confirm that average fiscal adjustments persistently reduce social spending, contrasting with previous research, which found evidence of social spending retrenchment only in large adjustment plans or none at all (Armingeon, Guthmann and Weisstanner Reference Armingeon, Guthmann and Weisstanner2016; Jacques Reference Jacques2021). However, these estimates do not reflect the response to a single-unit shock but rather the cumulative impact of multiple adjustments within the multi-year plan across the forecast horizon. To isolate the effect of a one-unit treatment, I use corrected LPs to control for all intermediate adjustments between $h = 0$
and
$h = 0$
and $h = 7$
, providing a robustness check on whether the initial adjustment is sustained.
$h = 7$
, providing a robustness check on whether the initial adjustment is sustained.
The corrected LP estimates in Figure 3 demonstrate that a one-unit fiscal adjustment treatment remains associated with lower levels of social spending throughout the forecast horizon. The multipliers no longer increase over time because they now exclusively capture the initial consolidation impact. They continue to vary considerably between $ - 0.30$
and
$ - 0.30$
and $ - 0.65$
and remain statistically significant in all but the fourth horizon. Averaging across horizons, corrected LP estimates indicate that a one-unit increase in fiscal adjustment reduces social spending by 0.45 percentage points, which implies that a 1 per cent of GDP-sized adjustment lowers social spending by 0.45 per cent of GDP. The protection of social spending from austerity is therefore limited.
$ - 0.65$
and remain statistically significant in all but the fourth horizon. Averaging across horizons, corrected LP estimates indicate that a one-unit increase in fiscal adjustment reduces social spending by 0.45 percentage points, which implies that a 1 per cent of GDP-sized adjustment lowers social spending by 0.45 per cent of GDP. The protection of social spending from austerity is therefore limited.
In the Appendix, I correct for economic growth throughout the forecast horizon and run jackknife tests to ensure that the results are not driven by an outlier. This confirms that when governments turn to fiscal adjustment, they successfully reduce social spending in the long run. I also show that ARDLs yield broadly similar results, but they can differ substantially from LPs when social spending cuts occur during the intermediate stages of fiscal adjustment. In the UK, where less than half of social spending cuts are implemented in the year of policy announcement, ARDLs indicate no significant reduction in social spending, while LPs document a substantial decline.Footnote 5
The Composition of Austerity
The initial findings suggest that governments achieve significant reductions in social spending during fiscal adjustment. However, following the logic of blame avoidance, they might still be inclined to impose greater adjustment burdens on public investment (Jacques Reference Jacques2021). This logic also suggests that governments may achieve the documented reduction in social spending by cutting welfare state programmes that, unlike pensions and healthcare, are not safeguarded by powerful constituencies.
To explore this implication, I first decompose social spending into social consumption and social investment to distinguish between traditional social expenditures and human capital investments, as the former should be more protected from retrenchment.Footnote 6 Second, following Jacques (Reference Jacques2021, 559), I divide social consumption into life cycle and labour insurance. The former includes healthcare and old-age spending, typically more shielded from cuts, while the latter encompasses expenditures more explicitly targeted at poorer households. Third, I also estimate austerity’s impact on physical investment spending, the spending component that receives no protection from mass constituencies.
First, the estimates presented in Figure 4 show that fiscal adjustments result in permanent reductions in both social consumption and investment spending, with social consumption bearing a larger share corresponding to its budgetary weight. Life cycle and labour market insurance, the core of the traditional welfare state, are significantly affected by austerity. While the cumulative multipliers for social investment remain negative, they are only statistically significant in the first two horizons. Including education, spending reveals a steeper decline in social investment. Consistent with prior research, fiscal adjustment also lowers public investment, although the intermediate multipliers are not statistically significant (Jacques Reference Jacques2021; Breunig and Busemeyer Reference Breunig and Busemeyer2012).
Cumulative responses of social consumption and (social) investment.
Note: Bands represent 90 and 95 per cent confidence intervals; y-axis scales deviate for social consumption and social investment, excl. education.

Second, fiscal adjustments affect social spending and investment with different intensities over time, indicating that governments target these components at different stages of the adjustment plan. In the short run, the decline in physical investment exceeds the decline in life cycle insurance in absolute terms, although advanced democracies spend more than three times as much on pensions and healthcare. Yet, over the forecast horizon, social consumption cuts grow larger so that austerity’s investment bias shrinks. Supplementary evidence in the Appendix (Figure A16) corroborates that, while investment is sharply reduced in the short term and remains permanently below its pre-adjustment level, social spending cuts catch up in both relative and absolute terms. Especially in the long run, the primary burden of fiscal adjustment falls on traditional welfare state expenditures.
The timing of social spending and public investment cuts may explain why previous studies have disagreed on the impact of fiscal adjustments on the welfare state. As reductions in social spending unfold with significant delay, models that do not adequately account for the time-varying effects of austerity potentially underestimate its long-term effects. This delayed reduction in social spending extends the argument that governments initially prioritize discretionary investment cuts because welfare spending is often rooted in legal entitlements, which are difficult to retrench (Breunig and Busemeyer Reference Breunig and Busemeyer2012). As these constraints ease over time, social spending cuts become more prevalent.
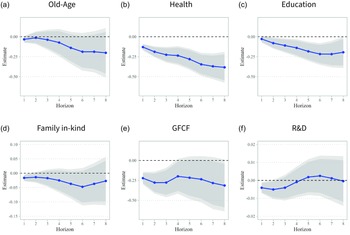
Third, the decompositions in Figure 5 highlight that the effects of fiscal adjustment vary significantly within each spending cluster. Fiscal adjustments cause a pronounced reduction in health spending, amounting to 0.38 percentage points at $h = 7$
, which sharply exceeds austerity’s impact on pensions. This shows that although old-age and healthcare spending both enjoy broad support (Bansak, Bechtel and Margalit Reference Bansak, Bechtel and Margalit2021; Hübscher, Sattler and Wagner Reference Hübscher, Sattler and Wagner2021), their vulnerability to fiscal adjustments is markedly uneven. For social investment, the multipliers reveal a sustained decrease in education spending, while consolidations only slightly reduce childcare investments (family in-kind spending). Here, too, the impact of austerity diverges from citizens’ fiscal priorities (Bremer and Bürgisser Reference Bremer and Bürgisser2023). The negative impact of fiscal adjustment on physical investment is driven by GFCF, whereas R&D spending recovers from its reduction in the short run.
$h = 7$
, which sharply exceeds austerity’s impact on pensions. This shows that although old-age and healthcare spending both enjoy broad support (Bansak, Bechtel and Margalit Reference Bansak, Bechtel and Margalit2021; Hübscher, Sattler and Wagner Reference Hübscher, Sattler and Wagner2021), their vulnerability to fiscal adjustments is markedly uneven. For social investment, the multipliers reveal a sustained decrease in education spending, while consolidations only slightly reduce childcare investments (family in-kind spending). Here, too, the impact of austerity diverges from citizens’ fiscal priorities (Bremer and Bürgisser Reference Bremer and Bürgisser2023). The negative impact of fiscal adjustment on physical investment is driven by GFCF, whereas R&D spending recovers from its reduction in the short run.
Cumulative responses of additional spending decompositions.
Note: Bands represent 90 and 95 per cent confidence intervals; y-axis scales deviate for family in-kind and R&D spending.

Overall, the results do not indicate that governments systematically shift the burden of adjustment onto spending components that, due to their higher investment content, are less protected by broad constituencies. Fiscal adjustment plans seem to follow neither the ‘path of least resistance’ (Jacques Reference Jacques2021) nor that of maximal recalibration but achieve an encompassing reduction in public spending.
When is Retrenchment Possible?
Fiscal consolidations persistently reduce social spending, but the conditions under which such reforms become politically feasible remain ambiguous. As generous social policies, which may themselves affect welfare attitudes, depend on public approval (Brooks and Manza Reference Brooks and Manza2006; Breznau Reference Breznau2017), sustainable reforms likely require shocks that reduce support for the welfare state. Beyond personal economic shocks (Margalit Reference Margalit2013), spending preferences are shaped by macroeconomic conditions and the extent of welfare state development. Wlezien and Soroka (Reference Wlezien and Soroka2021) show that rising unemployment boosts support for welfare spending, while higher expenditures reduce it. Breznau (Reference Breznau, Roesma and Laenen2023) shows that earlier welfare state development is associated with lower levels of support today.
In this context, I argue that the execution of fiscal adjustment plans in periods of macroeconomic and fiscal distress facilitates welfare state retrenchment. Fiscal crises and other economic shocks, which impose substantial economic costs, typically weaken political resistance to reforms among both voters and party elites (Drazen and Grilli Reference Drazen and Grilli1993; Haffert Reference Haffert2019; Bremer and McDaniel Reference Bremer and McDaniel2020). Since such crises trigger higher short-term expenditures through automatic stabilizers, they may also prompt a sharper decline in public support for social spending, particularly in mature welfare states (Wlezien and Soroka Reference Wlezien and Soroka2021; Breznau 2023). Thus, fiscal adjustments are likely to be more effective in curbing social spending when undertaken in the context of macroeconomic distress.
To test this, I use state-dependent local projections (Jordà and Taylor Reference Jordà and Taylor2016) to estimate multipliers for fiscal adjustments following systemic financial crises and those implemented under normal conditions, as financial crises put significant pressure on public finances (Schularick Reference Schularick2012). A fiscal adjustment is classified as post-crisis if implemented within five years of the crisis. I then examine deficit episodes and recessions, with deficits indicating fiscal pressure and recessions reflecting economic shocks that do not necessarily have profound fiscal effects.
 $$F({z_{i,t}}) = {{\exp ( - {\gamma _i}{\kern 1pt} {z_{i,t}})} \over {1 \!+ \exp ( - {\gamma _i}{\kern 1pt} {z_{i,t}})}},{\kern 1pt} \gamma \gt 0$$
 $${\sigma ^2}({z_{i,t}}) = 1,{\kern 1pt} E({z_{i,t}}) = 0$$
 $$\matrix{ {{\Delta _h}{y_{i,t}}}\!\!\!\! \hfill & { = \alpha _i^h + I(F({z_{i,t}} \gt 0.8))[{\kern 1pt} \beta _a^h{A_{i,t}} + \sum\limits_{k = 0}^2 \delta _{a,k}^h{\kern 1pt} {C_{i,t - k}}]} \hfill \cr {} \hfill & { + I(F({z_{i,t}} \lt \!\!\!= 0.8))[{\kern 1pt} \beta _b^h{A_{i,t}} + \sum\limits_{k = 0}^2 \delta _{b,k}^h{\kern 1pt} {C_{i,t - k}}] + e_{i,t}^h} \hfill \cr } $$
I use the logistic function in eq: Equation 2 with the standardized variable ${z_{i,t}}$
to estimate state probabilities, which serve to identify recessions and deficit episodes (Auerbach and Gorodnichenko Reference Auerbach and Gorodnichenko2012). Following Auerbach and Gorodnichenko (Reference Auerbach and Gorodnichenko2012, 5), I then calibrate parameter
${z_{i,t}}$
to estimate state probabilities, which serve to identify recessions and deficit episodes (Auerbach and Gorodnichenko Reference Auerbach and Gorodnichenko2012). Following Auerbach and Gorodnichenko (Reference Auerbach and Gorodnichenko2012, 5), I then calibrate parameter $\gamma $
so each economy spends 20 per cent of the sample period in a recession or deficit regime with
$\gamma $
so each economy spends 20 per cent of the sample period in a recession or deficit regime with $Pr(F({z_{i,t}}) \gt 0.8 = 0.2)$
. The intuition is to identify years for each country in which a recession or a deficit crisis was most likely, given real GDP growth or the budget balance.
$Pr(F({z_{i,t}}) \gt 0.8 = 0.2)$
. The intuition is to identify years for each country in which a recession or a deficit crisis was most likely, given real GDP growth or the budget balance. $I(F({z_{i,t}} \gt 0.8))$
and
$I(F({z_{i,t}} \gt 0.8))$
and $I(F({z_{i,t}} \le 0.8))$
in Equation 4 indicates whether the economy is in a recession (deficit) regime or not.
$I(F({z_{i,t}} \le 0.8))$
in Equation 4 indicates whether the economy is in a recession (deficit) regime or not.
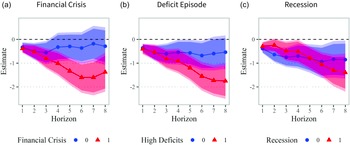
Figure 6 shows that fiscal consolidations reduce social spending more in the long run if they are implemented in the context of financial crises or large budget deficits. After financial crises, the cumulative impact of fiscal adjustment grows as large as 1.75 percentage points. This state-dependent difference in social spending responses is less pronounced for recessions, which could indicate that crises without salient fiscal consequences do not result in more ambitious reforms. This aligns with public opinion evidence suggesting that while rising unemployment increases support for spending, higher public debt weakens it (Wlezien and Soroka Reference Wlezien and Soroka2021; Roth, Settele and Wohlfahrt Reference Roth, Settele and Wohlfahrt2022).
State-dependent impulse responses of social spending.
Note: State-dependent local projection estimates following Jordà and Taylor (Reference Jordà and Taylor2016); bands represent 90 and 95 per cent confidence interval; estimates based on Equation 4.

Although the cumulative decline in social spending after financial crises and deficit episodes suggests that crises foster successful reforms, it could also reflect the greater magnitude of crisis-driven consolidation plans. If so, other spending items should decline more strongly after crises as well, but this is not the case. In the Appendix, I document that under crisis conditions, the short-run reduction in public investment incurred by austerity is reversed in the long run (Figure A22). While macroeconomic distress forces governments into public investment cuts in the short run, it also opens a window of opportunity for lasting reforms of welfare state spending.
Conclusion
This letter shows that fiscal consolidations result in substantial and lasting reductions in social spending over time. To make sense of this finding, I highlight two key aspects of fiscal adjustment plans in advanced democracies that shape their budgetary effects. First, as adjustment plans are multi-year affairs and some budget items are more difficult to retrench in the short run than others, they target investment first and social spending second. Thus, while I document that fiscal adjustment reduces public investment in the short run, social spending cuts become prevalent over time. Second, when austerity is due to fiscal distress, as is often the case, it leads to larger reductions in social expenditures, indicating that crises facilitate welfare reform. However, the mechanism behind this pattern remains poorly understood. Do crises generate support for welfare state reform, or do they decouple policy from public opinion? To this end, future research should closely examine the contextual determinants of sustainable welfare reforms and how the success of fiscal adjustments varies across countries.
Supplementary material
The supplementary material for this letter can be found at https://doi.org/10.1017/S0007123425000018
Data availability statement
Replication data for this letter can be found in Harvard Dataverse at https://doi.org/10.7910/DVN/YLYF9K.
Acknowledgements
I am grateful to the editor and three anonymous reviewers for their invaluable comments and suggestions. I also thank Erik Neimanns, Björn Bremer, and Lukas Haffert for their insightful feedback and advice.
Financial Support
None.
Competing Interests
None.


 Open access