

1 Introduction
As acceptance rates at prestigious universities have hit record lows (Reference JacksonJackson, 2017), time and resources have become precious commodities among students preparing for college. One strategy they can use is to focus on a select few courses, which would result in variable grades (e.g., an A in Chemistry but a C in English). Alternatively, students can distribute their resources evenly across all courses, resulting in more homogeneous grades (e.g., B’s in both Chemistry and English). Which outcome would be perceived more favorably by other people?
We propose that with all else being equal, people tend to prefer a student with homogeneous grades to a student with varying grades. Existing literature in Psychology, however, offers mixed answers. This section first discusses reasons why people may prefer a consistent person and reviews the existing literature.
1.1 Reasons for Preferring a Student with Homogeneous Grades
People may prefer a student with homogeneous grades to a student with highly varying grades for several reasons. A student with more uniform grades appears more responsible, hard-working, and disciplined. People are generally averse to uncertainty and risks, as has been well-documented in the field of judgments and decision-making (e.g., Baron, 2008). Perhaps this aversion extends even towards other people who take risks, and the student displaying more erratic grades may appear to be undisciplined risk-takers.
In addition, when making choices concerning matters requiring a long-term perspective, such as college admissions, uniform grades appear to be a better predictor for future performance, since they provide more consistent and reliable data points for the prediction. When grades are highly varying, showing all possible ranges, people may feel uncomfortable making predictions based on the average grade. Similarly, people dislike an option with a range of probabilities (e.g., an option that has no chance of winning in the worst possible scenario and a 2/3 chance of winning in the best possible scenario; Reference EllsbergEllsberg, 1961). A student showing consistent performance simply looks more predictable, and thus may feel like a less risky choice.
Furthermore, a student with varying grades has by definition more negative grades than a student with uniform grades when controlling for GPA. Past studies on impression formation suggest that people may favor a student with uniform grades over a student with variable grades because of the robust negativity bias. The negativity bias means that when positive and negative events are equally present, the overall impression becomes negative (e.g., Anderson, 1965; Reference Peeters and CzapinskiPeeters & Czapinski, 1990). This negativity bias has been observed outside the scope of impression formation (Baumeister, Bratslavsky, Finknauer & Vohs, 2001). Loss looms larger than gains in that people are more upset about losing $100 than they are happy about gaining $100 (Reference Tversky and KahnemanTversky & Kahneman, 1991). Bad events or misfortune wear off more slowly than good events (Reference TaylorTaylor, 1991). The negativity bias has been argued to be evolutionarily adaptive; organisms that were more sensitive to negative features such as threats would have survived better (e.g., Baumeister et al., 2001). Given the negativity bias, the A that the student with highly variable grades receives in Chemistry may not balance out the damage caused by the C the student receives in English.
1.2 Reasons for Preferring a Student with Heterogeneous Grades
Nevertheless, there is an exception to this negativity bias. When judging the competency of other people, positive information appears to be weighed more than negative information (e.g., Reeder, Messick & van Avermaet, 1977). One reason for this exception discussed in the previous literature is that a demonstration of competency, such as speaking four different foreign languages fluently or having several essays published in the New Yorker, is fairly diagnostic evidence that the person is skillful, because it is unlikely that an incompetent person would achieve such accomplishments. Yet, failure to demonstrate competency, such as getting Fs on most of his final exams in high school, can be ambiguous since it can be due to situational or motivational factors, such as illness or personal problems (Reference Skowronski and CarlstonSkowronski & Carlston, 1987, 1989). If the positivity bias extends to judging college applicants based on grades such that people overweigh positive grades as they are more diagnostic, a student with some A’s despite some C’s would be favored over a student with only B’s.
However, the positivity bias found in the earlier studies may not generalize to the situation that the current study examines. The positive traits used in the aforementioned studies demonstrating the positivity bias were truly exceptional accomplishments, making them highly diagnostic. In contrast, receiving A’s through a typical high school curriculum can still be ambiguous evidence for competency; the teacher may have been generous, the exams may have been too easy, or the student may have received extra help. If high grades are not any more diagnostic of competency than the low grades, the positivity bias may not emerge.
Another reason why people might favor a student with variable grades over a student with uniformly moderate grades is that people tend to find more complex stimuli more interesting and invoking of curiosity (Reference BerlyneBerlyne, 1971; Reference SilviaSilvia, 2006). A student who presents highly variable grades would appear more complex, and therefore more interesting and perhaps even more positively—as creative and passionate individuals whose grades reflect their complexity—than a student who only has similar grades across the board.
Indeed, in the U.S. today, a fairly well-accepted notion is that students should pursue their passion in one specific area. For instance, the undergraduate admissions policy of Yale University, prepared in 1967 by then-president, Kingman Brewster, and still in use for the admissions committee, states, “…we want as many of them as possible to become truly outstanding in whatever they undertake. It may be in the art and science of directing the business or public life of the country, or it may be in the effort to improve the quality of the nation’s life by the practice of one of the professions …. the candidate is likely to be a leader in whatever he ends up doing.” Articles and information sessions during college tours abound highlighting the importance of passion in prospective college students. Rejecting the notion that colleges want “well-rounded” students, a Washington Post article states, “Colleges want a kid who is devoted to — and excels at — something. The word they most often use is passion” (Reference CohenCohen, 2011). A U.S. News’s article also listed passion as the number one way to bolster one’s chances at college admissions (Reference MollMoll, 2014). A student with A’s on certain subjects, albeit C’s in others, would display more passion and enthusiasm — reflected by the subjects they excel in — than a student with uniform average grades.
Nonetheless, these factors may play a role only when the student does not show obvious problems. Enthusiasm, excellency in a specific field, and interestingness are all positive traits that can be inferred from a heterogeneous transcript displaying some very high grades, but for many evaluators, the robust negativity bias may counteract these positive traits as well.
1.3 Overview of Experiments
Thus, the current study examines whether the negativity bias operates even in a domain where there are several reasons that such a bias may not be obtained. The current study presented laypeople, undergraduate students, and college admissions officers with hypothetical transcripts of two high school students differing in the variability of their grades, while keeping their overall GPAs the same. Participants judged which one they would admit to a college: the one with heterogeneous grades or the one with homogeneous grades. They also evaluated these students on various dimensions (e.g., interestingness, creativity, passion, risk-taking, reliability, GPA in college, predictions on income in the future). Our hypothesis was that, given that high grades in high school may not be as diagnostic as the positive traits used in earlier studies demonstrating the positivity bias, people would prefer a homogeneous student with fewer negative grades due to the robust negativity bias. In addition, the student with homogeneous grades would also be likely to be perceived as more reliable and consistent, appearing more favorable in decision-making situations requiring long-term perspectives.
2 Study 1
2.1 Methods
Participants
In estimating the sample size, we failed to find any comparable study using student grades as stimuli, so in each population we aimed for 100–150 participants, as in typical higher-level reasoning studies. Through Amazon.com’s Mechanical Turk, 140 participants were recruited, receiving a small fee. Data from 126 participants are reported after exclusions (see below for the criteria). Through an introductory Psychology course at an Ivy League college, 155 participants were recruited, receiving a partial credit for the course. Data from 150 participants are reported after exclusions. Through the National Association for College Admission Counseling (NACAC), 104 admissions officers were recruited across the U.S, receiving a $10 Amazon.com gift certificate. Data from 101 participants are reported after exclusion. See Appendix A for demographic information.
Stimuli
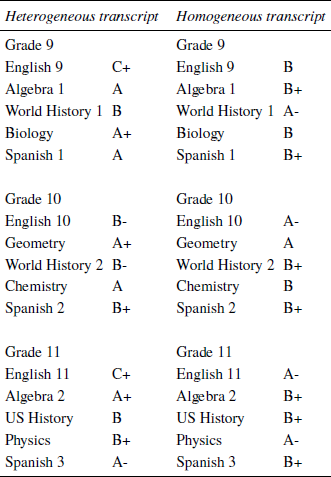
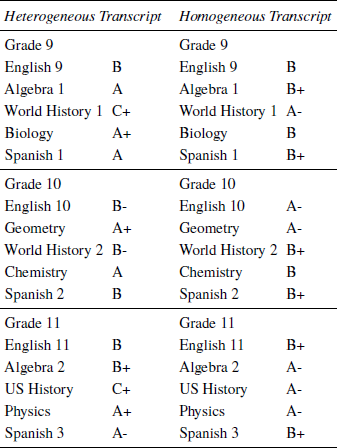
Participants saw two transcripts each showing grades of high school students during grades 9–11. Both transcripts had an overall GPA of 3.4/4.0. One transcript was highly variable (heterogeneous, henceforth), with very high grades in some subjects, and very low grades in other subjects. The other transcript was more uniform (homogeneous, henceforth). Two sets of transcripts were developed, so that the grades received in each particular course were varied between the sets. Figure 1 shows Set 1, and Appendix B shows Set 2. Each participant received either Set 1 or Set 2, and because no significant differences were found involving the two sets, this distinction are not further considered.
Sample Stimuli Used in Study 1 (Set 1). KC’s transcript shows heterogeneous grades and TJ’s transcript shows homogeneous grades. Which initials were paired with which transcript (heterogeneous or homogeneous) was counterbalanced across participants.
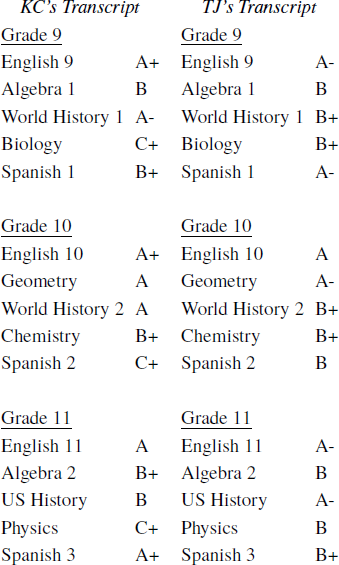
Within each set, the two transcripts were presented side-by-side as shown in Figure 1, and the left/right position of the heterogeneous and the homogeneous transcript was counterbalanced across participants. In referring to the hypothetical students, initials (TJ and KC) were used to be gender-neutral.Footnote 1
Procedure and Dependent Measures
The study was conducted online, through Qualtrics. Participants were first told that they would see transcripts of two high school students who were attending very good public schools in the U.S. Participants then answered questions comparing the two students. The most critical question was their admissions preference: “Suppose you [as a college admissions officer] are asked to make admission decisions based only on transcripts, and you must choose between KC and TJ. Who would you admit?” where the bracketed phrase appeared only with the admissions officer participants. All participants had to choose between the two students.
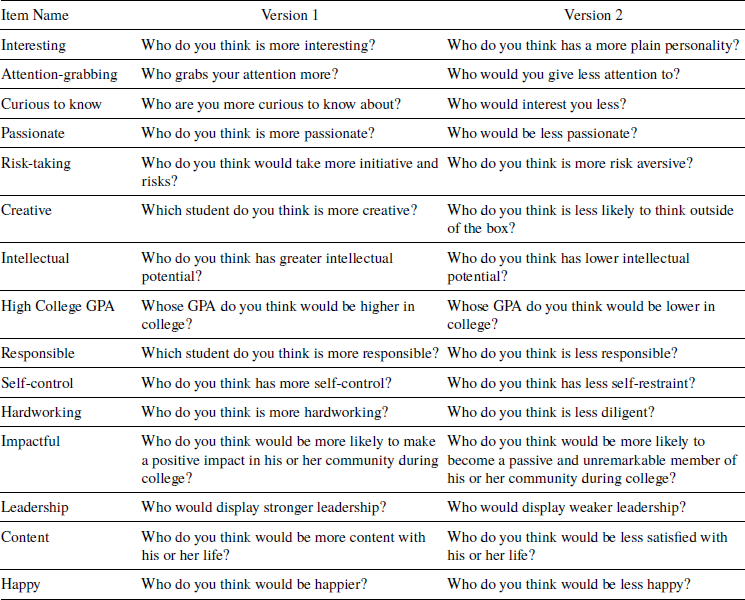
Participants also received other questions comparing the two students. Thirty of these questions are shown in Table 1. These are 15 pairs of questions, each measuring the construct listed under “Item Name.” These 15 constructs were selected by the researchers as potential factors for which variability in grades may be relevant and may reveal possible reasons for the participants’ admissions decisions. Within each pair, there were two versions framed in an opposing way. Responses to Version 2 were reverse-coded and collapsed with responses to Version 1 in data analyses. (The correlations between the two versions for each item were all negative for both Studies 1 and 2.)
Participants also made predictions about occupations and income level of these students after college. Three levels of occupations were developed using the Hollingshead Index (1975)Footnote 2; (1) Higher Executives, Mid-Large Business Owners, Professionals (e.g. chairpersons, government officials, lawyers, doctors, chemical engineers, musicians), (2) Small Business Owners, Technicians, Clerical and Sales Workers (e.g. deli or laundromat owners, carpenters, electricians, secretaries, dental assistants, salesmen), (3) Semi-skilled or Unskilled Workers (e.g., bulldozer operators, bus drivers, hairdressers, fishermen, janitors, cleaners). Five levels of income were used; Less than $40,000, $40,000~$60,000, $60,000~$100,000, $100,000~$500,000, and More than $500,000.Footnote 3 For each of these levels, participants indicated who would be more likely to have those occupations or make that level of income.
In answering the 30 questions in Table 1 and 7 questions concerning occupations and income, participants received a 7-point scale as follows;
At the outset, participants learned that selecting “(2)” or “(1)” immediately to the right of “Definitely KC” (or immediately to the left of “Definitely TJ”) would indicate that they thought KC (or TJ) still was a better choice, but to a diminishing extent, and that selecting (0) would indicate no difference between the two applicants. In analyzing data, ratings preferring the homogeneous student were subtracted from 0 with -3 being the maximum preference for the homogeneous student.
Each of the 30 questions in Table 1 was presented on a separate screen page with the transcripts of the two students displayed at the bottom of each page. The 3 questions on occupations were presented together on the same page and so were the 4 questions on income, with the transcripts displayed at the bottom. Participants received these 32 pages in an order randomized for each participant.
After answering all these questions, participants were asked whose GPA was higher. The transcripts were not re-presented for this question. Their choices were KC’s, TJ’s, and “Neither was higher”.
Afterwards, participants received attention checks where they saw four questions and judged whether they had seen each during the study. Only two of these were actually presented. Those who answered incorrectly on two or more questions were excluded from the data analyses.
In addition to reporting basic demographic information, admissions officers reported the average GPA, SAT score (out of 2400, which was more familiar when Study 1 was conducted), and ACT score of students who are admitted to their institutions. Quintile ranks for these scores were averaged to come up with three different categories of the institutions (High, Medium, and Low). The overall means as well as means broken down by these categories are reported in Appendix A.
2.2 Results and Discussion
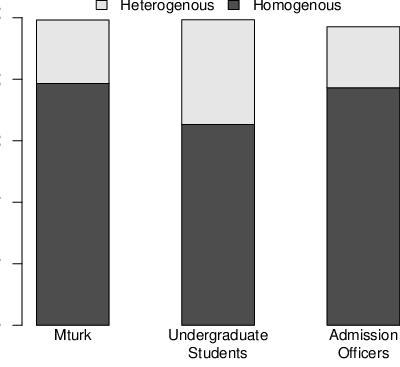
As illustrated in Figure 2, a significantly greater portion of participants within each of the three groups preferred to admit a homogeneous student over a heterogeneous student (78.6% for Mturk workers, 65.3% for undergraduate students, and 77.2% for admissions officers) although their actual GPAs were the same. Binomial tests against 50% showed p = 7.4e-11 for Mturk workers, p = .000119 for undergraduate students, and p = .00000002 for admissions officers. Relative risks were 1.57, 1.31, and 1.54, respectively. For admissions officers, this pattern did not depend on the competitiveness of their own institutions (82.9% in “High,” 75.0% in “Medium,” and 78.3% in “Low” preferred the homogeneous student).
Percentages of the Heterogeneous vs. Homogeneous Student Selected to be Admitted by Each Group of Participants in Study 1
As shown in Table 2, many participants thought the GPA of the homogenous student was higher than that of the heterogeneous student (67.5% for Mturk workers, 43.3% for undergraduate students, and 46.5% for admissions officers). Nonetheless, even among those who thought that neither was higher, a majority of the participants still preferred to admit the homogeneous student (61.1% for Mturk workers, 60.0% for undergraduate students, and 70.2% for admissions officers).

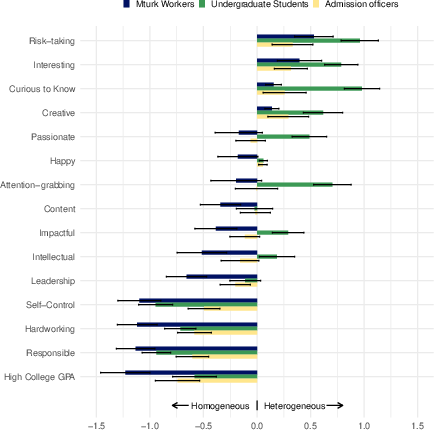
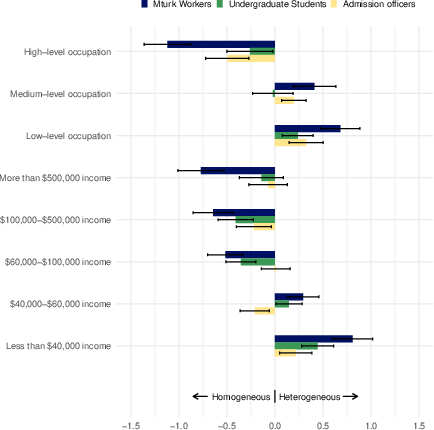
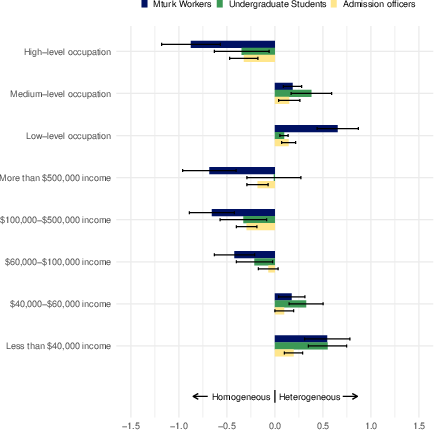
As shown in Figure 3, Footnote 4 all three groups of participants judged that the heterogeneous student was more risk-taking, interesting, creative, and curiosity-invoking than the homogeneous student, while the homogeneous student had greater self-control, would have a higher GPA in college, and was more hardworking and responsible. As shown in Figure 4, the homogeneous student tends to be more strongly associated with high-level occupations and income, whereas the heterogeneous student tends to be associated with low-level occupations and income.
Comparative Judgments between the Heterogeneous vs. Homogeneous Student on Various Traits Broken Down by Each Group of Participants in Study 1. (Note: Negative numbers indicate that the homogeneous student is more likely to have a given trait, and positive numbers indicate that the heterogeneous student is more likely to have a given trait. Error bars show 95% confidence intervals testing the difference against 0.)
Comparative Judgments between the Heterogeneous vs. Homogeneous Student on Future Occupations and Income Broken Down by Each Group of Participants in Study 1. (Negative numbers indicate that the homogeneous student is more likely to have a given trait, and positive numbers indicate that the heterogeneous student is more likely to have a given trait. Error bars show 95% confidence intervals testing the difference against 0.)
3 Study 2
One possible reason why the heterogeneous student was not favored for college admissions in Study 1 is that the heterogeneous student’s transcript did not offer a coherent picture, such as a STEM student or a humanities student.Footnote 5 If the heterogeneous student’s transcript more consistently portrays the student’s passion and talent, the student may be preferred over the homogeneous student. Thus, in Study 2, one heterogeneous transcript had the highest grades mostly in English and History, and the other had highest grades mostly in Mathematics and Science.
3.1 Methods
The methods were the same as in Study 1 except for the following. Out of 141, 123, and 282Footnote 6 participants recruited through Amazon Mechanical Turk, an Introduction to Psychology course at an Ivy League college, and NACAC, respectively, 119, 113, and 266 remained after exclusions. See Appendix A for demographic information.
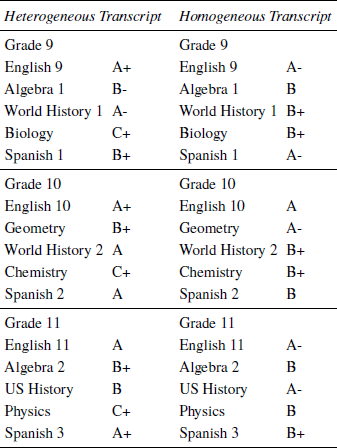
Two new sets of transcripts were developed (see Appendix B). Set 1’s grades for English and History were A+, A, or A- with only one B in History, whereas those for Mathematics and Science ranged from B+ to C+. Set 2’s grades for Mathematics and Science were A+, A, or A- with only one B+ in Mathematics, whereas those for English and History ranged from B to C+.
3.2 Results and Discussion
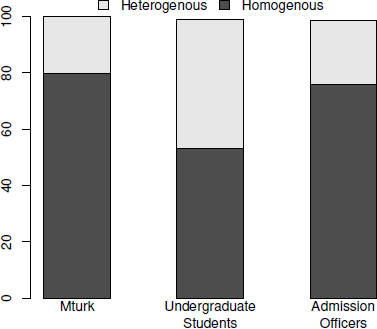
As illustrated in Figure 5, a significantly greater portion of Mturk workers (79.8%) and admissions officers (75.9%) still preferred to admit a homogeneous student to a heterogeneous student (all p’s < 3.4e-11 from binomial tests against 50%, Relative Risk = 1.60 and 1.52, respectively). For admissions officers, this pattern did not depend on the competitiveness of their own institutions (75.2% in “High,” 82.3% in “Medium,” and 69.3% in “Low” preferred the homogeneous student). However, undergraduate students showed no significant difference between the homogeneous student (53.1%) and the heterogeneous student (46.0%).
Percentages of the Heterogeneous vs. Homogeneous Student Selected to be Admitted by Each Group of Participants in Study 2.
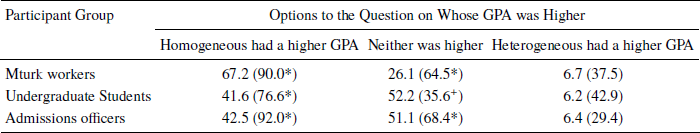
As shown in Table 3, many participants again thought the GPA of the homogenous student was higher than that of the heterogeneous student (67.2% for Mturk workers, 41.6% for undergraduate students, and 42.5% for admissions officers). As in Study 1, even among those who thought that neither was higher, a majority of Mturk workers (64.5%) and Admissions Officers (68.4%) still preferred to admit the homogeneous student. However, among undergraduate students who judged that neither grade was higher, they were significantly more likely to prefer the heterogeneous student for admissions.
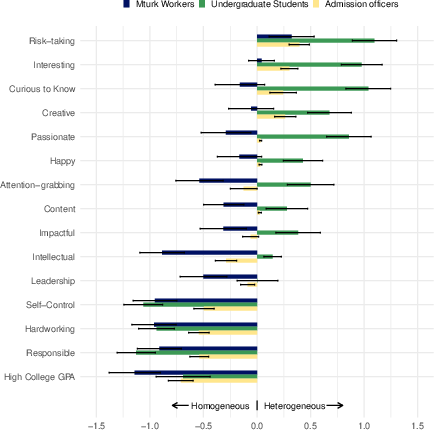
As in Study 1, all three groups of participants judged that the homogeneous student had greater self-control, was more hardworking and responsible, and would have a higher GPA in college. Yet, consistent with the admissions choices, undergraduate students in Study 2 appear to be positive towards the heterogeneous student in more traits than Mturk workers and admissions officers (i.e., interesting, curious to know, creative, passionate, happy, attention-grabbing, content, impactful, intellectual; see Figure 6). Nonetheless, in all three groups of participants including undergraduate students, the heterogeneous student was judged to be more risk-taking, and tends to be more likely to be associated with low-level occupation and income (Figure 7).
Comparative Judgments between the Heterogeneous vs. Homogeneous Student on Various Traits Broken Down by Each Group of Participants in Study 2. (Lower numbers indicate that the homogeneous student is more likely to have a given trait, and higher numbers indicate that the heterogeneous student is more likely to have a given trait.)
Comparative Judgments between the Heterogeneous vs. Homogeneous Student on Future Occupations and Income Broken Down by Each Group of Participants in Study 2. (Lower numbers indicate that the homogeneous student is more likely to have a given trait, and higher numbers indicate that the heterogeneous student is more likely to have a given trait.)
4 Study 3
The results so far provided support for the negativity bias account; negative grades are weighted heavier than positive grades, making the heterogeneous student less favorable than the homogeneous student who does not have such negative grades. In the final experiment, we test a recent theory of judgments based on the binary bias (Reference Fisher and KeilFisher & Keil, 2018) and also attempt to replicate the current findings using different procedures and stimuli, while exploring possible individual differences.
A recent study demonstrated that people impose binary distinctions (e.g., good or bad) on continuous data (e.g., 1 star, 2 stars, … 5 stars; Reference Fisher and KeilFisher & Keil, 2018), and this binary bias can explain the results obtained in Studies 1 and 2. The grades in the heterogeneous student’s transcripts, which ranged from C+ to A+ in Studies 1 and 2, may have been perceived merely as a mix of good and bad grades. In contrast, the homogeneous student’s transcripts, which ranged from B to A+, may have been perceived as consisting of good grades only. If so, the preference for the homogeneous student might have been obtained not because of the negativity bias but because of the binary bias of dichotomizing the grades into good and bad grades.
Study 3 tests this possibility using a new set of transcripts with average GPAs of 2.0, where the homogeneous student’s transcript ranged from C- to C+ (i.e., all “bad” grades), while the heterogeneous student’s transcript ranged from F to A (i.e., a mix of “good” and “bad” grades). If the binary bias takes place, then people would be more favorable towards the heterogeneous student, who has some good grades. However, if the negativity bias takes place, the F’s and D’s in the heterogeneous student’s transcript would be weighed heavily, overshadowing A’s and B+’s in the same transcript, and consequently, participants would favor the homogeneous student.
The second goal of Study 3 was to examine the generalizability of the preference for the homogeneous student using a much higher GPA, 4.0, which is more applicable for the highly selective colleges; perhaps demonstrations of passion might matter only for highly competent students. Given such a high GPA, however, it is not possible to insert truly negative grades (e.g., C-) to create a heterogeneous transcript. Yet, perhaps even B+ grades may appear relatively negative in the context of numerous A’s and A+’s, resulting in the negativity bias. Thus, we used two different heterogeneous transcripts, one ranging from B+ to A+, and the other ranging from A- to A+. Each of these heterogeneous students was compared against a homogeneous student whose grades were almost all A’s. In evaluating these two sets of transcripts, the admissions officers recruited for Study 3 were restricted to be only from highly competitive colleges, given that the emphasis of passion and enthusiasm appears to have been discussed mainly in the context of such schools.
The third goal of Study 3 was to probe into more details of the bias towards the homogeneous transcript. Instead of obtaining categorical admissions decisions, a continuous scale was used to assess the strength of the preferences (e.g., definitely admit X, probably admit X). We also asked participants reasons for their preferences. Finally, we examined whether those who perceive less risks in risky behaviors (e.g., taking some questionable deductions on income tax return) may be more likely to prefer the heterogeneous student, who was judged to be more risk-taking as demonstrated in Studies 1 and 2. To do so, we added a domain-specific risk-attitude scale (Reference Blais and WeberBlais & Weber, 2006) at the end of the study. Because the use of multiple sets of transcripts and additional dependent measures substantially increased the length of the experiment, participants in Study 3 were not asked to assess the hypothetical students on various dimensions through the 30 questions used in Studies 1 and 2.
4.1 Methods
Participants
Out of 158 participants recruited through Mturk, 146 remained after exclusion (see below for details for the exclusion criteria). Appendix A shows demographic information of these participants. In addition, 11 admissions officers (mean age = 41.5, mean number of years working as an admissions officer = 3.6) from highly competitive colleges participated in the study. According to their self-reports collected at the end of the study, the students who are admitted to their college on average have a high school GPA of 3.9 (range: 3.8~4), SAT score of 1518 (range: 1450–1560), and ACT score of 34.1 (range: 33–35). The admissions officers were offered a $5 gift certificate from Amazon.com.
Stimuli
Three sets of two transcripts were developed. In each set, the two transcripts (one homogeneous and the other heterogeneous) showed grades of high school students during grades 9–11 and the average GPA within each set was equated as in Studies 1 and 2. Unlike in Studies 1 and 2, the student in each transcript took 6 (rather than 5) courses each year in order to better equate the overall GPAs between the homogeneous and heterogeneous transcripts.Footnote 7 In the “A vs. A-:A+” set with an overall GPA of 4.00, the homogeneous transcript displayed all A’s except for one A+ and one A-, and the heterogeneous transcript displayed 6 A+’s, 6 A’s, and 6 A-’s. In the “A vs. B+:A+” set, the homogeneous transcript displayed all A’s except for one A+ and one A- (overall GPA of 4.00), and the heterogeneous transcript displayed 8 A+’s, 6 A’s, 1 A-, , and 3 B+’s (overall GPA of 4.02).Footnote 8 In the “C vs. F:A” set with the overall GPA of 2.00, the homogeneous transcript displayed 6 C+’s, 6 C’s, and 6 C-’s, and the heterogeneous transcript displayed 1 A, 2 A-’s, 2 B+’s, 1 B-, 2 C’s, 4 C-’s, 3 D+’s, 1 D-, and 2 F’s. As in Studies 1 and 2, the two transcripts within each set were presented side-by-side, and the left/right position of the heterogeneous and the homogeneous transcript was counterbalanced across participants. In referring to the hypothetical students, all different initials were used for different transcripts.
Procedure
The laypeople participants recruited through Mturk received all 3 sets of transcripts in an order randomized for each participant. As in Studies 1 and 2, they were asked to imagine themselves as a college admissions officer, and to decide who they would admit. Unlike in Studies 1 and 2, the participants responded on a 6-point scale, where 3 points were for preferring the homogeneous student in varying degrees (definitely, very probably, and possibly), and 3 points were for preferring the heterogeneous student in varying degrees. In the results reported below, the scores were coded such that lower scores indicated stronger preference for the homogeneous student. After making each response, participants were asked to type in reasons for their responses.
After completing the tasks with all 3 sets of transcripts, the laypeople participants received an attention check where they saw a list of 8 subjects (e.g., English 11, Geology), and decided for each whether they had seen it in the earlier phase of the study. Those who incorrectly answered on 5 or more of the courses were excluded from the data analysis.
Then, the participants recruited through Mturk received a short version of the domain-specific risk-attitude scale (Reference Blais and WeberBlais & Weber, 2006), consisting of 30 items measuring risks in financial, health/safety, recreational, ethics, and social domains. Each item described an activity or behavior (e.g., “Admitting that your tastes are different from those of a friend” for the social domain). They were asked to indicate how risky each described activity or behavior appeared to them on a 1 (not at all risky) to 7 (extremely risky) scale.
The procedure for the admissions officers was shortened, as it was expected to be considerably challenging to recruit admissions officers from highly competitive institutions and we wished to advertise the study as taking a very short time. For the admissions officers, only the A vs. A-:A+ set and the A vs. B+:A+ set were used, given that these participants would be highly unlikely to admit any of the students in the C vs. F:A set. They made their admissions decisions on a 6-point scale and typed in the reasons for their decisions. They did not receive the domain-specific risk-attitude scale.
4.2 Results and Discussion
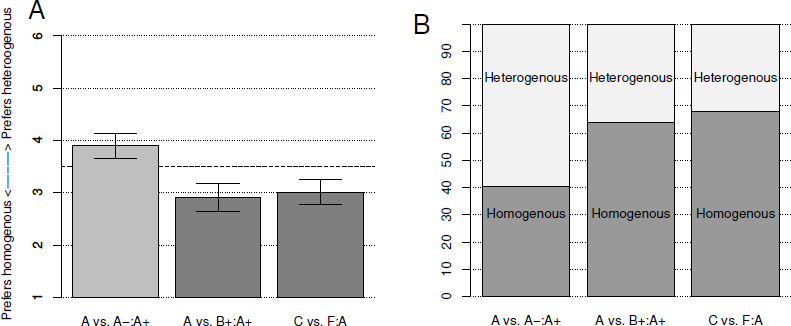
As summarized in Figure 8, laypeople participants still preferred the homogeneous student to the heterogeneous student for the C vs. F:A set (M = 3.01, SD = 1.47) and the A vs. B+:A+ set (M = 2.92, SD = 1.65). One-sample t-tests found significant differences against 3.5 (i.e., mid-point of the scale) for both sets, t(145) = −4.06 and −4.27, respectively; p’s < .0001. Categorically speaking, 67.8 % of participants preferred the homogeneous participant given the C vs. F:A set, and 63.7% of participants preferred the homogeneous participant given the A vs. B+:A+ set.
Admissions preferences for each set by participants recruited from Mechanical Turk in Study 3. Panel A shows mean ratings where the lower numbers indicate preference for the homogeneous student and the higher numbers indicate preference for the heterogeneous student. Error bars show 95% CI. The dotted line shows the mid-point on the scale. Panel B shows the percentage of participants who preferred the homogeneous student vs. the heterogeneous student as indicated by the ratings.
These results replicated the preference for the homogeneous student over the heterogeneous student with different ranges of grades. In particular, the results from the C vs. F:A set counter the predictions of the binary bias account. The homogeneous students with C-, C, and C+ grades displayed only “bad” grades whereas the heterogeneous student with grades ranging from F to A+ displayed some good grades. Nonetheless, the homogeneous student was still preferred.
For the A vs. A-:A+ set, however, laypeople participants for the first time significantly preferred the heterogeneous student (M=3.90, SD = 1.50), as indicated by a one-sample t-test against 3.5, t(145) = 3.20, p < .005. Categorically speaking, 59.6% of participants preferred the heterogeneous student. As it is extremely hard to say that A- grades are “bad”, there probably was no negative value to be overweighed. Given the lack of negative features, perhaps the presence of A+ grades stood out.
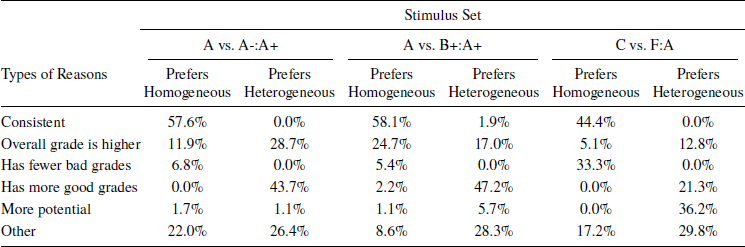
Laypeople participants’ reasons for their ratings were categorized into five types as listed in Table 4. Among those who preferred the homogeneous student, the most frequent reason provided for all three sets of stimuli was that the homogeneous student showed consistency. Among those who preferred the heterogeneous student, the most frequent reason for the A vs. B+:A+ set and the A vs. A-:A+ set was that the student had more A+ grades, and that for the C vs. F:A set was that the student appeared to have more potential, which probably was inferred because of a few A grades the heterogeneous student displayed.
The sample size of admissions officers’ data was admittedly very low. In addition to the challenge of recruiting these participants to begin with, 2 out of 11 admissions officers refused to make any ratings on their admissions preferences. Nonetheless, the results were not ambiguous. For the A vs. B+:A+ set, all but one admissions officers preferred the homogeneous student, with the mean ratings of 2.22. Specifically, four definitely preferred the homogeneous student, and four probably preferred the homogeneous student. Even the only admissions officer who gave a rating of 4 (i.e., probably preferring the heterogeneous student) noted that he/she responded at random because they performed equally. The reasons provided for preferring the homogeneous students were that the homogeneous student showed consistency (e.g., “PW has a straight A transcript, while SK has a ‘more A’ than B’s transcript. PW has very consistent grades,” “While both are very strong, SK’s performance has always been mixed,” “Well with exactly equivalent rigor, one student is consistently on the bubble, i.e in the low nineties. The other student is demonstrating greater proficiency in certain subjects, with more range among the grades. I like a safer more stable bet, since no student is drastically pulling away from the other,” “An A student, no Bs”).
For the A vs. A-:A+ set, however, the admissions officers were completely split. Only eight participants provided ratings, and four rated 3 (probably admit the homogeneous student) and the other four rated 4 (probably admit the heterogeneous student). The reasons they provided indicate their struggle (e.g., “This seems like a real toss-up since I believe they ultimately have the same GPA and both are all within the A range,” “Truthfully, both candidates have equally strong transcripts. … the minor distinctions between A-/A/A+ are virtually meaningless”). The only exceptions were one person who preferred the homogeneous student and noted consistency as the reason (“ML has extremely consistent grades. CG has more A+ grades, but also considerably more A-’s overall”) and another who preferred the heterogeneous student noting, “More superior A grades than ML”.
Finally, laypeople’s risk attitudes were analyzed to examine whether those who perceived less risks on various risky actions and behaviors were more likely to prefer the heterogeneous student. Each participant’s risk attitude ratings were averaged within each of the five domains of risks and correlated with their ratings on each of the stimulus set. None of the correlations reached the significance level after the Bonferroni correction.Footnote 9
To summarize, the preference for the homogeneous student was replicated even with different ranges and GPAs. Facing a comparison between a student whose grades ranged from C- to C+ and a student whose grades ranged from F to A, laypeople participants preferred the homogeneous student. This result poses a problem for the binary bias account, given that the heterogeneous student had a few good grades whereas the homogeneous student had none. In addition, both laypeople and admissions officers from highly selective colleges preferred a homogeneous student with mostly A grades to a heterogeneous student with 3 B+’s despite both students’ GPAs were 4.0. It was only when the choice was between two stellar students who did not even have B+ grades that laypeople participants for the first time preferred the heterogeneous student, although the admissions officers were highly ambivalent in this case. The verbal reports for the reasons for the homogeneous students mostly indicated that consistency was the factor that the participants mostly preferred the homogeneous students.
5 General Discussion
5.1 Summary of Results
The current study found preferences for a student with less variable grades over one with more variable grades. The finding was replicated across different participant populations (laypeople, undergraduate students, and admissions officers), different degrees of variability of grades, and different GPAs. For instance, Study 3 found that even when both students’ GPAs were 4.0, the heterogeneous student with only 3 B+’s was favored less than the homogeneous student whose lowest grade was an A-.
There were a few exceptions to the preference for the homogeneous student. In Study 2, undergraduate students attending a highly competitive college exhibited no significant preference between the students when the heterogeneous student’s transcript offered a coherent picture, presumably because these students had been repeatedly told about the importance of demonstrating passion. Interestingly, however, the admissions officers did not appear to endorse the same view even in this case. Furthermore, even when the heterogeneous transcript was coherent, all participants, including undergraduate students, judged that the student with the more homogeneous transcript would be more successful after college, with higher levels of income and occupations.
Another exception was obtained in Study 3 when both transcripts contained no grades below an A-. It was only when the heterogeneous student’s transcript ranged from A- to A+ that the laypeople participants significantly preferred the heterogeneous student, and the admissions officers became indifferent.
5.2 Theoretical Analyses
Earlier we discussed various reasons why people may prefer the homogeneous student, and the current results are generally in line with those reasons. People judged the student with heterogeneous grades to be more risk-taking, less hard-working, less self-disciplined, and less responsible than the student with homogeneous grades. Consistency was the most frequently mentioned reason for preferring the homogeneous student. Thus, it appears that when making choices requiring long-term perspectives such as college admissions, people seem to prefer a more reliable student. This preference appears to outweigh other positive traits of the heterogeneous student, such as interestingness.
The current results also demonstrated the negativity bias even when making judgments on competence. As discussed earlier, previous studies (e.g., Reeder, et al., 1977; Reference Skowronski and CarlstonSkowronski, et al., 1987) found that when judging others’ competency, people weigh positive information more than negative information. If that were the case, a heterogeneous student with more positive grades than a homogeneous student would have been reliably preferred. Yet, the positivity bias might occur only when positive events are more diagnostic than negative events. Positive grades in typical high school transcripts in this age, however, may not be unequivocally diagnostic of true competency for various reasons. Due to grade inflation (Reference Buckley, Letukas and WildavskyBuckley, Letukas & Wildavsky, 2018), high grades can be thought of as being due to factors other than the student’s competency (e.g., generous teacher, easier exams). Moreover, typical high schools do not offer extremely challenging courses (e.g., atomic physics) which can be diagnostic of exceptional brilliance. Within the bounds of these real-life constraints, we found that the positivity bias in competence judgments found in earlier studies does not generalize to judgments involving high school transcripts. Instead, the current study extended the scope of the negativity bias. It occurs even in a domain where the negative values could be exonerated as the cost of pursuing one’s passion: even admissions officers appear to have difficulty ignoring extremely low grades despite the presence of extremely high grades.
The current study also examined a recent theory of information integration based on the binary bias, which postulates that people tend to simplify continuous values into categorical ones (good or bad). Although Reference Fisher and KeilFisher and Keil (2018) demonstrated robustness of this bias across various domains, formats, and procedures, we failed to find the support for the binary bias when participants were presented with a choice between a student with only bad grades (C’s) and a student with a mixture of good and bad grades (A to F); our participants still did not prefer the heterogeneous student despite the presence of good grades.
One possible reason why the binary bias was not observed in the current domain is that the values (i.e., grades) are attributes of a single person, rather than attributes obtained from different entities as in Reference Fisher and KeilFisher and Keil (2018). For instance, participants in their study judged how much a new medication changed feelings of hunger after observing data generated by different scientists. As discussed earlier, however, mixed data generated by the same agent may make evaluators question the consistency and reliability of the agent. For instance, if a single lab had produced mixed results concerning the new medication, people may question the reliability of the lab. Indeed, our participants judged that the heterogeneous student appeared less reliable and they also listed consistency as the main reason for preferring the homogeneous student.
It is also interesting to note that the homogeneous preference found in the current study appears to contradict the reason-based choices (Reference ShafirShafir, 1993). For instance, participants were presented with a custody decision scenario involving two parents: a heterogeneous parent with both good and bad features, and a homogeneous parent with only neutral features. When participants were asked to whom they would award custody of the child, the majority chose the heterogeneous parent, but when asked to whom they would deny custody, the majority also chose the heterogeneous parent. The explanation offered is that people want to have reasons for their choices and the heterogeneous parent offers reasons to award (i.e., positive features) and to deny (i.e., negative features). In the current study, participants were always asked which student they would admit, and thus, according to the reason-based choice account, the heterogeneous student which had more positive grades should have been selected. The college admissions situations, however, may be special in that even when people are asked whom they would admit, they may automatically think about whom they would reject. If both the positive and negative framing of the choice situation are highly salient in the evaluator’s mind, the reason-based choice is unlikely to occur.
5.3 Limitations
Needless to say, more studies are needed before advising high-schoolers that, to increase their chance of getting admitted to colleges, they should spread their resources across all classes to even out their grades rather than focusing on a few subjects. One obvious limitation of the current study is that only transcripts were used as stimuli, and additional background information of a student (e.g., extracurricular activities) may be more effective with variable grades than homogeneous moderate grades. Additionally, in the actual college admissions processes, only a primary reader may review the details of the transcripts, and the committee proceeds with the summary of academic ratings provided by the primary reader. In this case, our finding would have implications only for the primary readers’ evaluations.
It is also unclear what type of evaluators prefers a student with heterogeneous grades. Although the results were fairly consistent across the studies and various populations, there were non-negligible proportions of people who preferred the heterogeneous student. Our exploratory attempt in Study 3 failed to find that those people are the ones who tend to perceive risky actions less risky. Nonetheless, future research can examine what type of people prefer heterogeneous people to better understand the reasons for the bias revealed in this study.
A related issue is a question of under what circumstances people prefer a homogeneous person. One possibility is that the current finding is limited to choices requiring long-term perspectives. Another possibility, which was already discussed and was suggested by the current findings, is that the preference for a homogeneous person may be limited only to a case where there are negative features (in both an absolute and relative sense). Thus, when the range of variability is highly restricted, people may not favor a homogeneous person any more.
Finally, the current findings have limited implications for general theories of judgments and decision making because we restricted the stimuli and tasks to be applicable as a study of the effects of variabilities in grades on simulated college admissions decisions. There are likely to be different choice situations where the evaluator may have specific goals that can lead to preferences for a heterogeneous option. For instance, college admissions require long-term perspectives involving not only the 4 years in a college but also the career after graduation, but if the choice situation involves a one-shot event, a heterogeneous option may be favored.Footnote 10
Appendix A. Demographic Information
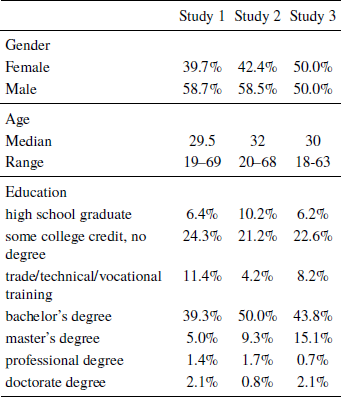
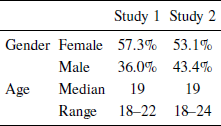
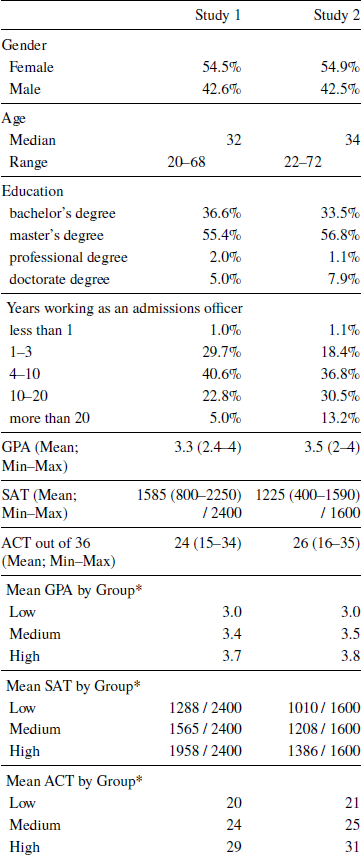
See the main text for explanations for how the groups were categorized.
Appendix B: Transcript Stimuli Used in the Studies
The transcripts were labeled with hypothetical students’ initials, and participants did not see the labels “Heterogeneous transcript” or “Homogeneous transcript”.


 Open access