


Introduction
A number of geophysical techniques are used currently to measure ice thickness. These include seismic soundings, electrical resistivity, VHF radar, and gravity surveys. The first three techniques require a significant amount of equipment, as the source of the signal in addition to the sensors must be provided at the exploration site. In the case of seismic sounding the source is often explosive charges, an undesirable aspect when investigations are conducted in national parks and other sensitive areas. For electrical resistivity, a long dipole antenna and good electrical contact with the ice is required. This can be difficult to achieve as ice is a very poor conductor. All techniques suffer from errors associated with ice anisotropy, particularly if the ice is fractured and the bottom is irregular. While seismic and radar techniques are time-of-flight measurements, resistivity and gravity surveys are not and so prove more difficult to interpret at the exploration site.
In this paper, VLF (very low frequency, i.e. in the frequency range 10–20 kHz) surface-impedance measurements are suggested as an alternative to these techniques for a number of reasons. First, it is not necessary to provide a source field as VLF emissions from distant navigation transmitters are used. Secondly, the receiver can be a small hand-held device of minimal weight and size. Thirdly, at very low frequencies the wavelength of the radiation is very long in comparison with the ice-bottom roughness in most cases and so scattering from the bottom is not a problem; typically the wavelengths (free space) used lie in the range 10-20 km. This also means that small changes in the intrinsic properties of the ice due to changes in the ice temperature, the presence of impurities, or the age and history of different layers are averaged out in the measurements obtained.
Surface Impedance
Surface-impedance measurements constitute a large part of frequency-domain techniques used in electromagnetic geophysics. In particular, the magneto telluric (MT) and audio-magnetotelluric (AMT) methods use a simple expression to relate the apparent resistivity ρa (sometimes referred to as the Reference CagniardCagniard resistivity after Reference CagniardCagniard (1953)) to the surface impedance Zs, i.e.

where ω is the angular frequency of the radiation, and μ is the magnetic permeability of the Earth. The surface impedance is the measured ratio of the horizontal electric field component E x and the horizontal magnetic field component perpendicular to it H y , i.e.
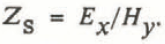
If the Earth is uniform and has a relatively high conductivity, then the phase of the surface impedance, Arg(Zs) is 45°. Should the phase angle between E x and H y be any different, then the Earth plane is interpreted to have a horizontally layered structure (Reference WaitWait, 1970).
MT and AMT methods monitor radio noise in the frequency range 0.001–1000 Hz using two orthogonal E and H field measurements to calculate a 2×2 surface-impedance tensor. Small portable one-dimensional surface-impedance meters can be built or purchased commercially. These meters rely on the vertically polarized emissions from navigation transmitters. The surface impedance in the plane of incidence is determined by orientating the magnetic field antenna for maximum field strength. Measurements are made over a rectangular grid and a contour plot of the apparent resistivity can be made. From the apparent resistivity profile and the phase angle, the depth-resistivity profile can be modelled. This procedure is discussed in more detail in the next section.
Geophysical applications of surface-impedance measurements are now widely recognized; for example, readers are directed toReference Collett and Jensen Collett and Jensen (1982). Applications in cold-region research include permafrost mapping (Reference Hoekstra, Hoekstra, Sellmann and DelaneyHoekstra and others, 1975; Reference Powell and JensenPowell and Jensen, 1982), sea-ice probing (Reference McNeill and HoekstraMcNeill and Hoekstra, 1973), and former glacial areas (Reference Arcone and DelaneyArcone and Delaney, 1980); however, rapid changes in apparent resistivity along the profiles on occasions have made some measurements difficult to interpret.
The surface-impedance meter (referred to here as SIM) used in this application was constructed in-house and has been used for mapping conductive ore bodies (Reference ThielThiel, 1985). The instrument was previously calibrated by direct comparison with a commercial unit (Reference ThielThiel, unpublished). While similar in principle to other commercially available units, the SIM has a number of advantages. These include a digital read-out of magnetic and electric field strengths and phase angle for rapid data readings. The electric field probe is a trailing insulated wire antenna rather than the more common staked electric field probe. This increases the speed of traverse, especially in ice-covered regions, and is thought to be a more sensitive probe. Commonly, measurements are made at 10 m intervals along parallel grid lines. For ease of measurement, these grid lines are orientated parallel to the plane of incidence, i.e. in the direction of the transmitter. In this case, the transmitter used was North West Cape (Western Australia) with an emission frequency of 22.3 kHz. There is a large network of such transmitters so that a VLF signal is available worldwide.
The SIM weighs 2 kg and has dimensions of 400 mm × 150 mm × 100 mm. The trailing antenna is 7 m in length and can be wound on to the carrying handle of the instrument when not in use. Measurements can be made rapidly and only one operator is required to both carry the instrument and record the data. A photograph of the instrument is given in Figure 1.
The surface-impedance meter.

The surface impedance of a uniform half-space is given by the equation

where j = √-1 and σ is the conductivity (the inverse of resistivity) of the half-space. If the Earth has a single horizontal layer (medium 1) above an infinite half-space Earth (medium 2), then the surface impedance measured on the top surface is given by the expression (after Reference WaitWait, 1970)
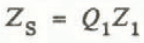
where Z1, is the surface impedance of the top layer when it is of infinite thickness and is given by Equation (3). The factor Q 1 is dependent on the depth of the layer h 1 and the conductivities of both media. Q1 is given by the expression

where Z2 is the surface impedance of the lower half-space given by Equation (3) and u 1 is the complex propagation coefficient for the top layer in the vertical direction given by

where γ 0 is the free-space propagation coefficient, θ is the angle of incidence measured with respect to the surface normal, and γ 1 is the propagation coefficient in medium 1. The propagation coefficients are given by

and ∈ n is the dielectric constant for layer n. For very low frequencies, a large distance from the transmitter θ approaches 90°, and we can write

If there are a number of horizontal layers above the half-space, then an additional Q factor can be calculated for the lowest two-layer combination. The surface impedance calculated at this depth then becomes the impedance of the half-space and the calculation can be iterated up through the layers to the surface (Reference WaitWait, 1970).
In interpreting surface-impedance measurements made over a glacial structure, it is convenient to assume that the electrical properties of the ice are known. It is possible to measure the surface impedance of the surrounding rock at the side of the glacier and so measure Zs over a traverse from one side of the glacier to the other. In this way, an ice-depth section can be obtained. Commonly, these computations are performed by computer some time after the measurements have been made rather than during the measurement period.
The electrical properties of glacial ice have been found to vary according to its temperature, mode of formation, level of impurities, and also frequency of measurement (Reference Collett and JensenGlen and Paren, 1975). At very low frequencies, Reference Westerlund and RederWesterlund and Reder (1973) used a resistivity of 3 × 10⁵ Ω m and a relative dielectric constant of 3∈0. These are the values used in this model. Reference Peden, Peden, Webber and ChandlerPeden and others (1972) measured Antarctic ice at very low frequencies and obtained a resistivity of 2× 10⁵ Ω m and ∈ = 3 ∈0. Figure 2 illustrates the type of variation in apparent resistivity and phase for a simple ice-covered rock model. It is apparent that an accurate measure of these two parameters could allow ice-depth measurements of at least 3 km. It is important to note that an infinite depth of ice, a relatively effective insulator at these frequencies, yields a surface-impedance phase of approximately 10°, whereas most Earth materials will have a phase angle very close to 45°.
Apparent resistivity and phase as a function of ice depth for a two-layer model. The parameters used were:ice ρ=3 – 105Ω m,∈= 3∈0 rock ρ=1 – 103Ω m,∈= 15∈0

Brewster Glacier
Brewster Glacier is located on the southern slope of Mount Brewster (height 2432 m, lat. 44° 05’ S., long. 169° 27’ E.) in the Southern Alps of New Zealand. It is a temperate glacier and measurements were made in summer. The surface of the glacier was relatively smooth and unfractured except in areas close to the terminus. The slope of the ice surface in the direction of flow was approximately 1 : 10 and across the glacier, at the position of the traverse, almost horizontal. The traverse was undertaken from east to west and crossed the ice completely, a distance of almost 1 km. Exposed rock on the east and exposed gravel on the west allowed measurements in ice-free areas to a limited extent. A location map is given in Figure 3 and a photograph of the glacier is given in Figure4.
Location and height-contour map of the Brewster Glacier area showing Mount Brewster (B), Mount Armstrong (A), and Mount Topheavy (T). The contours are spaced at 500 m intervals and are measured from sea-level. The dotted line indicates the extent of the glacier and the 1 km traverse is shown as a straight line. Highway 6 passes in the near vicinity as indicated.

Brewster Glacier viewed from the south.

Mount Brewster lies in a region of metamorphic rocks which are part of the chlorite zone of the Haast Schist Group. Geological formations in the vicinity are orientated approximately 040° with no major faults in the area. An inverted anticline is evident from the terminus, extending roughly south and plunging 70° to the vertical. There is no change in rock classification in the vicinity of the measurements from one side of the glacier to the other.
The glacier is located approximately 5.6 Mm from the transmitter and the signal is incident at a bearing angle of 277.5° (roughly due east), and so is suitably orientated for a traverse across the glacier perpendicular to the direction of ice flow.
Measurements were made late in the southern summer (March 1986) when discharge rates were at a maximum. Melting ice and running water was evident on the eastern ice edge but not the western edge. This was thought to have resulted from relatively recent snowfalls at slightly higher altitudes above the eastern rock wall. The glacier ice at the traverse site had no snow cover and crevasses in the area displayed blue ice to within 1 m of the surface. Slightly discoloured areas on the glacial ice were interpreted as evidence that at least one season of snow had melted completely. The grid zero was located directly between Mount Brewster and Mount Armstrong, with Mount Topheavy located 275°. Measurements were made at 10 m intervals along the grid.
Results
The raw data of apparent resistivity and phase are given in Figure5. (Note that for ease of presentation all resistivities are plotted as their square-root values. This parameter is more convenient to plot and is directly proportional to the surface impedance as given in Equation (1).) The most westerly data point was made on a crushed rock surface, the only measurement not made on an ice surface at this end of the profile. On the eastern end, points 1, 2, 4, and 5 were made on solid rock surfaces. The apparent resistivity plot indicates that the western side of the glacier is less resistive than in the east. The phase plot has a basin shape. The quite dramatic variations in phase around 700 m W were measured in close proximity to crevasses, as were the more minor but equally rapid phase excursions at 600 m W and 150 m W. These will be discussed in more detail later.
Apparent resistivity and phase angle along the traverse.

A number of quite significant conclusions can be drawn from the raw data in Figure 5, particularly as results are contrary to expectations based on the simple two-layer model outlined earlier and given in Figure 2. First, the apparent resistivity of measurements made on rock and gravel is higher than those made on the ice itself. This is supported by the fact that over the eastern side of the profile the phase is smaller than 45° rather than greater than 45° as predicted by this model. As the phase of the rock measurements is close to 45°, one can assume that the rock is relatively uniform to a significant depth. This is supported by the geological information of the area (Reference Muth and McKellarMuth and McKeller, 1964), where the rock is classified as the chlorite sub-zone III of the Haast Schist Group which is part of the sequence of metamorphic rocks formed in the Lower Permian (Palaeozoic era). The numerical values for rock-surface measurements are as follows:
Western end crushed rock/gravel ρa = 7 – 103 Ω m,
Eastern end rock (four samples) ρa = (1.8 ±0.2) – 104 Ω m.
While these values are relatively high, Reference Collett and JensenKeller and Frischknecht (1966, p. 40) quoted a range of 10 000–100 000 Ω m for chemical precipitates and 1000-5000 Ω m for intrusive rocks of early Palaeozoic age. This variation from one side of the ice to the other is thought to relate to a difference between the resistivity of rock and gravel, rather than a chemical or geological change between the east and west, an interpretation consistent with the previous geological interpretation.
Secondly, the phase of the eastern side is less than 45°. If one assumes that the ice is more resistive than the surrounding rock, then it becomes mandatory to employ a three-layer model encompassing an intermediate layer of quite low resistivity between the ice and the rock. This is a reasonable assumption from a geological point of view, as temperate glaciers are likely to have water-saturated gravels at their base. Such a gravel is likely to be relatively conductive. As the western end has phase values greater than 45 °, one would expect the ice there to be substantially thicker than in the east. The modelling of the results is given in the next section.
Thirdly, the rate of change from crushed rock to the ice surface on the western side is quite abrupt. On the eastern side the change is more gradual. The rock measurements were made with the complete 7 m antenna lying on the rock itself and so quite rapid changes can be observed, particularly if the dip angle of the discontinuity is nearly vertical and reaches the surface.
Fourthly, at a number of locations the phase is equal to 45°. When modelled on a two-layered structure, there are two possible conclusions: either the upper layer is very thick (for ice this would be 1.4 km as read from Figure 2) or the two layers have identical electrical properties. Clearly, this result is not appropriate when, at some locations, the measurements were made on an ice surface.
Modelling
Two different modelling exercises were undertaken; the first was to ascertain the ice-depth profile across the traverse, and the second to explain the fluctuations in phase in the vicinity of the crevasses.
Glacier profile
For the reasons given in the previous section, three-layer modelling was undertaken on the following basis. It was assumed that the ice had uniform electrical characteristics, i.e. that its conductivity and dielectric constant did not vary with depth or horizontal position. This assumption is supported by the following evidence.
-
(i) No significant snow or uncompacted ice was observed on the top of the glacial ice, either from crevasse section or from the melt-related discoloration of the glacier surface,
-
(ii) There was evidence of some water both on the surface of the ice at the end of the day, and also at the bottom of the crevasses and on the eastern rock wall. This indicates that the temperature of the ice does not vary significantly with depth. The altitude at which measurements were made was approximately at the summer night-time freezing level. This all points to a uniform ice temperature of 0°C.
-
(iii) The depth of ice is sufficiently small such that minor variations of these parameters will not cause a significant change in the depth estimation. Certainly, other errors will have a greater effect on the final model.
The resistivity of the gravel was determined from the model and was assumed to be constant for the entire structure. In order to fit the data, the gravel resistivity had to be significantly higher than the surrounding rock and ice.
The resistivity of the rock was also modelled using values quite close to the actual measured values at both sides. It was found to be impossible to model the complete traverse using only one value for the bedrock parameters. Thus, at the eastern side, the bedrock takes the measured value but this changes 100 m to the west. The change is relatively minor and is thought to be well within the type of fluctuation observable in one large rock formation of a single rock type. In addition, there may be a small resistivity variation associated with the inverted anticline at the centre of the glacier.
The final model employed over most of the traverse is given in Figure 6. This figure consists of a scattergram of resistivity values versus phase of measured data and superimposed are contour lines of ice and gravel thickness using the following parameters:
Three-layer model with parameters as indicated. Contours of ice depth (h1) and gravel thickness(h2) are all in metres. The circles are the experimental points.


The final model section is shown in Figure 7, This was derived from 11 representative points (see Table I) read from the smoothed phase and apparent resistivity plots. The maximum ice depth was approximately 100 m at 550 m W. The gravel layer is a maximum of 30 m thick on the western edge and reduces to less than a few metres on the eastern edge. While it is possible to interpret the eastern end of the profile as also having a relatively large value of ice thickness, it was thought that a change in the bedrock conductivity was a more rational explanation. The reasons for this include the resistivity of the bedrock that was measured on the eastern side and the physical appearance of the glacier itself. The terminus had a much larger wall of ice on the western side than the eastern side. The terminus is only 1.5 km from the profile and it is unlikely that the position of the major basin changes over this distance.
Predicted glacier section (depth in metres). The electrical parameters of each layer are given in Figure 6 except that the bedrock conductivity changes to 5 – 10 -5 Ω m to the east of 100 m W.

Data used in Ice-Depth Determination

The calculation of uncertainties for this final result is quite complicated as it is necessary to incorporate intuitive feel as to the geology of the situation in addition to uncertainties in instrument calibration, radio noise at the time of measurement, scatter in the data, and the model weightings of each parameter fitted. Given an observed measurement uncertainty of 1° (i.e. the fluctuation in the phase reading), Figure 6 yields a maximum ice-depth uncertainty of approximately 4 m. A √ρ reading uncertainty of 10% yields a mean gravel-depth uncertainty of 2 m. Conversely, a factor of two change in the conductivity of the bedrock yields a change of up to 10 m ice depth for ice thickness greater than 50 m. Such a variation, however, results in a displacement of some experimental points from the theoretical grid in Figure 6 and so a more complex interpretation of results would be required. While this more complex picture is equally valid from a theoretical point of view, when the results are considered as a whole, given the uniformity of the bedrock, such models were not considered appropriate. Even so, the ice-depth estimates on the eastern side are thought to be less accurate than those on the west. It would also be possible to consider the data in terms of a four or more layer model. Certainly, one could obtain a better fit to the data but no simple geological reason can be given to support such a model. The addition of more layers increases the number of parameters to be fitted and so will cause much larger uncertainties in all fitted values.
Crevasse effects
At three different locations along the traverse, measurements were made in the vicinity of crevasses orientated at roughly 15° to the plane of incidence and hence the grid. These crevasses form partial arcs whose centre is close to the glacier centre and near to the terminus. While not plumbed for depth, those crevasses to the east were estimated to be at least 8 m deep and those to the west at least 20 m deep. It was impossible to ascertain visually whether the crevasses reached the ice bottom. The very large phase fluctuations at 700 m W were assumed to be a consequence of the crevasses rather than a dramatic change in the parameters modelled. This was supported by the smaller but still significant changes at 150 m W and 600 m W. While the apparent resistivity did exhibit some change at this location, the effect is more minor. A check of the raw field-Strength values showed quite minor changes in the magnetic field strength, the primary inducing field.
In attempting to explain the phase fluctuations in the vicinity, it is necessary to discuss the effect of abrupt lateral changes to surface-impedance measurements. This is a subject that has received a great deal of attention in the past. The situation is further complicated by the fact that ice is a relatively good insulator and so propagation beneath the surface is not vertical but inclined at an angle of approximately 36° from the vertical. The complex propagation coefficient u 1 in Equation (5) takes this oblique propagation into account. The non-orthogonal boundary in two low-loss materials will result in a reflection coefficient dependent on the polarization of the radiation incident on it. The net result will be an elliptically polarized wave form at the surface which makes interpretation difficult.
Rapid phase fluctuations of this kind have been observed previously in other surface-impedance measurements (Reference ThielThiel, 1979; all measurements in this paper were surface-impedance measurements not wave-tilt measurements); however, these measurements were accompanied by similar rapid changes in the magnitude of the surface impedance. These results were obtained on the transmitter side of a massive sulphide ore vein which was inclined to the plane of incidence at 20° and dipped almost vertically. No explanation was offered.
Theoretical modelling of abrupt changes in electrical conductivity have been reported by many workers. In summary, however, one can state that the transition in surface impedance begins to be observable at a distance approximately equal to one-half of the layer thickness (Reference Wait and SpiesWait and Spies, 1974). Such a transition in both phase and amplitude will be monotonic between the continuum surface-impedance values of the materials on either side only in some cases (Reference Hughes and WaitHughes and Wait, 1975). Whether such a transition is monotonic depends on the orientation of the electric field with respect to the discontinuity. When the electric field is perpendicular to the discontinuity (the so-called H polarized case), quite large deviations from the two adjacent surface-impedance values will be observed. In these models, the transition does occur in distances much less than one wavelength but the transition is more pronounced in the amplitude rather than the phase of the surface impedance. When the material on both sides of the transition is insulating, one might expect the effect to be even more pronounced.
Reference ThielThiel (1982) made microwave measurements on a low-loss Earth plane with an abrupt transition. While very dramatic changes in the electric field wave tilt were observed in front of the transition, it was predicted that this would not be evident in surface-impedance measurements. No surface-impedance measurements were made to confirm this hypothesis. In any event, the variations in wave tilt resulted from surface-wave reflection from the boundary and so had a periodicity of one-half of a wavelength. The fluctuations observed in the glacier measurements had a periodicity much smaller than one-half of one wavelength.
An alternative view of this effect is to calculate the impedance of the air slots independently. The following values were obtained for the location 700 m W:
Ice: ρa = 1764 Ω m, phase = 53.6,
Air slot: ρa = 529 Ω m, phase = 13.5.
While this does yield a value of the surface impedance which is quite different from the modelled data, it still does not explain the fluctuations fully. These results indicate that close to the crevasses the phase can assume very small values but does not explain the very high values obtained just 20 m away. The possibility of sub-surface water-filled voids was also considered but no realistic model could be devised. As a further complication, the location of the magnetic sensor is 3.5 m from the centre of the electric field sensor and, given the very dramatic changes in phase with distance, this effect may be important. The magnetic field changes are quite small in this area so no error in apparent resistivity will result. However, no conclusive statement can be made about the effect on the phase. While no adequate model can be suggested, it is thought that the ability of the instrument to observe large fluctuations in the vicinity of 700 m W and only quite small fluctuations in the vicinity of 150 m W is a result of both the length of the electric field antenna and the different depths of ice at these two locations.
Discussion and Conclusions
The results obtained from a single traverse of Brewster Glacier can be interpreted in terms of a three-layered model which is consistent with the local geology. Unfortunately, there are no independent measurements of ice depth on this glacier and so the final ice-depth profile cannot be confirmed. It is believed that the technique is worthy of further investigation as, in theory, ice layers with depths greater than 3 km can be mapped. The behaviour of the surface impedance in the vicinity of crevasses has yet to be explained fully and further experimental and theoretical work is required.
Reference McNeill and HoekstraMcNeill and Hoekstra (1973) reported rapid changes in sea-ice resistivity over short distances. Certainly, on land quite rapid changes in apparent resistivity have been observed. It is possible that sea-ice fractures may account for this rapid variation. An alternative explanation could be that the staked antenna electric field probe used is unsuitable for ice profiling as the ice is such a poor conductor at these frequencies. At each location, the ground contact might be so uncertain as to produce this type of fluctuation. An insulated antenna does not suffer from these effects.
It is important to note that the interpretation of surface-impedance measurements in terms of two or more horizontal layers is not unique. In this specific case, however, given the assumptions of uniform ice conductivity (after the removal of minor fluctuations by smoothing the raw data) and uniform gravel and rock conductivity, almost all data points can be interpreted using the three-layer model given in Figure 6. This consistency, coupled with the fact that quite minor variations in the conductivities used in the model lead to significant inconsistencies, points to a reliable interpretation of the data. Thus, while the conductivity and dielectric constant for Antarctic ice was used in the model, minor changes in these two parameters lead to much of the data not being interpretable. The effect of free water in the ice would produce minor variations in the bulk-ice electrical parameters but the relatively smooth profile obtained suggests that this effect is minor.
Acknowledgements
This work was funded by a Griffith University research grant. Local support from the Physics Department (K. and J. Adams, R. Entwistle, and N. Thomson) and the Geology Department (S. Nicol) of the University of Otago, and G. Bishop of the D.S.I.R., Dunedin, New Zealand, was greatly appreciated. The helpful comments of members of the Department of Geophysics, University of Edinburgh, are also acknowledged.



