


Introduction
Hepatitis B virus (HBV) causes the disease hepatitis B, which can result in cirrhosis and hepatocellular carcinoma and increase the risk of pancreatic cancer [Reference Hassan1, Reference Schwalbe2]. HBV is transmitted via the blood or other bodily fluids through direct contact with an infected individual and may be spread by intravenous drug use, sexual activity and occupational exposure.
Although a vaccine has been available since 1982, HBV remains a serious global public health problem. Worldwide, two billion people have been infected, of which an estimated 360 million have chronic infections related to HBV [Reference Shepard3]. More than 6 00 000 people die every year due to HBV-related diseases, including cirrhosis and hepatocellular carcinoma [Reference Naghavi4].
A World Health Organization report indicated that East Asia had one of the highest rates of hepatitis B prevalence in the world, with 5–10% of the adult population being chronically infected [5, Reference Lavanchy6]. Other studies have reported that China has experienced an increasing HBV risk. A serological epidemiological investigation of viral hepatitis was conducted throughout the country in 1992. The results estimated that there were 120 million hepatitis B surface antigen (HBsAg) carriers in China, that 20 million people suffered from chronic hepatitis B, and that there were almost 300 000 deaths per year from HBV-related infections [Reference Xia7, Reference Zhuang8]. The Chinese Centre for Disease Control and Prevention (CDC) carried out a hepatitis B monitoring programme in 2006 in 18 counties from eight provinces. The results showed that the incidence of hepatitis B was 23.37/105, with an incidence of 6.15/105 for acute hepatitis B and of 15.69/105 for chronic hepatitis B [Reference Wang9].
There is a significant heterogeneity in the HBV infection rates in different population groups and regions in China. HBV infections are higher in men compared with women, and they are higher in underdeveloped rural areas compared with urban ones [Reference Dong10]. One important factor influencing the heterogeneity of HBV infections is the difference in vaccination rates in different regions. The vaccination rate is influenced by spatial socio-economic variants that lead to HBV transmission in environments with poor sanitation, poor medical resources and lower income and education levels. These socio-economic factors impact efforts at disease prevention and control, including vaccination [Reference Dong10].
The study region of Beijing–Tianjin–Hebei is unbalanced in terms of socio-economic development. Beijing is one of the world's largest international metropolises. Around the area's most prosperous cities, however, there are large underdeveloped regions. Many migrants and rural workers are found in the cities and neighbouring regions, complicating disease control. However, no studies have been carried out to determine the spatiotemporal patterns and to detect the risk factors of HBV infection in the region.
The present study reveals the spatiotemporal epidemiological features of HBV and quantifies the association between HBV and socio-economic risk factors to explore the determinant power of these factors. These findings may inform risk assessments concerning HBV transmission and guide the implementation of effective immunisation policies to reduce the burden of this disease.
Methods
Data
The Beijing–Tianjin–Hebei region is the largest urban agglomeration in northern China, with a population of 107 million covering an area of 210 000 km2. Beijing, with a population of 20.7 million, is China's capital city, and it represents the centre of Chinese political and cultural activities and international exchanges. Tianjin is a municipality directly under the control of the central government, and it has a population of 14.1 million. Hebei province, with a population of 72.9 million, has a lower economic level compared with Beijing and Tianjin (Fig. 1).
The geographic location of the Beijing–Tianjin–Hebei area in China and the average yearly hepatitis B virus (HBV) incidence from 2007 to 2012 in the study area.

In this study, the HBV incidence [11], from 2007 to 2012 in each county, was obtained from the CDC's real-time surveillance system for monitoring and reporting notifiable infectious diseases. The surveillance system covers more than 90% of the country's hospitals, and the reporting rate of HBV is more than 91% [Reference Guo12]. This study collected information on multiple risk factors, both favouring and preventing disease spread, such as the social environment, individual hygiene conditions, public health medical facilities and vaccination rate (Fig. 2).
The determinants of hepatitis B virus (HBV) infection and their proxies. GDP, gross domestic product per capita; BSTHM, Bayesian space–time hierarchy model; GeoDetector, GeoDetector method.
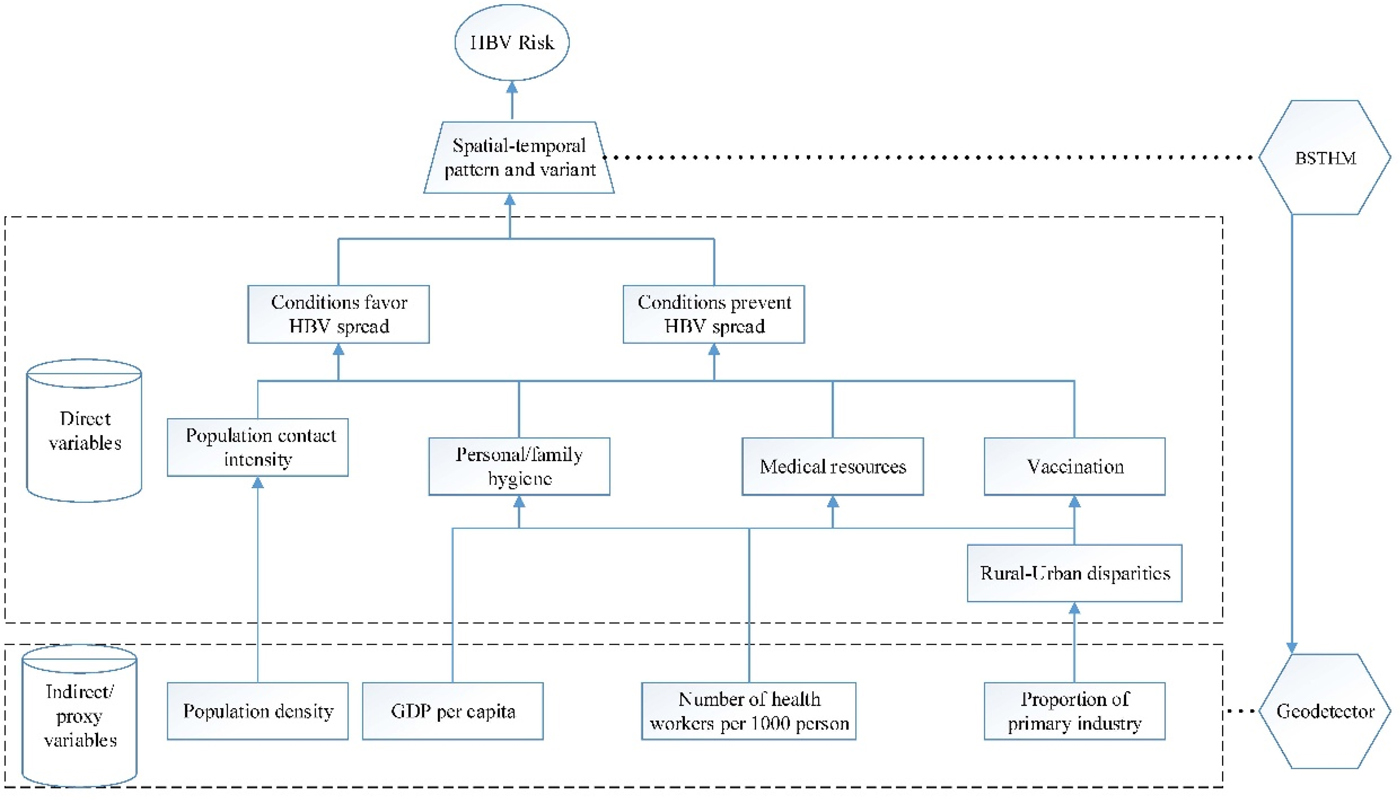
The availability of medical resources and good personal or family hygiene will prevent the spread of HBV, but such elements exhibit disparities between rural and urban areas, and they are ultimately affected by various socio-economic factors. In this study, the variable of healthcare workers per 1000 people was used as the proxy variable for medical resources, the proportion of primary industry was used as the proxy variable for rural urban disparities, and the gross domestic product (GDP) per capita was used as the proxy variable for the level of societal economic development reflecting personal or family hygiene as they usually present positive relationship. Another factor considered in this study was population density, as it affects contact frequency and, consequently, HBV transmission. These socio-economic factors will also influence differences in vaccination rates among regions and population groups. The potential risk factors relating to the socio-economic variables were collected from the Statistical Yearbook [13–15]. These factors were stable for a year, but they had apparent spatial heterogeneity.
Statistical analysis
The Bayesian space–time hierarchy model was used to assess spatiotemporal variation in HBV incidence. The stable spatiotemporal distribution of relative risk, presenting high- and low-risk areas, was identified. Then the local temporal trend of relative risk in each hot/cold spot was quantified. Finally, potential risk factors contributing to the spatiotemporal pattern and their variants were quantified using the GeoDetector method.
The Bayesian space–time hierarchy model
The Bayesian space–time hierarchy model combines the Bayesian hierarchy and the space–time interaction models. This system can integrate population properties, sample information and prior knowledge [Reference Li16]. The approach does not rely only on sample information. Parameters are estimated using a probability distribution, potentially overcoming problems with sample bias. The spatial and temporal relative risks and local trends in HBV infection risk were estimated using this model.
We employed the Poisson and the log link regression function in the model. The parameters y it and n it represent the cases of HBV infection and the population in a county i (i = 1, 2, …, 208), in the year t (t = 2007, 2008, …, 2012). The parameter r it represents the relative risk of HBV infection in county i in year t, where the reference value is the average incidence in the entire region within the study period.
 $$y_{it}^{} \, \sim \,{\rm Possion}\,(n_{it}r_{it}).$$
The logarithmic transformation of r it can be expressed as the formula:
 $$\log (r_{it}^{} ) = \alpha + s_i + (b_0t^{^\ast} + v_t) + b_{1i}t^{^\ast} + \varepsilon _{it},$$
where α is the overall log of HBV risk during the study period, and the posterior estimated exp (s i) quantifies the spatial relative risk of HBV in county i to that in the whole region, which is the common spatial component. The posterior exp (b 0t* + v t) is the temporal relative risk, t* is the centring time in the middle of the observation period and v t represents the additional Gaussian noise describing a random time effect that allows for non-linearity variation. The parameter b 1i represents the local trends of county i and measures the departure from the common spatiotemporal variation. A positive estimate of b 1i indicates that county i possesses a stronger temporal trend compared with the overall trend of the country, and vice versa. The overdispersion parameter ε 1i captures the variation not yet explained by the model; it is assumed to follow a normal distribution. The common spatial component s i and the local trend coefficient b 1i are assigned by the Besag, York, and Mollie spatial model (BYM) [Reference Besag17]. The BYM considers both spatially structured random effects using a convolution algorithm and spatially unstructured random effects following a Gaussian distribution. The conditional autoregressive prior is used to impose spatial structure. The spatial adjacency matrix W is calculated by the size N × N (with N being the number of counties), where its diagonal entries w ij = 1 if the areas i and j share a common boundary and w ij = 0 if otherwise.
A county is a hot/cold spot if it has a persistently higher/lower HBV risk than the region's overall level. In the calculation process, the hot/cold spot was assessed by comparing the disease incidence in a local statistical unit with the mean incidence in the whole study region. If a region has statistically significant higher/lower incidence, it will be identified as hot/cold spot. Furthermore, temporal trend over time also can be analysed in hot/cold spot. All the counties were classified by the following rules [Reference Richardson18].
In the first stage, a county was defined as a hotspot if the posterior probability p(exp (si) >1|data) was >0.8; a county was defined as a cold spot if the posterior probability p (exp (si) >1|data) was <0.2. The other counties were defined as neither hotspots nor cold spots.
In the second stage, a county was classified within each stage 1 risk category into three trend patterns based on the local slope b 1i, namely with a faster increase/decreasing trend than the overall trend if p (b 1i > 0|h i, data) > 0.8, with a slower increase/decreasing trend relative to the common trend if p(b 1i > 0|h i, data) < 0.2, and with a trend of no difference from the overall trend if 0.2 ⩽ p (b 1i > 0|h i, data) ⩽ 0.8.
The model was implemented in WinBUGS [Reference Lunn19], which is specifically designed for Bayesian analysis. Posterior distribution of the model parameters was obtained through Markov chain Monte Carlo (MCMC) simulations.
GeoDetector
The GeoDetector method was used to assess the non-linear associations between HBV and potential risk factors. The core concept of the GeoDetector method is that if a potential factor leads to a disease, it will present similar spatial distributions. This method can be used to measure the degree of the determinant power of risk factors and to quantify the influence of the interaction relationships between two factors [Reference Wang20–Reference Hu22].
The determinant power of the GeoDetector method can be measured by the q statistic:
 $$q = 1 - \displaystyle{{\sum\limits_{h = 1}^L {N_h\sigma _h^2}} \over {N\sigma _{}^2}}, $$
 $$\sigma _{}^2 = \displaystyle{1 \over N}\sum\limits_{i = 1}^N {{(R_i - \overline R )}^2}, $$
 $$\sigma _h^2 \, = \,\displaystyle{1 \over N}\,\sum\limits_{h = 1}^L {\,\sum\limits_{\,j = 1}^{N_h} {\,{(R_{h,j} - {\overline R} _h)}^2}}, $$
where  $\overline R$ and $\overline R _h$ refer to the average incidence of disease within the whole region and a specific zone stratified by Z, respectively. The parameter R i is the incidence of the i-th county, R h,j is the incidence of the j-th county in the h-th stratum (h = 1, 2,…, L). The strata are determined by a classified algorithm. The number of samples in the whole study region is represented by N, and L is the number of stratum. The parameter σ 2 represents the total variance of disease incidence in all counties for the whole study region, and $\sigma _h^2 $ is the stratified variance of disease incidence in counties in the h-th stratum.
The q value represents the statistic association between two variables. The value lies between 0 and 1, meaning that a factor explains q × 100% with regard to the spatial pattern of the disease. For example, if a factor completely determines the disease, the q value is 1; if a factor is completely unrelated to the disease, the q value is 0.
The significance level P of the GeoDetector q was calculated based on a non-central F-distribution with the first df L − 1, the second df N − L and the non-centrality λ [Reference Wang21]:
F ~ F(L−1, N−L; λ),
 $$\lambda = \displaystyle{1 \over {\sigma ^2}}\left[ {\mathop \sum \limits_{h = 1}^L \mu_h^2 - \displaystyle{1 \over N}{\left( {\mathop \sum \limits_{h = 1}^L \sqrt {N_h} \mu_h} \right)}^2} \right],$$
 $$P\lpar {q \lt x} \rpar = P\left( {F \lt \displaystyle{{N\, - \,L} \over {L\, - \,1}}\,\displaystyle{x \over {1\, - \,x}}} \right) = 1 - a,$$
where α is the probability of q ⩾ x.
In the GeoDetector method, the interactive effect of two risk factors x 1 and x 2 can also be assessed. The index can quantify the determinant power of the interactive effect of two factors and reveal whether two factors together have a stronger or weaker effect on the disease than their independent effect. The interaction relationships are catalogued as follows:
Enhance: if q(x 1∩x 2) > q(x 1) or q(x 2)
Enhance, bivariate: if q(x 1∩x 2) > q(x 1) and q(x 2)
Enhance, non-linear: if q(x 1∩x 2) > q(x 1) + q(x 2)
Weaken: if q(x 1∩x 2) < q(x 1) + q(x 2)
Weaken, univariate: if q(x 1∩x 2) < q(x 1) or q(x 2)
Weaken, non-linear: if q(x 1∩x 2) < q(x 1) and q(x 2)
Independent: if q(x 1∩x 2) = q(x 1) + q(x 2)
In this study, the GeoDetector method was implemented using software from http://www.geodetector.cn.
Results
From 2007 to 2012 in the study region, the average annual HBV incidence was 6.30/105, and the temporal trend of HBV annual incidence showed a substantial decrease, from 7.34/105 to 5.51/105 (Fig. 3). The study results show that for the whole study area, there was a sustained decline in HBV risk over the 6-year timeframe. However, there was a significant spatial heterogeneity of HBV risk, as some areas were identified as hotspots. The local temporal trend also revealed significant diversity. Socio-economic factors were strongly associated with the spatiotemporal pattern and variance.
The incidence of hepatitis B virus (HBV) infection from 2007 to 2012.

The spatiotemporal pattern
Figure 4 shows the common spatial pattern structure of HBV infection risk in the study region from 2007 to 2012. The estimated results suggest that the spatial distribution of the HBV infection risk formed an explicit regional diversity. The counties located around the metropolis and the surrounding areas, such as Beijing and Tianjin, had the smallest value of common relative risk (exp (s i) <1.0). This indicates that these counties experienced a relatively low HBV infection risk. The highest value of common spatial relative risk (exp (s i) more than 2.0) in these counties was mainly found in underdeveloped rural areas in the north and mid-south of the study region (Fig. 4, S1). This indicates that these counties had a relatively high HBV infection risk compared with the overall level. The counties located in the remaining regions, such as those in the west of the study region, possessed an average level of HBV infection risk; the value of the common spatial relative risk (exp (s i)) was around 1.0.
The relative risk of hepatitis B virus (HBV) infection in Beijing–Tianjin–Hebei. The posterior medians of the spatial relative risks (exp (s i)) in the counties are shown.

The total relative HBV infection risk followed an overall decreasing trend from 2007 to 2012 (Fig. 5). This is in accordance with the temporal trend of HBV incidence over the study region. Although the total overall decreasing trend in the country was rapid, it varied in different counties (Fig. 6). Among the 208 total counties, 78 (37.5%) and 74 (35.6%) counties were classified as hotspot and cold spot regions, respectively; the other 56 (26.9%) counties were identified as neither hotspot nor cold spot regions.
The overall HBV infection trend (the posterior medians of exp (b 0t* + v t)) with the 95% confidence interval (CI).

Hotspots (high-risk areas) with a persistently high risk of hepatitis B virus (HBV) infection from 2007 to 2012.

The hotspot regions were mainly distributed in the underdeveloped rural areas in the north and mid-south of the study region. From the spatial distribution of the local trend, we can see that 30 counties (accounting for 38.5% of the hotspot counties) had a local trend representing a faster decrease compared with the overall decreasing trend these areas will likely have a lower risk or even stop being hotspots in the future. In contrast, 28 counties (accounting for 35.9% of the hotspot counties) showed a slower decrease compared with the overall trend. Finally, 20 counties (accounting for 25.6% of the hotspot counties) had a trend that was consistent with the common overall trend.
The cold spots were mainly distributed in the urban and western areas of the study region (Fig. 7). A total of 22 counties (accounting for 29.7% of the cold spot counties) exhibited a faster decrease than the overall decreasing trend; these areas will likely have lower risk and continue to be cold spots in the future. Meanwhile, 33 counties (accounting for 44.6% of the cold spot counties) showed a slower decrease compared with the overall trend. Finally, 19 counties (accounting for 25.7% of the cold spot counties) had a trend consistent with the common overall trend; in these counties, the current risk level will likely be maintained.
Cold spots (low-risk areas) with a persistently low risk of hepatitis B virus (HBV) infection from 2007 to 2012.

The areas of neither hot nor cold spots were mainly distributed in the northeast, mid-west and southern areas of the study region (Fig. 8). The results indicate that 23 counties (accounting for 41.1% of neither hot nor cold spot counties) exhibited a faster local decreasing trend than the overall trend; these areas will likely become cold spots in the future. In addition, nine counties (accounting for 16.1% of non-cold/hotspot counties) showed a slower decrease compared with the overall trend. Lastly, 24 counties (accounting for 42.9% of non-cold/hotspot counties) had a consistent trend compared with the common overall trend.
Neither hot (high-risk) nor cold (low-risk) spots for hepatitis B virus (HBV) infection from 2007 to 2012.

Risk factor detection
In this study, disease incidence was a dependent variable in the GeoDetector approach. The selected potential socio-economic factors were population density, GDP per capita, the proportion of primary industry and the number of healthcare workers per 1000 persons. The determinant power of each factor and its interaction effects were quantified using the GeoDetector q-value.
The factor with the highest explanatory power was population density, which had a q-value of 0.17 (P < 0.01). A high population density was associated with a low incidence of HBV infection (Table 1 and S1). The GDP per capita also had a relatively high determinant power, with a q-value of 0.12 (P < 0.01), and a high GDP per capita was associated with a low incidence of HBV infection. The economically developed regions with high population density had a low HBV infection risk compared with the undeveloped regions. These results indicate that economic level significantly influences HBV transmission.
The determinant power of single socio-economic factors and their interactive effects on Hepatitis B virus (HBV) infection

PD, population density; GDP, gross domestic product per capita; PI, proportion of primary industry (%); HW, number of healthcare workers per 1000 people.
***Significance level of 0.01; **significance level of 0.05; *significance level of 0.1.
A high proportion of primary industry was associated with a higher incidence of HBV infection; the determinant power of this factor was 0.11 (P < 0.01) (Table 1 and S1). This indicates that the HBV infection risk in rural regions was high compared with the risk in urban regions.
The number of healthcare workers per 1000 people was negatively associated with HBV transmission, with a determinant power of 0.08 (P < 0.01; Table 1 and S1). This implies that the level of medical accessibility is another important factor influencing HBV transmission.
The results of the GeoDetector interaction effect showed that any two combined factors played a more important role in HBV transmission than either one did independently. The determinant power of the interaction effects between the proportion of primary industry and the population density was 0.33 (P < 0.01). This confirmed that urban areas with low rural populations had a low rate of HBV transmission. The determinant power of the interaction effect between population density and the number of healthcare workers was 0.31 (P < 0.01). This implies that urban areas with a high number of healthcare workers also had a low rate of HBV transmission.
The interaction effect of GDP per capita coupled with other factors also had a high determinant power. The combination of GDP per capita and the proportion of primary industry had a q-value of 0.25 (P < 0.05). Meanwhile, the combination of GDP per capita and the number of healthcare workers also exhibited a high determinant power, with a q-value of 0.25 (P < 0.1).
Discussion
HBV remains a major public health concern in China. The Beijing–Tianjin–Hebei region is one of the largest urban agglomerations in northern China, but there have been no previous studies focusing on the spatiotemporal patterns and the risk factors for HBV in the area. This study explored the spatiotemporal pattern and temporal change trends of the disease and detected the risk factors associated with HBV infection. The results indicate that the relative risk of HBV infection is generally decreasing, and the high infection risk is mainly found in rural areas with low population densities and low economic levels.
Although there presented interannual variation, the relative risk of HBV infection in the whole region followed a decreasing trend for 2007–2012. This result is consistent with the findings from previous studies. For example, Zheng et al. used the data from the national serosurvey conducted in 2006 and found that the HBsAg prevalence in 1- to 14-year-old children in eastern, central and western China has significantly decreased in recent years [Reference Zheng23]. Chen et al. analysed the prevalence of HBV in the 1- to 59-year-old population in six regions of China and found an apparent decrease of HBV prevalence in all regions [Reference Chen24]. Dong et al. found that in the decades since 1996, the incidence of HBV infection has decreased significantly, by 30% [Reference Dong10].
Routine hepatitis B immunisation of infants primarily accounts for the decreasing temporal trend in HBV incidence. Nationwide immunisation was recommended by the Ministry of Health in 1992; at that time, parents paid for both the cost of the vaccine and a user fee. In 2002, the hepatitis B vaccine was fully integrated into the routine infant immunisation schedule; as a result, parents only paid the user fee, while the vaccine was made freely available. This current study implies that the immunisation programme has been effective.
Although the relative HBV risk has exhibited an overall decreasing temporal trend, the local spatial trends have revealed apparent heterogeneity. Hotspots were mainly located in regions encompassing undeveloped rural areas, and the trends were distinct in different regions. This may have been caused by the spatial heterogeneity of vaccine rates in different regions. For example, the hepatitis B vaccination rate of children aged 1–14 years in all of China was 81.57%, and the rate in urban areas was 87.36%; however, the vaccination rate was significantly lower in rural areas, at 75.81% [Reference Zheng23].
In addition to the vaccination rate, the disparities in economic and medical resource levels also influence the spatiotemporal heterogeneity of the HBV risk, and these factors will further affect the vaccination rate in different regions.
In the developed regions, there are many hospitals, and medical facilities are much more accessible. HBV transmission can be reduced by vaccination and timely treatment. People with a higher economic level have the advantage of access to medical facilities, as well as higher education and more healthcare knowledge. In contrast, in the undeveloped rural regions, the higher HBV risk may be related to the lack of proper healthcare and a decreased public health awareness about HBV transmission.
The level of medical resources plays an important role in HBV transmission. Areas with adequate medical resources and higher medical levels can implement effective prevention and control measures. Previous studies have reported that all pregnant women in urban areas are screened for HBsAg, and the infants of women with positive results receive the HBV vaccine and hepatitis B immunoglobulin within 24 h after birth [Reference Li25]. This is consistent with the findings of the current study that in urban areas with a high level of medical resources, there is a lower HBV risk.
There were also some limitations in the study. Although the disease data in the study came from surveillance system which covers almost all of the country's hospitals, missing data would introduce uncertainty in the results. Meanwhile, HBV infection is significantly influenced by individual activities, such as sexual activity, intravenous drug use, occupational exposure and household contact [Reference Harpaz26, Reference Lee27]. The spatial scale used in this study evaluated transmission at the county level, which may have obscured some factors via the ecological fallacy effect [Reference Openshaw28]. In future research, more micro-factors should be considered in the statistical analysis.
In summary, the incidence of hepatitis B is markedly decreasing in the Beijing–Tianjin–Hebei region; however, there is still significant regional diversity for HBV infection risk. Further efforts are needed to increase vaccine coverage in high-risk rural regions with lower economic development and medical resource levels. The findings of this study may guide the allocation of public health resources and influence vaccination strategies according to regional-specific conditions.
Supplementary material
The supplementary material for this article can be found at https://doi.org/10.1017/S0950268818003412.
Author ORCIDs
C. D. Xu, 0000-0002-9266-7309
Acknowledgements
This study was supported by the following grants: National Key R&D Program of China (2017YFC1601800); National Natural Science Foundation of China (41601419, 41531179); Innovation Project of LREIS (O88RA205YA,O88RA200YA). The funders had no role in study design, data collection and analysis, decision to publish, or preparation of the manuscript.
Conflict of interest
None.


 Open access

