
Applied to Stonehenge across many generations now, multiple techniques of archaeological research have revealed much of a 2,000-year punctuated sequence of construction, reconstruction, modification and use of this outstanding megalithic monument in Prehistory. That long history, however, appears to have come to a comprehensive end by the middle of the second millennium BC. Historically documented interest in the monument, meanwhile, suddenly burst into bloom towards the mid-twelfth century AD, subsequently to be represented in informatively diverse ways in a range of textual sources from High-medieval England and Wales. This paper approaches a detailed discussion of those medieval textual records by way of an up-to-date overview of present archaeological views of prehistoric Stonehenge, with particular emphasis on its phases and chronology. Not merely preceding that phase but indeed rooting the name of ‘Stonehenge’, however, was judicial activity at the site datable between the late eighth and late ninth century that itself is of a character that is strongly representative of how society and culture developed in the evolving kingdom of England. The appropriation of an ancient monument to the interests of the Late Anglo-Saxon state — possibly of the kingdom of the West Saxons before that — will not be a phenomenon that causes much surprise. The details of the process of historical and literary transmission have not, however, ever been fully explicated, nor has how exactly one of the most famous of ancient monuments in the world obtained its name.Footnote 1 Ultimately, the whole story of how this monument came to be perceived and represented in what were intended to be authoritative historical works proves powerfully informative on the later pre-Norman Conquest period in England, while anchoring understanding of those processes of change in a highly valued archaeological site.
The Archaeology of Stonehenge in Prehistory and Protohistory
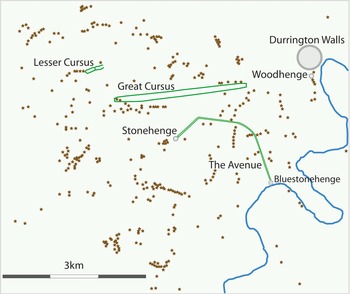
Stonehenge was already, of course, an incomprehensibly ancient monument in the Anglo-Saxon Period. The earliest known part of the extensive ritual complex, the Great Cursus, was around four thousand years old when Roman imperial rule ceased in the early fifth century AD, and even that may have had a predecessor constructed twice as far back in time (Fig. 1).Footnote 2 The great megalithic structures after which Stonehenge was named (discussed in detail below), especially the gallery of standing sarsen stones with lintels and the trilithons which one immediately thinks of as Stonehenge, were put up around a thousand years after the Great Cursus was created, and around half a millennium after the construction of an initial circular ‘proto-henge’, the axis of which was aligned through the entrance in its ditch and bank with the point of northern major moonrise. Subsequent alteration of the entrance ensured it faced towards sunrise on the summer solstice (Fig. 2), an area apparently subsequently framed with a standing megalith known as the Heel Stone.Footnote 3 The henge served as a large cremation cemetery for at least 500 years from its inception, and may well have enclosed a circle of standing ‘bluestones’ brought from the Preseli Hills and their environs in Pembrokeshire, with a similar monument less than 2km away on the bank of the River Avon that has been named Bluestonehenge. Further circular monuments from the middle of the third millennium BC stand close to the west bank of the River Avon at Woodhenge and Durrington Walls.
The most prominent features of the prehistoric landscape around Stonehenge. The small stars represent grave mounds, overwhelmingly of the Bronze Age. Drawn by the author after Cleal et al., Stonehenge in the Landscape.

Stonehenge: the ‘proto-henge’ of the early third millennium BC (a), and the final megalithic plan of the later third millennium BC (b). Redrawn by the author after Cleal et al., Stonehenge in the Landscape.

The first two phases of Stonehenge belong to the Neolithic Period, the farming Stone Age, and reflect an intimate, spiritual engagement with the land.Footnote 4 The sculpting of exceptional stones and structural use of special rocks at this site is correlated (somehow) with the transition from the Neolithic to the Copper Age or Chalcolithic and the Beaker Culture that entered Britain from the Continent.Footnote 5 Ritual use of Stonehenge would then continue for a further thousand years, up to the start of what we call the Middle Bronze Age, in the form of the addition of an ‘Avenue’, initially following the midsummer sunrise direction east of Stonehenge and then curving south towards the Avon; reorganization of the less massive bluestones; the creation of funerary barrows around the complex; the digging of two further, functionally unexplained circles of pits around the structure (the Y and Z holes); and the addition of symbolic carvings of artefacts to the stones themselves.Footnote 6
The effective abandonment of Stonehenge in or by the fifteenth century BC appears startlingly abrupt and complete; it is evident that the population of the next fifteen hundred years, of the Middle and Late Bronze Age and pre-Roman Iron Age, had no use for the monument. Iron-age pottery has been found there, in one case possibly deposited deliberately in some form of ritual behaviour, so it was not entirely unvisited or even avoided.Footnote 7 There is also considerable evidence of deliberate chipping away of the great stone blocks, and in 1956 Atkinson hypothesized that, early in the Christian era, the new Roman rulers of Britain started to demolish the monument because – comparably with the Temple in Jerusalem – it could serve as a focal point for British and druidic resistance.Footnote 8 The arguments against this suggestion are that, if so, it is difficult to explain why the Romans did not make a more thorough job of slighting the structure, while the belief that Stonehenge retained some major cultic and centralizing status in the Iron Age is simply an outdated one, characteristic of what was understood in British Prehistory up to the mid-twentieth century, rendered obsolete by the accumulation of better chronological evidence from the 1950s onwards.Footnote 9 Atkinson carefully noted that he was referring to the presence of stone chippings in distinct layers high in the fill of the Y and Z holes associated directly with sherds of Iron-age and Roman pottery. More extensive excavated and stratigraphical evidence now, however, attributes most of the stone chippings present over the site to the prehistoric dressing, and in some cases re-dressing, of the megaliths, although there was also some quarrying of the stone for other purposes around the Middle Bronze Age.Footnote 10
The next clearly evidenced phase of activity dates from late in the Roman Period, in the fourth to fifth centuries AD. While it is not entirely clear what was going on at Stonehenge around the time that Roman imperial rule collapsed, it would appear to have included human burial.Footnote 11 A small-scale excavation within the stone circle of 2008 found what was suspected to be the end of a grave, containing a late fourth-century coin, alongside a ‘shaft’ or pit with a large amount of animal bone, both domesticated and wild, and Late-Roman pottery in the fill. Disturbed and scattered, radiocarbon-dated human-bone fragments around the site also include a piece of skull dated to the fourth century AD.Footnote 12 Alongside, and not necessarily contrary to, the Christianization of Late-Roman Britain, the establishment of new burial grounds by older ritual sites is a recurrent phenomenon, especially in what is now the South-West of England.Footnote 13
This brings us to the threshold of the Anglo-Saxon Period chronologically; it is of real contextual interest that, geographically, Stonehenge is situated equally close to but just beyond the western limit of the Anglo-Saxon cultural zone of the fifth and sixth centuries (Fig. 3). The River Avon, running south through Wiltshire and then more or less along the border between Hampshire and Dorset, forms the western edge of the distribution of characteristic furnished burial sites of that particular chronological horizon and context – identified as the Migration Period over much of western Europe. Moreover, this was a de facto boundary that was established early. There is an important burial site at Petersfinger, east of Salisbury, with both characteristically Saxon and Frankish weaponry datable to the second half of the fifth century; a little further north, on the Bourne above its confluence with the Avon, a cemetery at Winterbourne Gunner has comparable material, if less of it.Footnote 14 A cemetery at Harnham Hill uncovered in the nineteenth century lies just to the west of the Avon and south of the Nadder, and was in use by the very early sixth century.Footnote 15 More sites are known from the sixth century, but none appear any further west until the seventh century, represented then by well-furnished barrow graves at Coombe Bissett, Rodmead Down and Salisbury Racecourse (male) and Swallowcliffe Down (female).Footnote 16 Of particular interest in relation to Stonehenge are seventh-century burials – again nineteenth-century finds and imperfectly recorded – from Shrewton, only some 7km west of the monumental site.Footnote 17 It is in the same phase that we find comparable burial sites spreading west into Dorset and Somerset, and this cultural shift and diffusion must be correlated in some way with the progressive annexation and acculturation of this area of the south-west by the kingdom of the Gewisse, soon to be known as Wessex.Footnote 18 None of this need imply that Stonehenge was some sort of precious totem for the post-Roman Britons of Dumnonia, defended from incursion at all costs; this is a perspective that may equally realistically reinforce a sense of the liminal nature of Stonehenge as a site in post-Roman/Early-medieval southern Britain.
Anglo-Saxon cemeteries of the fifth/sixth centuries (red) and late sixth/seventh centuries (blue) in southern Wiltshire around Stonehenge.

Medieval Historical Sources
Rather than territorial perspectives, however, what is most pertinent for the present study is to develop the chronological perspective, book-ending the evidence for Stonehenge in relation to the Anglo-Saxon Period from just beyond that period, in the two earliest sources that name Stonehenge as such, dating from the 1130s. The first of these was Henry of Huntingdon, who, early in his Historia Anglorum, included Stanenges amongst four wonders (mira) in England:
Quatuor autem sunt que mira videntur in Anglia… Secundum est apud Stanenges ubi lapides mire magnitudinis in modum portarum elevati sunt, ita ut porte portis superposite videantur. Nec potest aliquis excogitare qua arte tanti lapides adeo in altum elevati sunt uel quare ibi constructi sunt.
There are also four things which appear as marvels in England… The second is at Stanenges where stones of extraordinary size have been raised in the manner of doorways, and appear as doorways placed on top of other doorways. Nor can anyone work out by what art such stones have been lifted thus, or why they were constructed there.Footnote 19
We do not know what source Henry followed here, but as an author he was characteristically scrupulous, one might even say obsessive, as a collector and excerptor of available materials. Lists of the ‘wonders’, or mirabilia, of various regions are widely found in Early-medieval literature, not least in the ninth-century Historia Brittonum compiled by ‘Nennius’.Footnote 20
In an expanded version of Historia Anglorum made around a decade after the first version, c. 1139–40, Henry added a Book VIII, in the form of a letter addressed to one Warinus Brito (interpreted as ‘the Breton’), in which he summarized details from Geoffrey of Monmouth’s De gestis Britonum, usually known as the ‘History of the Kings of Britain’, including more stories about Stonehenge from that source.Footnote 21 He explained precisely how he had been provided with a copy of Geoffrey’s work at the Abbey of Bec in Normandy when on a journey to Rome.Footnote 22 Geoffrey’s story is that Stonehenge was a funerary monument of the immediately post-Roman Period, erected by Aurelius Ambrosius on the advice of Merlin in memory of 460 British noblemen treacherously slain by Hengest in the Salisbury/Amesbury area:Footnote 23
Cui Merlinus: ‘Si perpetuo opere sepultam virorum decorare volueris, mitte pro chorea gigantum quae est in Killarao monte Hiberniae. Est etenim ibi structura lapidum quam nemo huius aetatis construeret nisi ingenium artem subvectaret. Grandes sunt lapides, nec est aliquis cuius virtuti cedant. Qui si eo modo quo ibidem positi sunt circa plateam locabuntur, stabunt in aeternam.’
Merlin said to him: ‘If you wish to dignify the men’s grave in a permanent manner, send for the chorea gigantum which is on Mount Killaraus in Ireland. There, there is a structure of stones which no one of this age could put up unless cleverness underlie contrivance. The stones are huge, and too much for any man’s strength. If they are erected in the same way to encircle the place, they will stand for ever.’
This megalithic circle is thus almost certainly attributed to Uisneach in Killare, Leinster, where such monuments abound;Footnote 24 even there, according to the tale, it had previously been transported by giants from furthest Africa. It is named chorea gigantum, which is usually, and accurately, translated ‘Giants’ Dance’, even though no legends involve any sort of dancing. The removal of the stones, won by military force, from Ireland, could only be done by Merlin’s ingenious and unspecified ‘machinations’, and their inauguration on Salisbury Plain was further associated with the crowning of Aurelius as the legitimate King of Britain, and the re-establishment of regular church governance at the metropolitan sees of York and Caerleon:
Cumque haec et cetera in regno suo statuisset, praecepit Merlino lapides circa sepulturas erigere quos ex Hibernia asportaverat. At ille, praeceptis eius oboediens, eodem modo quo in Killarao monte Hiberniae positi fuerant erexit illos circa sepulturam, ingeniumque virtuti praevalere comprobavit.
When he had settled these and other things in his kingdom, he commanded Merlin to erect the stones he had brought from Ireland around the graves. And he, obeying Aurelius’ commands, erected them around the grave in the same way that they had been placed on Mount Killaraus in Ireland, and proved that cleverness was greater than force.
It is appropriate to emphasize that Geoffrey composed this just as Stephen succeeded to Henry I as King of England and the twenty years of dynastic civil war known as the Anarchy broke out: those political concerns were no fairy-tale matters. The so-called ‘Giants’ Dance’ was subsequently also the burial place of Aurelius Ambrosius, Uther Pendragon, and Constantinus, Arthur’s successor.Footnote 25
There is a curious disjunction in Geoffrey’s text between the burial of Constantinus and all the previous events at chorea gigantum, more than the substantial break caused by the tales concerning King Arthur. Constantinus lost his life as a forfeit for the slaying of Mordred’s sons in sanctuary. The chorea gigantum is not named here, but rather we are told that Constantinus was buried ‘inside the structure of stones’ for which the English name is then given: Stanheng.
Exin quarto anno, sententia Deo percussus, iuxta Uther Pendragon infra lapidum structuram sepultus fuit quae haud longe a Salesberia mira arte composita Anglorum lingua Stanheng nuncupatur.
Within the fourth year from that, struck down by God’s judgement, he was buried alongside Uther Pendragon inside the structure of stones which was put together by some marvellous skill not far from Salisbury and in the English language is called Stanheng. Footnote 26
This does look like an ad hoc narrative adaptation: Stonehenge seemed to be the right place to inter the immediate successor to Arthur, Uther Pendragon’s son whose death is not part of the narrative, even though he was carried away letaliter vulneratus, ‘mortally wounded’, to the island of Avallon.Footnote 27 Geoffrey would appear to have chosen here also to align his text with information known to and used by Henry of Huntingdon, giving the English name of the monument. Henry’s initial account had been basically descriptive, even if plainly inaccurate in talking of two storeys in the structure; however, as the trilithons are taller than the sarsen gallery, a description or perhaps even a sketch of Stonehenge could easily give this impression. His account may also be called ‘scientific’ in declaring it a mystery how such enormous blocks were raised. Geoffrey’s history, conversely, points to a folkloristic source of narrative legend, together with the practical belief that these special stones had some intrinsic healing powers:
Erat autem causa ut balnea infra ipsos conficerent cum infirmitate graverentur. Lavabant namque lapides et infra balnea diffundebant, unde aegroti curabantur. Miscebant etiam cum herbarum confectionibus, unde vulnerati sanabantur. Non est ibi lapis qui medicamento careat.
The use [of the massive stones] was that they would make baths inside them when they were afflicted by illness. For they would wash the stones and pour that into the baths where the sick would be cured. They would also mix in herbal concoctions and the wounded would be healed. There is no stone there which lacks medicinal power.Footnote 28
Such ideas self-evidently could also explain the chipping of the megaliths and the scattering of sarsen and bluestone flakes around the site.
These two Norman-period authors thus represent points at which earlier traditions moved into the literary record. The so-called ‘Brut’ chronicle tradition then persistently and regularly reproduced Geoffrey’s para-Arthurian account throughout the rest of the Middle Ages – in the vernacular languages of English, Anglo-Norman and Welsh. The next real change of direction in the dominant discourse about Stonehenge came with the advent of Renaissance antiquarianism in the sixteenth and seventeenth centuries, in reflections and studies by, primarily, Leland, Camden, Speed, Inigo Jones, and John Aubrey – all of which are fascinating in their own right, but not the subject of the present discussion (Fig. 4).Footnote 29
William Camden’s view (a) and Inigo Jones’s plan (b) of Stonehenge.

Naming the Monument
The Welsh and English names of the monument reveal much about the depth and character of the pre-literary, Early-medieval, traditions that Henry and Geoffrey finally recorded in the 1130s; so too do the attempts that they and the historian Wace made to represent and interpret those names in the Anglo-Norman dialect of French that was their primary vernacular language and the Latin that was the normative written language. For the Welsh version of the name, we have to turn to the Middle Welsh versions of the Brut Chronicle, collectively usually known as Brut y Brenhinedd, ‘The Brut of the Kings’. Here again there are multiple, independently translated and then hybridized versions of the work, of which the earliest date from the thirteenth century. Nonetheless there is real consistency in the use of the name Côr y cewri for the chorea gigantum of Geoffrey’s Latin text, from the first time it is referred to by Merlin in his advice to Aurelius Ambrosius (Emrys), through all of the subsequent returns to the site for the burials of successive kings of Britain:Footnote 30
VIII, 10: Ac yna y dywavt Myrdin: ‘Arglvyd,’ heb ef, ‘o mynny di teccau bedravt y guyr hyn o dragywydavl weithret, anuon hyt yn Ywerdon y gyrchu cor y keuri y syd yno y mynyd Kilara.’
And then Merlin spoke: ‘Lord,’ he said, ‘if you will honour the graves of these men with a permanent work, send to Ireland to fetch Côr y cewri that is there on Mount Kilara.’
VIII, 16: [the interment of Emrys] ‥a ry daruot y esgyb y wlat y gladu ger llav mynachlog Ambri o uyvn cor y kevri, y lle yr wnathoed chun yn y uyvyt ac y gorchymynassei y gladu yno.
… finally the bishops of the country buried him close to the monastery of Amesbury within Côr y cewri the site he previously constructed in his life and had commanded he be interred there.
VIII, 24: [the interment of Uther Pendragon] Ac yno y myvn cor y keuri, ger llav Emrys Wledic y uravt, y cladassant trvy urenhinavl arvylyant.
And there [close to the monastery of Amesbury], inside Côr y cewri, alongside Emrys Wledig his brother, they buried him with royal honours.
XI, 24: [the interment of Custennin [Constantinus] son of Cador] Ac odyna ym pen y tryded vlvydyn y llas Custennyn y gan Kynan Wledic, ac y cladvyt yn cor y keuri ger llaw Uthyr Pendragon yn emyl Salsbri.
But three years after that, Custennin was killed by Cynan Wledig, and he was buried in Côr y cewri alongside Uther Pendragon, close to Salisbury.
The names Côr y cewri and chorea gigantum are similar but not identical. If the former were simply a Welsh translation, or rather mis-translation, of chorea gigantum it would imply confusion of Latin chorea, ‘a ring-dance’, with chorus, ‘choir’ – with the latter having the double sense of a group of singers and the location in a church in which they sang.Footnote 31 There is evidence of a sense of côr, however, quite plausibly with a much deeper history in the Celtic language-group, meaning an enclosure or ring, preserved in a largely obsolete vocabulary of compound nouns and place-names: amgor, bangor, ysgor and possibly cored. Footnote 32 A relatively ancient name meaning ‘Giants’ Ring’ obviously makes best sense for Stonehenge. If that is the correct etymology of the Welsh name, it must have been Geoffrey of Monmouth in the early twelfth century who misunderstood the element côr and falsely connected it to chorea. In that light, it is all the more significant that where the Welsh versions report the burial of Constantinus, it was treated as unnecessary to follow Geoffrey’s text in giving the English name for Stonehenge, even though the city of Salisbury is named as such, using the English form. That the implicitly familiar Welsh Côr y cewri is used again indicates how familiar this name was.
The etymology of the quite different English name that has come down to us as Stonehenge has long been understood. Geoffrey probably had a better idea of what it meant than he did Côr y cewri. He spells the first element stan in the standard Old English manner, although in the twelfth century the pronunciation must have been shifting towards the Middle English /stɔ:n/ that would eventually give us modern /stəʊn/, ‘stone’. The second element is just a little more problematic, although it is clear that it derives from the Old English feminine noun hengen. Footnote 33 It is possible that Henry of Huntingdon’s Stanhenges was simply meant to pluralize the noun; if so, the root, like Geoffrey’s stanheng, has lost what should have been the ‘correct’ Old English inflection of that noun, although in fact no plural form of hengen is known in the corpus of Old English text. It is alternatively possible that Henry’s final -s is the nominative singular ending of an Old French masculine noun; whatever the case, both the simplification of inflectional endings in the transition from Old to Middle English in the twelfth century and further Francophone simplifications when trying to reproduce these names, are completely typical, and mean that we can still identify the second element as a word which in Late Old English was very clearly related to the verbs hōn and hangian, ‘to hang’, but overwhelmingly had connotations of judicial control and punishment.
This feminine suffix, Germanic *-injō, added to the root of the verb ‘to hang’, *hanχian, is one which when added to a verb produces an abstract noun: i.e., from ‘hang’ to ‘hanging’. The noun hengen is recorded in use primarily in the Homilies and Saints’ Lives of Ælfric from the very end of the tenth and beginning of the eleventh century; earlier examples occur in the Laws of Alfred and the Cleopatra Glossary. In the former, the placing of an innocent man on hengenne brings higher compensation than if the victim had been flogged; in the latter hengen glosses ergastulum, ‘a house of correction, penitentiary’.Footnote 34 Cnut’s second law-code of the 1020s uses the term for a place of custody in which a man lacking sureties will be held before undergoing the ordeal to establish his non-criminal status.Footnote 35 It is not entirely clear whether Ælfric would have pronounced this word /hendǯən/ or /heŋjən/, both of which variants could have been current. The former would be expected, but spellings with medial <cg> implying /dǯ/ are a distinct minority. Although it is not frequently or widely used in surviving Old English texts, the structure and derivation of this word shows it must have been part of the vocabulary for centuries. The more strictly legalistic usages outside of Ælfric’s writings imply ‘confinement’ as a relatively long-standing sense of the word. Susan Irvine’s thorough and informative study of Ælfric’s use of precisely this term concluded that he used it persistently in portraying the execution and martyrdom of Christian saints.Footnote 36 While one might think of more diverse translations in some cases, it is relevant that the range of definitions identified by the Dictionary of Old English include only one occurrence with the sense of ‘hanging’,Footnote 37 the remainder being the cross or rack used for torture. Irvine’s analysis and interpretation show how Ælfric used the term recurrently in such a way as to at once universalize the suffering of those martyrs – they faced the same brutal treatment – and to individualize their stories by varying associated details.
Both Henry of Huntingdon and Geoffrey of Monmouth knew the English name for Stonehenge of this very Late Old English/Early Middle English period. Geoffrey, however, implicitly knew a Welsh name and a legend associated with it, and used that by preference, although he may not have understood the name perfectly. A slightly later text, of the 1150s, that proves valuable and informative on the range of sources about Stonehenge and which must have been circulating around the second quarter and middle of the twelfth century is Wace’s Anglo-Norman translation of Geoffrey of Monmouth’s Historia known as the Roman de Brut. Footnote 38 This includes all of the episodes referring to the monument found in Geoffrey, in the same order, but in a manner that focuses attention on the names of the monument when it is re-erected on Salisbury Plain. The initial references, to the stones in Ireland, faithfully translate Geoffrey’s chorea gigantum with a correct understanding of chorea as the equivalent of the popular carole circle-dance of the twelfth century:
Transported to England, however, added to the source material is a careful summary of the names of the monument in all the current vernacular languages:
Senhange looks corrupt, but the simplification of initial st- to s- is a phonologically logical adaptation to contemporary French, where the initial consonant clusters st- and sc- were in the process of splitting with the introduction of a new initial syllable e-. Footnote 41 The final -ge in this spelling shows that a pronunciation as /hendǯ/ was current then. The French translation, pières pandues, is rather strange and potentially ambiguous, grammatically, as the final -s could be either the nominative singular or the oblique-case plural. Strictly we might expect the nominative here, but Wace tends to put a name in this construction into the latter form, and Judith Weiss accordingly translates this as the plural.Footnote 42 Pières is a masculine noun corresponding exactly to ‘stone’; pandues is the past participle of pendre, ‘to hang’, hence the translation ‘hung stones’. The most plausible explanation for that seems to lie in Geoffrey’s form heng. Wace and his Francophone contemporaries presumably knew that heng was the regular past tense of Old English hōn, ‘to hang’, and he may have adapted that as best he could by substituting the Old French past participle to create a version of the name that made at least some sense. If this hapax legomenon really were such a literal translation, however, ‘stone’ could correctly be translated in the singular.Footnote 43 Moreover, although it cannot be taken as all the proof that is needed that Côr y cewri was a long-established British name for the monument, the fact that Wace firmly states that carole as gaianz represents that vernacular form merits emphasis.
The plot thickens, however. The next time the monument is named is just a hundred lines further on, around the death and burial of Aurelius Ambrosius. In giving directions for his burial, the dying king uses only the English name:
When this is carried out, the text reverts to the direct translation of chorea gigantum:
Intriguingly, one copy of the text reads la gaiole as gigans here: ‘the Giants’ Jail’.Footnote 46 It appears that most editors believe gaiole in this manuscript is a scribal error for carole. But that is not a particularly plausible mistake; gaiole is a perfect translation of Old English hengen, and that this is rather an aberration or slip which reveals another facet of what was thought or known in Francophone circles is intrinsically plausible. The manuscript in question is not otherwise characterized by persistent carelessness in copying. For the two further references in Wace’s Brut, when Uther Pendragon is buried alongside his brother Ambrosius at Stonehenge and considerably later on, when Constantinus joins them, we have a different ‘Middle Franglais’ version of the name, reflecting the correct English structure but adapting it to French pronunciation by introducing the new initial syllable, normally in the form Estanhenges, sometimes Stanhenges, although both spellings could represent the four-syllable variant.Footnote 47 The forms here have the same final -s as Henry of Huntingdon’s representation of the name; in both cases, however, the name follows the preposition a, ‘to’, and so is to be parsed as the oblique plural.
This all suggests that what in twelfth-century English should have been /stɔ:nhendǯ/ was the familiar name, and implicitly was the name used by default even within the Anglo-Norman speech community; that in turn implies that information about the existence of this monument was circulating quite widely. In his first list of names, Wace attempted to reproduce the English name more closely, but later he used forms that were more comfortable Anglo-French variants. The appearance of the form gaiole as gigans is truly astonishing, because it does imply recognition of the Old English term hengen as a legal term for a prison. Just two-hundred lines prior to that, all of the variants of Wace’s Brut otherwise consistently reflect a form of the name read as heng, /heŋ/, quite differently. That is puzzling to say the least, but it underlines the complexity of traditions, linguistic competence, and even pronunciations then current in a way that is itself thoroughly realistic.
By the late thirteenth century, possibly the early fourteenth, there was an Anglo-Norman prose Brut, showing dependency on a range of sources, primarily Geoffrey of Monmouth’s Historia and Wace’s Brut. Footnote 48 This follows Wace in using la carole des geaunz in the first instance, naming the monument that is seized from Ireland, but then rapidly declares that Aurelius Ambrosius (here Aurilambros) fist apeler le leu Stonhenge, ‘had the site named Stonhenge’, as soon as the stones were re-erected in England. That is the only form of the name used from there onwards.Footnote 49 A more independent and highly important further source is the Middle English alliterative verse Brut of Laȝamon, a priest at what is now Areley Kings on the Severn in northern Worcestershire, composed around the turn of the twelfth to thirteenth centuries. This equally introduces the English name, Stanhenge, as soon as the monument is put up in England:
Before that, however, while the monument is still in Ireland, it is named the ‘Giants’ Ring’, consistent with the most plausible interpretation of Welsh Côr y cewri rather than Geoffrey’s chorea gigantum or Wace’s carole as gaianz:
The noun eten, etayn derived from Old English eoten remained in use throughout the Middle English period but is by no means common there.Footnote 52 It is once used elsewhere in Laȝamon’s Brut;Footnote 53 the two versions of this text are the only source which has the abnormal development of the final consonant to -nt or -nd, which the Middle English Dictionary suggests may have been influenced by Old French geaunt. That is a basis for suggesting that the name cited by Laȝamon was one of some antiquity rather than his own idiosyncratic coinage, and it is equally unlikely that this was his own interpretation of Geoffrey’s chorea or Wace’s carole which accidentally concurs with the archaic sense of Welsh côr. Footnote 54 The area of Worcestershire Laȝamon was from was not so remote from Wales as to render it incredible that Welsh traditions could have been preserved there.Footnote 55
Stonehenge in the later Anglo-Saxon Period
In the Old English of later Anglo-Saxon Wessex, therefore, Stonehenge was known by a name which is most readily translated as ‘stone prison’. This situates Stonehenge conceptually in the Late Old English judicial landscape. Despite the weakness of lexical evidence for such a definition of the word hengen, one may readily believe that the trilithons were also or had been imaginatively identified as mysterious, even gigantic stone gallows — and yet nothing in Old English or any other Anglo-Saxon source refers explicitly to giants, even though we know that substantial old stone structures were thought of as enta geweorc, ‘the works of giants’.Footnote 56 It is precisely in the Late Anglo-Saxon Period, centred on the period from the ninth century to 1066, that the archaeology of jurisdiction becomes a prominent and regular feature of the controlled, material shaping of the landscape in England.Footnote 57 Royal power and government were developing, in terms of display, from an older system of exceptional displays of wealth and military strength in the form of splendid arms and armour, palatial halls and feasting equipment, towards the esoteric symbolism of regalia such as the crown and the ritual of coronation. This went hand-in-hand with an ever closer, mutually supportive relationship with the Church hierarchy within the kingdom. Relations and duties throughout society were also transformed by the enforcement of lordship and surety bonds, and kings had begun to update and revise law-codes on a recurrent basis.Footnote 58 Criminal acts became more than torts against the victims as treacherous defiance of the decrees of God and the King. Execution cemeteries, demonstrating the authorities’ power and control, are found widely across southern and eastern England.Footnote 59
An illustration in an eleventh-century manuscript of the Old English translation of the Hexateuch books of the Old Testament – i.e., primarily the Mosaic Law – portrays Pharaoh hanging his baker, in accordance with Joseph’s interpretation of the baker’s dream (Fig. 5); Pharaoh is depicted, however, as a contemporary Anglo-Saxon king with his witan or council.Footnote 60 And it portrays a contemporary gallows. This anachronism is not just a matter of making the historically remote Old Testament era familiar. It places the Anglo-Saxon royal establishment and its officers in an ancient and unbroken line of consistency from the Old Testament times. And that fits exactly with the interpretation of Stonehenge represented by the monument’s Late Old English name. To use Susan Irvine’s term, seeing these stones in terms of the hengen ‘universalizes’ them: the imaginative identification implies that this mode of punishment and control has existed from time immemorial, even in the preternatural deep past of gigantic or ‘Cyclopean’ beings.Footnote 61 This is a continuity which both roots and legitimizes the modes of social control in the present, and makes them even less challengeable.
The hanging of Pharoah’s baker (Genesis 40). British Library MS Cotton Claudius B.IV, fol. 59r.

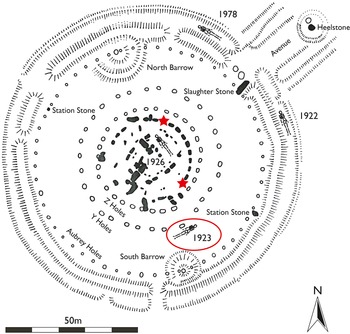
Further still, we can plausibly count Stonehenge amongst the execution burial sites of the later Anglo-Saxon Period. Excavations carried out there a century ago, in 1923, found a human skeleton buried inside the ditch and bank but outside the circle of Y holes: in fact about half-way between the visible features of the bank and the standing stones (Fig. 6). This was presumed to be a prehistoric grave, or possibly of the Roman Period, but in 1999 the rediscovered human remains were radiocarbon dated and identified as of the Anglo-Saxon Period. Actually that radiocarbon determination, which assigned the body to the seventh century AD, was soon discovered to be inaccurate. A corrected replicate dating a few years later was more in line with the wider execution-cemetery horizon, albeit, on its own, covering a broad range between the last three decades of the seventh century and the end of the ninth century (see Appendix).Footnote 62 Also clear from the osteologist’s study of the skeletal remains published in 2002 was that this man had been executed by beheading. Given the date at which he was killed, the decapitation of this victim is highly characteristic of this group of execution burial sites and would be quite abnormal in any other circumstances.Footnote 63 Study of some of the biochemical isotope levels in the bones also indicated that he was relatively local to the site: most likely from a zone with Stonehenge at one end, and extending north and east from there through Berkshire and up to the Chilterns.Footnote 64
Stonehenge: the location of the Anglo-Saxon decapitation burial. Plan kindly supplied by Mike Pitts and reproduced with permission.

This skeleton had in fact previously been sampled for radiocarbon dating in rather curious circumstances in the 1970s, and the result of that dating is consistent with the corrected second dating of the 2000s. The two results can be combined, and this narrows the radiocarbon age and subsequent calibrated date a little (Fig. 7a). While this individual might be counted amongst the isolated ‘deviant’ burials of this period,Footnote 65 there are additionally very close radiocarbon dates from two separate, uncremated human teeth found at other points around the stone circle.Footnote 66 While there cannot be any certainty that single teeth have come from dead bodies, let alone from execution victims, and it is no small question how these small items ended up in the fills of the contexts from which they were excavated, it is perfectly reasonable to explore the possibility that they represent the same phase of use of the site for execution as the decapitated body. We can use mathematical modelling to postulate that these remains represent a single coherent phase of this activity, in a method that both tests the statistical strength or validity of that hypothesis and then recalculates the probable dates of the remains if that hypothesis is true (Fig. 7b). These results are consistent with the radiocarbon date for the skeleton on its own, but narrow the range significantly: it appears probable, as a result, that a period of use of Stonehenge for execution was from c. AD 770 to c. AD 890. That is consistent with what we know of the historical context and fully in line with comparable archaeological evidence.Footnote 67
a) Combined dates on the Stonehenge decapitation burial; b) chronological model of the postulated Stonehenge execution phase.

Understanding and interpreting Anglo-Saxon Stonehenge
Stories about an archaeological site or monument transmitted through folklore or literature readily invite and support inter-disciplinary examination and interpretation. That perspective may then highlight the diversity of active lines of engagement with and conceptualization of whatever particular object is under consideration. It is scarcely surprising that Stonehenge, a ‘marvel’ in the landscape as Henry of Huntingdon introduced it, should prove especially fruitful for such approaches. In considering how Stonehenge imposed itself upon consciousness in Early-medieval Britain, it is salutary to reflect upon the fact that it is quite possible, even likely, that none of Henry, Geoffrey, Wace or Laȝamon ever actually saw the monument itself. They must have relied largely on descriptions, stories, and not improbably sketches. But the cumulative body of the medieval engagements with this prehistoric monument that we can follow is far more than solely a matter for the study of sources and intertextual transmission. The variance within the accounts points to a diverse set of individuals, in different circumstances, both drawing on and continuing to complicate non-unified traditions. Behind all of this is the insistent fact that the wave of interest in Stonehenge which burst into the literary canon towards and around the middle of the twelfth century existed not because these were good and useful stories to tell but because the monument was there. Particular reasons why it should impose itself increasingly on public consciousness at this date included not least the development of Sarum, later Salisbury, as a church and regional centre in the Norman Period.Footnote 68
Comparison of the archaeological evidence with the nomenclature and literary traditions that go with it reveals a startling and intriguing level of congruency. Stonehenge does appear likely to have been both a Late-Roman burial site and a Late Anglo-Saxon execution site. Far deeper than that, the legend of chorea gigantum having been transported over the sea from the west and re-erected on Salisbury Plain harmonizes in an extraordinary manner with the fact that the megaliths known collectively as the bluestones came from a number of sites on the northern side of the Preseli Hills, South-West Wales.Footnote 69 Of course it seems incredible that folk memory might somehow have preserved a notion of that fact through all of the changes of culture and population in territory around Stonehenge between the Late Neolithic Period and the Middle Ages. Nonetheless there are other cases in which sober scholarship acknowledges the possibility of such massively archaic traditions, and serious scholars of Stonehenge have in the past been willing to entertain similar notions.Footnote 70 Irish sources confirm the circulation of stories seeking to make sense and use of prehistoric monuments, not least megalithic structures. These provide a confirmatory context rather than a source for the tradition recounted by Geoffrey.Footnote 71
The fact that Stonehenge had been deliberately assembled using components transported from distant edges of Britain has recently been dramatically confirmed by geological research which has revealed that the Altar Stone, a slab of green sandstone nearly five metres long and one metre wide that lies close to the very centre of the stone circle, longitudinally athwart the principal axis of the monument, must have come from the north-east of Britain: somewhere between the Moray Firth and Caithness, or from Orkney.Footnote 72 There is no realistic case for this megalith, with a calculated weight of six tonnes, having been moved by natural processes to the Salisbury Plain area as a glacial erratic. This could only have been achieved with a great deal of knowledge, imagination and planning, as well as organizing the considerable effort to move the stone. The most realistic way of seeing the link between the archaeogeological facts and the folklore may be in terms of the theme of distant links and sources having been essential to the monument, rather than a specific historical memory and its geography having become distorted.Footnote 73
It is striking, though, that the medieval traditions contain no legends foregrounding the religious use of the site as a ‘pagan temple’, notwithstanding its ceremonial role in the narratives or Laȝamon’s use of a term meaning ‘to consecrate’. Nor, indeed, are there any observations of the key astronomical alignments defined by stones in the complex and the Avenue to the east. In deep Prehistory such as the Neolithic Period, we may confidently identify and describe ritual components of life and culture which leave their mark in the archaeological record. But the religious understandings or beliefs that went with those must remain beyond the modern scholar’s reach. To say as much does not render idle ‘readings’ of Stonehenge in terms of, for instance, crucial experiential binaries such life and death, the past and the future (with ‘here and now’ in between), female and male, us and our ancestors or predecessors… Such interpretations can be persuasively rooted in well-evidenced ethnological analogies, and correspond with a wealth of empirical detail, but remain ultimately unverifiable for the periods in which Stonehenge was constructed, reconstructed, and in use – before, as shown here, the Late Anglo-Saxon Period. A profound value of those suggestions is that they compel us to appreciate the potential intellectual and creative depths of prehistoric human minds.
The fact that Late-Roman rural burial sites were quite often established at pre-existing temple sites or shrines in the south-west does enhance the case that Stonehenge had been interpreted as an ancient religious centre in the fourth century AD. Some have also inferred an attribution of identification as a ‘temple’ from the belief that a long-distance routeway called the Harroway runs past the site, largely followed now by the line of the A303 (Fig. 8). In English place-names ‘harrow’ does commonly represent the Old English religious site-name hearh, reasonably translated ‘temple’. But the medieval records of this road-name relate only to a short stretch in Hampshire, where if any hearh were referred to it would most realistically be identified as the Besingahearh, presumably in the vicinity of modern Basingstoke, where a charter endowing a monastery at Farnham in Surrey was issued in the 680s.Footnote 74 It is also the case that eleventh-century Old English documentary references to this routeway as the horo weg (and variants) require interpretation as a ‘foul’ or ‘muddy’ track:Footnote 75 admittedly one could never be sure whether ‘Harroway’ were a later corruption of that, or that were itself a corruption of a hypothetical *hearga weg. But the evolution of the notion of a long-distance Harroway is readily tracked from Victorian local historians in Hampshire via the influential twentieth-century archaeologist and historical landscape geographer O. G. S. Crawford, who grew increasingly inclined to cherish the proposition between the early 1920s and 1950s.Footnote 76 This is a case of modern imagination extending a historical nugget of fact to subsume Stonehenge. Probably the strongest example of that process is the association of Stonehenge with druidism, which can be traced back to the early eighteenth-century antiquary William Stukeley and no further, albeit that Stukeley could draw upon his predecessor Edward Lhwyd’s ready association of megalithic monuments in Wales with the druids.Footnote 77
Extract from the Ordnance Survey map of Southern Britain in the Iron Age (Ordnance Survey, 1962) showing a long-distance routeway with the name ‘Harroway’ running past Stonehenge.

The excavation of an archaeological site ideally involves peeling its strata back layer-by-layer. Approaching one period in the history of the archaeological monument of Stonehenge with an emphasis on cross-disciplinary, almost multi-media, lamination produces its own set of informative comparisons and relationships. A more specific focus on our tenth- to twelfth-century documentary sources makes one deal first and foremost not with the archaeology but with the creative use of language and discourse. In this case we have to seek to explicate relationships between at least four languages in multi-lingual, post-Conquest England: Latin, French, Welsh and English. Of those, Welsh would appear to have been sidelined into the most separate, and rather a self-contained, position. But it was by no means merely or exclusively a ‘subaltern’ language, downgraded in successive colonial situations. Geoffrey of Monmouth apparently had a good knowledge of Welsh, which he made use of; it seems likely that Laȝamon, close to the Welsh March, received information from some separate but congruent source. There was unquestionably a hierarchy between all four languages, but, collectively, movement and interaction between all of the levels of that hierarchy was essential for society and culture to function as a whole.
Stonehenge is the sort of outstanding product of human artifice which, like, say, the works of Shakespeare, will be interpreted by every age with its own emphases and in its own terms. There is nothing trivial in recognizing that. In validating the promotion of interdisciplinarity, it is highly significant that archaeology can be characterized as the people of one age engaging interpretatively with the surviving physical remains of the past, be those remains objects within their homes or features of the landscape. In the two millennia from the construction of the Great Cursus to the Middle Bronze Age, the Stonehenge area passed through its first coherent multi-media sequence of archaeologies; from the Late Roman Period through to the present day, refocused recently by arguments over the re-routing of the A303 and the planned but now (again) cancelled Stonehenge Tunnel project, it has passed through another such sequence. We may justifiably characterize modern scholarly archaeology as yet another fold in the continuous roll of successive engagements.Footnote 78 To declare as much is not to relativize or undermine the primacy of the pursuit of as objective and accurate as possible a reconstruction of the past through critical examination of all available, relevant evidence; but this is a perspective that may teach us not to dismiss and then ignore other and earlier people’s engagements with and interpretations of Stonehenge as nothing more than absurd fantasies.
Stonehenge is primarily a Neolithic and Early Bronze-age monument of exceptional character. But the Early-medieval phase around Anglo-Saxon Stonehenge is much more than a quirky footnote to the ‘real’ archaeology of this site. Not least in the circumstances in which this academic periodical succeeds to a predecessor, it is valuable to recognize how the organization and representation of the past within a structured, periodized framework, along with the terminology appropriate to that, are matters which require careful attention combined with knowledge and understanding. The pivotal role of Geoffrey of Monmouth within the literary and textual sources explored here, along with the relevant archaeological and historical evidence, fit perfectly into a scheme wherein the ‘true’ Norman Period, strictly historically defined by the reigns of William I to Stephen (AD 1066–1154), forms a transitional phase between the Anglo-Saxon Period and the High Middle Ages at the end of the Early Middle Ages. Without being able to conceptualize the situation in those terms, the literati of the twelfth and thirteenth centuries were undoubtedly conscious of stress and change in their circumstances, and they made careful and intelligent use of discourse concerning Stonehenge to respond to that.
Acknowledgements
I am immensely grateful for the interest shown in this paper and advice given to me by colleagues who are specialists in Prehistory and have a wealth of experience and knowledge of the study of Stonehenge. Above all, the late Tim Darvill, who answered an enquiry in detail despite having to inform me first of all that he was by then terminally ill; equally promptly and helpfully, Mike Parker Pearson and Mike Pitts. The same level of invaluable guidance was provided on the Anglo-Saxon execution cemeteries by Andrew Reynolds. This paper was first delivered at a research seminar of the Centre for Medieval and Renaissance Studies at the University of Liverpool at the invitation of Marios Costambeys and Lindy Brady, whose encouragement to write it up and submit it to this journal is warmly appreciated. My thanks too to two anonymous referees for their time and effort in reading the first draft of the article and for their feedback.
Appendix: the Chronology of the Anglo-Saxon Execution Cemetery Phenomenon
Radiocarbon Dating Evidence
In his 2009 monograph, Anglo-Saxon Deviant Burial Customs, Andrew Reynolds summarized ‘the dating of execution cemeteries’ in an overview centred upon a tabulation of thirty dated execution burials from seven sites.Footnote 79 Eleven of those thirty were from Chesterton Lane, Cambridge, and nine from Sutton Hoo, Suffolk. We can now double that data-set (see Table 1 at the end of the article, where bibliographical references for the sites are also given). Most of the new data are from further sites, although there are also two additional radiocarbon results from the site at Old Dairy Cottage, now within a northern suburb of Winchester, Hampshire. There are twenty new results from the execution cemetery at Weyhill Road, Andover, Hampshire, the published report on which included an updated review of the chronological evidence for Anglo-Saxon and early post-Norman Conquest execution sites in England generally.Footnote 80
Within the whole new extended set there are a number of cases, unsurprisingly from the sites from which we have the highest numbers of radiocarbon datings, of dated bodies lying in a stratigraphical relationship whereby we can tell that one must have been interred earlier than the other. There are two cases of individual datings on three different men who had been put to death and buried together: in Oliver’s Battery, grave 4, just some 4.5km south of Old Dairy Cottage on the southern edge of modern Winchester, and from the mass grave at Ridgeway Hill, Weymouth, Dorset. It is appropriate, in my view, that this data-set include the latter group of around fifty men who must have formed a Viking raiding party that was captured and executed in one event. That act was fully consistent with the demonstration of judicial power by the authorities embodied in the execution cemeteries as a whole. Ridgeway Hill is, nonetheless, a special case in this context; even more exceptional is the mass grave of thirty-four individuals found in the grounds of St John’s College, Oxford, which, ever since it was discovered, has been suggested to house victims of the St Brice’s Day Massacre, undertaken on King Æthelræd’s orders, on 13 November AD 1002. That mass killing, reported in some detail in the case of Danes sheltering in St Frideswide’s church in Oxford,Footnote 81 did not involve the same solemn if brutal performance of execution as the other sites, and I keep those chronological data separate from the set of execution burial sites otherwise reviewed afresh here. Nevertheless it is a case-study that proves vitally informative in respect of the need to consider the ‘marine reservoir effect’, produced by higher levels of consumption of fish and/or shellfish, on radiocarbon results.
It seems reasonable to include the radiocarbon data from the Stonehenge decapitation burial in the data-set from the outset, even though the objective of this supplementary study is to explore how these fit with the other comparable evidence. The conversion of radiocarbon results produced initially in terms of age BP (= ‘Before Present’, where ‘Present’ is set at AD 1950) into radiocarbon dates is done according to ‘calibration’ curves, which themselves are periodically but constantly refined. The principal calibration curve is now IntCal20, introduced in 2020, where Reynolds had presented data calibrated according to the curve dating from 2004, and Healey, contextualizing the results from Weyhill Road against nearly all of the radiocarbon evidence also reviewed here, used the earlier IntCal13; the difference this makes is, however, genuinely negligible in most respects. All of these are ‘atmospheric’ calibration curves, appropriate for organisms sustained by entirely terrestrial diets and not incorporating any adjustment for possible marine dietary effects. That could have some impact on the results overall, as explained below, albeit an offset that could be especially significant towards the younger, later, end of the sequence rather than in its earliest centuries.
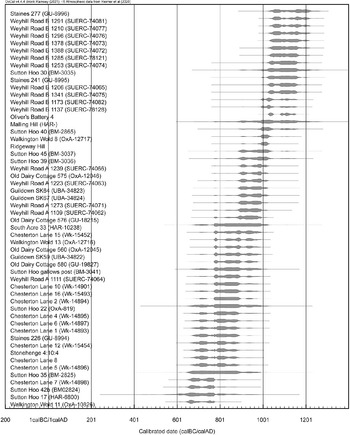
It is therefore valid, initially, to tabulate the enlarged new data-set using the atmospheric calibration curve, to explore the range and distribution of the results and of course for comparison with the data reviewed in 2009 (Table 2). As a diagram, this will represent the frequency of execution burial as represented in our data-set rather than the intensity of this practice over time, because, for example, the fifty victims in the mass grave at Ridgeway Hill count as one event in the same way as any single execution burial, such as that at Stonehenge. I have not included stratigraphical relationships other than strict contemporaneity in this diagram, even though they do redistribute frequency plausibly. The resultant pattern would be less immediately clear, and less readily comparable with the diagram published in 2009. In practice this form of modelling only redistributes the probabilities very slightly within the same overall range.
Although many of the burials from Weyhill Road, Andover, belong at the younger end of the overall sequence, the newer results all fall within the limits of the oldest and youngest samples reported by Reynolds in 2009, so that overall range cannot look any different. Reynolds’s conclusion was that ‘Overall, the series indicates that the origins of execution cemeteries are to be found at the very earliest from the second half of the seventh century and certainly from the eighth century, and that their usage continued into the twelfth century.’Footnote 82 One minor adjustment to that view which could be suggested is that the present data-set allows for rather more confidence in an early eighth-century inception of the sequence than one in the later seventh century. The highest radiocarbon ages in the data-set are from a burial from Walkington Wold, grave 11,Footnote 83 and two from Sutton Hoo, graves 30 and 42. In none of these cases does the mean of the probability distribution of the calibrated date lie in the seventh century.
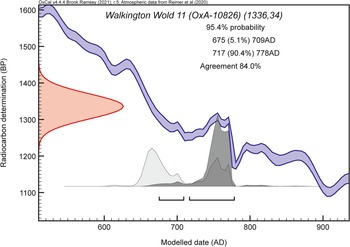
We can illustrate the structure of the data further by placing a stronger hypothetical chronological framework upon them. That is, to construct a model using the Bayesian method which postulates that the ‘Execution Burial Ground’ phenomenon constitutes a single, continuous phase of activity. That this is what the execution burials represent in a non-specialized sense is perfectly obvious from the evidence of Table 2. The process of Bayesian modelling, however,Footnote 84 will tend to draw in the extremities of the earliest and latest ends of the continuum represented by the unmodelled calibrated radiocarbon dates as shown in Table 2 – statistically, likely outlying margins of the whole data-range – towards the bulk of the dating evidence. Concurrently, though, the modelling process also calculates Start and End probability ranges for boundaries of the phase which themselves lie outside the re-calculated ‘estimated’ dates of the earliest and latest examples at either end.Footnote 85 This model specifically estimates Start Execution Burial Grounds as such a single phase as falling in cal AD 700–760 at 68.3% probability, with the probability range largely expanding back in time, to cal AD 665–770, when we look at the result at 95.4% probability. Put another way, this means there is a little less than 16% probability that the start of the series lies earlier than cal AD 700. The plot of the highest posterior density estimate for the oldest sample within this model, Walkington Wold 11, is informative. The unmodelled distribution of probability for the calibrated date is strongly bimodal: a peak in the later seventh century and another in the early to middle eighth. The single continuous phase model rejects the earlier possible range and selects instead as much as it can from the around the later peak (Fig. 9).
The highest posterior density estimate of the radiocarbon date of Walkington Wold, East Yorkshire, grave 11, modelled as the earliest dated example in a single continuous phase of Anglo-Saxon execution burial sites. The area in red is the normal distribution of the radiocarbon age, the area in light grey is the probability distribution of the calibrated radiocarbon date with no modelled constraints, and the area in dark grey the result produced by modelling. Note that the minimum ‘Agreement’ required for a valid model is 60.0%.

Other than it being a convenient reference point, there is nothing historically significant about the date of AD 700 that makes it a matter of moment whether we would assign the inception of this practice to before or after that year. But the question of when the practice started is relevant to that of how quickly it established itself. The samples in the present data-set most probably dating from before the middle of the eighth century are relatively few: those with the three highest radiocarbon ages noted just above. In the current data-set, the weight of representation changes from when the Chesterton Lane cemetery really comes into regular use. Chesterton Lane grave 7 has a relatively high radiocarbon age, which on its own has a bimodal unmodelled calibrated distribution in the later seventh and early to middle eighth centuries like Walkington Wold grave 11 (above). This body, however, is recorded as having overlain Chesterton Lane grave 1, which has also been radiocarbon dated. If we remodel those calibrated dates in a sequence with grave 1 preceding grave 7, as shown by the stratigraphy, the output has to select the earliest range of probability for grave 1, suggesting cal AD 685–740 at 68.3% probability – clearly then more likely to be of the first half of the eighth century, but still as wide as cal AD 685–815 at 95.4% probability. The modelled estimate of the calibrated date of grave 7 is of course redistributed later, to cal AD 715–775 at 68.3% probability and with 95.2% probability covering cal AD 675–830 (Fig. 10). If we attempt to construct a model for Chesterton Lane alone which presupposes that the burials represent one continuous, phase of activity, the radiocarbon result for grave 7 consistently has poor agreement with the model simply because its age is too high compared with its neighbours.
The remodelled radiocarbon dates for Chesterton Lane graves 1 (a) and 7 (b) taking account of the fact that they lie in a stratigraphic sequence in which grave 7 is later than grave 1.

Soon to be published, however, are the data from a burial site at Burnham Market, Norfolk, where an execution burial ground succeeds to an Early Anglo-Saxon, pre-conversion, cemetery, apparently with at most a short interval of time between those phases.Footnote 86 The precise radiocarbon data are not yet in the public domain, but I have kindly been shown figures based upon them which indicate there are a number of earlier eighth-century execution burials from this site. Once these data are fully accessible they will undoubtedly modify the overall profile described above to some degree. Although the preceding furnished cemetery at Burnham Market is not of the same exceptionally high status as that at Sutton Hoo, the sequences from Early Anglo-Saxon burial ground to early execution site are conspicuously similar. The precise nature and significance of such relationships must be a topic of careful exploration and discussion in the future.
Few sites have the quantity of radiocarbon data that we have from Chesterton Lane, so there are limits to how far we can compare the date-ranges of individual cemeteries. While it is unlikely that Chesterton Lane continued in use into the tenth century, the nine results from Sutton Hoo run across the whole range of the data-set from the eighth century to the eleventh or twelfth centuries. From the Weyhill Road cemetery we have twenty dates altogether, and those appear to represent three chronologically separated phases of execution burial. There may have been a hiatus between the later tenth century and the early eleventh here; in any event there was clearly a drop in frequency (Fig. 11).Footnote 87 This is interesting in light of a clause in Cnut’s second law code, datable AD 1027 × 1034, ordering that Christians should not be condemned to death for ‘small matters’.Footnote 88 More certain is that the second wave of execution burial here came to an end in the second half of the twelfth century, to be followed, after an interval, by a third phase in which the bodies of the victims were interred alongside the earlier execution burial ground but separate from it. That phase began sometime in the first half of the thirteenth century and continued for around a hundred years. While the three and four dated samples respectively from Guildown, Surrey and Old Dairy Cottage are too few for valid single-site models, they look firmly congruent and parallel with one another, representing use of those sites in the ninth and tenth centuries. The site at Weyhill Road apart, there is no clear sign of major fluctuations in the rate of executions being carried out during the period from, at the latest, the middle of the eighth century through into the second half of the twelfth century.
The sum of the individual calibrated radiocarbon dates on samples from the tenth- to twelfth-century use of the execution cemetery at Weyhill Road, Andover, Hampshire, showing the sharp bimodality that suggests a chronological division of the site into two distinct phases, here labelled Phases A and B.

The mass grave at St John’s College, Oxford, and Marine Dietary Questions
Although it should not be classified as an ‘execution burial ground’, the horrible but intriguing evidence from the mass grave within the ring-ditch of what has been identified as a Neolithic henge lying partly under the grounds of St John’s College, Oxford, sheds useful light on a key aspect of chronological analysis. Multiple severe, weapon-inflicted perimortem traumas on many of the skeletons, and the unusual charring of some bones, suggest a rabid and unequal assault consistent with that described as taking place in St Frideswide’s church, Oxford, in November 1002 in a charter issued just over two years after the event. Ever since the mass grave was discovered, there has been a strong inclination to identify these victims as ‘Danes’ slaughtered in that pogrom ordered in the name of the King.Footnote 89 While there is no immediately observable archaeological evidence other than the level and character of violence involved to indicate a direct link between this grave and the St Brice’s Day massacre, archaeogenetic studies have shown a high proportion of the victims to have a distinctly southern Scandinavian ancestral profile – recent, if not such as would suggest a first-generation ‘immigrant’ community.Footnote 90 There are other known events that could have produced such a mass grave. The Anglo-Saxon Chronicle records that Edward the Elder succeeded in taking possession of Oxford and its lands as a first step in his reconquest of the Danelaw in AD 912; that may or may not have been achieved without bloodshed.Footnote 91 In the year 1009 a Danish force reportedly burnt the burh of Oxford.Footnote 92
Calibrated date-ranges produced from the radiocarbon determinations of three bodies in the mass grave at St John’s College, Oxford. (a) R_Combine calibrated to IntCal20. (b) Combine using mixed atmospheric (IntCal20) and marine curves.

Three of the bodies from this mass burial have reliable radiocarbon determinations (Table 3).Footnote 93 The results are all statistically consistent, and can be combined to the more precise radiocarbon age of 1112±14 BP (Fig. 12a). Calibrated using the atmospheric curve IntCal20, however, this places the event in the late ninth or tenth century (cal AD 885–995 at 99.7% probability): the likelihood, on these data, of the bodies dating even just a few years later, to AD 1002, is nil. What has also been noted, however, is that certain stable isotope levels in the bone chemistry, in particular carbon-13 (13C) and nitrogen-15 (15N), suggest a significant marine component in the diet of those sampled.Footnote 94 These values are expressed as δ13C and δ15N: δ13C in these cases might be considered marginally high in an Early-medieval British context, with a mean across the dated evidence of δ13C –19.64; δ15N is rather more conspicuously elevated with a mean across the dated skeletons of +12.62.Footnote 95 We may then combine the radiocarbon dates calibrated alternatively using a mixed atmospheric and marine calibration curve, positing a marine component of 16% (±1.6%).Footnote 96 This yields the markedly different and eye-catching result of cal AD 974–1032 at 95.4% probability for this burial. It is worth reporting the result to 1-year intervals in this case, and the mean (μ) of that probability distribution, because that is μ = cal AD 1003 (Fig. 12b). This figure is beguiling, and should be treated with real caution. It does not, of course, prove that this mass grave really does represent the St Brice’s Day Massacre. It is at least a valid demonstration that it is plausible that the discovery was the product of that event late in the year 1002, or indeed of the subsequent burning of Oxford in 1009 rather than any earlier act of bloodshed.
An even higher marine component in the diet implied by a mean δ13C of –18.85 proved critical in recalibrating the radiocarbon data from the charnel pit associated with the winter encampment of the Viking Great Army at Repton in AD 878, and showing that those data and the historical date could indeed agree.Footnote 97 By the beginning of the eleventh century, however, eating a considerable amount of fish and seafood would not be something that would make ‘Danes’ stand out in England, and certainly not in urban environments – by this time, the supply of these bulk foodstuffs was becoming substantial.Footnote 98 In respect of the execution cemeteries, the availability of data on δ13C and δ15N levels in the public domain is too inconsistent at present for a comprehensive re-evaluation in light of these variables: only in the case of Guildown (n = 3), Oliver’s Battery (n = 3) and Weyhill Road (n = 16 for the first two phases) can we access both figures; for Chesterton Lane and London Road, Staines, only δ13C figures have been published; for Old Dairy Cottage, Sutton Hoo and Walkington Wold there are no immediately accessible figures for either isotope. Only two of the three bodies radiocarbon dated from the mass burial at Ridgeway Hill have these data published, and in those cases the results are sharply different. The relatively early Chesterton Lane cemetery population returns a mean δ13C of –21.1 that would be interpreted as purely terrestrial, a score matched from the three samples from Staines. Guildown, Weyhill Road and Oliver’s Battery, conversely, have mean levels >–20.00, as does the executed individual found at Stonehenge. This is not enough of a consistent pattern to be interpreted in terms of δ13C levels rising within the population at large from the ninth and tenth centuries onwards. The most significant fact is that no sampled execution cemetery population shows anything approaching the elevated δ15N levels reported from St John’s College, and in the present context it is that variable which justifies the use of mixed calibration curves, even though the calculation itself then has to be based upon δ13C.
In the case of Oliver’s Battery grave 4 the mean δ13C score of the three execution victims is –19.0, and thus close to that from the Repton charnel pit. The mean δ15N value is an unexceptional +10.3. If we apply appropriate levels of mixed curves to these sample results on the same basis as to the St John’s College data just described, the combined calibrated radiocarbon date that results lies between the mid-twelfth century and the 1230s. That is not a priori unbelievable, but it simply is inconsistent with the evidence from the execution burial grounds whose origins lie before the Norman Conquest. We get a more satisfactory result for Oliver’s Battery grave 4 both procedurally and in terms of consistency if we assume that sample 4:1, with a slightly lower δ13C level (–19.2) and much lower δ15N level (+8.2), is to be calibrated against the atmospheric curve while mixed curves are applied only to samples 4:2 and 4:3 (both δ13C –18.9; δ15N +11.0 and +11.6 respectively). This combination yields a dating for this triple burial in the 1sd range of cal AD 1050–1085 (27.8% probability) or cal AD 1120–1165 (40.5% probability) and in the 2sd range cal AD 1040–1170 (95.4% probability). Those results are just a little later and a little less precise than the calibrated dates suggested by IntCal20 (see Table 1).
Conclusions
The chronological profile of the Anglo-Saxon and Norman-period execution cemeteries of England has been reviewed in detail here in order to contextualize the discussion of the Anglo-Saxon-period human skeletal remains identified at Stonehenge, and not least in light of the availability of a considerably increased database of radiocarbon evidence. Altogether, there need be no doubt that this is a context with which the beheading and burial of a man at Stonehenge is entirely congruent, whether or not that were an isolated event there or one of a number of executions carried out at that site.
This review very largely corroborates and reinforces the conclusions Andrew Reynolds, Jane Siddell and Frances Healy had come to in earlier studies, which is highly satisfactory. We can identify that there is a need to try to develop a clearer view of the introduction and the earliest stages of this practice up to middle of the eighth century; not only in respect of dating, but with that where it first appears, and how it may have intensified and spread geographically. It is striking that no stages in the unification of the kingdom of the English in the tenth and eleventh centuries were detectably accompanied by any clear expansion of the geographical range of these sites from the south and east.
The impact of increased consumption of seafood resources from the Late Anglo-Saxon Period onwards also requires more thorough research in the future. In terms of the overall chronological profile, however, that could only possibly mean that an apparent cessation around or shortly after the mid-twelfth century of the execution cemetery phenomenon that had its origins in the Middle Anglo-Saxon Period and was so characteristic of Late Anglo-Saxon England might be set a little too early. The reign of Henry II (1154–89) was a watershed in the history of English law, marked particularly by the issuing of the Assize of Clarendon in 1166 – but that meant greater consistency and centralization of arrangements for criminal justice, not a more merciful regime.Footnote 99
By that time, in the twelfth-century literary sources reviewed in the main paper to which this appendix is a supplementary study, Stonehenge had been attributed with new meaning appropriate to that age and its conditions. Through its name, however, it retained a layer added in a preceding period of equally significant re-engagement with and re-use of that imposing monument in its open landscape setting. Detailed archaeological evidence combines with philological analysis to reveal that to us.
Radiocarbon dated burials from Anglo-Saxon and Norman-period execution burial sites, giving the radiocarbon age, radiocarbon date calibrated to IntCal20, and δ13C and δ15N measurements where available. Simultaneous burials have the combined radiocarbon ages calibrated to date. The modelled dates or ‘highest posterior density estimates’ of burials in stratigraphic sequences have not been shown.

The radiocarbon results given in Table 1 calibrated using IntCal20. Chesterton Lane 8 and Stonehenge represent two radiocarbon measurements from the same body combined, while Ridgeway Hill and Oliver’s Battery 4 are the products of combining radiocarbon data from three separate individuals put to death and buried at the same time.

Radiocarbon-dated samples from the mass grave at St John’s College, Oxford, with the isotopic data from the samples (δ13C and δ15N).


 Open access