

INTRODUCTION
Malaria is an Anopheles mosquito-borne infectious disease caused by parasites of the Plasmodium genus. Despite the morbidity and mortality declining dramatically worldwide due to economic development, continued political commitment, and effective intervention measures, malaria is still a recognized priority global public health issue with about 3·2 billion people at risk of the disease at present in 97 countries and an estimated 214 million cases occurring in 2015 [1]. After decades of large-scale national continuous efforts, the annual incidence of malaria in China has been reduced from 24 million at the beginning of the 1970s, to <10 000 by the end of 2010s [2], and just 3116 (0·22 per 100 000) in 2015 [3]. Moreover, the majority of malaria cases (over 90%) in recent years have been imported from sub-Saharan Africa and South-East Asia via migrant workers [Reference Feng4]. According to the World Health Organization, currently about 47 900 people in China live within active foci of malaria transmission, mainly limited to the counties bordering Myanmar and Laos in Yunnan Province and Motuo County in Tibet [1, Reference Feng4]. In 2010, the Chinese government launched a national campaign against malaria, with the goal of eliminating the disease by 2020 [2].
Malaria transmission depends on the complex interactions between Anopheles mosquitoes, Plasmodium parasites, human hosts, and environmental factors, as well as local socioeconomic status. Malaria is a climate sensitive disease. Climatic factors can influence malaria ecology both directly and indirectly by affecting Anopheles mosquito growth dynamics, the sporogonic cycle of Plasmodium parasites, human behaviour and mosquito–human interactions. Many ecological studies have shown that climatic factors have non-linear lagged effects on malaria transmission [Reference Reiner5]. There is a growing concern that climate change may result in an increase in the malaria burden [6]. It has been predicted that without preventive actions geographical range of some malaria vectors (Anopheles minimus and Anopheles dirus) in China would increase 16–49% by 2030 [Reference Ren7], and correspondingly, malaria incidence may increase 43–73% in high-risk areas (e.g. Huai River basin) by 2030 [Reference Song8]. Therefore, malaria control achievements gained are insecure [6]. The resurgence of malaria in the early 21st century in part of central China (Anhui and Henan Provinces) due to abnormal weather events, rapid urbanization, change of land use, increasing vectorial capacity, anti-malaria drug resistance, and population movement [Reference Gao9–Reference Huang11], alerts us to the challenges when striving towards malaria elimination. Favourable climatic conditions are the prerequisites for the survival and breeding of Anopheles mosquitoes and play an important role in malaria transmission.
Due to the differences in local climate characteristics, socioeconomic development levels, surveillance, and different empirical statistical models, climate–malaria associations might be site-specific. Inconsistent findings are found in the published literature [Reference Reiner5], making the generalization of results problematic. In this study, we aimed to investigate the climate–malaria association in nine cities selected from malaria high-risk areas in China. Results of this study provide a useful basis for establishing climate-based malaria early warning systems, optimizing resource allocation, and developing more effective malaria control and prevention measures nationally and internationally.
MATERIALS AND METHODS
Study sites
According to the published literature [Reference Feng4, Reference Yang12], traditionally there are two major malaria high-risk areas in China. The first is in Central China along the Huai River basin (longitude E111°55′ to 122°45′, latitude N30°55′ to 36°20′), the location of China's geographical North-South watershed, comprising Anhui and parts of Henan, Jiangsu, and Hubei Provinces. The climate is subtropical humid to sub-humid monsoon, and Plasmodium vivax malaria is the dominant species. The other area is in the southern and south-western regions, mainly including Yunnan, Guangxi, Hainan, and Guangdong Provinces where the climate is tropical and subtropical. Plasmodium falciparum and P. vivax malaria coexisted in these regions during 2004–2008, with a ratio of roughly 1:4 [Reference Feng4]. However, in recent years the relative proportion of P. falciparum malaria has increased significantly, reaching about 70% in 2013, due to the reduction of P. vivax and the large increase of imported P. falciparum cases [Reference Feng4]. Currently, autochthonous malaria (vivax and falciparum) is limited to some counties along the China–Myanmar border and Motuo County in Tibet.
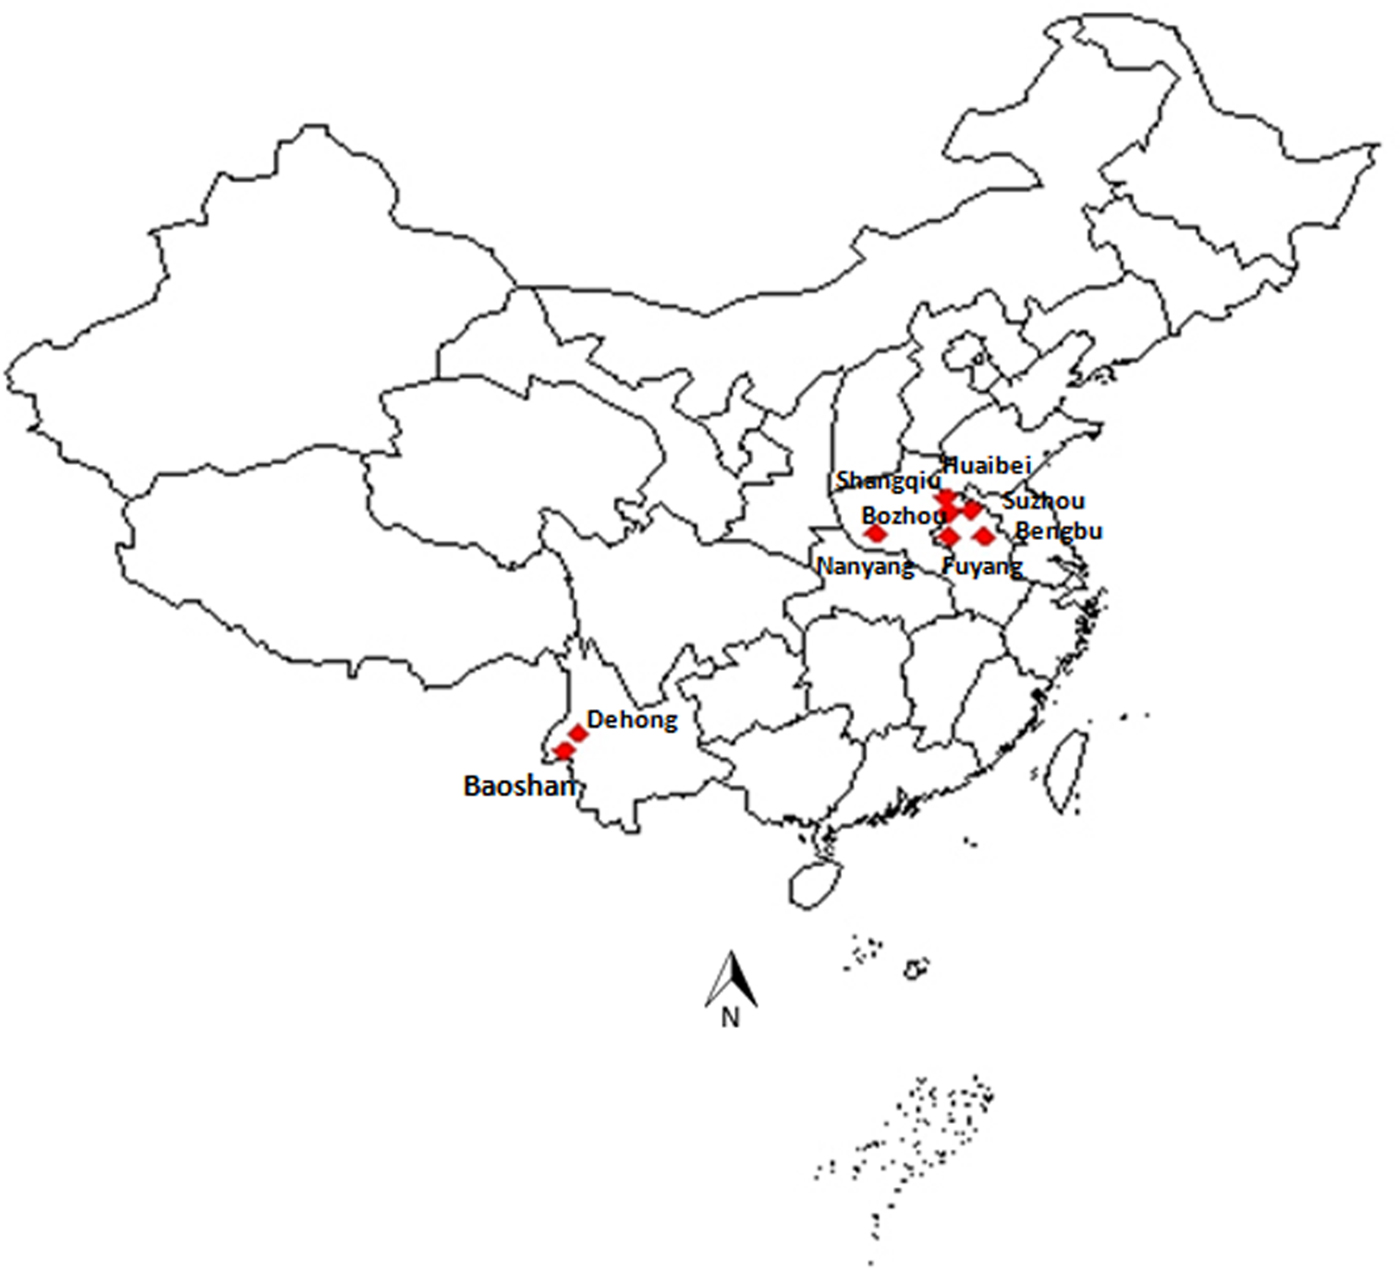
During 2004–2013, the majority of malaria cases in China occurred in the above mentioned two malaria high-risk areas, especially in Anhui, Yunnan, and Henan Provinces, which accounted for 58·1%, 16·4%, and 8·4% of the country's reported malaria cases, respectively [Reference Feng4]. Therefore, these three provinces were selected as our study sites. Based on sample size (to avoid generating excessive zero values) and the availability of weather data, nine cities were selected from above three provinces for data analysis, including five cities (Bengbu, Bozhou, Fuyang, Huaibei, and Suzhou) in Anhui, two cities (Nanyang and Shangqiu) in Henan, and two cities (Baoshan and Dehong) in Yunnan, as shown in Figure 1.
Location of nine cities selected for malaria-climate data analysis in China.
Data collection
De-identified daily reports of malaria cases for the three provinces from 2005 to 2012 were obtained from the Chinese Center for Disease Control and Prevention, who extracted those data from the China Information System for Disease Control and Prevention, an online reporting system established in 2004. Given possible variations in data quality in different locations in the first year, the data from 2004 were not used in this study. Notifiable infectious diseases in China are classified into three groups (A, B, and C in descending order) according to their severity and priority. Malaria belongs to B-category infectious diseases, which are required to be reported online within 24 h after diagnosis. Both clinically diagnosed and laboratory-confirmed cases are included in the information system and are used in the analysis. Malaria cases were diagnosed according to the national diagnostic criteria for malaria [13]. The variables included in the malaria dataset mainly comprised age, gender, occupation, dates (disease onset, diagnosis, and reporting), case category (vivax/falciparum), and site of onset. Demographic information of the nine selected cities was sourced from local Statistics Bureau websites.
Daily meteorological data including maximum (T max) and minimum temperatures (T min), rainfall, average relative humidity, sunshine duration, and maximum wind velocity for the nine selected cities during the study period were downloaded from the China Meteorological Data Sharing Service System. Ethical approvals were obtained from the University of Adelaide, the University of South Australia, Monash University, the Chinese Center for Disease Control and Prevention, and Anhui Medical University.
Statistical analysis
The epidemiological characteristics of malaria cases that occurred in the nine cities during the study period were described. Using date of disease onset, reports of malaria cases were transformed into an aggregated daily time series format and merged with daily meteorological data. The crude associations between malaria and climatic factors were initially examined graphically using restricted cubic splines with three internal knots (25%, 50%, and 75% quantiles) [Reference Desquilbet and Mariotti14].
A two-stage method was used to quantify the malaria–climate associations [Reference Stukel15] in this multi-location study, as it can synthesize inconclusive or contradictory site-specific results due to small sample sizes or regional variations. At the first stage, the quantitative city-specific malaria–climate associations were analysed using generalized estimating equation models with negative binominal distribution, a log link function and a first-order autocorrelation structure. Seasonality and long-term trend were adjusted by creating indicator variables ‘month’ and ‘calendar year’ in the model [Reference Bhaskaran16]. The duration of lagged effects was explored by cross-correlation analysis, and an optimal lag length was calculated by minimizing the Schwarz's Bayesian information criterion, the Akaike's information criterion and the Hannan–Quinn information criterion, using the Stata command ‘varsoc’. At the second stage, the estimated city-specific malaria–climate associations were pooled using multivariate random-effects meta-regression models of the first-stage effect estimates [Reference White17]. The second-stage meta-analysis was performed using Stata command mvmeta. All quantitative analyses were conducted with Stata V.14·0 (Stata Corp LP, College Station, Texas, USA). The 0·05 level of statistical significance was adopted for each test.
RESULTS
During the study period 2005–2012, a total of 163 810 malaria cases were reported in Anhui (99 676), Yunnan (46 485), and Henan (17 649) Provinces, accounting for 49·6%, 23·1%, and 8·8% of all malaria cases recorded in China, respectively. For Anhui, malaria cases occurring in the five selected cities accounted for 91·5% of the whole province's cases. For Henan and Yunnan Provinces, the percentages were 78·7% and 64·1%, respectively. As shown in Table 1, the average malaria incidence rate (per 10 000 population) ranged from 0·6 to 16·7 among the nine cities in 2005–2012. The number of male cases was about twice (1·8 times) that of female cases. Among all age groups, the highest malaria percentage (17·5%) was observed in the age group 10–19 years, followed by the 30–39-year group (16·8%) and the 20–29 year group (14·0%). About two thirds (66·2%) of malaria cases occurred in farmers. In terms of the type of malaria, the majority (83·8%) of cases were P. vivax malaria, with a ratio of P. vivax to P. falciparum being 14·1:1. Moreover, almost all (99·2%) P. falciparum cases were reported in Baoshan and Dehong in Yunnan Province.
Summary statistics for malaria cases and weather variables in the nine selected cities in China, 2005–2012
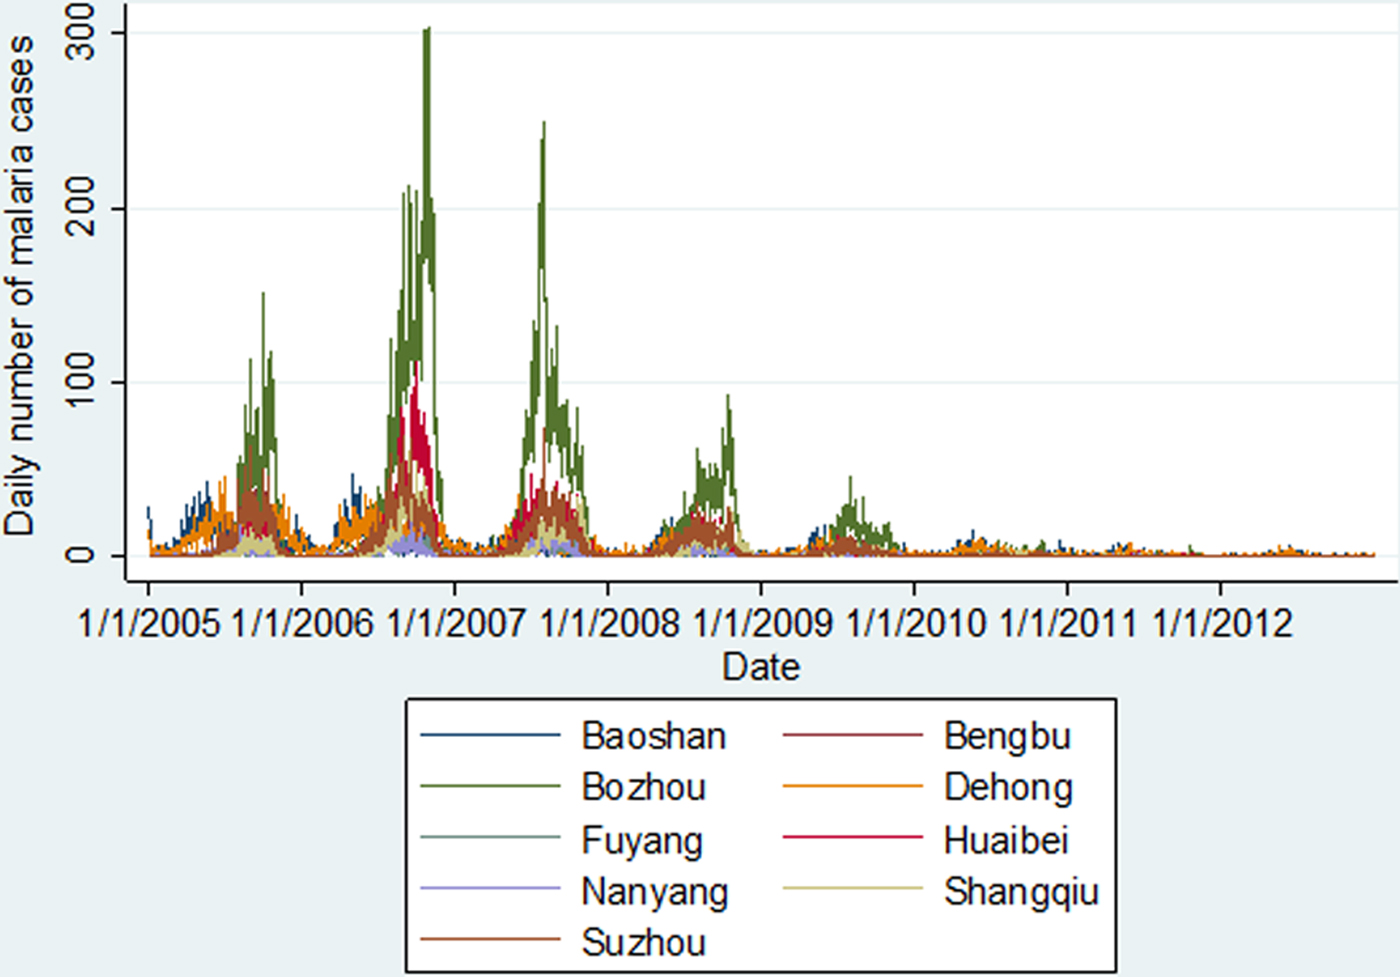
As shown in Figure 2, there was a downward trend for malaria cases during the study period, with a peak in 2006 especially for the seven cities in Central China (Anhui and Henan Provinces). Seasonal malaria fluctuation patterns for the cities in Central China differed from the patterns of the two cities in Yunnan Province. Malaria transmission occurred about 2 months earlier in Yunnan Province each year, where there is a warmer and more humid climate than in Central China (Table 1).
Daily number of malaria cases in the nine selected cities in China, 2005–2012.
As shown in Supplementary File 1, a typical inverted-U-shaped curve relationship was observed between T max, T min, average relative humidity and malaria especially for the seven cities selected from Central China. As to the rainfall–malaria association, a slight increase of rainfall from zero was associated with a sharp increase in malaria. However, a negative association was observed between heavy rainfall and malaria case notifications.
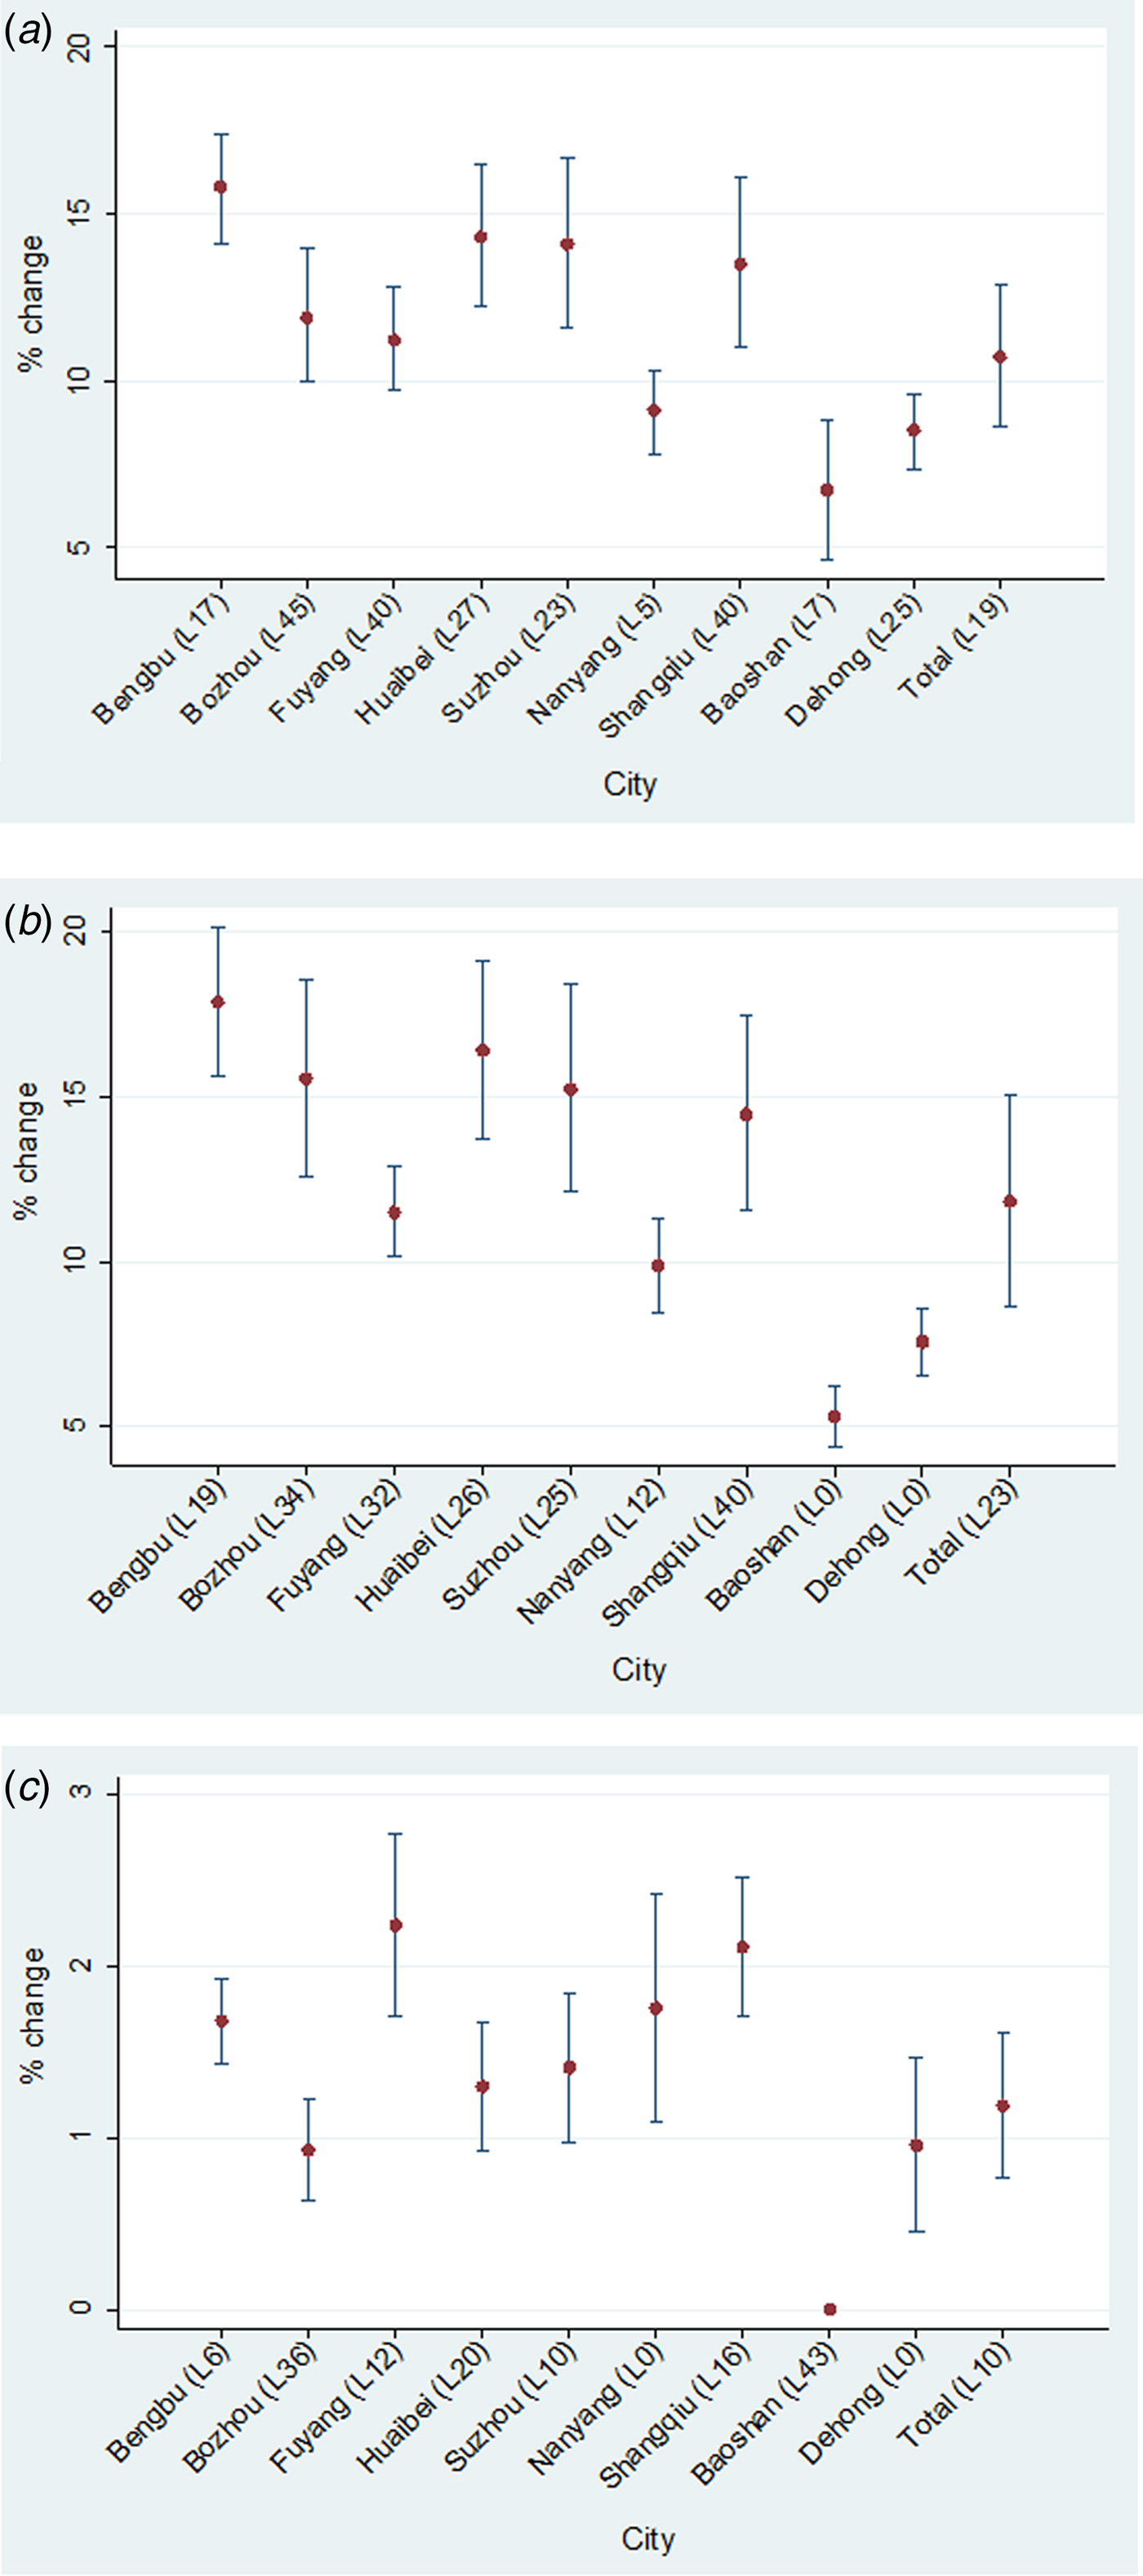
Figure 3 shows the maximum lagged effects of T max, T min and average relative humidity on malaria for the nine selected cities. All three climatic factors had significant impacts on malaria during the study period. Relatively speaking, malaria transmission in the two cities from Yunnan Province was less sensitive to these three climatic factors than that in the seven cities selected from Central China (Anhui and Henan). Specifically, for all cities a 1 °C increase of T max resulted in 6·7% (95% CI 4·6–8·8%) to 15·8% (95% CI 14·1–17·4%) increase in malaria, with corresponding lagged effects ranging from 7 to 45 days. The pooled maximum lagged effect of T max was observed at a lag of 19 days, and a 1 °C increase of T max was associated with a 10·7% (95% CI 8·6–12·9%) increase in malaria (Fig. 3a ). For T min, the effect estimates peaked at lag 0–40 days, ranging from 5·3% (95% CI 4·4–6·2%) to 17·9% (95% CI 15·6–20·1%). The pooled maximum lagged effect of T min occurred at a lag of 23 days, and a 1 °C increase in T min was associated with 11·8% (95% CI 8·6–15·0%) increase in malaria (Fig. 3b ). In terms of relative humidity, for the seven cities in Central China the maximum lagged effects ranged from 0·9% (95% CI 0·6–1·2%) at a lag of 36 days in Bozhou, to 2·2% (95% CI 1·7–2·8%) at a lag of 12 days in Fuyang. For the two cities in Yunnan Province, no significant association was found in Baoshan, and the maximum lag effect in Dehong was observed at lag 0. The pooled maximum effect of average relative humidity was 1·2% (95% CI 0·8–1·6%) identified at lag day 10 (Fig. 3c ). Supplementary File 2 shows the city-specific effects of temperatures and average relative humidity at different lags.
Maximum lag effects of daily maximum temperature (a), minimum temperature (b), and average relative humidity (c) in the nine selected cities and pooled effects in China, 2005–2012. ‘L’ = lag.
According to the results of cross-correlation analyses between climatic factors and malaria (Supplementary File 3), the duration of lag effects in the year malaria occurred were 54–146 days for T max, 38–140 days for T min, 11–108 days for average relative humidity, and 22–127 days for rainfall. The lagged effects of T max, T min, average relative humidity, and rainfall turned up periodically in the following 2–3 warm seasons and waned gradually. No significant lag effects were observed for relative humidity in Baoshan in Yunnan Province.
DISCUSSION
The emergence of malaria in the East African highlands in the 1970s has fuelled an extensive debate over the impact of climate change on malaria transmission [Reference Hay18, Reference Pascual19]. Studies suggested that highland malaria resurgence cannot be completely attributed to climate change, as it is also affected by a range of non-climatic factors [Reference Caminade20, Reference Gething21]. Nevertheless, the fifth assessment report of International Panel on climate change in 2014 has stated that there is a correlation between climate change and likely increasing malaria burden with medium confidence [22]. Moreover, the Global Technical Strategy for Malaria 2016–2030 by the World Health Organization stated that without an effective mitigation strategy, climate change would result in an increase of malaria in several regions of the world [6]. Some studies have assessed the contribution of climatic factors in malaria transmission, with a range from 30% to 80% [Reference Zhou23–Reference Thomson26]. Although malaria incidence is determined by multiple factors, climatic factors provide a framework within which transmission is possible, and other factors influence malaria transmission spatiotemporally. Therefore, a warming climate may result in a change of geographic range suitable for malaria transmission, increase vectorial capability via biological amplification, prolong transmission seasons, and increase the population at risk [Reference Caminade20]. This highlights the continual threat of malaria re-establishment and resurgence and the need for vigilance [6].
Malaria epidemics depend on the outcome of a tug-of-war between predisposing factors and health interventions. Although malaria globally is in recession [Reference Gething21], reduced inputs or implementation negligence may lead to malaria resurgence in some elimination zones, as was observed in Greece after the 2008 financial crisis [Reference Andriopoulos27, Reference Karanikolos28]. Currently, China is in a malaria elimination stage. The resurgence of malaria in Anhui and Henan Provinces in the early years of the 21st century [Reference Gao9] caused a rethink and concerns about the potential impact of climate change on malaria transmission. Thereafter, many empirical studies have investigated the climate–malaria associations in China which have been characterized as non-linear with lagged effects [Reference Gao9, Reference Zhao29–Reference Zhang, Bi and Hiller31]. A majority of these studies, however, only focused on one city/county on a weekly or monthly time series basis, using different statistical models, making the comparison of different results problematic. There are limited multi-location studies using daily time series data. In this study, we quantified the climate-malaria association for 9 selected cities, based on daily data, using a two stage method suitable for this multi-location study. The pooled effects, varied city-specific effects, and duration of lags identified may provide useful implications for malaria control in regions with similar climate and socioeconomic conditions such as the greater Mekong River region.
Our pooled results suggest that climatic factors are significantly associated with malaria transmission in China. Specifically, effect estimates for the 7 cities in Central China (Anhui and Henan Provinces) were greater than that of the two cities in Yunnan Province, indicating that as the current two major malaria high-risk regions Central China (Huai River basin) are more sensitive to climate than Yunnan Province. Relative higher effect estimates were also found in Central China when comparing similar studies from the two regions, although it might be not comparable due to the different statistical methods used [Reference Gao9, Reference Bi30]. The warm and humid climate in Yunnan Province may be more suitable for malaria and hence the role of varying climate in malaria transmission may be relatively less important in Yunnan, given similar intervention policies were deployed within the two regions. This finding is useful for guiding malaria control resources allocation and developing targeted prevention strategies against climate change related impact. In cool climate areas with high malaria transmission (e.g. Central China), mosquito vector monitoring sentinels should be strengthened to monitor the possible change of mosquito geographical range and density.
Temperature is known to be one of the determining factors for the life cycle of mosquitoes, parasite development, and human–mosquito interactions. Our pooled results from the malaria prevalent regions in China showed that a 1 °C increase of maximum and minimum temperature was associated with 10·7% and 11·8% increase of malaria, respectively. This is basically consistent with results of other time-series analyses from China [Reference Zhang, Bi and Hiller31]. Although the net number of increased cases due to climatic factors may be small given other conditions remain unchanged, the population at risk will be increased, thereby potentially increasing the disease burden to China's public health system. Moreover, we found malaria was more sensitive to minimum temperature in Central China while in Yunnan Province of Southwest China malaria was more sensitive to maximum temperature. The optimal temperature for malaria transmission is about 25 °C, with transmission occurring within a temperature range of 16–34 °C [Reference Mordecai32]. In relative cooler regions (e.g. Central China), temperature fluctuation around the lower limit temperature required for malaria transmission can exert a ‘rescue effect’ to speed up malaria parasite development [Reference Blanford33]; In warmer regions, minimum temperature is relatively less important as a restriction factor. Nevertheless, temperature fluctuation around the upper threshold can slow down parasite development rates and reduce mosquito longevity and the capacity of vectors to transmit malaria at extremely hot temperatures [Reference Blanford33]. This would explain why the effect of minimum temperature on malaria was found to be greater in the cool months than in the warm months [Reference Tian34].
In this study, pooled effect estimates for ambient temperatures (10·7% and 11·8% for maximum and minimum temperatures, respectively) were higher than that of relative humidity, suggesting malaria was more sensitive to ambient temperature than relative humidity (1·2%). Although temperature was most frequently found to have a significant relationship with malaria metrics according to a systematic literature review [Reference Reiner5], other climatic factors (e.g. relative humidity) were also found important for malaria transmission. In Motuo County of Tibet, relative humidity was identified as the most important climatic factor affecting malaria transmission due to the local dry weather [Reference Huang35]. Evidence has shown that malaria transmission is inhibited when average relative humidity is less than 60% [Reference Yang36], but a relative humidity over 60% may no longer be a restricting factor for malaria. Studies in Mengla County located in Xishuangbanna prefecture in the tropical rain forest areas of Yunnan Province, have shown that relative humidity is not significantly associated with malaria, as throughout the years relative humidity (69–93%) was favourable for malaria transmission [Reference Tian34]. This is consistent with our results for Baoshan in Yunnan Province where there was an average relative humidity of about 73% during the study period.
Rainfall is very important for malaria transmission by providing mosquito breeding sites. Unlike an inverted-U-shaped curve relationship between temperature, relative humidity, and malaria, the impact of rainfall on malaria is complex as it is affected by local topographical features. A minimal amount of rainfall is required for maintaining mosquito breeding sites, especially in warm semi-arid and desert fringe areas [Reference Mabaso and Ndlovu37]. Therefore, a sharp increase in malaria was observed in the nine selected cities when the amount of rainfall increased from zero to a certain threshold. Where additional rainfall does not generate more breeding sites, rainfall may not be a limiting factor for malaria transmission due to a ‘saturation effect’ [Reference Zhao29, Reference Tian34]. Heavy rainfall and storms, on the other hand, may flush out mosquito breeding sites and have a negative effect on malaria transmission. This may be why almost all studies in Africa found rainfall the primary climatic factor influencing malaria transmission [Reference Mabaso and Ndlovu37], while some studies in tropical regions (e.g. South Asia and Southeast Asia) found no or even negative rainfall–malaria associations [Reference Singh and Sharma38–Reference Ninphanomchai40]. In China, rainfall effects vary across regions. However, in Central China, positive rainfall–malaria associations have been found in previous studies, and the re-emergence of malaria in 2006 was reportedly attributed to abnormal rainfall [Reference Gao9–Reference Huang11].
Lagged effect is another important characteristic of the malaria–climate relationship. Identification of the duration of lagged effects and the lag time with maximum effects is important for malaria early warning and preparedness. Under optimum conditions, a lag of at least 38 days is required from precipitation and deposition of mosquito eggs to the transmission of malaria [Reference Krefis41]. According to the published literature worldwide, the duration of lag effect varies largely by location, ranging from 0 to 9 months for maximum temperature and 0–6 months for rainfall [Reference Reiner5]. Other malaria studies from China have shown the duration of climatic factors’ lag effect to be generally limited to about 0–2 months [Reference Gao9, Reference Bi30, Reference Zhang, Bi and Hiller31, Reference Huang35, Reference Zhang42, Reference Guo43]. In this study, in Central China within the transition region of the warm-temperate zone and subtropical zone, the duration of lag effect in the first year of malaria occurrence was 113–148 days (3·8–4·9 months) for maximum temperature, 104–140 days (3·5–4·7 months) for minimum temperature, 88–123 days (2·9–4·1 months) for rainfall, and 64–109 days (2·1–3·6 months) for relative humidity. By contrast, in the Southwest of China (e.g. Yunnan) with its tropical and subtropical climate, the duration of lag for maximum and minimum temperatures, rainfall, and relative humidity was 54–99 days (1·8–3·3 months), 38–80 days (1·3–2·7 months), 22–44 days (0·7–1·5 months), and 11–79 days (0·4–2·6 months), respectively. Therefore, the duration of lag effect in a cool climate zone is longer than that in a warm climate zone. The possible explanation is that malaria is relatively more sensitive to climatic factors in cool zones. In addition, we found that lagged effects did not vanish after an epidemic season but waned gradually in the following 2–3 warm seasons. From a biological perspective, climatic factors can affect the number of hibernating mosquito eggs in winter, which is associated with the mosquito abundance at the beginning of the next epidemic season. This finding is important for malaria early warning and forecasting.
China has had great success in malaria control due to continuous efforts in the past decades and aims to eliminate malaria by 2020. A ‘1-3-7’ strategy has been adopted in 2010 for malaria elimination: reporting malaria cases within 1 day, investigating and confirming cases within 3 days, and effective public health response to prevent further transmission within 7 days [Reference Cao44]. In addition to the increasing challenge of imported cases [Reference Zhou45], a warming climate may potentially increase the risk of malaria resurgence in China and deserves more attention.
This study has several limitations. First, imported malaria cases were not excluded from the analyses due to the lack of a variable in the dataset to indicate the status. To reduce the potential bias, we restricted the study period to 2005–2012, as imported cases (especially P. falciparum malaria) increased significantly after 2012 due to the increased commercial interactions and travel between China and some malaria-endemic countries. These mainly include sub-Saharan African countries (e.g. Ghana, Angola, and Nigeria), some Southeast Asian countries (e.g. Myanmar) and Oceanic countries (e.g. Equatorial Guinea) [Reference Feng4, Reference Zhou45, Reference Lai46]. According to Zhou's analysis, during 2010–2014 about 90% of imported falciparum malaria cases were acquired in Africa, while 77% of imported vivax malaria cases originated from Asia [Reference Zhou45]. Second, underreporting is an inherent limitation for historical surveillance data analysis, especially for data extracted from a passive surveillance system. The estimated malaria underreporting rate was about 90% in 2005 in China [Reference Zhang47]. Although underreporting may have decreased largely since the launch of a national infectious diseases online reporting system in 2004 and quality inspection every year by local health departments, there may still be an underestimation of malaria epidemics potentially affecting the precision of malaria-climate effect estimates. According to published literature, the compliance was high and the underreporting rate after 2004 remains at very low levels [Reference Shi48]. Third, we acknowledge that non-climatic factors (e.g. altitude, wetland coverage, population density, socioeconomic status, and mosquito density) play an important role in malaria transmission. Due to complexity and unavailability of relevant data, we did not include or control for, these data in the models. Fourth, malaria species were not distinguished when quantifying the malaria–climate associations, as overall the vast majority of cases were P. vivax malaria in this study. However, in some cities such as Fuyang and Huaibei a large proportion of unspecified malaria species may potentially bias the city-specific effect estimates. In addition, misclassification between the two malaria species and misdiagnosis may also affect the estimates.
In summary, climatic factors play an important role for malaria transmission in China, especially in Central China. Malaria is more sensitive to minimum temperature in cool climates and to maximum temperature in warm climates. Climate–malaria associations, the timing with maximum effects, and the duration of lagged effects varied by location. The selection of appropriate climatic factors for malaria early warning and forecasting should be site-specific, taking local climate characteristics into account.
SUPPLEMENTARY MATERIAL
The supplementary material for this article can be found at https://doi.org/10.1017/S0950268817002254.
ACKNOWLEDGEMENTS
The research has been funded by the Australian Government Department of Foreign Affairs and Trade through the Australian Development Research Awards Scheme under an award titled ‘How best to curb the public health impact of emerging and re-emerging infectious diseases due to climate change in China’ (Project ID: 66888). The views expressed in the publication are those of the author(s) and not necessarily those of the Department of Foreign Affairs and Trade or the Australian Government. The Commonwealth of Australia accepts no responsibility for any loss, damage or injury resulting from reliance on any of the information or views contained in this publication.


