1. Introduction
A strong seismic event occurred in the Argentine piedmont on 30 May 1929 (Costa et al. Reference Costa, Cisneros, Salvarredi and Gallucci2006). The epicentral area was the Villa Atuel and Las Malvinas towns, part of San Rafael suburbs, on the eastern border of the San Rafael basement block (Fig. 1). Strong shaking was widespread from as far away as 1000 km from the epicentral zone in Buenos Aires, leading to many casualties and causing much damages in the vicinity of the San Rafael city. No surface rupture was identified. Several potential fault sources were suspected within the epicentral region however, making it difficult to identify the fault segment responsible for the earthquake. At a larger scale, structural styles are well understood (Giambiagi et al. Reference Giambiagi, Bechis, García and Clark2008; Folguera et al. Reference Folguera, Naranjo, Orihashi, Sumino, Nagao, Polanco and Ramos2009; Branellec et al. Reference Branellec, Nivière, Callot and Ringenbach2016) but strain rates are poorly constrained by only a few GPS studies (Kendrick et al. Reference Kendrick, Bevis, Smalley, Cifuentes and Galban1999; Khazaradze, Reference Khazaradze2003).
(a) Geodynamic setting of the Neuquén Basin showing the several morpho-structural units between 32°S and 40°S. (b) Seismotectonic framework of the region hit by the 1929 earthquake. The plotted crustal seismicity (<60 km) has been taken from the USGS database and topography is derived from an ASTER GDEM (30 m). (c) Schematic cross-section running from the Malargue Fold–Thrust Belt to the San Rafael Block showing the global structural style characterized by the involvement of the pre-Jurassic basement (white: basement rocks; grey: Mesozoic and Cenozoic cover). Red stars refer to historical seismicity (unknown location of macroseismic epicentres).

Using satellite imagery and published geological information, we compiled the main active faults within the epicentral region of the Villa Atuel earthquake. After a critical revision of earlier maps, we focused on the eastern border of the San Rafael block, delimited by the two most prominent faults in this area: the Las Malvinas and Cerro Negro faults. Based on geomorphological analysis and cosmogenic dating, we found evidence of recent tectonic activity along these fault segments and also quantified their long-term seismic hazard (slip rates, moment magnitude, maximum displacement and recurrence time). Finally, we discuss the large-scale tectonic implications in relation to the current dynamics of the Andean back-arc.
2. Regional tectonics
The 1929 earthquake occurred along the eastern border of the San Rafael Block (SRB) which is located 100 km eastwards from the Malargüe Fold–Thrust Belt (MFTB, Fig. 1). The main structural grain is highlighted by the topography and main rivers and streams, such as the Rio Atuel and Rio Diamante rivers. These directions follow a N–S-trending axis in the MFTB, passing to a NW–SE-aligned direction in the SRB.
From Late Cretaceous – Miocene times, the subduction of the Nazca plate beneath the South American plate triggered three shortening pulses that gave rise to a fold–thrust belt stage in the Andean retro-arc (Manceda & Figueroa, Reference Manceda, Figueroa, Tankard, Suarez Soruco and Welsink1995). Prior to its inversion, the SRB was already a topographic high situated at the easternmost edge of the Triassic syn-rift basins. The cross-section presented in Figure 1 runs from internal parts of the MFTB as far as the SRB. It can be described as follows. The MFTB mainly results from the crustal inversion of the borders of the ancient rift basins and from local shallow thin-skinned deformation related to basement thrust propagation into the cover. This inversion occurred during 75–55 Ma and 15–8 Ma (Giambiagi et al. Reference Giambiagi, Bechis, García and Clark2008; Folguera et al. Reference Folguera, Bottesi, Duddy, Martín-González, Orts, Sagripanti, Rojas Vera and Ramos2015). Nevertheless, G. Messager (unpub. PhD thesis, Université de Pau et des pays de l'Adour, Reference Messager, Nivière, Martinod, Lacan and Xavier2010) showed that the mountain front submitted to shortening during Quaternary time. Further east, the Andean uplift was recorded in the Rio Grande palaeo-foreland basin which is filled with 2500 m of upper Mesozoic – Cenozoic sediments and was subsequently cannibalized when the SRB began to uplift (Fig. 1).
The SRB is mostly made up of several terranes accreted during Palaeozoic time along the southwestern margin of the Gondwana supercontinent known as the Rio de la Plata Craton (Ramos, Reference Ramos2010). The SRB consists of a middle–upper Proterozoic metamorphic basement covered by lower–middle Palaeozoic sediments, in turn unconformably overlain by Carboniferous continental and marine series. A widespread volcanic event then led to a thick accumulation of rift-related Permo-Triassic volcanic and sedimentary rocks (Puesto Viejo Formation) known as the Choiyoi Group. The Miocene and Pliocene (Aisol Formation) sediments that partially cover the SRB are directly deposited on top of the Choiyoi Group rocks, confirming the existence of a long sedimentary hiatus spanning Late Triassic – Miocene times (González Díaz, Reference González Díaz1972; Forasiepi et al. Reference Forasiepi, Martinelli, de la Fuente, Dieguez and Bond2011). The SRB is surrounded to the east by the Triassic Alvear (Fig. 1) and the d'Algarrobo del Aguila basins (Criado Roqué & Ibañez, Reference Criado Roqué and Ibañez1979; Kostadinoff & Llambías, Reference Kostadinoff and Llambías2002).
By Miocene time, large amounts of arc-related lavas had emplaced on the eastern flank of the principal cordillera as well as that of the SRB, which is located more than 500 km from the Chile trench (Kay et al. Reference Kay, Burns, Copeland, Mancilla, Kay and Ramos2006; Giambiagi et al. Reference Giambiagi, Bechis, García and Clark2008). The volcanism subsequently shifted towards the SRB and the Rio Grande Basin during Pliocene–Pleistocene time (Bermúdez et al. Reference Bermúdez, Delpino, Frey and Saal1993; Folguera et al. Reference Folguera, Naranjo, Orihashi, Sumino, Nagao, Polanco and Ramos2009), whereas only small volcanic bodies are found in the eastern part of the MFTB (Cortés & Sruoga, Reference Cortés and Sruoga1998).
If it is now widely accepted that shortening governed the region from middle Cretaceous – early Miocene time, the current tectonic regime is still a matter of debate. Some authors suggest that the region is currently experiencing gravitational collapse in response to the increase in the slab-dip angle (Ramos & Folguera, Reference Ramos, Folguera, Veiga, Spalletti, Howell and Schwarz2005; Folguera, Zapata & Ramos, Reference Folguera, Zapata and Ramos2006; Lara & Folguera, Reference Lara, Folguera, Kay and Ramos2006; Ramos & Kay, Reference Ramos, Kay, Kay and Ramos2006; Folguera et al. Reference Folguera, Introcaso, Giménez, Ruiz, Martinez, Tunstall, García Morabito and Ramos2007, Reference Folguera, Bottesi, Zapata and Ramos2008). Nonetheless, the onset of this extension and its associated magnitude and related mechanisms are not yet well constrained and so remain disputed. Some other authors propose that the region is still currently subjected to shortening (Cobbold & Rossello, Reference Cobbold and Rossello2003; Galland et al. Reference Galland, Hallot, Cobbold, Ruffet and de Bremond d'Ars2007; Guzmán, Cristallini & Bottesi, Reference Guzmán, Cristallini and Bottesi2007; Huyghe et al. Reference Huyghe, Bonnel, Nivière, Fasentieux and Hervouët2015; Huyghe, Nivière & Bonnel, Reference Huyghe, Nivière and Bonnel2015; Marques & Cobbold, Reference Marques and Cobbold2002; Messager et al. Reference Messager, Nivière, Martinod, Lacan and Xavier2010, Reference Messager, Nivière, Lacan, Hervouët and Xavier2014).
3. Local active faults
A number of faults cutting through the SRB show morphologic signatures, easily identifiable from remote sensing analysis and fieldwork. Morphologies are characteristic of segmented thrust faults ranging between 10 km and 30 km long. In the northern part of the SRB, these faults mainly trend along a NNW axis cutting through the N–S-trending Palaeozoic structural grain, while southward they lie parallel to the N–S direction. Several structural indications suggest a compressive tectonic activity on some fault segments (Bastias et al. Reference Bastias, Tello, Perucca, Paredes and Ramos1993; Lucero, Reference Lucero2002; Costa et al. Reference Costa, Cisneros, Salvarredi and Gallucci2004, Reference Costa, Cisneros, Salvarredi and Gallucci2006). In particular, the Las Malvinas Fault has been considered as a possible source of the destructive Villa Atuel earthquake of 1929 although no surface break has been identified (Costa et al. Reference Costa, Cisneros, Salvarredi and Gallucci2006).
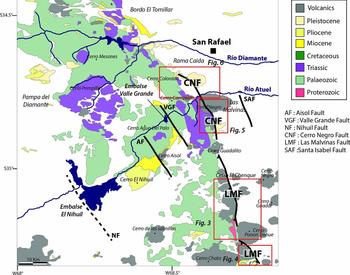
Among the four potentially active faults lying in the study area (Aisol, Valle Grande, Las Malvinas and Cerro Negro faults, Fig. 2), only the Las Malvinas and Cerro Negro faults show clear morphologic expression (Figs 1, 2) and are situated in the neighbourhood of the epicentral area. These faults lie along and delimit the eastern border of the San Rafael block (Cisneros, Ormeño & Bastias, Reference Cisneros, Ormeño and Bastias1989; Bastias et al. Reference Bastias, Tello, Perucca, Paredes and Ramos1993; Cisneros & Bastías, Reference Cisneros and Bastías1993).The 40–45 km long Las Malvinas Fault can be divided into two segments trending approximately NNW–SSE and NW–SE, underlined by a monocline. The fault has not been observed at the surface and Costa et al. (Reference Costa, Cisneros, Salvarredi and Gallucci2006) proposed that it is rooted on a 16 km deep décollement level. It is worth noting that Lupari et al. (Reference Lupari, Spagnotto, Nacif, Yacante, García, Lince-Klinger, Sánchez and Triep2015) mentioned that the tectonic activity on this fault could account for the shallow crustal seismicity recently monitored in the region.
Geological map of the San Rafael Block, modified from Sepúlveda et al. (Reference Sepúlveda, Carpio, Regairaz, Zárate and Zanettini2000).

The Cerro Negro Fault is situated immediately north of the Las Malvinas Fault (Fig. 2). This fault segment is 25–30 km long and trends NNW–SSE (González Díaz, Reference González Díaz1972). Along its northern termination the Cerro Negro Fault is highlighted by a 30 m high scarp in front of the San Rafael city. Southwards, the Cerro Negro Fault is underlined by a volcanic alignment (Fig. 2). Located 15 km east of the SRB, the west-facing 120 m high Santa Isabel scarp has been interpreted as the reactivated border of an extensional graben (Baker et al. Reference Baker, Gosse, McDonald, Evenson and Martínez2009). Based on U–Pb dating performed on a pedogenetic carbonate which is cut by the fault, Baker et al. (Reference Baker, Gosse, McDonald, Evenson and Martínez2009) provided a minimum age of about 250 ka for the last tectonic event registered on the Santa Isabel Fault.
Since they are located away from the epicentral area (Fig. 2), the Valle Grande and Aisol faults are unlikely to be responsible for the event of 1929. The Valle Grande Fault trends NW–SE and exhibits a clear morphologic signature in the Valle Grande area (Fig. 2). The Permian Tobas del Tesoro Misterioso Formation is cut by the fault and shows a 50 m long vertical offset (Costa et al. Reference Costa, Cisneros, Salvarredi and Gallucci2006). The Miocene Aisol Formation is found west of the Valle Grande Fault, whereas it is absent eastwards. Above the fault trace, volcanic lavas are brecciated and fractured and striated planes are visible trending N320/72°E and N321/58°E, associated with slickenlines dipping at 27° towards the NW (Costa et al. Reference Costa, Cisneros, Salvarredi and Gallucci2006). Kusiak (Reference Kusiak1993) has also documented the existence of several landslides and liquefaction figures that could be associated with the tectonic activity of an inverse fault lying N340/67°E. According to several authors this fault could account for major seismic events of magnitude higher than M W = 5.7. Nevertheless, some authors such as Folguera et al. (Reference Folguera, Naranjo, Orihashi, Sumino, Nagao, Polanco and Ramos2009) interpreted this scarp as related to a normal fault.
The Aisol Fault, initially described by Lucero & Paredes (Reference Lucero and Paredes1999) and Lucero (Reference Lucero2002), lies in the northwestern part of the San Rafael Block (Fig. 2). It is expressed as a NW–SE-trending 15–20 km long discontinuous lineament (Fig. 2). In the northwestern part of the SRB the fault scarp reaches a maximum value of c. 100 m (Lucero, Reference Lucero2002). Recent evidence of tectonic activity along the Aisol Fault have been reported by several authors in the Cerro Aisol area (Lucero, Reference Lucero2002). These authors highlighted that Quaternary basaltic rocks are affected by right-lateral slip showing a lateral extent of at least 200 m with a 60 m high vertical offset. Based on recent satellite imagery, Costa et al. (Reference Costa, Cisneros, Salvarredi and Gallucci2006) questioned the observation of Lucero (Reference Lucero2002) and suggested that the deformation associated with the Aisol Fault could be related to gravitational collapse (e.g. the 34°56.4235′S; 68°36.79′W site).
4. Information relative to the earthquake of May 1929
Within the epicentral area, the damage caused by the earthquake was reported some time after the main event by Lünkenheimer (Reference Lünkenheimer1929). The earthquake was felt as far away as San Juan to the north, Buenos Aires to the east and Neuquén/Rio Negro to the south, injured 40 and caused the destruction of 32 houses in the Colonia Las Malvinas and Villa Atuel areas. The Pacifico railways were damaged and highly deformed in several places where screws were broken and railroad shoulders collapsed by up to 75 cm (Perucca & Moreiras, Reference Perucca and Moreiras2006). In the Villa Atuel town, Lünkenheimer (Reference Lünkenheimer1929) also described a number of warm-water seepages (18°C) flowing towards the surface through the development of several metre-long and 4 cm wide fissures. Moreover, the water flow from many sources was observed to have significantly increased before the 30 May 1929 event (Lünkenheimer, Reference Lünkenheimer1929). The intensity of the Villa Atuel earthquake was estimated to reach VIII on the Mercali scale (Costa et al. Reference Costa, Cisneros, Salvarredi and Gallucci2006), but there is no accurate quantification of its magnitude. The magnitude value of M W = 6.5 provided by Costa et al. (Reference Costa, Cisneros, Salvarredi and Gallucci2006) matches the M W = 6.6 value given by the USGS (NEIC-PDE), and the associated focal depth is c. 10 km (USGS). It has to be noticed that the maximum intensity was only of VIII while the earthquake was felt over a large area through Argentina, which suggest a strong-magnitude event. These two discrepant facts also indicate that the focal depth was probably higher than 10 km. In the same region, a new destructive earthquake reached an intensity of VI on the Mercali scale on 5 July 1942.
5. Geology and morphology of the Las Malvinas and Cerro Negro faults
In this section we focus on both the Las Malvinas and the Cerro Negro faults and provide new evidence about their recent tectonic activity. Both of these faults separate the Proterozoic and Triassic terranes of the SRB to the west from the Quaternary Alvear Basin to the east (Fig. 2). The Alvear Basin is parallel to the eastern border of the SRB and is related to the south to a set of extensional Triassic basins partly shortened during the Andean Orogeny (Ramos & Kay, Reference Ramos, Kay, Harmon and Rapela1991) and overlaid by syn-orogenic continental rocks deposited from Miocene time onwards. These fluvial deposits grouped into the Aisol Formation (González Díaz, Reference González Díaz1972) have been accurately dated according to their vertebrate fossil content (Forasiepi et al. Reference Forasiepi, Martinelli, de la Fuente, Dieguez and Bond2011). At the large scale, these syn-orogenic deposits form a long and gently west-dipping monocline (Fig. 1).
5.a. Las Malvinas Fault segments
The Las Malvinas Fault can be divided into two major segments (Fig. 2) that trend NNW–SSE for the 30 km long northern segment and NW–SE for the 12 km long southern segment. This fault corresponds to a 100–150 m high ridge if excluding Quaternary lavas that have emplaced recently. The Las Malvinas Fault also delimits an immature regressive erosion front, suggesting a recent reactivation of the escarpment. In several places the upper Pliocene – lower Pleistocene lavas are folded above the main scarp, also suggesting a recent tectonic activity on this fault (Fig. 3). In the Cerro Ponon Trehue area (Fig. 3) the upper Pliocene – lower Pleistocene lava flow (Coyocho Formation of the Chapua Group) directly lies on the Carboniferous El Imperial Formation that exhibits dip angles ranging of 44–71° above the main fault scarp. Costa et al. (Reference Costa, Cisneros, Salvarredi and Gallucci2006) have documented the existence of striated fault planes along bedding surfaces which they interpreted as being related to flexural slip processes developed during folding of the lavas.
Upper: 3D view of the northern part of the Las Malvinas fault. Located on Figure 2. Lower: topographic profile along the eastern border of the SRB showing a 100–150 m high topographic ridge above the cartographic trace of the fault.

In the Quebrada de la Estrechura valley (immediately south of the Cerro Ponon Trehue), the progressive increase of the dip angle of the lava flow (28–45°) also suggests the presence of a fold hinge above the main morphological trace of the fault. Such a lava flow deformation pattern could also result from the covering of a pre-existing escarpment, suggesting that the fault was not necessarily recently reactivated. This interpretation is not supported by the fold-related flexural slip evidence or the extrados fractures observed in the field (Costa et al. Reference Costa, Cisneros, Salvarredi and Gallucci2006), which are consistent with folding and shortening along the eastern border of the SRB. Moreover, east of the Cerro Negro in the Rio Seco de los Chanchos valley, Costa et al. (Reference Costa, Cisneros, Salvarredi and Gallucci2006) indicate a 2–3 m high vertical offset in the Pleistocene Maipo Formation. Several earthquakes, including the event of 30 May 1929, have been attributed to the Las Malvinas Fault (Cisneros, Ormeño & Bastias, Reference Cisneros, Ormeño and Bastias1989; Bastias et al. Reference Bastias, Tello, Perucca, Paredes and Ramos1993; Cisneros & Bastías, Reference Cisneros and Bastías1993). The Quaternary coseismic slip has been interpreted to be normal and left-lateral according to Cisneros & Bastias (Reference Bastias, Tello, Perucca, Paredes and Ramos1993), whereas Costa et al. (Reference Costa, Cisneros, Salvarredi and Gallucci2004) considered it as reverse by showing active shortening along the eastern SRB border. South of the Ponon Trehue Volcano on the southern segment of the Las Malvinas Fault, the Rio Secos los Toldos has incised the frontal escarpment making it a natural trench (Fig. 4). The river erosion exposes the Upper Cretaceous conglomerates of the Punta del Agua Formation (Fig. 4) in the upstream direction, overlaid by the lower Pliocene alluvium. On both sides of the valley, the Cretaceous units are covered by the Grupo Chapua basalts of late Pliocene – early Pleistocene age (Fig. 4). To the west, these rocks lie horizontally on top of the Cretaceous units, whereas in the vicinity of the main fault segment volcanic rocks are dipping at 60° towards the east. Flowing through the substratum, the Rio Seco Los Toldos dug a valley across the ridge. Intercalated between the Plio-Pleistocene lavas and the valley floor, the remnant of an alluvial terrace disappears downstream with respect to the morphological trace of the fault. This level can be interpreted as a remnant of the former watercourse, which has been subsequently uplifted by c. 15 m by the fault. Deeply incised by the river below the Pleistocene lavas, this alluvium level corresponds to the most recent geomorphological marker of deformation. We sampled it to perform cosmogenic nuclide dating. A few kilometres south, the Grupo Chapua lavas exhibit the same type of morpho-structural configuration above the fault trace (northernmost part of Fig. 3).
3D view of the southern segment of the Las Malvinas fault. Located on Figure 2. Right: field pictures exhibiting the folding of Chapua Group volcanic (Pleistocene) rocks above the fault trace. Lower: topographic profiles highlighting the uplift of the alluvial terrace as well as the Chapua Group volcanic rocks. Left: field picture showing the location of the terrace-related sampled pebbles for cosmogenic dating.

5.b. Cerro Negro Fault segments
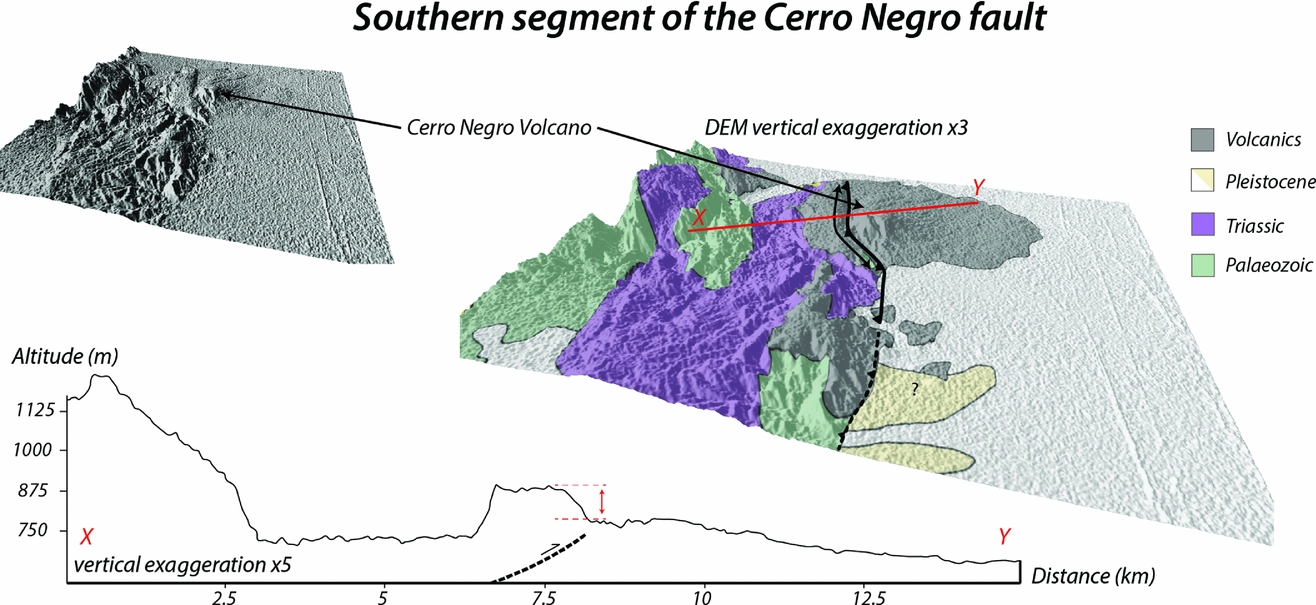
North of the Las Malvinas Fault between the Rio Atuel and the Rio Diamante, González Díaz (Reference González Díaz1972) identified the Cerro Negro Fault based on the identification of both a chain of aligned volcanoes to the south and an east-facing escarpment, trending NNW–SSE to the north, near the San Rafael city (Fig. 2). To our knowledge the only available evidence of recent deformation is provided by the work of Folguera et al. (Reference Folguera, Naranjo, Orihashi, Sumino, Nagao, Polanco and Ramos2009) at the foot of the Cerro Negro on the southernmost segment of the Cerro Negro Fault. The Palaeozoic El Imperial and Triassic Choiyoi formations are covered by the Cerro Negro lavas (Chapua Formation) dated at 0.801±0.049 Ma by Folguera et al. (Reference Folguera, Naranjo, Orihashi, Sumino, Nagao, Polanco and Ramos2009). The lava flows draw up an anticline located above the fault trace that some authors interpret as an evidence of reverse faulting which occurred by post-middle Pliocene time (Fig. 5). The E–W-trending topographic profile presented in Figure 5 immediately north of the Cerro Negro Volcano exhibits a 100–125 m high topographic ridge which is compatible with the location of the reverse fault documented by Folguera et al. (Reference Folguera, Naranjo, Orihashi, Sumino, Nagao, Polanco and Ramos2009). The fault segment displays a continuous trace northwards in the southwestern San Rafael suburbs, a region free of the inherent problem to consider lava flows as deformation markers (lava flowing above a pre-existing escarpment v. lava flows subsequently deformed). Towards the northwestern part of the Cerro Negro Fault, a young tectonic marker is observed south of the Rama Caida area (Figs 2, 6). The fault scarp is marked by a 20 m high topographic ridge we can follow for up to 7 km towards the NW. On the top on the ridge lie the lower Pliocene alluviums of the Rio Seco del Zapallo Formation overlain by the La Invernada Formation alluvial fan of middle Pleistocene age (San Rafael geological map; González Díaz, Reference González Díaz1972).
3D view of the southern segment of the Cerro Negro Fault. Below, topographic profile showing the topographic ridge situated at the foot of the Cerro Negro Volcano and related to the Cerro Negro Fault initially described by Folguera et al. (Reference Folguera, Naranjo, Orihashi, Sumino, Nagao, Polanco and Ramos2009). This zone characterizes the transition between the Las Malvinas and the Cerro Negro faults.
3D geological view of the northern segment of the Cerro Negro Fault. The Plio-Pleistocene topographic ridge is associated with the growth of an anticline that triggers reorganization of the drainage network we can observe to the left part of the figure. Lower: topographic profile and field picture showing the anticline hinge in the Plio-pleistocene alluviums. The AR-2013-4 has been sampled on the top of the topographic ridge for cosmogenic dating.

The western part of the ridge (Fig. 6) comprises Holocene alluviums that are widely represented in the study area; they also cover the north and east part of the topographic ridge (Figs 2, 6). The ridge formed a topographical barrier for the several watercourses draining the San Rafael Block. Indeed, based on remote sensing analysis and fieldwork, we note that all the rivers abut on the topographic ridge and are deviated southwards where they meet one of the Rio Atuel tributaries. The presence east of the ridge of former alluvial fans of the La Invernada Formation (Sepúlveda et al. Reference Sepúlveda, Carpio, Regairaz, Zárate and Zanettini2000) that was fed from the west shows that the present drainage configuration is recent. Indeed, the rivers previously flowed eastwards without any obstacle because the topographic ridge did not yet exist. In the field, we found a channel within the Rio Seco del Zapallo Formation on top of the ridge showing an anticlinal shape (Fig. 6). These observations support the fact that the topographic ridge is related to the formation of an anticline, which developed after the deposition of the clastics of the La Invernada Formation that lies above the Rio Seco del Zapallo Formation. The progressive uplift of the ridge induced a deviation and reorganization of the drainage network in the southeastern direction (Fig. 6). The anticline was therefore formed after middle Pleistocene times. We sampled several pebbles at the surface of the topographic ridge to perform cosmogenic nuclide dating. All these forms of geomorphological evidence are proof of a recent activation of the northern segment of the Cerro Negro Fault, which is compatible with the interpretation provided by Folguera et al. (Reference Folguera, Naranjo, Orihashi, Sumino, Nagao, Polanco and Ramos2009). Our observations also suggest that the cartographic trace of the active fault segment has to be shifted some kilometres westwards compared to the topographic front.
6. Cosmogenic nuclide dating
Cosmogenic nuclides produced in situ (also called terrestrial cosmogenic nuclides or TCN) are commonly used to date surface exposure of rocks, sediments and, among them, alluvial terraces. We sampled both the fluvial terrace of Rio Seco Los Toldos (AR-2013-5) and the Rio Seco del Zapallo Formation (AR-2013-4) for 10Be and 26Al analysis of quartz. On both sites, five pebbles of diameter 10–15 cmwere sampled at the surface; the shielding is negligible. Due to an error during the process, all the samples from the same site were crushed and mixed together. Pebble lithology is quartzite for AR-2013-4 and rhyolite for AR-2013-5. The samples have been prepared and measured at CEREGE (Aix-Marseille University; AMS ASTER facilities). Their concentrations were normalized to in-house standards (Tables 1 and 2).
AMS ASTER 10Be concentration measurements.
AMS Standard: in house BeO STD-11, 10Be/9Be=(1.191±0.0109)×10–11.
Exposure age evaluations depending on erosion rates. Calculations have been processed with Cronus web calculator with four different values for local erosion rates: 0; 10−6; 5×10⁻⁶ and 10−5m a–1. The average sample thickness is 12.5 cm. Since the various models proposed by Cronus yield different evaluations, we propose an ‘average’ value (last two columns).
10Be concentrations are similar for the two sites; they therefore indicate probable similar exposure ages. Table 2 provides the exposure ages considering several denudation rates: 0, 1, 5 and 10 m Ma–1. As given by the various production models for zero erosion, the exposures ages are c. 61±6 ka (AR-2013-4) and 57±6 ka (AR-2013-5). It must be noted here that exposure ages are not linearly dependent on erosion rates. On alluvial formations sampled with care on horizontal surfaces, in arid environments and particularly in the study area, the erosion is usually low and most of the evaluations range over 0–1 m Ma–1, possibly extending up to 10 m Ma–1 (Baker et al. Reference Baker, Gosse, McDonald, Evenson and Martínez2009; Portenga & Bierman, Reference Portenga and Bierman2011; Pepin et al. Reference Pepin, Carretier, Hérail, Regard, Charrier, Farías, García and Giambiagi2013; Siame et al. Reference Siame, Sébrier, Bellier, Bourlès, Costa, Ahumada, Gardini and Cisneros2015). In comparable climatic conditions, Siame et al. (Reference Siame, Sébrier, Bellier, Bourlès, Costa, Ahumada, Gardini and Cisneros2015) reported erosion rates lower than 5 m Ma–1. We consider that it is likely to be the maximum value in the study area. In that case the exposure ages of the AR-2013-4 and AR-2013-5 samples become, respectively, 78±10 ka and 72±10 ka. It is noticeable that Baker et al. (Reference Baker, Gosse, McDonald, Evenson and Martínez2009) found a similar age (66–69±15 ka) for an alluvial terrace along the Rio Diamante c. 100 km upstream, which they attribute to a major episode of aggradation. Consequently, exposure ages indicate a common age for AR-2013-4 and AR-2015-5 of c. 60 ka with no erosion and c. 80 ka with a 5 m Ma–1 denudation rate.
7. Discussion
7.a. Quantification of fault slip rates
We do not focus on the Valle Grande and Aisol faults for the following reasons: on one hand they are located out of the maximum intensity zone (VIII), and on the other hand the evidence of possible Quaternary activity along these segments is not as clear as along the eastern border of the SRB. The Cerro Negro and Las Malvinas faults show clear evidence of recent activity within the epicentral zone of the Villa Atuel earthquake. These faults are 25–45 km long and so are compatible with the macroseismic intensity of the earthquake. The sinuous cartographic traces of the faults as well as the folding associated with fault traces do not indicate normal faulting processes. That is why the interpretation of Costa et al. (Reference Costa, Cisneros, Salvarredi and Gallucci2006) in which the escarpments and related features are indicative of reverse faulting appears to be more suitable here. As neither surface rupture nor fault emergence was recognized after the main shock (Costa et al. Reference Costa, Cisneros, Salvarredi and Gallucci2006) the earthquake is likely to have occurred on a blind fault, which is a common feature of compressive domains (Stein & Yeats, Reference Stein and Yeats1989).
The observed fold wavelength of the alluvial terrace above the Las Malvinas southern fault segment (Fig. 7) is lower than 3 km and does not scale the eastern border of the SRB where the fault segments are of crustal scale. Indeed, each fault segment is at least 10 km long. Costa et al. (Reference Costa, Cisneros, Salvarredi and Gallucci2006) postulated that the Las Malvinas Fault is rooted at 16 km at depth. If we consider the observed fold wavelength, this structure is likely to be produced above a shallower décollement level probably not deeper than 4 km. Our observations and those discussed previously (see Section 3) are fundamental because they show that the reported fault activity is not directly linked to the crustal deformation front of the SRB that accommodates the Andean shortening. The active deformation is shifted forwards with respect to the crustal deformation front, which is a classical scheme we can find in growing mountain belts. Consequently, this deformation may be interpreted as a secondary and shallow effect of the deep-seated blind thrusting responsible for the Villa Atuel earthquake.
Topographic profile showing the excess area resulting from the terrace uplift related to the activation of the Las Malvinas southern fault segment. Simple model showing the relationships between the shortening, the uplifted surface and the depth to the décollement level.

Since we are dealing with a progressive and immature deformation, fault propagation fold models are often preferred in such setting (Simoes et al. Reference Simoes, Avouac, Beyssac, Goffé, Farley and Chen2007). Based on the fault propagation fold model Erslev (Reference Erslev1991) proposed use of the trishear fold model, according to which the fault is propagating through a triangular zone of distributed shear. A wide field of velocity and shape of the triangular zone can be generated by changing the P/S (propagation of the fault/slip on the fault) ratio that determines the velocity by which the fault tip propagates with respect to the total slip accommodated on the fault (Allmendinger, Reference Allmendinger1998; Allmendinger & Shaw, Reference Allmendinger and Shaw2000; Zehnder & Allmendinger, Reference Zehnder and Allmendinger2000). Unfortunately our geomorphological field observations above the Las Malvinas and Cerro Negro faults do not provide the geological constraints we needed to perform a structural modelling of those structures. An alternative approach could be one based on the folding model of Bernard et al. (Reference Bernard, Avouac, Dominguez and Simoes2007). During folding these authors observed that internal strain is accommodated through distributed pure shear until a ramp is formed where further deformation is able to localize. Based on the field velocity, Bernard et al. (Reference Bernard, Avouac, Dominguez and Simoes2007) provide a simple analytical expression of incremental vertical and horizontal velocity fields. Implementation of this model however requires geological markers at depth, or at least the depth of the décollement level controlling the development of the structure, which we do not have since we lack seismic or borehole data. This implies that it will be difficult to quantify the shortening accommodated by these structures.
However, Folguera et al. (Reference Folguera, Naranjo, Orihashi, Sumino, Nagao, Polanco and Ramos2009) dated the lava flow at the foot of the Cerro Negro, and we dated a deformed terrace and alluvial fan above the fault traces; we therefore have three deformation markers of different ages. On the basis of these ages (t) and on the amplitude (A) of folding in the terrace remnant and in the alluvial fan, we can easily quantify the uplift rate (U) above these structures: U = A/t. If we assume no internal strain in the sedimentary cover, the slip rate (S) above the underlying fault can be estimated by S = U/sin d where d is the fault dip angle. Considering our assumptions, we should consider here the order of magnitude rather than the absolute value of our results.
Tables 3 and 4 lists the results of our calculations above the southern segment of the Las Malvinas Fault (using the terrace remnant) and above the northern segment of the Cerro Negro Fault (using the alluvial fan), corresponding to denudation rates of 0 and 5 m Ma–1, respectively. The uncertainty on the amplitude of folding is due to the erosion in the western part of the ridge that withdrew the western limb of the fold. The calculated slip rates range from 2.23 ± 0.6 to 1.77 ± 0.54 mm a−1 for the southern Las Malvinas Fault segment, and from 2.50 ± 0.78 to 1.96 ± 0.68 mm a−1 for the northern Cerro Negro Fault segment. These values are consistent with those proposed by Costa et al. (Reference Costa, Ahumada, Vázquez and Kröhling2015) north of the study area, in the Precordillera region.
Calculation of the uplift and slip rates associated with the La Malvinas and Cerro Negro faults, based on cosmogenic analysis. The denudation rate is 0 m Ma–1.
Calculation of the uplift and slip rates associated with the La Malvinas and Cerro Negro faults, based on cosmogenic analysis. The denudation rate is 5 m Ma–1.
Given the fact that the fold shape is better constrained on the southern segment of the Las Malvinas Fault, the obtained results are supported by the application to that fold of the excess area method (Chamberlin, Reference Chamberlin1910; Epard & Groshong, Reference Epard and Groshong1993; Moretti & Callot, Reference Moretti and Callot2012). The conservation of mass implies that the area A below a deformed level at an initial altitude D above the décollement equals the product D×S, where S is the average total shortening of the layers below the considered horizon (Fig. 7). In practice, the shaded area in Figure 7 should equate the rectangle to the left. Since we analysed shallow deformation and assumed a décollement level rooted at 4 km, we obtained an average total shortening of c. 40 m and an associated shortening rate of c. 0.6 mm a–1 for the last 65 ka on this structure. The deeper the décollement level, the lower the shortening rates (e.g. 0.47 mm a–1 for a décollement at 5 km).
7.b. Estimation of the seismogenic potential
This part of the paper aims to evaluate the seismogenic potential of the Las Malvinas and Cerro Negro faults based on their morphologic expression. Considering the surficial total length of the fault segments, we evaluate the moment magnitude that they are likely to produce following the relationship of Wells & Coppersmith (Reference Wells and Coppersmith1994) whereby the moment magnitude M depends on the fault length at depth (RLD in km) as follows:
 $$\begin{equation}
M = a + b\log {\rm{RLD}}{\rm{.}}
\end{equation}$$
$$\begin{equation}
M = a + b\log {\rm{RLD}}{\rm{.}}
\end{equation}$$
The coefficients a and b depend on the kinematic of the faults (we consider here reverse faulting) with a = 4.49 ± 0.11 and b = 1.49 ± 0.09 (Wells & Coppersmith, Reference Wells and Coppersmith1994). As the faults are blind, we cannot directly estimate the total rupture length at depth. We therefore evaluate this rupture length on the basis of the morphologic signature of the fault segments following Wells & Coppersmith (Reference Wells and Coppersmith1994): the rupture length to the surface generally represents 75% of the total rupture length at depth. This is based on the assumption that the fault is able to break along the entire segment, and this value corresponds to the maximum possible magnitude.
The maximum displacement (MD in m) on a fault plane during the earthquake is linked to the moment magnitude M by the relationship (Wells & Coppersmith, Reference Wells and Coppersmith1994):
 $$\begin{equation}
\log {\rm{MD}} = a + bM
\end{equation}$$
$$\begin{equation}
\log {\rm{MD}} = a + bM
\end{equation}$$
where a = –1.84±1.14 and b = 0.29±0.17 for reverse faulting. Considering the slip rate (s) calculated in the previous section and considering a characteristic behaviour of the fault, we can at least approximate the maximum possible recurrence time of the earthquake dividing the maximum displacement (MD) by s.
Table 5 lists the results obtained for each fault segment assuming that the rupture concerned both segments of each fault. The estimation of the magnitude is consistent with the macroseismic observations realized after the main shock of 1929 by Stappenbeck (see Costa et al. Reference Costa, Cisneros, Salvarredi and Gallucci2006). These data are compatible with the observations and conclusion of Costa et al. (Reference Costa, Cisneros, Salvarredi and Gallucci2006), in which they proposed that the Las Malvinas Fault is responsible for the Villa Atuel earthquake of 1929. On the basis of our data, we discard the Cerro Negro Fault as a possible source of the main event since it is located further from the epicentral area. In addition, it also represents a limited seismogenic potential in the case of major earthquake occurrence.
Seismic parameters for the various fault segments. MFL: morphologic fault length; RLD: rupture length at depth; M: moment magnitude of the maximum possible earthquake.

7.c. Geodynamic implications
Our observations have also provided new insights into the current geodynamics of this region. According to Ramos & Folguera (Reference Ramos, Folguera, Veiga, Spalletti, Howell and Schwarz2005), Lara & Folguera (Reference Lara, Folguera, Kay and Ramos2006), Ramos & Kay (Reference Ramos, Kay, Kay and Ramos2006) and Folguera et al. (Reference Folguera, Bottesi, Zapata and Ramos2008), the study area is currently submitted to a generalized extension. An episode of back-arc magmatism established in the vicinity of the Payun Volcano at 4 Ma (Kay, Reference Kay2002; Kay et al. Reference Kay, Burns, Copeland, Mancilla, Kay and Ramos2006) is assumed to be related to the development of extensive basins in the Principal Cordillera (Folguera et al. Reference Folguera, Naranjo, Orihashi, Sumino, Nagao, Polanco and Ramos2009). This volcanism is thought to be associated with the retreat of the volcanic arc by up to 300–500 km towards the trench in response to a slab-steepening stage (Kay, Reference Kay2002; Ramos & Kay, Reference Ramos, Kay, Kay and Ramos2006). This process led to the formation of an asthenospheric flow that induced crustal melting and attenuation (Folguera et al. Reference Folguera, Introcaso, Giménez, Ruiz, Martinez, Tunstall, García Morabito and Ramos2007) as well as crustal collapse (e.g. Ramos & Kay, Reference Ramos, Kay, Kay and Ramos2006). Messager et al. (Reference Messager, Nivière, Lacan, Hervouët and Xavier2014), Sagripanti et al. (Reference Sagripanti, Vera, Gianni, Folguera, Harvey, Farías and Ramos2015) and Gürer et al. (Reference Gürer, Galland, Corfu, Leanza and Sassier2016), among others, provided new evidence that favours the hypothesis of ongoing shortening rather than extension. Finally, G. Messager (unpub. PhD thesis, Université de Pau et des pays de l'Adour, Reference Messager, Nivière, Martinod, Lacan and Xavier2010) documented active deformation in the frontal zone of the Malargue Fold–Thrust Belt in the El Sosneado area. Deformed alluvial fans and folded terraces of the Rio Atuel River show clear evidence of shortening. All these geomorphological markers have been dated and provide a Pleistocene age, which corresponds to the latest event of reverse faulting is this area. Our observations confirm the conclusions of those authors which suggest that the Central Andean system is still under compression.
As the eastern border of the SRB is striking NW–SE to NNW–SSE, and taking into account that the current shortening in this area is roughly trending E–W, a left-lateral component of displacement could be expected along the eastern SRB border. The fact that the Las Malvinas and Cerro Negro faults both show right and left steps and bends (Fig. 2) seems incompatible with any strike-slip component. In addition, the Aisol and Valle Grande faults appear more linear and strike-slip deformation has been reported along these faults. The shortening component of deformation could therefore be accommodated along the eastern border of the SRB and the lateral component by the linear faults of the SRB interior.
Far-field compression in foreland cratonic setting is not an uncommon pattern of the deformation style, particularly in cordilleran back-arc setting (Hardebol et al. Reference Hardebol, Callot, Bertotti and Faure2009). For instance, the foreland of the Rocky Mountains is well known for the building of the Laramide inversion arches during Palaeocene and Eocene time in the foreland of the Sevier Fold–Thrust Belt (Stone, Reference Stone, Schmidt, Chase and Erslev1993) through the development of crustal-scale inversion far away from the fold–thrust belt front (DeCelles, Reference DeCelles2004; Hardebol et al. Reference Hardebol, Callot, Bertotti and Faure2009). Several mechanisms of far-field stress transmission from the deformation front to the apparently undeformed foreland basin have been envisioned (e.g. DeCelles, Reference DeCelles2004; Jones et al. Reference Jones, Farmer, Sageman and Zhong2011). Among them are: (1) the existence of a lower detachment in which compressive features are rooted, and which should be localized in the crust at the ductile/fragile transition (see Ramos et al. Reference Ramos, Zapata, Cristallini, Introcaso and McClay2004); (2) mid-crustal flow and lower crust thickening (e.g. McQuarrie & Chase, Reference McQuarrie and Chase2000); (3) lithospheric buckling (e.g. Tikoff & Maxson, Reference Tikoff and Maxson2001); (4) basal traction from the subducting slab (English, Johnston & Wang, Reference English, Johnston and Wang2003); and (5) modification of the mantle flow in the corner beneath the cordillera (Hardebol et al. Reference Hardebol, Callot, Bertotti and Faure2009; Jones et al. Reference Jones, Farmer, Sageman and Zhong2011). As well as the development of large-scale structural features, the far-field stresses in the foreland basin are also recorded through the matrix-scale damage (e.g. Weil & Yonkee, Reference Weil and Yonkee2012). Such finite strain is most often recorded in the undeformed foreland previous to the building of macroscopic features, illustrating that the compressive stresses are already influencing the damage of the foreland sedimentary sequence at the time macroscopic structures are formed (Weil & Yonkee, Reference Weil and Yonkee2012).
Considering the Southern Andes and the particular case of the Malargue Fold–Thrust Belt, a systematically compressive regime recorded in the development of inverted basement structures in the foreland basin (Strecker et al. Reference Strecker, Hilley, Bookhagen, Sobel, Busby and Perez2011; this study), in the transmission of the crustal shortening in the intrabelt sedimentary cover (Branellec et al. Reference Branellec, Callot, Aubourg, Nivière and Ringenbach2015 a, Branellec et al. this issue) and in the record by meso- and microscale strain indicators such as fracture sets and matrix-scale strain (Branellec et al. Reference Branellec, Callot, Nivière and Ringenbach2015b) is suggested. This pattern of deformation is also clearly evidenced further north in the Sierra Pampeanas (e.g. Strecker et al. Reference Strecker, Hilley, Bookhagen, Sobel, Busby and Perez2011), defined as a ‘broken foreland’, related to the evolution of the coupling between the subducting pacific slab and the Cordillera, transmitted through the progressive thickening of the lower crust and rooting of crustal-scale thrust at the base of the fragile crust (Folguera et al. Reference Folguera, Naranjo, Orihashi, Sumino, Nagao, Polanco and Ramos2009; G. Messager, unpub. PhD thesis, Université de Pau et des pays de l'Adour, Reference Messager, Nivière, Martinod, Lacan and Xavier2010).
8. Conclusion
We have reported two new forms of geomorphic evidence of active deformation along the eastern border of the San Rafael Block: (1) the uplift of an alluvial terrace remnant above the Las Malvinas Fault; and (2) the folding of a fan above the Cerro Negro Fault. Depending on the erosion rate, the cosmogenic dating of these markers allows us to put forward a range of uplift rates and to estimate the associated slip rates. Based on the topographic signature of these faults, we quantified their seismogenic potential and propose that these faults can possibly account for major seismic events including the Villa Atuel earthquake of 1929. Our observations also show that compressive deformation prevailed during Plio-Pleistocene times. At the larger scale, the fact the SRB is currently uplifting gave us some indications about the mode of deformation propagation between 34°S and 36°S which is characterized by the migration of deformation far away within the foreland, a common feature of broken forelands (Strecker et al. Reference Strecker, Hilley, Bookhagen, Sobel, Busby and Perez2011).
Acknowledgements
The authors are very grateful to the Total group and Total Austral for financial support and field logistics. Authors also thank Michel Sébrier and one anonymous reviewer for their comments and suggestions which substantially improved the paper.