


1. Introduction
The Sixth Assessment Report of the Intergovernmental Panel on Climate Change (IPCC (2023)) underscores the climate emergency and advocates for a drastic reduction in greenhouse gas (GHG) emissions to achieve low CO2 emission targets compatible with human life. To meet this goal, economic instruments such as emission standards, carbon taxes, or emissions trading schemes have proven effective. However, their global impact remains limited in the absence of a binding international agreement involving most members of the international community (Nordhaus (Reference Nordhaus2018)). From this perspective, it is worth asking whether financial markets can play a role in coordinating climate action. Our work investigates whether financial markets are anticipating the long-term decline of fossil-intensive sectors. More specifically, do they penalize countries lagging in the low carbon transition by increasing the cost of public borrowing?
Since the Paris Agreement (2015), the links between financial markets and climate change have been formally conceptualized through the definition of new risks, such as climate risks and low-carbon transition risks (Monasterolo (Reference Monasterolo2020)). This agreement underscores the urgent need to align financial flows with a low greenhouse gas emissions pathway and climate-resilient development. Failure to do so would expose financial markets to the negative impacts of at least two distinct risks. On the one hand, most countries will face climate risks, which encompass damage to physical assets, natural capital, and human life, leading to losses in productive capacity and gross domestic product (GDP) due to climate-related weather events (IPCC (2023)). On the other hand, low-carbon transition risks arise from policies aimed at achieving carbon neutrality by transforming the economy, potentially resulting in asset devaluation in certain sectors. These risks are measured by the financial losses incurred from the revaluation of assets in the affected sectors (Batten et al. (Reference Batten, Sowerbutts and Tanaka2016), Battiston et al. (Reference Battiston, Mandel, Monasterolo, Schütze and Visentin2017)). Such risks stem from factors including the increased use of carbon pricing, the implementation of stricter environmental regulations, the emergence of stranded assets, and market risks linked to declining demand for carbon-intensive products. This article examines the impact of low-carbon transition risks on the cost of sovereign debt. If these risks are both significant and correctly anticipated by financial markets, the countries most exposed to them should face risk premiums, leading to higher public borrowing costs. An increase in the cost of public borrowing should incentivize countries to take necessary measures to protect themselves against these risks and reassure financial markets by implementing stricter environmental policies and diversifying their energy mix. In the short term, however, these risk premiums could further weaken the public finances of countries already exposed to major risks, exacerbating the difficulties in financing investments necessary for environmental protection.
As a key driver of climate change, fossil fuels play an important role at the macroeconomic level, particularly in relation to aggregate variables such as economic growth, public finances, investment, and trade. Against this background, our work focuses specifically on the impact of fossil fuels on the cost of public debt. This question is important for several reasons. First, since achieving carbon neutrality targets requires the decarbonization of energy and the phasing out of fossil fuels, countries abundant in these resources face the risk of being left with large amounts of stranded assets (transition risk). Second, the combustion of fossil fuels, which emits greenhouse gases, exacerbates the risk of physical damage linked to climate change (climate risk). In both cases, affected countries will suffer significant economic consequences, either facing a heightened risk of default or being forced to borrow heavily to finance disaster recovery and climate adaptation measures. In financial markets, these effects will be even more pronounced if the countries are particularly vulnerable, such as those with high levels of debt or a strong oil dependence. Consequently, lenders will perceive these countries as riskier and will demand a higher risk premium on loans.
We therefore investigate the existence of risk premiums associated with exposure to low-carbon transition risks through extended models of the macroeconomic determinants of sovereign debt costs. These models incorporate key indicators of exposure to low-carbon transition risks, including fossil resource abundance, the carbon intensity of GDP, and the share of renewable energy in total energy consumption. More specifically, the risk of stranded resources is proxied by fossil resource abundance as measured by subsoil wealth in fossil resources, while the carbon intensity of GDP captures the risk that carbon-intensive productive capital will be stranded. Using fossil resource abundance, measured by a country’s subsoil wealth, as an explanatory variable for sovereign borrowing costs makes it possible to simultaneously test two mutually exclusive mechanisms through which natural resources may affect debt costs. Financial markets may either regard fossil resources as an implicit form of collateral (i.e., a guarantee of repayment) or, conversely, as a risky asset due to the possibility of becoming stranded. The sign of the associated estimated parameter indicates which mechanism dominates, thereby revealing how financial markets perceive a country’s fossil resource abundance.
The mechanisms through which climate change affects sovereign borrowing costs are illustrated in Figure 1. The latter provides a schematic representation of the causes and transmission channels of environmental-related financial risks to public debt. Climate-related financial risks refer to the negative financial consequences of climate change. They encompass both transition risks associated with the shift toward a low-carbon economy and physical risks, such as the loss of fisheries due to changing ocean temperatures or damages resulting from extreme weather events. Figure 1 shows that transition risks toward a low-carbon economy may arise from stringent and abrupt environmental regulation, technological progress that enhances carbon and energy efficiency, or shifts in consumer preferences toward low-carbon products. These risks primarily materialize through stranded asset risks in a broad sense, encompassing stranded resources and stranded productive capital. These losses may undermine governments’ ability to service their debt, thereby increasing the risk of default and consequently leading to higher borrowing costs. Figure 1 also highlights that climate risks, although not the focus of this article, arise from the accumulation of CO2 in the atmosphere and are exacerbated by weak or lax environmental regulation. These risks materialize through natural disasters, which directly affect key macroeconomic variables, including public debt, or indirectly through financial losses resulting from climate-related litigation and biodiversity loss. Such disasters can indirectly influence transition risks when sudden environmental regulations are implemented in response to extreme weather events.
The causes and transmission channels of environmental-related financial risks on public debt cost.

We focus on public debt because climate-related financial risks directly affect governments’ fiscal sustainability and are likely to be reflected in the sovereign risk premiums required by financial markets. Our empirical framework is therefore explicitly designed to analyze sovereign, rather than private, borrowing. Private debt generally carries more microeconomic and sector-specific risks with shorter maturities, whereas public debt is exposed to macroeconomic and sovereign risks over longer horizons. Climate risks and fossil resource abundance are inherently long-term in nature, making them more relevant for sovereign debt dynamics. In addition, national (state-owned) oil companies control the majority of global fossil fuel reserves, typically between 75% (NRGI (2024))Footnote 1 and 90% (European Bank for Reconstruction and Development (EBRD) (2021)), depending on the source. As resource portfolios are predominantly held by governments, climate-related financial risks linked to fossil assets are more directly transmitted to the public sector. This further reinforces the rationale for concentrating on public debt in our analysis.
We draw on two unbalanced panel datasets to analyze the costs of short-term and long-term borrowing. These datasets span the period from 1995 to 2019 and together include 125 countries. The composition of the datasets varies primarily due to data availability and differences in how countries access credit, with developing nations tending to rely more heavily on short-term borrowing. The results show that countries with abundant fossil resources and those with a higher share of renewable energy in their energy mix benefit from lower borrowing costs. Conversely, countries with a more carbon-intensive GDP face higher interest rates on public debt. These findings, which reveal a seemingly ambiguous relationship between fossil resource wealth and debt costs, lead to two key insights. First, fossil resources are an important determinant of debt sustainability. Second, preserving fossil resource reserves rather than exploiting them could mitigate the risk of rising borrowing costs in resource-rich countries. Overall, our results suggest that financial markets reward the availability of fossil resources while penalizing their use, reflecting a paradoxical dynamic in which markets support the low-carbon transition while continuing to value fossil fuel endowments.
The remainder of the paper is structured as follows: Section 2 contains a brief literature review on the interrelationships between climate change, fossil fuels, and public finances. Section 3 describes the data used. Section 4 presents the methodological approach, and Section 5 discusses the empirical findings. Section 6 concludes and provides some policy implications.
2. Literature review
While there is extensive literature on the relationship between debt levels and economic development (Reinhart and Rogoff (Reference Reinhart and Rogoff2010), Eberhardt and Presbitero (Reference Eberhardt and Presbitero2015), Woo and Kumar (Reference Woo and Kumar2015)), relatively few studies have examined the role that fossil fuel abundance may play in shaping this relationship. Fossil resources may stimulate macroeconomic growth through the extraction sector and resource exports, while local combustion and use provide competitive energy. Fossil resource abundance is thus a source of economic wealth. Another option is to preserve underground resources for future use. Finally, abundance constitutes a form of implicit collateral that could lower borrowing costs. Underinvestment in the energy transition or overinvestment in the fossil fuel sectors may reinforce the role of abundance, as suggested by the carbon curse assumption (see Friedrichs and Inderwildi (Reference Friedrichs and Inderwildi2013), Chiroleu-Assouline et al. (Reference Chiroleu-Assouline, Fodha and Kirat2020)).
On the other hand, fossil fuel abundance raises concerns about transition risks, particularly losses associated with stranded assets. Climate policies are being implemented (Paris Agreement (2015) or COP28 agreement in Dubai (2023)) and are accelerating the phase-out of fossil fuels, making resource-rich countries more vulnerable. Investors may therefore anticipate a long-term economic slowdown in these countries, making their ability to repay debt more uncertain. The most vulnerable economies could be severely affected, especially in the event of external shocks (e.g., natural disasters, epidemics). These countries will no longer be able to finance their mitigation and adaptation strategies, further exacerbating their vulnerability. As a result, investors may demand a carbon risk premium, increasing borrowing costs.
These relationships between climate change, fossil fuels, and public finances have been addressed by three strands of literature. The first strand studies the impact of natural disasters on macroeconomic aggregates and public finances. Extreme events are likely to impact economic growth, productivity, and financial asset values. The literature shows that since the 1990s, a series of natural disasters have caused substantial economic losses. These losses may explain a decrease in public spending for environmental protection: a fall in GDP implies a decrease in public revenues and public spending. Climate change increases the frequency and the intensity of extreme weather events. There are direct and indirect economic impacts of natural disasters. Direct impacts refer to the damage to assets (e.g., property), with the losses occurring at the time of the disaster or shortly thereafter (like the destruction of houses, productive capital, infrastructure, crops, livestock...). The indirect impacts include interruptions of economic activities as well as any positive spillover effects due to the substitution of production (for example, spending on essential goods and health rather than R&D) and the demand for reconstruction. These indirect impacts capture the short- and long-term economic losses in economic production and consumption and any related economic recovery paths (see Fang et al. (Reference Fang, Lau, Lu, Wu and Zhu2018), Loayza et al. (Reference Loayza, Olaberria, Rigolini and Christiaensen2012), Botzen et al. (Reference Botzen, Deschenes and Sanders2019)).
The second branch examines the bilateral interactions between climate policies and public financing capacities. The poorest and most exposed countries cannot implement policies to adapt to climate change, especially after COVID-19 when public finances deteriorated further. On the other hand, environmental taxes raise revenue while discouraging greenhouse gas emissions. Costs associated with climate change could compromise the ability of some countries to repay their debt. As Dibley et al. (Reference Dibley, Wetzer and Hepburn2021) point out, public debt is legitimate as long as it finances an investment whose returns offset the debt burden. However, climate change threatens economic growth and therefore weakens the countries affected by extreme events. This risk is all the more important as the health context in 2020 and 2021 has forced most countries to increase their public debt. The vulnerability of these countries is growing and may lead the most fragile and indebted to default and enter into a sovereign debt crisis. Faced with this debt risk, which could be exacerbated by the consequences of climate change, investors will be tempted to require a higher risk premium, which would lead borrowers to offer higher interest payments on their debt. Beirne et al. (Reference Beirne, Renzhi and Volz2021) show how public borrowing costs can be affected by climate change. The main channels are the decline in capital, the fiscal consequences of natural disasters, and government spending related to adaptation and mitigation needs. They estimate the impact of climate risks on bond yields and find increased vulnerability and lower resilience to climate risks lead to higher bond yields. Cantelmo et al. (Reference Cantelmo, Melina and Papageorgiou2023) observe that, between 1998 and 2017, on average, during months when natural disasters occurred in Jamaica, the interest rate paid on government debt increased by 3.15 percent. Mallucci (Reference Mallucci2022) studies how natural disasters can exacerbate fiscal vulnerabilities and imply sovereign defaults, for seven Caribbean countries frequently hit by hurricanes. He shows that disaster risk reduces the government’s ability to issue debt and that climate change further restricts government access to financial markets. Furthermore, he predicts that in Caribbean countries, if the frequency and intensity of hurricanes increase as expected, credit spreads will increase by more than 30 percent. This result is also supported by Kling et al. (Reference Kling, Lo, Murinde and Volz2025) who estimate that countries vulnerable to natural disasters pay, on average, a 1.17 percent higher cost of debt compared to countries less exposed to climatic events.
The risk of default on public debt can be explained by the fact that financial markets currently do not fully take climate change risks into account in their measures of the risks associated with financial contracts. Loans to exposed countries for highly polluting projects may be made, while conversely, sustainable investment strategies are discarded (Monasterolo (Reference Monasterolo2020)). More generally, the mispricing of climate risks could lead to systemic risk and financial instability. For these reasons, it seems important that governments systematically assess their exposure to climate risks and disseminate these assessments and risks to economic actors. Only Ghana has undertaken this risk assessment to secure borrowing in response to the COVID-19 crisis (Dibley et al. (Reference Dibley, Wetzer and Hepburn2021)). This information requirement would inevitably result in higher borrowing costs for vulnerable countries, creating a clear disincentive to disclose such information.
The third branch analyses the impact of climate change and natural resources on public and private debt. Natural resources have a direct impact on public debt through the income that they generate. Ampofo et al. (Reference Ampofo, Jinhua, Bosah, Ayimadu and Senadzo2021) show that resource-rich countries have a bidirectional relationship between resource rents and public debt accumulation. In the short run, an increase in resource revenues reduces public debt, but in the long run, dependence on natural resources can increase debt due to price instability and poor fiscal policies. Similarly, high levels of public debt can influence the management of natural resources, in particular by encouraging governments to intensify extraction in order to finance debt servicing. This mechanism has been characterized as the debt-resource hypothesis (Neumayer (Reference Neumayer2005)). In the case of Ghana, Alhassan and Kwakwa (Reference Alhassan and Kwakwa2023) show that increased extraction of natural resources to meet budgetary needs has a negative impact on the environment, which could threaten long-term economic sustainability. Clootens and Magris (Reference Clootens and Magris2024) show that countries with abundant fossil resources benefit from favorable borrowing conditions when resource prices are high. However, when prices fall, investors perceive increased risk, leading to a rise in public debt costs.
These interactions become more complex as climate change affects the value of natural resources. The mechanisms at work are linked to transition risks and stranded assets. The rise of renewable energy and the decline in demand for fossil fuels affect the long-term value of fossil resources. This uncertainty can increase the risk premium associated with the sovereign debt of countries dependent on fossil fuels (Humphreys and Sandbu (Reference Humphreys and Sandbu2007)). This is clearly the case for carbon-intensive publicly owned assets, such as coal mines or energy utilities in several EU countries. These could become stranded assets, as they are no longer economically viable when carbon prices rise. An estimated $12 trillion of assets could become stranded by 2,050, equivalent to 3% of the capital stock (Banque de France (Reference Banque de France2019)).
A more recent literature has focused on the impact of these risks on the assets and debts of private firms. A consensus is emerging that companies bear an additional carbon cost when their efforts to adapt to climate change are weak. Bolton and Kacperczyk (Reference Bolton and Kacperczyk2023) examine how carbon emission levels and trends affect stock market returns on a global scale. The study examines how factors such as economic development, energy structure, and institutions influence the relationship between carbon emissions and stock market returns. They show that carbon emission levels and their growth are significantly correlated with stock market returns. Firms in high-emission countries and high-emission firms both tend to exhibit lower stock market returns.
Our paper lies at the intersection of these three strands of literature and complements previous findings by focusing on public debt at a large scale. We therefore use original data on fossil resources and the cost of public debt, incorporating a broader geographical and temporal dimension. Unlike most of the literature, which primarily explores the impact of public debt costs and tax revenue needs on fossil resources (Ampofo et al. (Reference Ampofo, Jinhua, Bosah, Ayimadu and Senadzo2021), Alhassan and Kwakwa (Reference Alhassan and Kwakwa2023), Neumayer (Reference Neumayer2005)), our focus is on the reverse causality. Nevertheless, the theoretical work of Clootens and Magris (Reference Clootens and Magris2024) suggests that a decline in the value of fossil resources, potentially rendering them stranded assets, should lead to an increase in the cost of public debt. To our knowledge, our study is the first to empirically test this relationship, and our findings reveal a nuanced effect. We find that financial markets play an ambiguous role in the face of fossil resources. Indeed, while the abundance of fossil resources reduces the cost of government borrowing, the level of CO2 emissions per $ of GDP increases this cost, which seems contradictory. Yet, our results suggest a clear conclusion: fossil fuels should be preserved. We argue that fossil resources are important for debt sustainability. Therefore, countries should focus on exploring and conserving fossil reserves rather than depleting them, as this strategy can help resource-rich nations avoid an increase in public debt costs.
3. Data
3.1 Data and variables
To investigate the costs associated with short-term and long-term borrowing, this study utilizes two unbalanced panel datasets comprising 125 countriesFootnote 2 globally over the period 1995-2019. The composition of countries within these datasets varies, primarily due to data unavailability and differences in credit access, with developing economies exhibiting a greater reliance on short-term borrowing. The datasets are further distinguished by the inclusion of two distinct indicators of government debt costs, both sourced from the International Financial Statistics (IFS) database of the International Monetary Fund (IMF). The first indicator is the treasury bill rate, which represents the rate at which short-term government debt securities are issued or traded in the market. The maturity of these securities varies across countries, typically ranging from 3 to 12 months. The second indicator is the government bond yield, which refers to one or more series representing yields to maturity of government bonds or other bonds indicative of longer-term interest rates. The maturity of these securities also varies across countries. In most cases, the government bond yield variable represents the average daily secondary market yield on ten-year fixed-rate government bonds. When these data are unavailable, the variable instead reflects the average yields on all bonds with a remaining maturity of more than three years.
Our datasets also include two groups of variables measuring low-carbon transition risks. The first group of variables measures natural resource abundance and comes from the World Bank.Footnote 3 These variables refer to countries’ subsoil wealth and distinguish fossil resources, oil, gas, and coal from all subsoil resource wealth. The value of a country’s stock of resources is measured as the present value of the stream of expected rents that may be extracted until the resource is exhausted. The second group of low-carbon transition risk proxies includes renewable energy consumption as a share of total final energy consumption that comes from the World BankFootnote 4 and CO2 intensity of GDP (in kg per 2010 U.S. dollar of GDP) taken from the World Development Indicators (WDI) database of the World Bank.
As per our controls, we use a set of standard macroeconomic variables that are likely to affect the cost of sovereign debt such as debt-to-GDP ratio, exchange rate, inflation, fiscal balance, and GDP growth. Data on exchange rates come from the IFS database (IMF) and are measured by the average exchange rate of domestic currencies per U.S. dollar over a year. We also use the percentage change of the Consumer Price Index (CPI) taken from IFS to account for inflation. Moreover, total natural resources rents represent the sum of oil rents, natural gas rents, coal rents (hard and soft), mineral rents, and forest rents. While public debt-to-GDP ratio, budget balance, and total natural resources rents as a share of GDP come from the WDI of the World Bank, GDP growth is taken from the Penn World Table 10 (Feenstra et al. (Reference Feenstra, Inklaar and Timmer2015)).Footnote 5 We take the output-side real GDP at chained PPPs (2017 U.S. dollars) to compute GDP rates of growth.
We finally appeal to proxies of institutional quality from the Worldwide Governance Indicators database, which capture aggregate and individual governance indicators across six dimensions of governance: voice and accountability; political stability and absence of violence/terrorism; government effectiveness; regulatory quality; rule of law; and control of corruption. Institutional quality measures are obtained through large surveys and take values between −2.5 and 2.5.Footnote 6 We transform these measures to obtain institutional quality variables ranging from 0 to 5.
3.2 Descriptive analysis
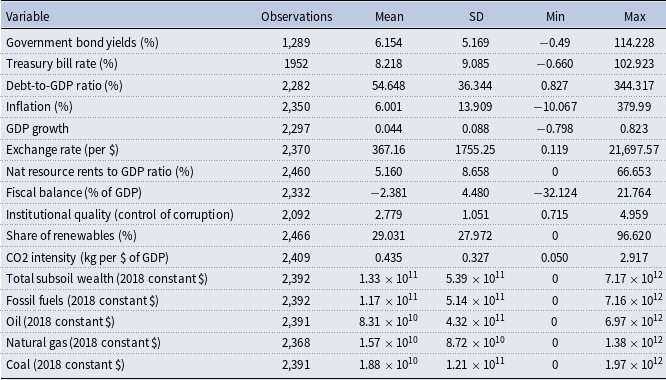
The main descriptive statistics are presented in Table 1 and Figures 2 to 5. They highlight broad disparities between countries in economic and financial variables, natural resource endowments, and exposure to low-carbon transition risks. The level of subsoil wealth is illustrative of these differences; some countries lack natural resources while others are extremely well-endowed.
Summary statistics

Figure 2 provides an overview of the average government bond yields across a subsample of 72 countries,Footnote 7 revealing considerable heterogeneity among national economies. The average government bond yield over the period in Venezuela (17.97%) or Ghana (18.68%) is nearly seventeen times higher than that of Japan (1.09%). This variability reflects underlying differences in economic fundamentals and sovereign risk profiles. Countries distinguished by prudent fiscal policies, low debt-to-GDP ratios, and robust institutional frameworks tend to exhibit markedly lower yields. Exemplifying this trend are nations such as Japan (even with high levels of debt), Switzerland, Denmark, and Luxembourg, whose government bond yields remain exceptionally low. These yields highlight their status as safe-haven assets, underpinned by strong financial credibility and minimal perceived risk. In contrast, countries such as Venezuela, Pakistan, South Africa, Ghana, and Kyrgyzstan exhibit substantially higher yields, often exceeding 10%, indicative of heightened sovereign risk and macroeconomic instability.
Average yields on government bonds by country (1995–2019)

Figure 3 provides a comparative analysis of the average treasury bill rates across a subsample of 97 countries, including a notably larger proportion of developing nations than Figure 2. This disparity arises from the more significant constraints faced by developing countries in accessing long-term debt markets, compelling them to rely more heavily on short-term borrowing. The observed rates exhibit considerable variation, ranging from near 0% to over 25%, reflecting pronounced economic and financial disparities among the countries in the sample. Four distinct groups can be identified: (i) countries such as Japan and Saudi Arabia, which exhibit exceptionally low rates, below 1%; (ii) European countries like Greece, Italy, and Spain, which display relatively low rates between 2% and 5%, indicative of moderate but persistent sovereign risks linked to high debt levels; (iii) a diverse group of fifty countries with moderate rates ranging from 5% to 15%, predominantly comprised of developing economies; and (iv) countries with high rates, largely represented by the least developed nations, such as Zambia, Malawi, and Laos, where rates exceed 20%. These elevated rates reflect substantial risk premiums, often tied to macroeconomic instability, high inflation, or political uncertainty.
Average rates on treasury bills by country (1995–2019).

Average debt to GDP ratios by country (1995–2019).

Figure 4 illustrates the average debt-to-GDP ratios for the countries in our sample, calculated over the period from 1995 to 2019. The figure highlights the substantial heterogeneity in public debt levels relative to the size of national economies. The debt-to-GDP ratios vary considerably, ranging from approximately 10% to over 140%, reflecting pronounced disparities in public debt management practices across nations. Of particular interest is the contrast between resource-rich nations and those with limited access to such resources. For example, economies like Russia and Saudi Arabia report some of the lowest debt-to-GDP ratios, while countries such as Lebanon, Japan, and Greece exhibit particularly high average ratios. Meanwhile, countries like France, Spain, and Austria occupy an intermediate position within this spectrum.
Figure 5 illustrates the average carbon intensity of GDP across 121 countries in our sample, measured in kilograms of CO2 emissions per U.S. dollar of GDP. The data reveal significant variability in carbon intensity, ranging from less than 0.1 to over 1.5 kilograms per dollar of GDP. The countries with the highest carbon intensities include Mongolia, Moldova, South Africa, and Russia.
A closer analysis of Figure 5 suggests that carbon intensity is at least partially associated with the abundance of fossil resources, reflecting the carbon curse phenomenon. This relationship appears particularly pronounced in developing and emerging economies. Notably, eleven of the twenty countries with the highest carbon intensities are also among the twenty most resource-rich nations in fossil fuels, including Russia, Saudi Arabia, South Africa, Algeria, Libya, India, Iraq, Azerbaijan, Malaysia, Vietnam, and Egypt.
Average carbon intensity by country (1995–2019).

Before moving on to the empirical estimation, we present several correlations between the key variables to better understand the relationship between sovereign debt costs and transition risks. Figure 6 shows that, when country fixed effects (unobserved heterogeneity) are considered, the relationship between government bond yields and oil abundance (represented by the different colored dots) is negative, pointing out that oil-abundant countries pay lower interest rates on their sovereign debts (even if the overall relationship is positive, as represented by the red line).
In the same line of thought, Figure 7 shows a negative and statistically significant relationship between government bond yields and the share of renewable energy in total energy consumption. Hence, the greater the share of renewable energy in a country’s energy mix, the lower its debt cost.
Figure 8 shows that higher CO2 intensity of GDP is associated with more expensive debt or higher interest rates. These preliminary correlations suggest that financial markets reward fossil resource abundance (as a measure of solvency) while penalizing their use (to meet the net-zero emissions target).
Government debt costs and oil abundance.

The next section empirically tests these relationships.
Government debt costs and renewable energy consumption.

Government debt costs and carbon intensity of GDP.

4. The empirical model
We aim to investigate the impact of low-carbon transition risks on sovereign debt costs. To this end, we extend a standard model from the macroeconomic and financial literature that examines the determinants of sovereign bond yields (Edwards (Reference Edwards1984), Edwards (Reference Edwards1986), Beirne and Fratzscher (Reference Beirne and Fratzscher2013)) by incorporating proxy variables that capture exposure to low-carbon transition risks as additional explanatory variables. In this framework, the cost of borrowing for countries serves as the dependent variable, while the explanatory variables include the most commonly used macroeconomic determinants in the literature, such as GDP growth, fiscal balance, the debt-to-GDP ratio, inflation rate, resource rents as a share of GDP, exchange rate, and institutional quality.Footnote 8 The choice of control variables for the pricing of sovereign risk is crucial. The theoretical literature (Eaton and Gersovitz (Reference Eaton and Gersovitz1980), Eaton and Gersovitz (Reference Eaton and Gersovitz1981), Arellano (Reference Arellano2008), Eichengreen and Hausmann (Reference Eichengreen and Hausmann1999)) identifies and supports a wide range of determinants of the cost of public borrowing and sovereign risk, while empirical studies (Edwards (Reference Edwards1984), Edwards (Reference Edwards1986), Eaton and Gersovitz (Reference Eaton and Gersovitz1980), Eichengreen and Mody (Reference Eichengreen and Mody2000), Min (Reference Min1998), Beck (Reference Beck2001), and Ferrucci (Reference Ferrucci2003)) test their relevance. Most empirical studies converge on the relevance of variables such as the level of indebtedness, economic growth, the inflation rate, the exchange rate, and the fiscal balance as key determinants of sovereign risk across contexts. Indeed, the debt-to-GDP ratio reflects a country’s level of indebtedness and is widely used as a key indicator of its solvency. An increase in this ratio signals a deterioration in solvency, which heightens the perceived risk of default and, consequently, leads to higher borrowing costs. The inflation rate is expected to exert a positive effect on the cost of sovereign borrowing. Rising inflation prompts lenders to require higher nominal interest rates to offset the anticipated loss of purchasing power, thereby increasing borrowing costs. In addition, high or volatile inflation heightens uncertainty about future price levels, which raises the inflation risk premium embedded in interest rates. Persistent inflation may also signal weak monetary or fiscal discipline, leading investors to perceive greater sovereign risk and demand higher yields. Furthermore, elevated inflation can reflect broader macroeconomic imbalances, such as an increased likelihood of a balance of payments crisis, reinforcing perceptions of economic instability and a higher probability of default, which in turn raises the risk premium on sovereign debt. High growth rates are expected to reduce the cost of borrowing as sustained economic growth strengthens fiscal capacity by increasing tax revenues and improving budget balances. This reduces sovereign risk premiums and borrowing costs. Fiscal balance is an indicator of a government’s fiscal discipline. A surplus reduces the risk of default, while a deficit must be financed through additional borrowing, thereby weakening the country’s solvency. Exchange rate movements affect sovereign borrowing costs primarily through valuation effects on foreign-currency-denominated debt and through risk premiums, as exchange rate depreciation raises debt servicing costs and increases perceived default risk, thereby increasing borrowing costs (Eichengreen and Hausmann (Reference Eichengreen and Hausmann1999)). Our baseline panel regression model is specified as follows:
 \begin{equation} Y_{it}=\alpha +\beta R_{it}+\gamma Z_{it}+\delta _{i}+\lambda _{t}+\varepsilon _{it} \end{equation}
where $i$
refers to the country and
$i$
refers to the country and $t$
to the time period.
$t$
to the time period. $Y$
refers to the borrowing cost. This variable is proxied in the macroeconomic literature as the sovereign bond yield.Footnote
9
In this article, we proxy the cost of borrowing by two alternative measures: the 10-year sovereign bond yield and the treasury bill rate, which respectively capture long-term and short-term costs of sovereign borrowing.
$Y$
refers to the borrowing cost. This variable is proxied in the macroeconomic literature as the sovereign bond yield.Footnote
9
In this article, we proxy the cost of borrowing by two alternative measures: the 10-year sovereign bond yield and the treasury bill rate, which respectively capture long-term and short-term costs of sovereign borrowing. $R_{it}$
represents the exposure to low-carbon transition risk faced by country
$R_{it}$
represents the exposure to low-carbon transition risk faced by country $i$
in year
$i$
in year $t$
. We proxy this latter variable using various measures among subsoil resource wealth, CO2 intensity of GDP, and the share of renewables in total energy consumption. We first introduce these variables individually with the controls, then we combine them to see how they simultaneously affect debt costs. Subsoil resource wealth encompasses several variables that allow us to distinguish between fossil resources, oil resources, natural gas resources, and coal resources. The inclusion of these subsoil resource wealth variables allows us to test whether different fossil resources can be considered stranded assets or, conversely, whether they continue to be valued by financial markets. All subsoil resource wealth variables are expressed in logarithms in the estimation framework. The other proxy variables for exposure to low-carbon transition risks will help explore the existence of a risk premium linked to the carbon intensity of GDP and/or a reward associated with the deployment of renewable energies.
$t$
. We proxy this latter variable using various measures among subsoil resource wealth, CO2 intensity of GDP, and the share of renewables in total energy consumption. We first introduce these variables individually with the controls, then we combine them to see how they simultaneously affect debt costs. Subsoil resource wealth encompasses several variables that allow us to distinguish between fossil resources, oil resources, natural gas resources, and coal resources. The inclusion of these subsoil resource wealth variables allows us to test whether different fossil resources can be considered stranded assets or, conversely, whether they continue to be valued by financial markets. All subsoil resource wealth variables are expressed in logarithms in the estimation framework. The other proxy variables for exposure to low-carbon transition risks will help explore the existence of a risk premium linked to the carbon intensity of GDP and/or a reward associated with the deployment of renewable energies. $Z$
is a matrix of control variables that includes the debt-to-GDP ratio, the inflation rate, GDP growth to control for the macroeconomic environment, the budget balance, exchange rates, the resource rent-to-GDP ratio, and institutional quality.
$Z$
is a matrix of control variables that includes the debt-to-GDP ratio, the inflation rate, GDP growth to control for the macroeconomic environment, the budget balance, exchange rates, the resource rent-to-GDP ratio, and institutional quality. $\gamma$
represents a vector of parameters associated with control variables. In panel data models, we control for unobserved heterogeneity using fixed or random effects, with the
$\gamma$
represents a vector of parameters associated with control variables. In panel data models, we control for unobserved heterogeneity using fixed or random effects, with the $\delta _{i}$
terms capturing unobserved country-specific characteristics. We favor a fixed-effects specification for two main reasons. First, unobserved country-specific factors are likely to be correlated with the explanatory variables included in equation (1), making the random-effects GLS estimator inconsistent, whereas the fixed-effects within estimator remains consistent. Second, a Hausman test rejects the null hypothesis of no systematic difference between the two estimators, in favor of the fixed-effects specification.Footnote
10
$\delta _{i}$
terms capturing unobserved country-specific characteristics. We favor a fixed-effects specification for two main reasons. First, unobserved country-specific factors are likely to be correlated with the explanatory variables included in equation (1), making the random-effects GLS estimator inconsistent, whereas the fixed-effects within estimator remains consistent. Second, a Hausman test rejects the null hypothesis of no systematic difference between the two estimators, in favor of the fixed-effects specification.Footnote
10 $\lambda _{t}$
denotes a full set of time-varying fixed effects serving to capture exogenous shocks that could affect all countries of our sample in the same way, and
$\lambda _{t}$
denotes a full set of time-varying fixed effects serving to capture exogenous shocks that could affect all countries of our sample in the same way, and $\varepsilon _{it}$
is the error term.
$\varepsilon _{it}$
is the error term.
5. Results
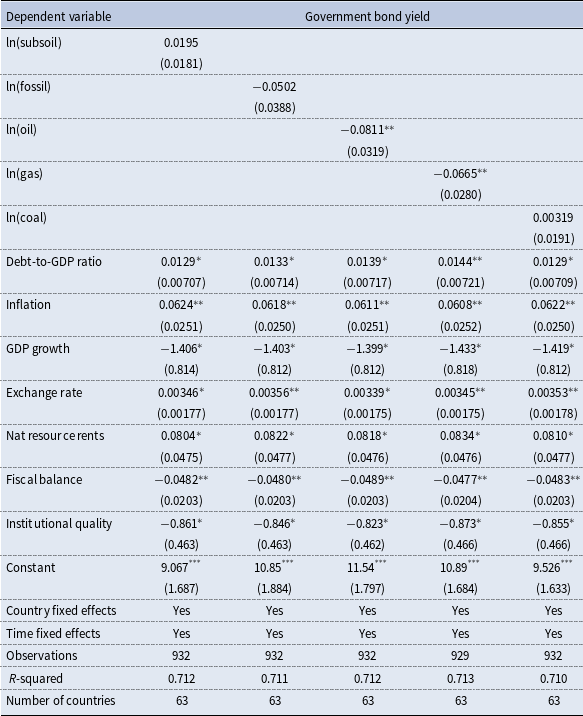
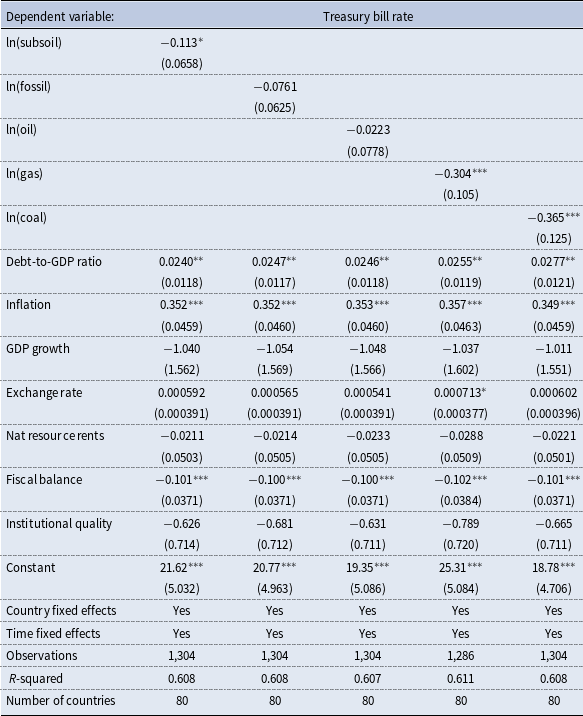
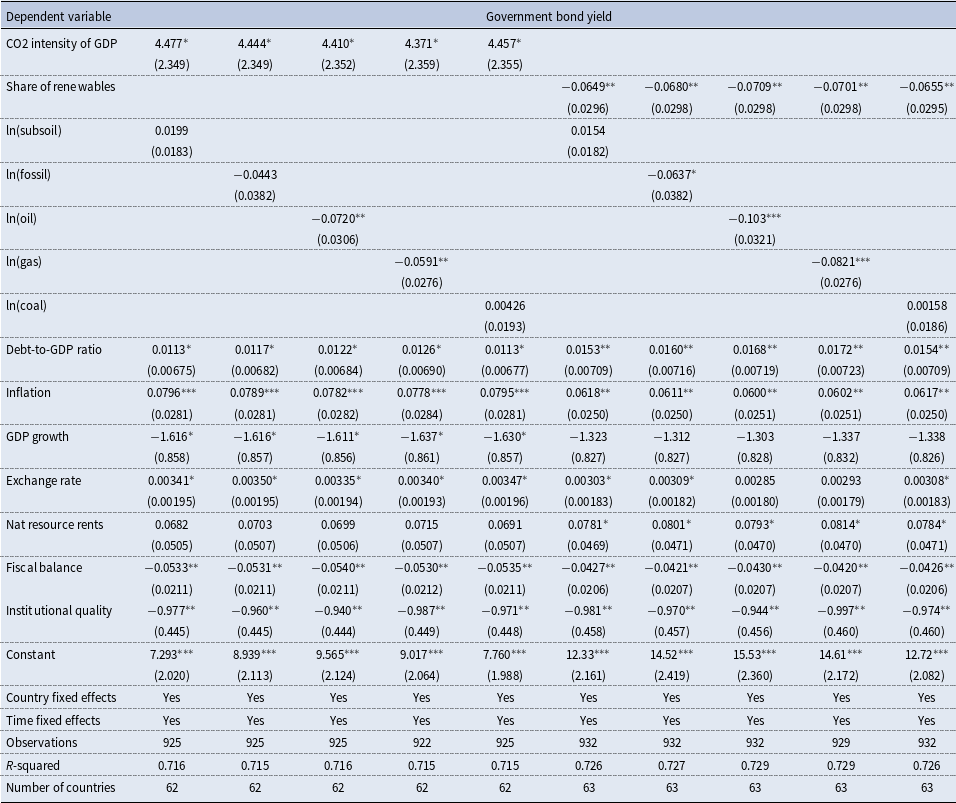
We estimate equation (1) with country-specific fixed effects using the Prais-Winsten procedure to address first-order autocorrelation within the panels. Additionally, we adjust the standard errors of the estimated parameters to account for both panel-groupwise heteroskedasticity and cross-sectional dependence, following Beck and Katz (Reference Beck and Katz1995). Tables 2 and 3 report estimates of equation (1) when the dependent variables are, respectively, government bond yields and treasury bill rates; the proxies for exposure to low-carbon transition risk are represented by various measures of subsoil resource wealth. Each table is divided into five columns, corresponding to different model specifications based on the choice of subsoil resource wealth proxies. This approach allows us to test whether fossil resources have become stranded assets or, conversely, still serve as a guarantee of solvency. The set of proxies successively includes total subsoil resources, aggregate fossil fuel resources, and individual categories such as oil, gas, and coal resources.
Estimation results of government bond yield drivers and impacts of natural resources

Note: Standard errors in parentheses. ***, ** and * refer respectively to the significance of estimated parameters at the 1%, 5% and 10% significance levels. The notation ln denotes the logarithmic transformation of the variable.
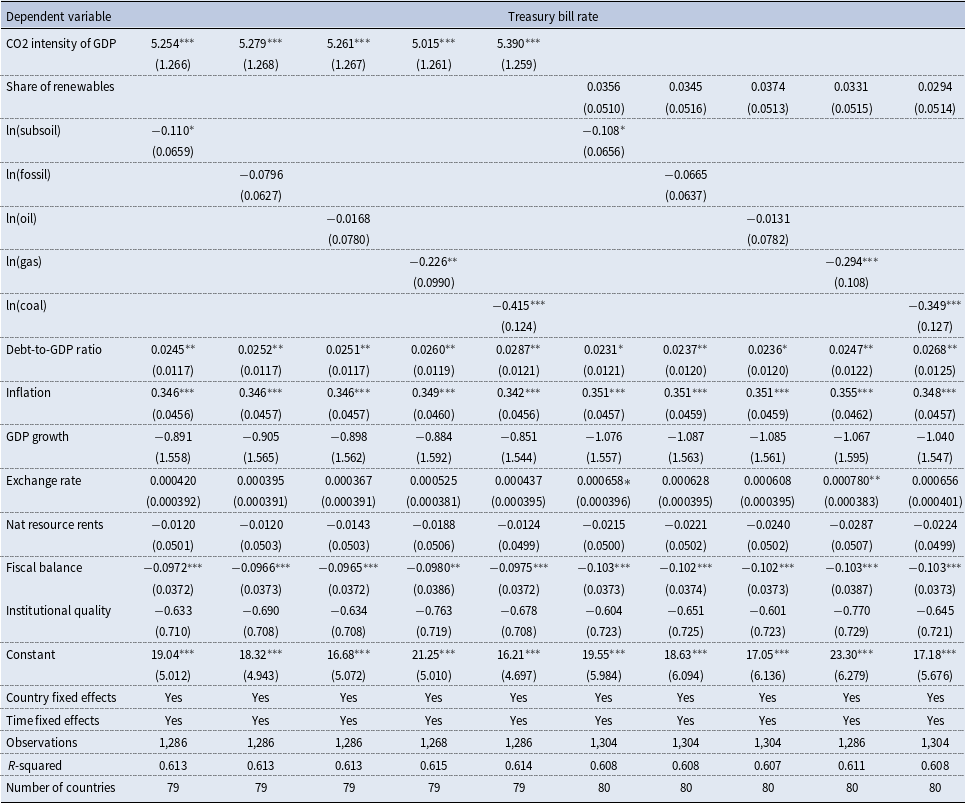
Estimation results of treasury bill rate drivers and impacts of natural resources

Note: Standard errors in parentheses. ***, ** and * refer respectively to the significance of estimated parameters at the 1%, 5% and 10% significance levels. The notation ln denotes the logarithmic transformation of the variable.
The estimation results in Table 2 show that the estimated parameters associated with all subsoil resources, aggregate fossil fuel resources, and coal resources appear to be statistically insignificant. In contrast, those associated with oil resources and natural gas resources are negative and statistically significant. All else being equal, a 1% increase in oil resources reduces the cost of debt by 0.08 percentage points, while a similar increase in natural gas resources lowers it by 0.07 percentage points. These results show that financial markets reward oil and gas resources, viewing them as repayment guarantees against default risk. Consequently, these fossil resources are not considered stranded. This finding is not surprising, given that the global primary energy mix is largely dominated by fossil fuels, which accounted for over 80% (oil, 32%; natural gas, 23%; and coal, 27%) in 2023 (Energy Institute (2024)).
With respect to the macroeconomic controls, all estimated coefficients exhibit the expected signs and are statistically significant. Government bond yields increase with respect to the debt-to-GDP ratio, the inflation rate, the exchange rate, and the share of natural resource rents in GDP. Conversely, they decrease with respect to the GDP growth rate, the fiscal balance, and the quality of institutions.Footnote 11 Poor institutional quality is associated with a higher cost of borrowing, while GDP growth reduces the cost of debt. On the other hand, higher inflation rates and a high level of debt increase the cost of borrowing.
The estimation results of short-term borrowing costs in Table 3 show that total subsoil wealth has a negative impact on treasury bill rates. This result is mainly driven by natural gas and coal resources. All else being equal, a 1% increase in natural gas resources reduces the treasury bill rates by 0.3 percentage points, whereas a comparable increase in coal resources leads to a reduction of 0.36 percentage points. Oil resources do not appear to have any significant effect on treasury bill rates. To sum up, oil resources are found to serve as a repayment guarantee for long-term borrowing, whereas coal resources represent a repayment guarantee for short-term borrowing. Natural gas resources, on the other hand, support both short-term and long-term borrowing. These differences between fossil resources serving as collateral for long-term and short-term borrowing seem to depend on the most abundant fossil resources in the countries belonging to the two subsamples used to estimate the short-term and long-term determinants of sovereign debt costs. Ultimately, fossil resources do not appear to be stranded; rather, they seem to act as a guarantee for debt repayment.
The results presented in Table 3 also indicate that all of the estimated coefficients associated with the macroeconomic determinants of treasury bill rates exhibit the expected signs. However, only those associated with the debt-to-GDP ratio, inflation rate, and fiscal balance are statistically significant. In contrast, the estimated parameters associated with GDP growth, the quality of institutions, and natural resource rents as a share of GDP are statistically insignificant at conventional levels. This highlights a significant distinction in the determinants of short-term and long-term borrowing costs. For common macroeconomic factors such as the debt-to-GDP ratio, the inflation rate, and the fiscal balance, the magnitude of their impacts on the two types of borrowing costs varies considerably. Specifically, a 1 percentage point increase in the inflation rate, all else being equal, results in a 0.06 percentage point rise in long-term borrowing costs and a 0.35 percentage point increase in short-term borrowing costs. Similarly, the effects of public debt level and fiscal balance are more pronounced for short-term borrowing costs compared to long-term borrowing costs. However, it is worth noting that the difference between estimation results for the determinants of long-term and short-term borrowing costs should be interpreted with caution and assessed in light of the differences among the countries included in the two subsamples used for estimating government bond yields and treasury bill rates, respectively.
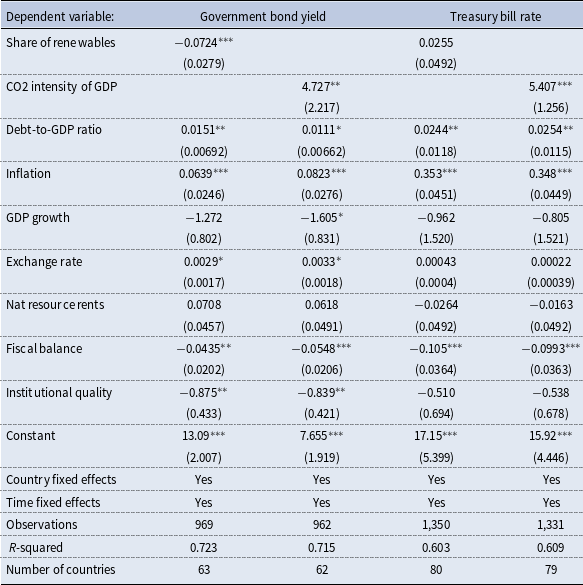
Table 4 summarizes the estimation results of government bond yields and treasury bill rates based on equation (1), with exposure to transition risks toward a low-carbon economy represented by two alternative indicators: (i) the CO2 intensity of GDP and (ii) the share of renewables in total energy consumption. These proxies of exposure to transition risks replace earlier measures of natural resource wealth, allowing for a comprehensive analysis of the potential risk premium associated with the carbon intensity of GDP and the prospective benefits linked to the expansion of renewable energy deployment. The latter two indicators measure a country’s exposure to the risk that carbon-intensive productive capital may become stranded. The estimated parameters associated with macroeconomic determinants exhibit qualitative similarities to those presented in Tables 2 and 3. We therefore focus on the estimated parameters associated with proxies for exposure to transition risks. Our findings reveal a strong and significant positive effect of CO2 intensity of GDP on both borrowing cost measures. An increase of 100 g per dollar in a country’s carbon intensity will, ceteris paribus, lead to a rise of 0.47 percentage points in its government bond yields and 0.54 percentage points in its treasury bill rates. For instance, in Germany, the CO2 intensity of GDP declined by 42.6 g per dollar between 2010 and 2017, which, all else being equal, resulted in a 0.2 percentage point reduction in government bond yields. Over the same period, the carbon intensity of GDP in the United States decreased by 74 g per dollar, corresponding to a decline of approximately 0.35 percentage point in U.S. government bond yields and 0.54 percentage points in U.S. government treasury bill rates. This suggests that financial markets incorporate a carbon risk premium to hedge against a country’s transition risks. This finding is consistent with the results of Chaudhry et al. (Reference Chaudhry, Ahmed, Shafiullah and Huynh2020), which indicate that CO2 emissions significantly exacerbate sovereign risk in G7 countries. It also aligns with Beirne et al. (Reference Beirne, Renzhi and Volz2021), who observe that the impact of climate change on bond yields is more pronounced in countries considered highly vulnerable to climate change.
Estimation results of sovereign debt cost drivers and impacts of transition risks

Note: Standard errors in parentheses. ***, ** and * refer respectively to the significance of estimated parameters at the 1%, 5% and 10% significance levels. Transition risks are proxied alternately by the share of renewables in total energy consumption and CO2 intensity of GDP.
Furthermore, we identify a significant negative relationship between the share of renewables in total energy consumption and government bond yields. A 10 percentage point increase in a country’s share of renewables is associated, ceteris paribus, with a 0.72 percentage point reduction in its government bond yields.
We further assess the robustness of the baseline results by estimating a set of specifications in which resource wealth variables are jointly included with alternative measures of exposure to low-carbon transition risk in equation (1). Specifically, we consider, on the one hand, the joint inclusion of subsoil resource wealth and the CO2 intensity of GDP and, on the other hand, the joint inclusion of subsoil resource wealth and the share of renewable energy in total energy consumption. This strategy allows us to simultaneously account for the risk of stranded resources and the risk of stranded carbon-intensive productive capital within a unified empirical framework. The corresponding estimation results are reported in Tables 5 and 6.
Estimation results of government bond yield drivers including both subsoil resources and CO2 intensity of GDP

Note: Standard errors in parentheses. ***, ** and * refer respectively to the significance of estimated parameters at the 1%, 5% and 10% significance levels. The notation ln denotes the logarithmic transformation of the variable.
The estimation results for government bond yields are reported in Table 5. Overall, the results are qualitatively consistent with the baseline estimates in Tables 2 and 3 and with the specifications that include alternative transition risk measures in Table 4. Across all specifications, the estimated coefficients associated with oil and gas resource wealth remain statistically significant and stable in magnitude, with no significant differences across models. A similar pattern emerges for the alternative transition risk measures. The coefficients associated with CO2 intensity of GDP remain statistically significant, although their significance level slightly declines from the 5% to the 10% level in some specifications, while the estimated effects of the share of renewable energy in total energy consumption are consistently statistically significant. Notably, the negative coefficient associated with aggregate fossil resource wealth becomes statistically significant in the joint specifications, further reinforcing the interpretation that fossil resources may serve as collateral for sovereign debt repayment.
Estimation results of treasury bill rate drivers including both subsoil resources and CO2 intensity of GDP

Note: Standard errors in parentheses. ***, ** and * refer respectively to the significance of estimated parameters at the 1%, 5% and 10% significance levels. The notation ln denotes the logarithmic transformation of the variable.
Table 6 reports the corresponding estimation results for treasury bill rates. These results are qualitatively consistent with the baseline estimates and with the specifications including alternative transition risk measures. The estimated coefficients associated with oil and gas resource wealth and CO2 intensity of GDP remain statistically significant and display limited variation across specifications. When CO2 intensity of GDP is replaced by the share of renewable energy in total energy consumption, the estimated effects of fossil resource wealth on treasury bill rates remain largely unchanged, while the coefficient associated with renewable energy deployment is not statistically significant.
Overall, the evidence indicates that fossil resources still function as implicit collateral for sovereign debt repayment, whereas financial markets internalize transition risks by pricing a carbon risk premium associated with the potential stranding of carbon-intensive productive capital.
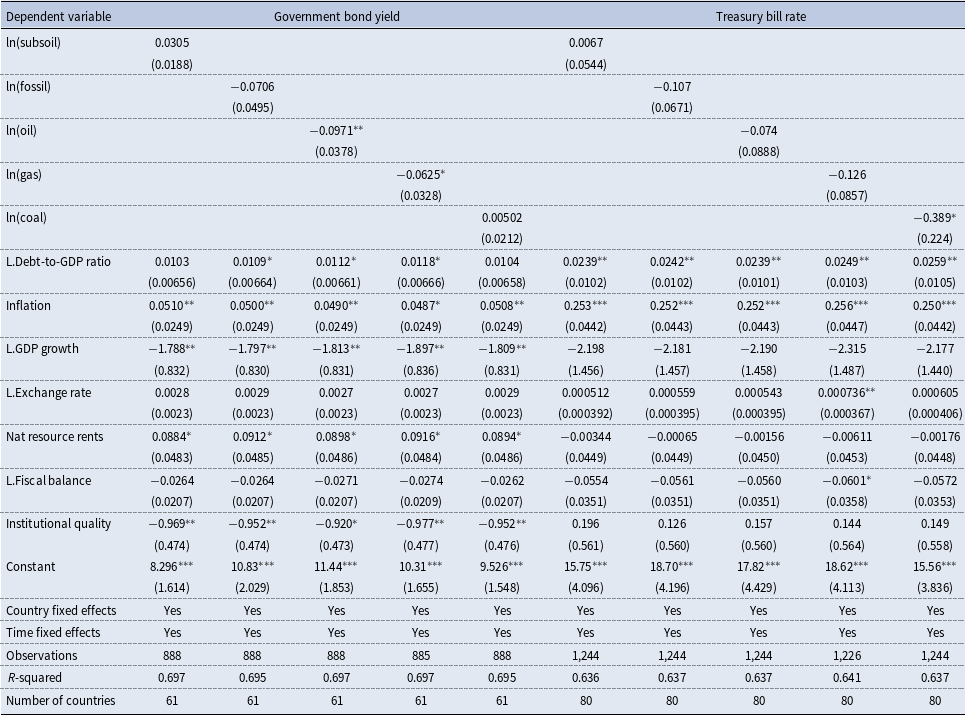
Finally, a potential concern in our baseline specifications is the contemporaneous endogeneity of some macroeconomic controls, including public debt, fiscal balance, GDP growth, and the exchange rate. These variables may respond simultaneously to unobserved shocks affecting the cost of sovereign debt, giving rise to reverse causality or simultaneity bias. To address this concern, we estimate additional specifications in which the contemporaneous values of potentially endogenous controls, in our baseline models, are replaced by their lagged counterparts. The identifying assumption underlying this approach is that past realizations of public debt, fiscal balance, GDP growth, and the exchange rate are predetermined with respect to current unobserved shocks, conditional on including both country and time fixed effects, as well as the full set of explanatory variables. This strategy relaxes the assumption of contemporaneous exogeneity by focusing on variation that temporally precedes the realization of current disturbances. While lagged macroeconomic variables are not assumed to be strictly exogenous, their use substantially reduces concerns related to simultaneity and short-run feedback effects.
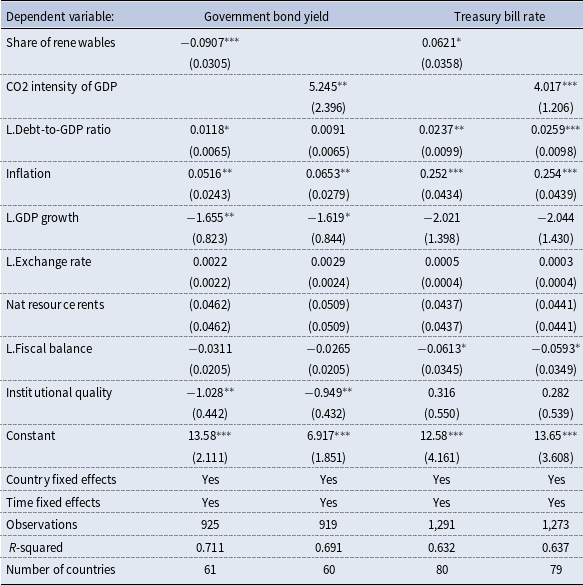
Tables 7 and 8 report estimation results using one-period lagged values of potentially endogenous variables. The results remain largely unchanged. In particular, the coefficients of interest are stable in terms of sign, magnitude, and statistical significance relative to the baseline estimates, with overlapping confidence intervals. Most control variables also display similar estimates. The only exceptions are fiscal balance and the exchange rate, whose coefficients lose statistical significance while retaining the same sign and comparable magnitudes. While the loss of statistical significance for fiscal balance and the exchange rate suggests some sensitivity to the timing of these controls, the stability of signs and magnitudes, together with the robustness of the coefficients of interest, supports the validity of our main conclusions.
Estimation results of sovereign debt cost drivers and impacts of natural resources with lagged explanatory variables

Note: Standard errors in parentheses. ***, ** and * refer respectively to the significance of estimated parameters at the 1%, 5% and 10% significance levels. The notation ln denotes the logarithmic transformation of the variable, while L. refers to the lagged value of the variable.
Estimation results of sovereign debt cost drivers and impacts of transition risks using lagged explanatory variables

Note: Standard errors in parentheses. ***, ** and * refer respectively to the significance of estimated parameters at the 1%, 5% and 10% significance levels. The notation ln denotes the logarithmic transformation of the variable, while L. refers to the lagged value of the variable. Transition risks are proxied alternately by the share of renewables in total energy consumption and CO2 intensity of GDP.
6. Conclusion
The objective of this article is to assess the impact of low-carbon transition risks on sovereign debt costs. We analyze the effects of CO2 emissions and fossil resource abundance on public debt cost through financial markets and investigate whether these markets impose a risk premium on the most exposed countries. If financial markets account for these risks by imposing a risk premium, this could incentivize countries to mitigate their exposure. These countries may send signals by implementing stricter environmental policies, investing in adaptation and mitigation strategies, ratifying environmental treaties, diversifying their energy mix, and curbing fossil fuel combustion.
Our results reveal some ambiguity in the relationship between fossil resources and the cost of public debt. Specifically, our main findings indicate that fossil-rich countries borrow at more favorable interest rates. In contrast, countries with higher CO2 emissions face higher interest rates on their sovereign debt. This last point is further supported by two additional findings: (i) a significant share of renewable energy in a country’s total energy consumption lowers its borrowing costs, and (ii) countries with a high carbon footprint relative to GDP pay higher interest rates on public debt. Financial markets thus reward fossil resource abundance while penalizing their use.
Ultimately, the ambiguity of our results makes sense: financial markets continue to perceive fossil fuel reserves as long-term, creditworthy assets while pointing out the vulnerability of countries that are slow to transition toward a low-carbon economy. Specifically, there is a financial incentive for countries to continue exploring potential fossil fuel reserves but not to extract or exploit them for CO2-emitting energy production. Our conclusions raise the question of the future of fossil resources, which financial markets continue to value. This could suggest that financial market actors are anticipating alternative uses for fossil resources and the emergence, in the near future, of low-emission technologies for refining and burning fossil resources enabled by innovation and R&D. Among the key priorities of the fossil energy industry are accelerating methane emission reductions associated with fossil fuel production and the development of carbon capture and storage (CCS) infrastructure.
A promising avenue for future research would be to further investigate threshold effects related to resource abundance and/or economic development by grouping countries based on their level of fossil reserves or GDP per capita. A less developed country historically rich in resources is more likely to be dependent on them or to suffer from a carbon curse or a resource curse, which could increase transition risks and, consequently, the cost of borrowing.
From a policy perspective, two key recommendations emerge. First, in the current context of rising external debt, the additional borrowing cost further weakens public finances. In the event of an economic recession, countries may be forced to take on more debt or drastically cut public spending, exacerbating the economic downturn. As a result, countries become increasingly vulnerable, and the most fragile and indebted ones may default, triggering a sovereign debt crisis. Faced with this risk of excessive debt, which could be exacerbated by the effects of climate change, investors may require higher risk premiums. This underscores the need for immediate policy responses at the international level. Potential measures include debt relief for the most vulnerable countries and the creation of a compensation fund for the least developed nations, which have historically contributed little to greenhouse gas accumulation. Second, regarding sovereign bonds, governments should better assess and disclose their climate and transition risks. Otherwise, the mispricing of risks could lead to systemic risk and financial instability. For this reason, it seems important that governments systematically evaluate their exposure to these risks and transparently communicate this information to economic stakeholders. To date, only Ghana has fully incorporated such assessments when borrowing to address the COVID-19 crisis (Dibley et al. (Reference Dibley, Wetzer and Hepburn2021)). Otherwise, failure to comply with risk assessment and transparency obligations, continued investment in polluting assets, or insufficient adaptation to future risks would increase countries’ exposure to climate-related financial risks. A shift in investors’ perceptions of climate risk would then translate into higher bond yields, further weakening the country’s financial position.
Acknowledgements
We are grateful to participants at the 45th IAEE Conference (Istanbul), the 10th FAERE Conference (Montpellier), the Economics of Climate Change and Environmental Policy Conference (Orléans), the 4th Annual Central Bank Conference on Development Economics in the Middle East and North Africa - The World Bank, as well as to seminar participants at EDEHN, University of Le Havre, GAEL, University of Grenoble Alpes, and the Centre for Contemporary Australasian Business and Economics Studies (CCABES), University of Wollongong, for valuable comments and discussions. We also thank two anonymous reviewers for their constructive and insightful feedback. All remaining errors are our own.


 Open access