


Introduction
Alzheimer’s disease (AD) is a neurodegenerative disease with a complex etiology.Reference Villa and Stoccoro 1 The prevalence of AD is strongly associated with age, with the majority of cases typically occurring in individuals over the age of 65.Reference Angelopoulou, Paudel, Papageorgiou and Piperi 2 , Reference Liu, Liu, Kanekiyo, Xu and Bu 3 The clinical features of AD initially manifest as memory deficits and cognitive decline, which eventually affect other functional domains including language, behavior, visuospatial orientation, sleep, and neuropsychological performance, resulting in a growing public health issue with a significant societal burden.Reference Wong 4 As human life expectancy increases, the global prevalence of AD is expected to increase dramatically in the coming decades. By 2050, it is predicted that approximately 1 in 85 people worldwide will be affected by AD.Reference Brookmeyer, Johnson, Ziegler-Graham and Arrighi 5 The main causes of AD are genetic factors and pathological changes in the brain.Reference Hampel, Hardy and Blennow 6 Previous studies have shown that various pathological changes occur years or decades before cognitive decline, including gene expression alterations, age-related changes in the default mode networks, and, most notably, abnormal changes in brain structures and morphologies that can be observed at the stage of mild cognitive impairment (MCI).Reference Sperling, Mormino and Johnson 7 , Reference Gaser, Franke, Klöppel, Koutsouleris and Sauer 8
Early detection and quantification of aberrant alterations in the brain play a crucial role in clinical settings for the prospective identification and subsequent treatment of individuals at risk for cognitive decline and AD.Reference Gaser, Franke, Klöppel, Koutsouleris and Sauer 8 Previous studies have shown that white matter lesions can be used to identify patients at high risk for Alzheimer-type dementia in individuals with MCI.Reference Ten Kate, Barkhof and Boccardi 9 A longitudinal study has suggested that the presence and progression of white matter hyperintensities negatively impact general intelligence, attention, and executive function in non-demented older adults.Reference Giannakopoulos, Montandon and Herrmann 10 Recent research studies have demonstrated that patterns of brain atrophy in AD patients are similar to the patterns of typical age-related atrophy observed in healthy subjects.Reference Cole and Franke 11 , Reference Habes, Pomponio and Shou 12 Furthermore, cognitive decline has recently been found to accelerate gradually years before the patient is diagnosed with AD and to correlate with the rate of atrophy in specific brain regions.Reference Wang, Ren and Shi 13 The geroscience hypothesis proposes that aging is the result of degeneration of multiple organs and that aging has been identified as a major driver of AD progression. In the case of brain degeneration, accelerated aging and the associated cognitive decline have a profound impact on disability and loss of independence in older adults.Reference Wang, Ren and Shi 13 Therefore, detecting brain aging is crucial for the study of AD. In recent years, significant progress has been made in the investigation of biomarkers for the evaluation of brain aging in AD.Reference Erkkinen, Kim and Geschwind 14
Brain age gap estimation (BrainAGE) is a recently proposed framework that predicts age using neuroimage features (such as magnetic resonance imaging [MRI]) and reflects the degree of brain aging in turn.Reference Vidal-Pineiro, Wang and Krogsrud 15 BrainAGE is also capable of predicting the individual progression of MCI, even in cognitively normal states, to AD based on pathological brain aging patterns.Reference Gaser, Franke, Klöppel, Koutsouleris and Sauer 8 To determine individual brain development and aging trajectories, as well as the risk of cognitive dysfunction and age-related brain degeneration, BrainAGE has been widely used in neuroimaging and neuroscience research studies to provide personalized brain biomarkers by evaluating deviations from preestablished reference curves or automatically distinguishing patients with brain diseases from the healthy control (HC) group.Reference Franke and Gaser 16 If the estimated age is higher than the chronological age, a positive BrainAGE score is given, indicating accelerated atrophy and considered a risk factor for conversion to AD.Reference Gaser, Franke, Klöppel, Koutsouleris and Sauer 8 Each additional year in the BrainAGE score was associated with a 10% greater risk of developing AD.Reference Gaser, Franke, Klöppel, Koutsouleris and Sauer 8 BrainAGE has shown promising results in providing early signs of pathological brain aging before clinical symptoms of AD and even predicting future AD.Reference Wang, Ren and Shi 13 However, most of the existing studies have focused on MCI patients or functional brain aging in AD.Reference Gaser, Franke, Klöppel, Koutsouleris and Sauer 8 , Reference Gonneaud, Baria and Pichet Binette 17 The neuroanatomical aging characteristics of AD are not well understood. Therefore, in this study, a BrainAGE model based on structural MRI imaging features was used to study individual differences in brain aging in AD, aiming to explore the relationship between AD and neuroanatomical aging.
Methods
Study cohort
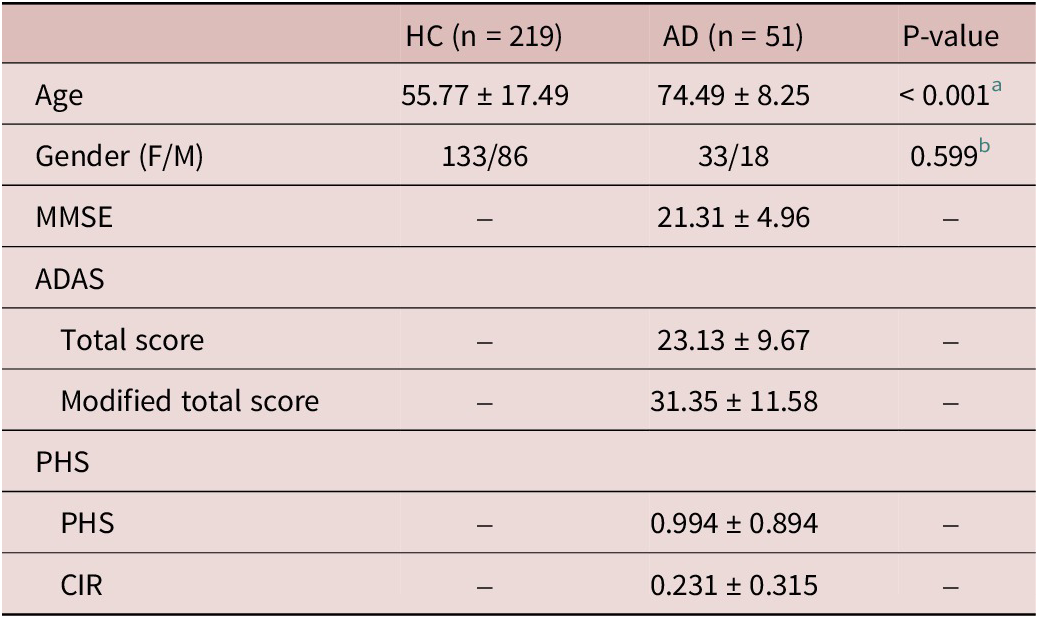
We collected structural MRI and phenotype data both from ourselves and from the Alzheimer’s Disease Neuroimaging Initiative (ADNI) database (https://adni.loni.usc.edu/) (see Supplementary Methods 1 for a detailed description of our own data and the ADNI dataset). We excluded subjects who were left-handed or ambidextrous, as well as those without handedness information.Reference Ryan, Kreiner and Paolo 18 Two experienced radiologists then performed quality control assessments. After quality control, 219 HCs and 51 AD patients from three sites remained. The demographic and clinical profiles for the included subjects are presented in Table 1.
Demographic and clinical information of the enrolled subjects

Note: Site 1 consists of 140 HCs (84 female subjects and 56 male subjects), at the age of 44.59 ± 11.01 years (mean ± standard deviation). Site 2 consists of 80 subjects (47 HCs and 33 AD patients). Site 3 consists of 50 subjects (32 HCs and 18 AD patients).
Abbreviation: HC, healthy control; AD, Alzheimer’s disease; F, female; M, male; ADAS, Alzheimer’s Disease Assessment Scale; MMSE, Mini-Mental State Exam; PHS, polygenic hazard score; CIR, cumulative incidence rate.
a Differences in age between HC and AD groups are assessed using an independent t-test with T = −7.444.
b Differences in gender between HC and AD groups are assessed using the chi-square test with χ2 = 0.276.
Image processing
The Computational Anatomy Toolbox 12 (CAT12) was used for structural MRI image processing. The main steps were as follows: (1) normalization of T1 structural MRI images into the standard template provided by the Montreal Neurological Institute (MNI); (2) segmentation of the normalized T1 images into gray matter, white matter, and cerebrospinal fluid (CSF); (3) conversion of voxel values of tissue density into volume and calculation of the total intracranial volume (TIV); and (4) smoothing with a 6-mm full width at half-maximum (FWHM) isotropic Gaussian kernel.
BrainAGE model
In this study, we selected two types of anatomical features including gray matter and white matter volumes to build our BrainAGE model. After structural image processing, regional gray matter and white matter volumes were extracted for each subject according to the anatomical automatic labeling (AAL) atlas. Gray matter and white matter volume features were residualized on TIV, gender, and site-specific factors.
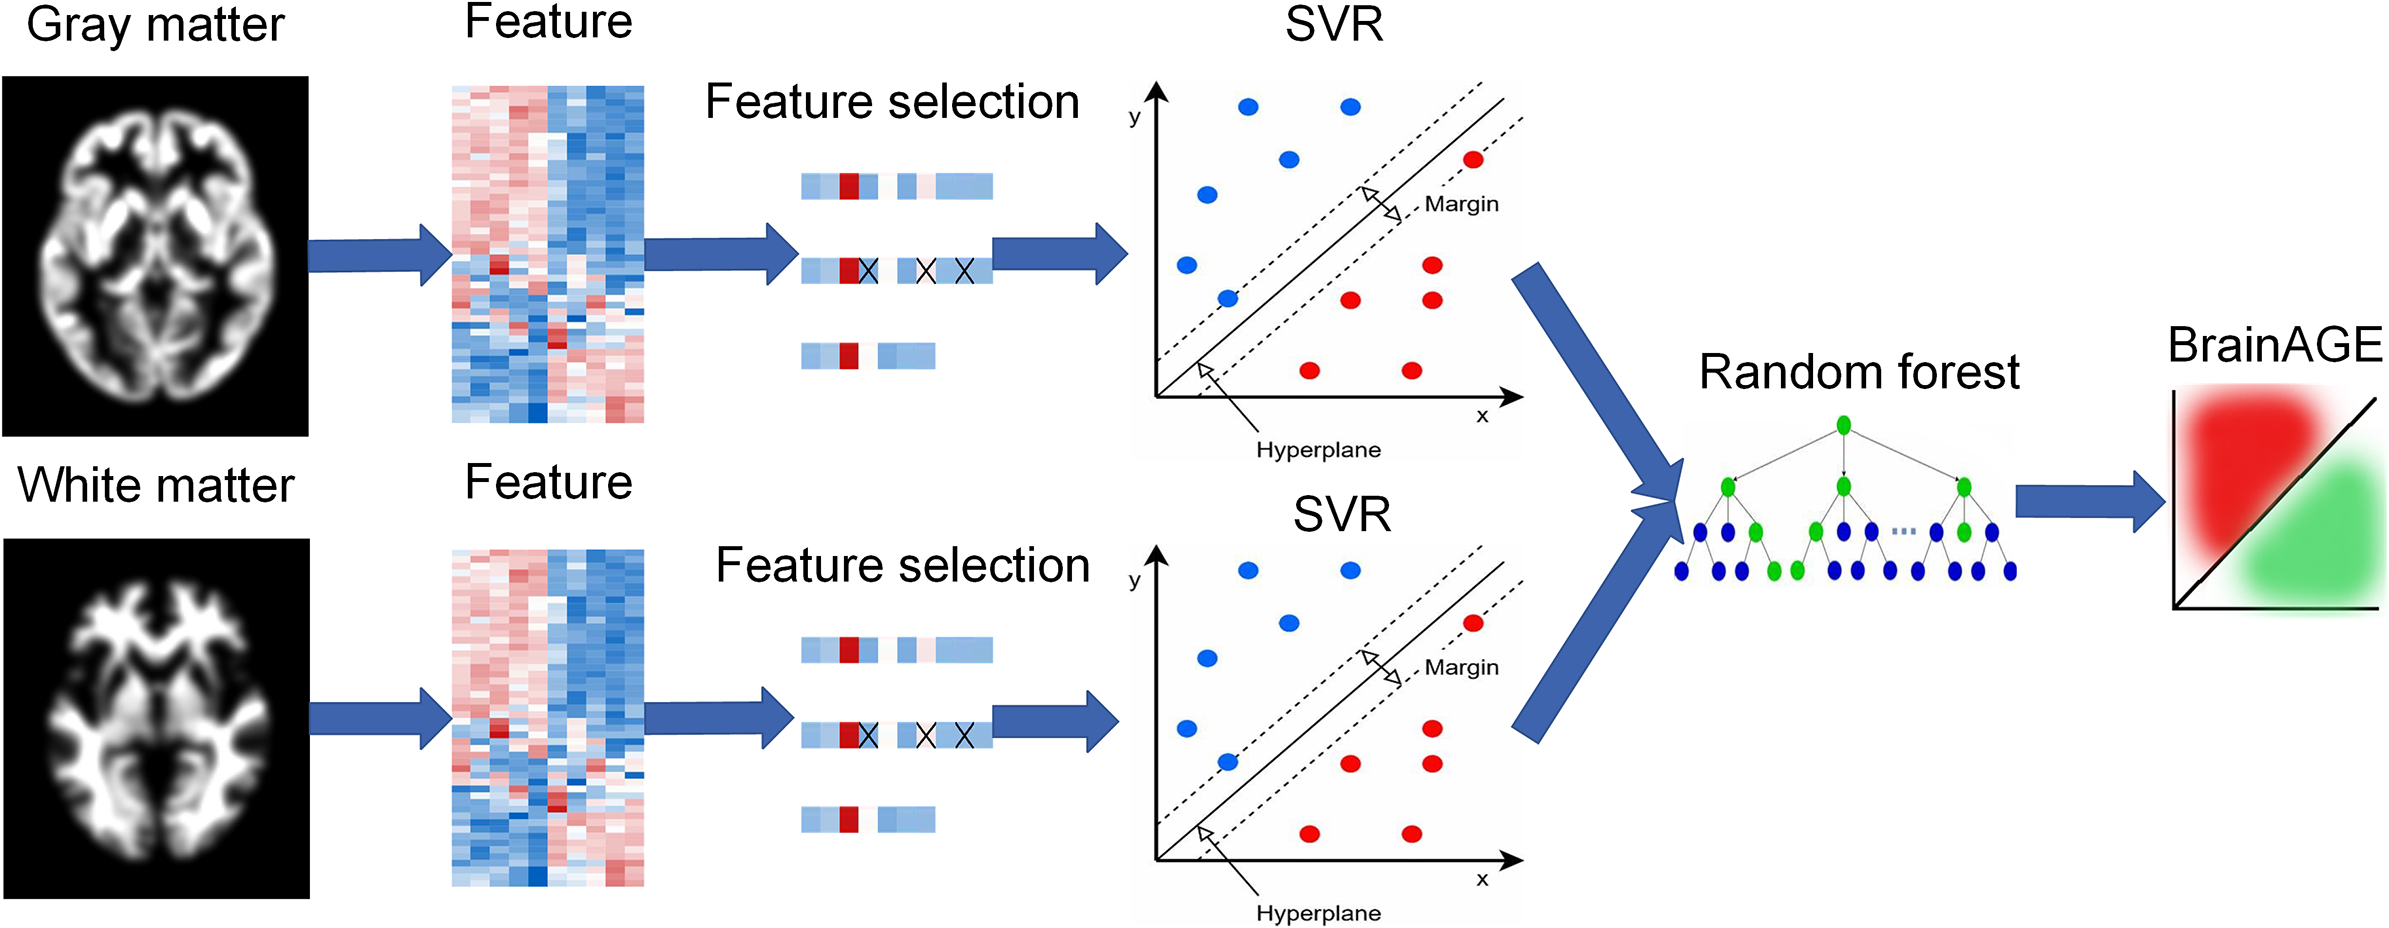
To integrate gray matter and white matter features, a stacking model with two levels was constructed (Figure 1). In the first level, support vector regression (SVR) with a linear kernel was used to establish a single BrainAGE model based separately on gray matter or white matter features. It is worth mentioning that SVR with a linear kernel was chosen based on the performance comparison with six other commonly used models (see Supplementary Methods 2 and Supplementary Table S1). Feature selection was performed separately on gray matter or white matter using the sequential backward elimination algorithm in the control group. After feature selection, the training set (control group) and test set (AD group) kept the same features. The outputs of the first-level models were treated as the input of the second-level model. In the second level, we used a random forest as the regression model to generate the final age prediction based on the first-level outputs. Parameter tuning was also performed for the random forest in the training set via a coarse grid search method. Age-dependency bias was removed as described in a previous study.Reference Rauseo, Salih and Raisi-Estabragh 19 The whole model was trained on the 219 HCs using a leave-one-out cross-validation strategy and was tested on the AD patients.
BrainAGE model with a two-level stacking configuration.

Evaluation of neuroanatomical aging conditions in AD
The BrainAGE model, constructed based on the HCs, was employed to predict the ages of AD patients. The brain age gap, defined as the difference between predicted age and chronological age for each AD patient, was used as an index of deviation from typical brain aging. In addition, we employed the mean absolute error (MAE) of the BrainAGE model in the training set as a boundary to categorize different neuroanatomical conditions. Patients with a brain age gap larger than the MAE were identified as showing accelerated aging, while those with a brain age gap smaller than the −MAE were identified as showing decelerated aging. Patients with a brain age gap falling within the range of (−MAE, MAE) were classified as showing typical aging.
Voxel-wise volumetric analysis
To investigate whether AD patients with different neuroanatomical aging conditions exhibit differences in brain morphology, we performed voxel-wise volumetric analyses of gray matter and white matter volumes between AD subgroups and HCs. Specifically, voxel-wise group comparisons were carried out using the general linear model, with age, gender, site-specific effects, and TIV as nuisance covariates. Finally, the voxel-wise statistical significance values were corrected by false discovery rate (FDR) correction to control false positives.
Clinical analysis among the AD subgroups
To evaluate whether the AD subgroups with different neuroanatomical aging conditions and HCs differed in demographic information, an independent t-test was utilized on age, while the chi-square test was utilized on gender between different AD subgroups and HCs, respectively. In addition, one-way analysis of variance (ANOVA) was used to assess whether AD subgroups with different neuroanatomical aging conditions differed in Mini-Mental State Exam (MMSE) scores, Alzheimer’s Disease Assessment Scale (ADAS) scores, and polygenic hazard score (PHS), with least significant difference (LSD) method for post-hoc multiple comparisons.
Results
Neuroanatomical aging conditions of HCs and AD patients
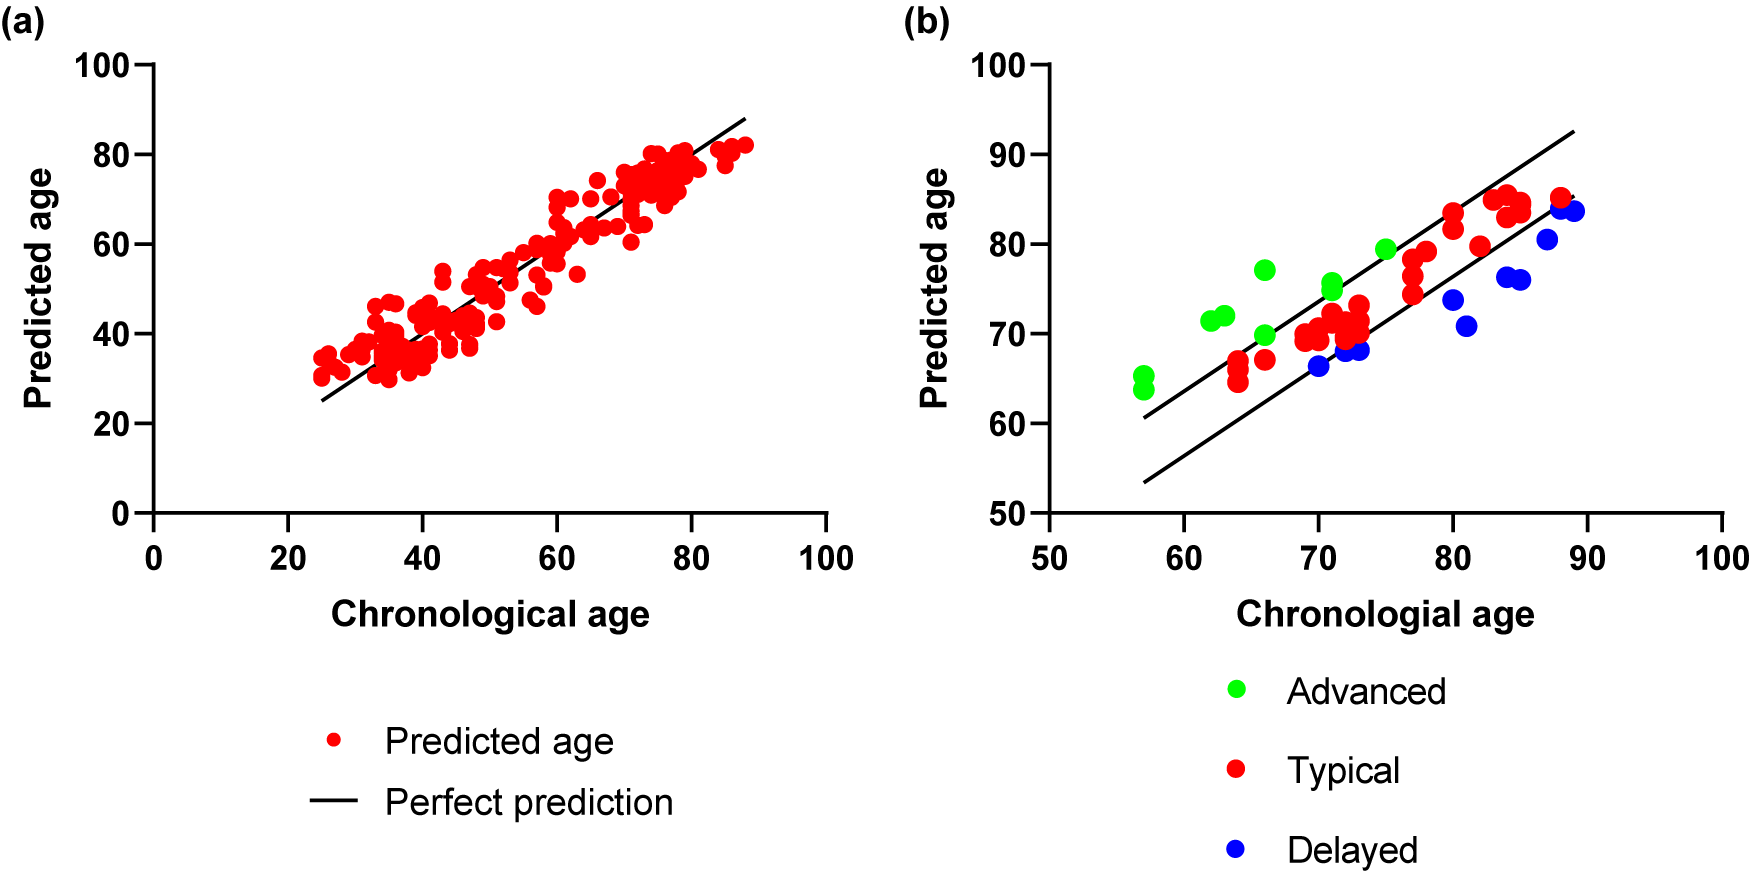
The stacking model, which combines gray and white matter volumes, achieved high leave-one-out cross-validation accuracy in predicting age for HCs (MAE = 3.61 and correlation coefficient r = 0.97 between chronological age and predicted age) (Figure 2a). The model was then applied to AD patients, and accurate results were obtained (MAE = 4.39 and correlation coefficient r = 0.84 between chronological age and predicted age) (Figure 2b). From Figure 2b, it can be seen that both HCs and AD patients could be categorized into three subgroups based on the MAE of the model (MAE = 3.61), including advanced, typical, and delayed aging conditions. The BrainAGE prediction results of the SVR based on the single-modal gray matter or white matter volume for HCs and AD patients are shown in Supplementary Figures S1 and S2.
Brain age prediction results via the two-level stacking model. Scatter plots indicate the association between chronological age and predicted age in (a) HCs and (b) AD groups.

Voxel-wise volumetric analysis
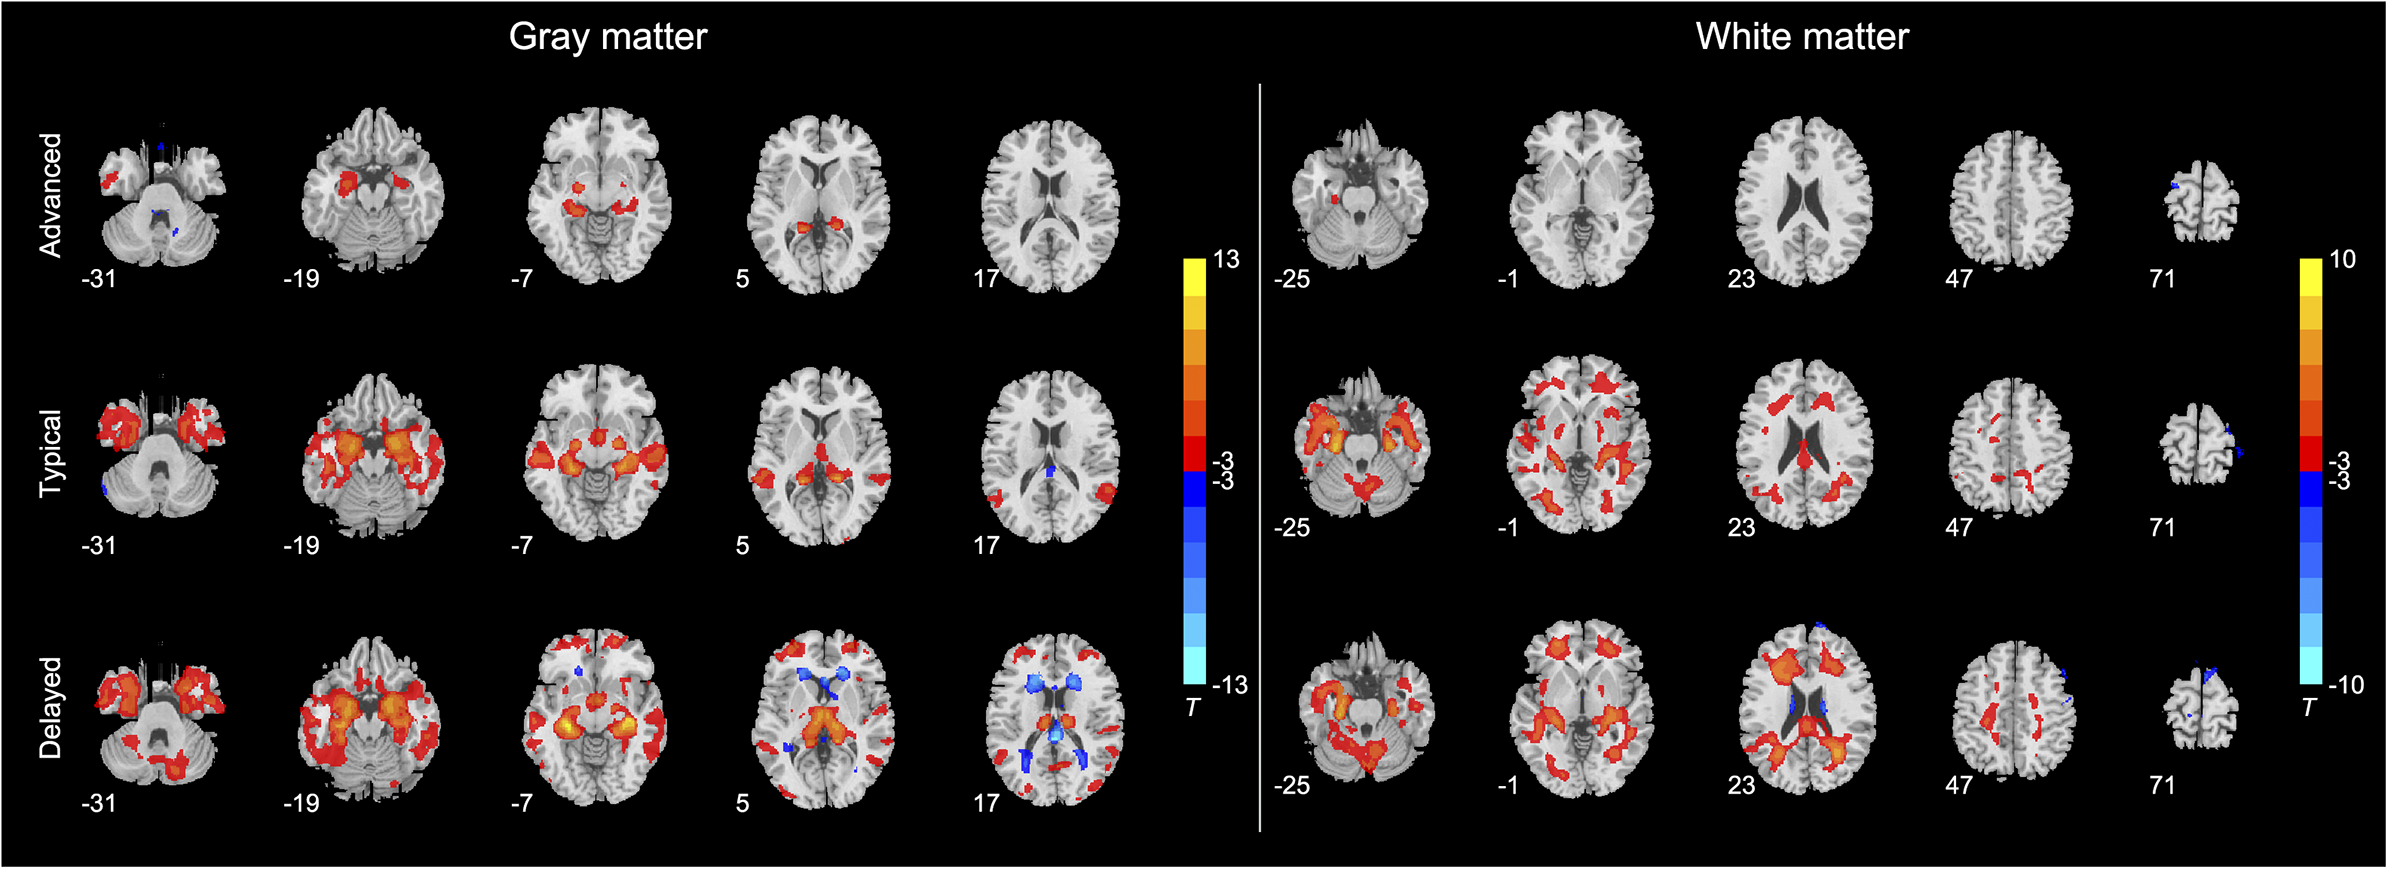
In voxel-wise volumetric analysis, we evaluated differences between different AD subgroups and HCs. Figure 3 illustrates differences between HCs and the three AD subgroups. In terms of gray matter volume, compared with HCs, the AD subgroup with advanced brain aging showed reduced gray matter volume in the inferior temporal gyrus, inferior parietal gyrus, and bilateral hippocampus and increased gray matter volume in the cerebellum anterior and posterior lobes (Supplementary Table S2). The AD subgroup with typical brain aging showed widespread reduced gray matter volume, mainly in the bilateral middle temporal gyrus, bilateral hippocampus, right occipital lobe, cingulate cingulum, right precentral gyrus, bilateral parietal gyrus, and left middle frontal gyrus. The AD subgroup with typical brain aging also demonstrated enlarged gray matter volume in the cerebellum and posterior cingulate cingulum (Supplementary Table S3). The AD subgroup with delayed brain aging also exhibited widespread gray matter volume reduction, including the bilateral middle frontal gyrus, left middle occipital gyrus, left middle cingulate cingulum, bilateral precentral gyrus, and left hippocampus. In addition, the AD subgroup with delayed brain aging exhibited enlarged gray matter volumes in the left superior temporal gyrus and bilateral frontal and occipital lobes (Supplementary Table S4).
The differences in multimodal MRI metrics, including (a) gray matter patterns and (b) white matter patterns between HCs and three AD subgroups with different brain aging conditions. The differences are evaluated by the two-sample t-test with FDR correction at p < 0.05.

In terms of white matter volume, the AD subgroup with advanced brain aging showed reduced white matter volume in the left parahippocampal gyrus and increased white matter volume in the left superior frontal gyrus (Supplementary Table S5). The AD subgroup with typical brain aging experienced widespread white matter volume reduction in the cerebellum, bilateral parahippocampal gyrus, bilateral temporal gyrus, occipital lobe, left hippocampus, left precentral gyrus, left supramarginal gyrus, right middle frontal gyrus, and left medial superior frontal gyrus. The AD subgroup with typical brain aging also experienced increased white matter volume in the right postcentral gyrus and left precentral gyrus (Supplementary Table S6). Compared with HCs, the AD subgroup with the delayed brain aging exhibited decreased white matter volume in the right hippocampus, right pallidum, and widespread enlarged white matter volume mainly in the bilateral thalamus, bilateral temporal lobe, left calcarine, and bilateral frontal lobe (Supplementary Table S7).
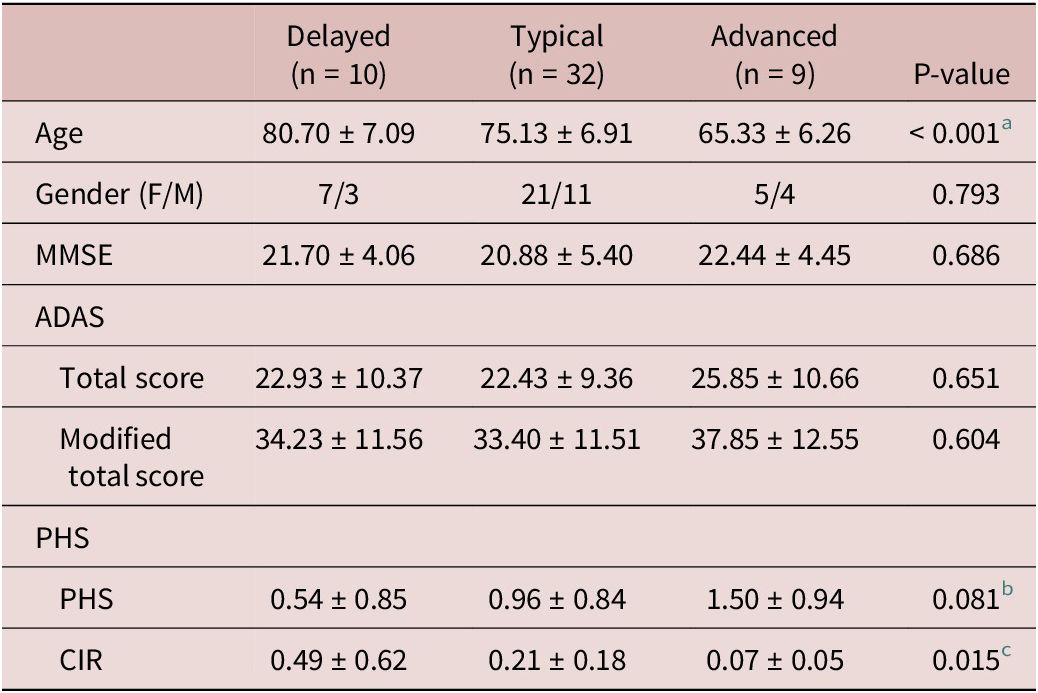
Demographic and clinical profiles across AD subgroups
There were significant differences in age (F = 12.313, p < 0.001) and cumulative incidence rate (CIR) (F = 4.662, p = 0.015) among the three AD subgroups (Table 2). In addition, the three AD subgroups slightly differed in PHS (F = 2.667, p = 0.081). Specifically, the AD subgroup with advanced aging condition was younger in age than the subgroup with typical aging condition (p < 0.001) and delayed aging condition (p < 0.001). The AD subgroup with delayed brain aging condition was older than the AD subgroup with typical aging (p = 0.029). There were slight differences between AD subgroups with delayed and advanced brain aging conditions in terms of PHS (p = 0.027) and CIR (p = 0.019).
Demographic and clinical profiles across AD subgroups

Abbreviation: AD, Alzheimer’s disease; F, female; M, male; ADAS, Alzheimer’s Disease Assessment Scale; MMSE, Mini-Mental State Exam; PHS, polygenic hazard score; CIR, cumulative incidence rate.
a Delayed vs. typical, p = 0.029; delayed vs. advanced, p < 0.001; typical vs. advanced, p < 0.001.
b Delayed vs. advanced, p = 0.027.
c Delayed vs. typical, p = 0.019; delayed vs. advanced, p = 0.005; typical vs. advanced, p = 0.231.
Discussion
AD is widely recognized as a neurodegenerative condition, with aging as a major driving force for the progression of AD.Reference Wang, Ren and Shi 13 The investigation of brain aging on AD is critical for early detection as well as better understanding the neuropathology of the disease. To date, several studies have aimed to reveal brain aging patterns of MCI and AD.Reference Gaser, Franke, Klöppel, Koutsouleris and Sauer 8 , Reference Giannakopoulos, Montandon and Herrmann 10 -Reference Habes, Pomponio and Shou 12 , Reference Gonneaud, Baria and Pichet Binette 17 However, most of the existing studies have focused on MCI patients or functional brain aging in AD. The neuroanatomical aging characteristics of AD are not well understood. In addition, the effect of neuroanatomical aging variations on clinical manifestations of AD is not known. In this study, machine learning algorithms combined with structural MRI features provide a promising method for assessing brain aging conditions in AD. Three subgroups of AD with distinct brain aging conditions were revealed. Furthermore, the subgroups differed in voxel-wise gray matter and white matter volumes, and clinical profiles, which contribute not only to understanding the neurobiology of AD but also to the precise evaluation and optimized treatment of AD.
AD is a form of pathological brain aging that is autosomal dominant.Reference Wang, Ren and Shi 13 However, the vast majority of patients have sporadic cases and not all are genetically related, except for some populations that have a combination of some carrier genetic abnormalities involved in the development.Reference Wang, Ren and Shi 13 It is widely accepted that AD is caused by amyloid-β (Aβ) overproduction, and studies of AD have shown that biomarkers in mutation carriers begin to change as early as 25 years prior to symptom onset, followed by accumulation of fibrillar Aβ deposits measured by positron emission tomography (PET) imaging, along with changes in CSF tau concentrations and brain atrophy.Reference Sperling, Mormino and Johnson 7 Previous neuropathological studies have shown that tau protein pathology is more strongly correlated with alterations of the brain and cognitive symptoms in AD.Reference Arriagada, Growdon, Hedley-Whyte and Hyman 20 , Reference Gómez-Isla, Hollister and West 21 Recent reports from AD have suggested that the accumulation of Aβ may already be evident in the first 20 years of the dementia stage and that there is already substantial neuronal loss by the MCI stage.Reference Sperling, Jack and Aisen 22 , Reference Desikan, Fischl and Cabral 23 Indeed, this long, irreversible progression of neurodegeneration is closely linked to symptomatic disease stages.Reference Sperling, Jack and Aisen 22 Tau PET studies have indicated that MCI and AD patients resulting from mild dementia with extensive Aβ deposition and tau PET binding are evident in the neocortex, particularly in the inferior temporal and medial parietal lobes.Reference Desikan, Fischl and Cabral 23 It is hypothesized that Aβ accelerates the spread of tau within and outside the medial temporal lobe, disrupting the function, starting the neurodegeneration of the distributed brain network, and leading to the decline of cognitive ability.Reference Sperling, Mormino and Johnson 7 Cognitive decline was recently found to progressively accelerate years before being diagnosed with AD and to be correlated with the atrophy rates in specified brain regions.Reference Wang, Ren and Shi 13 , Reference Desikan, Fischl and Cabral 23 MRI-detected atrophy was found to retain the closest relationship with cognitive decline.Reference Jack, Knopman and Jagust 24 -Reference Davatzikos, Bhatt, Shaw, Batmanghelich and Trojanowski 26 Meanwhile, functional brain changes detected through resting-state functional MRI are highly synchronized with PET measurements of Aβ and tau, becoming evident years prior to the brain morphological alterations observable through structural MRI.Reference Franke, Ziegler, Klöppel and Gaser 27 , Reference Franke, Luders, May, Wilke and Gaser 28 This combination of functional and biological changes appears to persist throughout the progression of AD from preclinical to dementia stages.Reference Frisoni, Fox, Jack, Scheltens and Thompson 29
Subsequent changes in AD include decreased glucose metabolism, situational memory loss, and macroscopic cognitive decline.Reference Villemagne, Burnham and Bourgeat 30 In addition, AD dementia symptoms will follow massive, seemingly irreversible brain changes.Reference Gonneaud, Baria and Pichet Binette 17 AD-related dementia is characterized by a progressive cognitive decline.Reference McKhann, Knopman and Chertkow 31 Recently, there is growing evidence that the age-sensitive nervous system is also susceptible to AD and other neurodegenerative diseases.Reference Jagust 32 Several studies have shown that AD does affect brain aging. For instance, Fan et al. demonstrated that pathological atrophy in AD is an accelerated aging process.Reference Fan, Batmanghelich, Clark and Davatzikos 33 Therefore, the biological progression of AD is characterized by a pattern of accelerated brain aging that can be detected before the onset of symptoms.Reference Gonneaud, Baria and Pichet Binette 17 However, it remains unclear what type of brain aging is caused by AD and what clinical differences result from different aging trajectories. To quantify age-related changes in pathological structures of the brain, we employed the BrainAGE model to evaluate the brain aging condition.
Brain age represents the predicted age obtained from machine learning models based on neuroimaging data, while the BrainAGE is the difference between predicted age and chronological age, serving as a valid indicator of deviation from typical brain aging.Reference Le, Kuplicki and McKinney 34 A systematic perspective revealed that the association between BrainAGE and cognitive function can be traced back to childhood.Reference Wang, Ren and Shi 13 , Reference McKhann, Knopman and Chertkow 31 Multiple biological processes contribute to changes in BrainAGE. For instance, apparent genetic factors, smoking, and environmental influences are likely to accelerate brain aging.Reference Franke and Gaser 16 Furthermore, numerous neurological and psychiatric diseases can significantly alter BrainAGE, such as AD, multiple sclerosis, and schizophrenia.Reference Wang, Ren and Shi 13 Notably, BrainAGE can depict the aging pattern of AD, potentially making it more sensitive than cognitive ratings and CSF markers in detecting the transition from MCI to AD.Reference Gaser, Franke, Klöppel, Koutsouleris and Sauer 8 Therefore, in this study, we opted to utilize BrainAGE as a pertinent biomarker of AD, assessing its impact on deviations from the normal aging trajectory and subsequently matching the corresponding clinical symptoms with diverse brain aging patterns.
Previous studies have demonstrated that brain changes in the progression of AD can be detected two to three decades prior to the onset of symptoms.Reference Ryan, Kreiner and Paolo 18 , Reference Bateman, Xiong and Benzinger 35 Generally, this process starts with the accumulation of brain Aβ, followed by the deposition of hyperphosphorylated tau, brain metabolic changes, and several other pieces of evidence of neurodegeneration that precede cognitive and functional manifestations.Reference Bateman, Xiong and Benzinger 35 , Reference Jack, Knopman and Jagust 36 A preliminary BrainAGE study revealed higher brain age scores in AD patients, suggesting accelerated brain aging.Reference Wang, Ren and Shi 13 Gonneaud et al. confirmed that AD pathology accelerates marked functional brain aging.Reference Gonneaud, Baria and Pichet Binette 17 They found evidence of accelerated brain function in asymptomatic carriers of AD mutations. Importantly, this finding was more evident in individuals who had accumulated a large number of pathologies. Furthermore, asymptomatic individuals close to the expected age of symptom onset tended to exhibit accelerated brain aging. Individuals with symptomatic AD exhibited accelerated brain aging compared to asymptomatic individuals at high risk. They also found that AD presymptomatic mutation carriers had a functional BrainAGE approximately 10 years beyond their chronic age, suggesting that the presymptomatic phase of AD is accompanied by accelerated brain aging.Reference Gonneaud, Baria and Pichet Binette 17 A comparison between asymptomatic mutation carriers and noncarriers showed that asymptomatic carriers exhibit reduced functional connectivity in the default mode network.Reference Chhatwal, Schultz and Johnson 37 In addition, asymptomatic individuals with strong genetic determinants exhibited a distinct pattern of functional brain changes associated with accelerated brain aging.Reference Gonneaud, Baria and Pichet Binette 17 Therefore, it is well established that AD causes brain aging, but the exact forms of brain aging caused and the clinical differences resulting from different forms of brain aging remain a subject of interest.
In this study, we utilized the BrainAGE model to identify three subgroups of AD with advanced, typical, and delayed brain aging. Previous studies have also reported different brain aging conditions of AD using machine learning and MRI, including functional MRI and structural MRI,Reference Wang, Ren and Shi 13 , Reference Gonneaud, Baria and Pichet Binette 17 which align with our current findings. In addition, previous studies have emphasized that the progression of brain aging is influenced by a complex interplay of genetic and environmental factors,Reference Chhatwal, Schultz and Johnson 37 and genetic determinants of AD can accelerate brain aging.Reference Rauseo, Salih and Raisi-Estabragh 19 In line with previous studies, our findings revealed a higher genetic score in the AD subgroup with advanced aging, suggesting a higher possibility of genetic variants in this subgroup.
The BrainAGE model has the advantage of assessing individual heterogeneity in Alzheimer’s patients, which is better than traditional group analysis methods. Traditional approaches often rely on averaging results across patients, potentially masking important differences in individual brain aging patterns.Reference Gaser, Franke, Klöppel, Koutsouleris and Sauer 8 , Reference Rauseo, Salih and Raisi-Estabragh 19 In contrast, the BrainAGE model uses machine learning techniques to provide a personalized assessment of brain aging for each patient, which allows for a more comprehensive understanding of the spectrum of brain aging phenotypes observed in AD, capturing factors that may influence disease progression and treatment response.Reference Rauseo, Salih and Raisi-Estabragh 19 By accounting for individual differences, the BrainAGE model can better inform clinical decision-making and patient management, enabling more targeted and personalized treatment strategies for AD.
Several limitations should be acknowledged. Firstly, only structural MRI data were used in this study, which only reflects neuroanatomical aging patterns of AD. Future studies should incorporate multimodal MRI images to evaluate brain aging patterns in multiple domains. Secondly, the sample size of this experiment was moderate, and we will collect more brain images for a more comprehensive investigation in the future. Furthermore, given that hypertension, hypercholesterolemia, and lack of access to health care are factors that can influence both brain structure and function, they may have a role in predicting brain aging patterns in AD patients. A lack of comparison with other techniques and failure to consider these factors in isolation from other known risk factors for AD may limit the generalizability of the BrainAGE framework. Therefore, in future research, we aim to collect AD patients with comprehensive clinical profiles.
Conclusion
In this study, a BrainAGE model was developed using structural brain images from healthy subjects across multiple sites. The model was then applied to structural brain images of AD patients to investigate the neuroanatomical aging patterns of the disease. Three subgroups of AD with advanced, typical, and delayed neuroanatomical aging conditions were identified. The three subgroups of AD patients demonstrated distinctive voxel-wise patterns of gray matter and white matter. In addition, age and CIR differed significantly across the subgroups of AD patients with different neuroanatomical aging conditions. In conclusion, the BrainAGE framework recognizes subtle deviations from age-related brain atrophy in the AD cohort by simulating normal brain aging patterns. This contributes to an early indication of pathological brain aging in advance of severe clinical symptoms. The BrainAGE model has shown promising results in the evaluation of AD brain aging conditions at the individual level.
Supplementary material
The supplementary material for this article can be found at http://doi.org/10.1017/S1092852925000148.
Author contribution
Lemin He conceptualized the study, designed the methodology, provided software, wrote the original manuscript, and prepared the draft; Guodong Sun and Guangyu Zhang curated the data; Fei Gao visualized the data, investigated the data, and provided resources; Xingwei An supervised the data; and Weizhao Lu wrote, reviewed, and edited the manuscript.
Financial support
This study has received funding by the Natural Science Foundation of Shandong Province (Grant number: ZR2022MH226) and Young Scholars Fund of Shandong First Medical University (Grant number: 202201-020).
Disclosures
The researcher claims no conflicts of interest.
Ethics approval
Ethics approval for ADNI: All contributions were based on studies approved by the local Institutional Review Boards from ADNI. Our own dataset, the dataset, and the study were approved by the Institutional Review Board of Shandong First Medical University.
Informed consent
All datasets are anonymous, with no protected health information included. Informed consent was obtained from all participants upon enrollment.


 Open access