


1 Introduction
The Human Connectome Project (HCP) (Van Essen et al., Reference Van Essen, Smith, Barch, Behrens, Yacoub, Ugurbil and Consortium.2013) is a landmark study designed to systematically map the macroscale connections of the human brain. These macroscale connections refer to the structural pathways formed by bundles of nerve fibers, as well as the functional interactions between different brain regions. From a connectomic perspective, the HCP depicts brain connectivity by integrating structural and functional imaging data to reveal how distinct regions are interconnected. Our work analyzes various data blocks present in the HCP Young Adult (HCP-YA) study in a more comprehensive manner than previously achieved. Specifically, this analysis contains five different data blocks, including brain structural connectivity (SC) and functional connectivity (FC), which are collected and estimated through diffusion and functional magnetic resonance imaging (MRI). Additional information on subjects’ cognitive performance, substance use habits, and genetic composition is also analyzed in this multifaceted data integration case study. The HCP-YA dataset also presents the distinct merit of including first-order family relatives (parents and their offspring and/or siblings). Splitting the data along these first-order relations provides natural discovery and validation data sets and allows us to corroborate our findings as more than mere spurious associations.
Many multi-block analyses of the HCP-YA data set have been informative in pairwise settings. For example, Sanwar et al. (Reference Sanwar, Tian, Yeo, Ramamohanarao and Zalesky2021) aims to predict FC given SC using a higher-order dependence measure. Zhang et al. (Reference Zhang, Wang and Zhu2022) uses multi-layer graph convolutional networks (GCNs) within a generative adversarial network (GAN) to predict SC from FC. Finn et al. (Reference Finn, Scheinost, Rosenberg, Chun, Papademetris and Constable2015) predicts cognition using FC, and Arnatkeviciute et al. (Reference Arnatkeviciute, Fulcher, Oldham, Tiego, Paquola, Gerring, Aquino, Hawi, Johnson, Ball, Klein, Deco, Franke, Bellgrove and Fornito2021) links the human connectome to genetic heritability. While these methods yield useful insights, they are restricted to consideration of only two modalities at a time—a fact that limits our understanding of these likely interrelated data.
The literature has, at times, ventured beyond this pairwise paradigm, as in the instance of Smith et al. (Reference Smith, Nichols, Vidaurre, Winkler, Behrens, Glasser, Ugurbil, Barch, Van Essen and Miller2015) investigating covariation between brain connectivity, demographic information (such as age, sex, and income), and behavioral traits (such as rule-breaking behavior). Moreover, Lerman-Sinkoff et al. (Reference Lerman-Sinkoff, Sui, Rachakonda, Kandala, Calhoun and Barch2017) connects multiple types of brain connectivity with cognitive performance via canonical correlation analysis (CCA) (Hotelling, Reference Hotelling1936). Likewise, Murden et al. (Reference Murden, Zhang, Guo and Risk2022) integrates FC, SC, and fluid intelligence. However, even in these more expansive analyses, consideration of either substance-use habits or genetic predispositions is absent. In this work, we extensively analyze the interrelation of FC, SC, cognition, substance use, and genetics using a state-of-the-art integration technique named data integration via analysis of subspace (DIVAS) (Prothero et al., Reference Prothero, Jiang, Hannig, Tran-Dinh, Ackerman and Marron2024).
DIVAS uses a search through shared subspaces based on angle perturbation bounds to distinguish signal from noise and further differentiate shared from partially shared and individual variation. Accordingly, each data block included in the analysis is represented as a summation of low-rank matrices compsed of products of loadings and scores inherent to each signal subspace. It is worth noting that there are numerous methods, outside of DIVAS, available for this type of multi-block analysis. We will canvas them here before introducing the uniquely appealing aspects of DIVAS.
Simultaneous component analysis (SCA) (Kiers & ten Berge, Reference Kiers and ten Berge1994) aims to find common and distinctive components in disparate data matrices that are linked either through shared observations or shared variables. However, SCA often suffers from a mixing of common and distinctive components that are difficult to properly distinguish. To remedy this, DISCO-SCA (Schouteden et al., Reference Schouteden, Van Deun, Wilderjans and Van Mechelen2014) orthogonally rotates component scores toward a target structure. This target structure is carefully defined to better separate common and distinctive components. De Roover et al. (Reference De Roover, Ceulemans and Giordani2016) proposes OC-SCA which allows for common, distinctive, and partially common components. The OC-SCA low-rank approximation is similar in spirit to the transpose of the DIVAS low-rank approximation. However, DIVAS offers built-in inference as opposed to the AIC-based optimization of OC-SCA. Another difference is that datablocks in OC-SCA have common variables rather than observations. Hence, this method is not obviously applicable to the HCP-YA data which has common observations. Blockwise Simplimax (Timmerman et al., Reference Timmerman, Kiers and Ceulemans2016) also provides a rotation criterion, similar to DISCO-SCA. However, for Blockwise Simplimax, the aim of the rotation is to achieve simple block structure rather than identifying components as common or distinctive. Similarly, multiple factor (factorial) analysis (MFA) (Escofier & Pages, Reference Escofier and Pages1990) uses iterative principal component analysis (PCA) with normalization to arrive at common factor scores or commonalities. This method can also describe the proportion of variation explained by each variable by calculating the contribution from squared loadings. Finally, independent factor analysis (Attias, Reference Attias1999) is a maximum- likelihood based approach to this type of component or factor analysis. Distinctively though, it assumes non-Gaussiantiy of the factors to ensure the resulting likelihood function is rotationally variant in the factor space.
While each of these methods represent nuanced approaches to the multi-block analysis problem, DIVAS presents several advantages that makes it our preferred approach for analyzing the HCP-YA data. Firstly, DIVAS is able to distinguish between not only shared (common) and individual (distinctive) components but also partially shared components. This distinguishes DIVAS from earlier methods, such as joint and individual variation explained (JIVE) (Lock et al., Reference Lock, Hoadley, Marron and Nobel2013) and angle-based JIVE (AJIVE) (Feng et al., Reference Feng, Jiang, Hannig and Marron2018). For any data set, such as the HCP-YA, containing more than two data blocks, this capacity is especially attractive. Secondly, DIVAS is a subspace-based method. That is to say, the most important information contained in the DIVAS loadings and scores is the subspaces their columns span. This allows DIVAS to view rotational invariance as a boon rather than a deficiency while also distinguishing DIVAS from other methods, such as structural learning and integrative decomposition (SLIDE) (Gaynanova & Li, Reference Gaynanova and Li2019), that are capable of separating individual and partially shared information. Finally, as detailed in Sections 3.2 and 3.3, DIVAS is compatible with methods that establish both the significance of particular traits (as above) and proportion of variation explained by entire subspaces or data blocks. In total, for multiblock data with common observations, DIVAS offers a fuller account of partially shared subspaces, leverages rotational invariance, and provides inference at the variable, block, and subspace levels. Specifically, we apply DIVAS to find fully shared, partially shared, and fully individual subspaces among the five HCP-YA data blocks. We also proposed novel Jackstraw Significance Tests to identify statistically significant traits within DIVAS loadings. Collectively, this yields biologically interpretable results while also highlighting the type of statistical inference that pairing these two methods (DIVAS and Jackstraw) can produce.
The primary contributions of this work can be summarized as follows:
-
• Comprehensive analysis of relative signal strength corresponding to each data block. Previous work has attempted to predict variation in cognition based on brain connectivity (Popp et al., Reference Popp, Thiele, Faskowitz, Seguin, Sporns and Hilger2024), or even predict SC given FC (Zhang et al., Reference Zhang, Wang and Zhu2022) to understand how different data blocks or traits are related with each other. That said, being able to provide a specific percentage of signal strength available in each data modality, FC through genetics, attributable to a particular shared space represents a substantial advancement to the neuroscience literature.
-
• Confirmatory brain connectivity analysis with novel genetics and substance-use insights. Section 4.1 shows FC to be the most significant predictor of SC and vice versa (Sanwar et al., Reference Sanwar, Tian, Yeo, Ramamohanarao and Zalesky2021; Zhang et al., Reference Zhang, Wang and Zhu2022). Section 4.1 also depicts genetics as the second most influential data modality in determining brain connectivity, a result not previously established.
-
• Extension of Jackstraw methodology to test statistical significance in DIVAS loadings. DIVAS loadings provide important insights into how different data blocks can vary with each other. The previous Jackstraw methodology defined in the AJIVE setting (Feng et al., Reference Feng, Jiang, Hannig and Marron2018) cannot be directly applied to DIVAS. Section 3.2 will introduce this new Jackstraw methodology for the DIVAS framework.
-
• Results validation based on a separate HCP-YA subset data. The presence of first-order relatives in the HCP-YA allows for a validation data set that is approximately an independent copy of the main discovery data set. We then apply principal angle analysis to quantify the extent to which these subspaces, in potentially high dimensions, are reproducible. Indeed, Section 4.3 demonstrates that the results corresponding to the two data sets are highly related and that the subspaces discerned in the discovery set are reproduced by the validation set.
The remainder of th article will be structured as follows: Section 2 will discuss the data and associated preprocessing. Section 3 articulates the methods which entail DIVAS, Jackstraw, a variational decomposition, and principal angle analysis. Section 4 illustrates the results of applying these methods to the five-block HCP-YA data, and Section 5 concludes with discussion of our contributions and future work. Technical preprocessing details, additional diagnostic plots, and further DIVAS details will be given in Appendices A–C.
2 Data
The HCP-YA (Van Essen et al., Reference Van Essen, Smith, Barch, Behrens, Yacoub, Ugurbil and Consortium.2013) is a comprehensive neuroscientific study that has generated complex datasets on brain function, structure, cognitive performance, and more, involving more than 1,200 human subjects. These data are freely accessible through the ConnectomeDB website. The HCP-YA is both expansive and highly structured in the sense that it contains first-order family relatives. Application of DIVAS to this HCP-YA data allows for integration of more disparate data blocks than has previously been accomplished, while also enabling a stronger validation than is available in random partition methods.
We preprocess five blocks of HCP-YA data before applying DIVAS: SC, FC, substance use, cognition, and genetic measures. Appendix A provides the technical details for preprocessing each of these data blocks. In contrast, this section will provide a high-level description of each data type and the dimensions of the finalized data blocks submitted to DIVAS. This section will also clarify terminology used repeatedly in describing the preprocessing of data matrices.
As detailed in Marron & Dryden (Reference Marron and Dryden2021), ambiguities in terminology can lead to confusion across disciplines when discussing the structure and centering of a data matrix. To avoid such ambiguities we will use terminology originally introduced in Prothero et al. (Reference Prothero, Hannig and Marron2023) and referenced throughout the DIVAS methodology (Prothero et al., Reference Prothero, Jiang, Hannig, Tran-Dinh, Ackerman and Marron2024). In particular, we use the notion of a data object to be the basic unit of statistical analysis. However, in other disciplines, these data objects may be termed observations, experimental units, observation units, or feature vectors. Likewise, we will reserve the terminology of trait to mean what other disciplines may call a variable, measure, or feature.
In the matrices we present in Section 3.1, our data objects will be oriented along the columns and the traits along the rows. We acknowledge that there may be other justifiable ways of orienting this matrix. For example, taking the transpose of this orientation (data objects in the rows and traits in the columns) is a convention followed by many in the psychometric literature.
With this terminology clarified, let us turn to the data itself. Each data object of the FC matrix will represent a human subject’s FC data. This data is a vectorized adjacency matrix of correlations between blood oxygen level dependence (BOLD) signals in different regions of interest (ROIs) in the subject’s brain. Likewise, each column of the SC matrix is a vectorized adjacency matrix of structural connections. SC connections, however, represent the number of white matter fiber bundles between these aforementioned ROIs. Data objects in the cognition data block represent a human subject’s performance in a battery of 45 different tests of cognitive performance. These tests are part of the NIH Toolbox (Gershon et al., Reference Gershon, Wagster, Hendrie, Fox, Cook and Nowinski2013) and include Flanker Tasks, Delay Discounting, and Penn Word Memory tests. The substance use data block contains self-reported traits on frequency and type of substance use. These range from drinks per day to number of times used opiates. Finally, the genetic data objects are linear combinations of each human subjects’ single nucleotide polymorphisms( SNPs).
As Section 3.1 will discuss, DIVAS requires that the data blocks be unified on a common set of data objects—in this case human subjects. Since each of the five data blocks above was collected on slightly distinct sets of subjects, preprocessing requires taking the set intersection of each subject list. This winnows down the original 1206 subjects to 1064 common to all five data blocks.
However, as discussed in Section 1, it is quite pivotal to note that the HCP-YA data includes a large number of first-order family relations. This poses serious challenges for any method, like DIVAS, that makes use of an independent observation assumption. For that reason, we further reduce our sample by randomly selecting one representative from each unique family ID to arrive at 375 non-genetically related individuals upon whom the independence assumption can more justifiably be applied. This means that the finalized dimensions of the FC, SC, cognition, substance use, and genetic data blocks are as follows:
$3591 \times 375$
 ,
$3509 \times 375$
,
$3509 \times 375$
 ,
$45 \times 375$
,
$45 \times 375$
 ,
$30 \times 375$
,
$30 \times 375$
 , and
$375 \times 375$
, and
$375 \times 375$
 . This set of data is marked as our discovery data set and is depicted schematically in Figure 1.
Schematic representation of five preprocessed HCP-YA data blocks submitted to DIVAS. We present the transpose of each data block, to preserve vertical space. Each block is represented by a different color and lists its number of observations (bottom left corner), number of variables (bottom right corner), and range of values that this data type realizes (centered above the block). For example, FC has 375 observations of 3591 variables taking values between -0.87 and 0.67. A black frame is provide at the same vertical height within each colored box to illustrate that the blocks are linked through common human participants (rows in this transpose orientation).

Figure 1 Long description
Five rectangular blocks are arranged horizontally, each containing a thin black frame at the same vertical height to indicate linked human participants.
* The first block is blue. Above it is the range -0.87 is less than or equal to F C which is less than or equal to 0.67. The bottom left corner is labeled 375 and the bottom right is 3591.
* The second block is orange. Above it is the range -8.70 is less than or equal to S C which is less than or equal to 7.36. The bottom left corner is labeled 375 and the bottom right is 3509.
* The third block is grey. Above it, angled diagonally, is the range -12.23 is less than or equal to Cog which is less than or equal to 16.10. The bottom left corner is labeled 375 and the bottom right is 45.
* The fourth block is yellow. Above it, angled diagonally, is the range -2.38 is less than or equal to Use which is less than or equal to 9.06. The bottom left corner is labeled 375 and the bottom right is 30.
* The fifth block is green. Above it, angled diagonally, is the range -254.54 is less than or equal to Gene which is less than or equal to 301.57. The bottom left corner is labeled 375 and the bottom right is 375.
To validate our findings from the discovery data, we form a separate validation data set. This validation set consists of non-genetically related individuals who are not included in the discovery set in the HCP-YA. We select a random representative from the remaining subjects in each family, ensuring that the chosen individual has data available from all five data blocks. Each of the preprocessing steps discussed in Appendix A are done separately for the validation set. As a result, the validation set has two important characteristics: 1) this group is highly genetically related to the discovery set and 2) their data is collected and processed independently. The final validation set contains 377 individuals, 326 of whom are first-order relatives of a member from the discovery set. Therefore, it provides an ideal setting for validating the findings from the discovery data set.
3 Methods
We introduce the methodologies used to analyze the HCP-YA data. DIVAS is implemented to integrate the five disparate data blocks and is discussed in Section 3.1. Novel DIVAS Jackstraw Significance Tests are derived to assess the statistical significance of DIVAS loadings entries and are discussed in Section 3.2. A variational decomposition is used to describe the relative signal strength of each data block and is discussed in Section 3.3. Finally, principal angle analysis is introduced in Section 3.4 as a method for assessing reproducibility. The code used in this analysis is publicly available at https://github.com/atacker22dw/Multifaceted-Brain-Imaging-Data-Integration-via-Analysis-of-Subspaces.
3.1 DIVAS
DIVAS (Prothero et al., Reference Prothero, Jiang, Hannig, Tran-Dinh, Ackerman and Marron2024) finds subspaces of
$\mathbb {R}^n$
 that represent either fully shared (joint), partially shared, or individual structure. Basis vectors determine modes of variation for each type of subspace—fully shared through individual. These modes of variation are rank 1 outer products of loading vectors and trait vectors. They follow directions in trait space that provide a simple summary of one component of the variation. In this context, joint is defined in terms of common scores. Before examining the algorithm in more detail, let us first discuss the modeling assumptions.
Consider the following data model for
$p_k \times n$
 -dimensional data matrix
$\mathbf {X}_k$
-dimensional data matrix
$\mathbf {X}_k$
 ,
,

where each data block is assumed to be the sum of a low-rank signal matrix
$\mathbf {A}_k$
 and full-rank noise matrix
$\mathbf {E}_k$
and full-rank noise matrix
$\mathbf {E}_k$
 . This model assumes that each entry of
$\mathbf {E}_k$
. This model assumes that each entry of
$\mathbf {E}_k$
 is independent with identical variance
$\sigma ^2$
is independent with identical variance
$\sigma ^2$
 and finite fourth moment. Additionally, to reflect shared and partially shared structure across data blocks, we assume each
$\mathbf {A}_k$
and finite fourth moment. Additionally, to reflect shared and partially shared structure across data blocks, we assume each
$\mathbf {A}_k$
 can be decomposed as

where
$\mathbf {L}_{\mathbf {i},k}$
 is the
$p_k \times r_i$
is the
$p_k \times r_i$
 -dimensional loadings matrix corresponding to the
$k^{th}$
-dimensional loadings matrix corresponding to the
$k^{th}$
 data block,
$\mathbf {V}_{\mathbf {i}}$
data block,
$\mathbf {V}_{\mathbf {i}}$
 is the
$n \times r_i$
is the
$n \times r_i$
 -dimensional common normalized scores matrix (containing norm one columns),
$r_i$
-dimensional common normalized scores matrix (containing norm one columns),
$r_i$
 is the signal rank corresponding to block collection i, and the block collection index extends over a power set
$\mathbf {i}\in 2^{\{1,\ldots ,K\}}$
is the signal rank corresponding to block collection i, and the block collection index extends over a power set
$\mathbf {i}\in 2^{\{1,\ldots ,K\}}$
 . For example, the loadings matrix for the second data block, associated with partially shared structure between the second and third data blocks is denoted
$\mathbf {L}_{\{2,3\}, 2}$
. For example, the loadings matrix for the second data block, associated with partially shared structure between the second and third data blocks is denoted
$\mathbf {L}_{\{2,3\}, 2}$
 . Whereas the scores matrix for this partially shared space is common to each data block and thus denoted
$\mathbf {V}_{\{2,3\}}$
. Whereas the scores matrix for this partially shared space is common to each data block and thus denoted
$\mathbf {V}_{\{2,3\}}$
 with no dependence on k. We also denote the partially shared joint signal
$\mathbf {A}_{\mathbf {i},k}=\mathbf {L}_{\mathbf {i},k}\mathbf {V}_{\mathbf {i}}^\top $
with no dependence on k. We also denote the partially shared joint signal
$\mathbf {A}_{\mathbf {i},k}=\mathbf {L}_{\mathbf {i},k}\mathbf {V}_{\mathbf {i}}^\top $
 . For a set of signal matrices
$\mathbf {A}_1,...,\mathbf {A}_k$
. For a set of signal matrices
$\mathbf {A}_1,...,\mathbf {A}_k$
 , Prothero et al. (Reference Prothero, Jiang, Hannig, Tran-Dinh, Ackerman and Marron2024, Theorem 1) shows the existence and uniqueness of such a decomposition under mild conditions. The identifiability conditions for this decomposition are given in Appendix C.1. In particular, we impose orthogonality on the columns of
$\mathbf {V}_{\mathbf {i}}$
, Prothero et al. (Reference Prothero, Jiang, Hannig, Tran-Dinh, Ackerman and Marron2024, Theorem 1) shows the existence and uniqueness of such a decomposition under mild conditions. The identifiability conditions for this decomposition are given in Appendix C.1. In particular, we impose orthogonality on the columns of
$\mathbf {V}_{\mathbf {i}}$
 , rather than
$\mathbf {L}_{\mathbf {i},k}$
, rather than
$\mathbf {L}_{\mathbf {i},k}$
 , as the scores are common for a given block collection. It is also worth noting that (3.2) can produce an arbitrary sign flip for
$\mathbf {L}_{\mathbf {i},k}$
, as the scores are common for a given block collection. It is also worth noting that (3.2) can produce an arbitrary sign flip for
$\mathbf {L}_{\mathbf {i},k}$
 which are applied consistently to each loadings. For example, if one chooses to flip the sign of
$\mathbf {L}_{\{2,3\}, 2}$
which are applied consistently to each loadings. For example, if one chooses to flip the sign of
$\mathbf {L}_{\{2,3\}, 2}$
 , the sign is also flipped in
$\mathbf {L}_{\{2,3\}, 3}$
, the sign is also flipped in
$\mathbf {L}_{\{2,3\}, 3}$
 . In such a way, the combined inference and interpretation is unchanged. Finally, the ability to capture partially shared subspaces is unique to DIVAS, as compared to precursor methods, such as AJIVE (Feng et al., Reference Feng, Jiang, Hannig and Marron2018), and is what allows our HCP-YA analysis to be more exhaustive than previous studies.
With this model in place, let us more carefully consider the DIVAS algorithm. Broadly, DIVAS consists of three steps—signal extraction, joint subspace estimation, and signal reconstruction. The signal extraction step will employ random matrix theory and singular value decomposition to extract the magnitude of the signal as well as angle perturbation theory to establish its direction. Appendix C.2 provides more thorough details on signal extraction. Angle bounds are derived and estimated through a subspace rotation bootstrapping procedure. Collectively, this produces a low-rank approximation of the data matrix. Crucially, this initial step is done on each data matrix separately but in both object (
$\mathbb {R}^n$
 ) and trait (
$\mathbb {R}^{p_k}$
) and trait (
$\mathbb {R}^{p_k}$
 ) spaces.
These estimated signal subspaces determine the objective function and constraints of a convex–concave optimization problem aimed at minimizing angular distance between candidate directions and subspaces. In this step also, the inclusion of object space information is unique to DIVAS and allows for a heightened level of interpretability in the resulting shared space loadings vectors. Appendix C.3 explicitly details the objective function and constraints. It also provides an intuitive explanation for each constraint, but complete details of this step can be found in Prothero et al. (Reference Prothero, Jiang, Hannig, Tran-Dinh, Ackerman and Marron2024, Section 2.2).
Finally, each candidate direction is passed into step three which aims to reconstruct the signal matrices for each block. This is accomplished by first concatenating all joint structure basis matrices induced by block k. This concatenated basis matrix is then used in a linear regression to find the loadings for block k. This precise linear regression is aimed at accounting for collinearity between partially shared spaces, and will be pivotal to (3.3) in Section 3.2. Additionally, this step performs one final SVD projection along a direction of maximal variation. This can be thought of as a re-rotation aimed at sorting the rank 1 modes of variation in order of importance.
Computational concerns include efficiency when dealing with a) high- dimensional data blocks (large
$p_k$
 ) and b) very numerous data blocks (large K). Consequently, DIVAS can be slow to compute for data blocks, including a large number of traits, in which case we suggest using PCA as a preprocessing dimension reduction step. For example, see our processing of the genetic SNP data in Appendix A.3. Secondly, DIVAS may slow down substantially in the presence of a large number of data blocks.
3.2 Jackstraw
A useful technique for understanding statistical significance of traits in high dimensions is Jackstraw Significance Testing (Chung & Storey, Reference Chung and Storey2014). It proposes hypothesis tests on the row-space basis vectors of genomic loadings resulting from PCA. Yang et al. (Reference Yang, Hoadley, Hannig and Marron2023) extends the Jackstraw approach to the AJIVE setting (Feng et al., Reference Feng, Jiang, Hannig and Marron2018). Both of these types of inference are done on individual modes of variation which is not well suited for a subspace-based method, such as DIVAS. In this section, we present a novel method for assessing statistical significance of DIVAS loadings.
More specifically, when DIVAS estimates loadings, it needs to account for potential collinearity induced by partially shared spaces of the same block collection. To do this, DIVAS, and by extension DIVAS Jackstraw, does not estimate loadings on one individual mode of variation at a time but simultaneously. Recall from Section 3.1, that a mode of variation is a rank 1 matrix formed from the outer product of two vectors—one in object space and one in trait space. Also recall from Section 2, that we use the terminology data object and trait to describe what other disciplines may call an observation and variable, respectively. Prothero et al. (Reference Prothero, Jiang, Hannig, Tran-Dinh, Ackerman and Marron2024) denotes the estimated orthonormal basis (i.e., scores vectors) for the joint structure among blocks in collection
$\mathbf {i}$
 as
$\mathfrak {V}_{\mathbf {i}}$
as
$\mathfrak {V}_{\mathbf {i}}$
 . For a given data block k, horizontally concatenate all joint structure basis matrices found involving block k into one matrix
$\left [\mathfrak {V}_{\mathbf {i}}\right ]_{\mathbf {i}|k\in \mathbf {i}} := \mathfrak {V}_{k}$
. For a given data block k, horizontally concatenate all joint structure basis matrices found involving block k into one matrix
$\left [\mathfrak {V}_{\mathbf {i}}\right ]_{\mathbf {i}|k\in \mathbf {i}} := \mathfrak {V}_{k}$
 . Then,
$\mathfrak {L}_k$
. Then,
$\mathfrak {L}_k$
 is found by solving the following least square problem:

The columns of matrix
$\mathfrak {L}_k$
 can then be partitioned into loadings
$[\mathfrak {L}_{\mathbf {i},k}]_{\mathbf {i}|k\in \mathbf {i}}$
can then be partitioned into loadings
$[\mathfrak {L}_{\mathbf {i},k}]_{\mathbf {i}|k\in \mathbf {i}}$
 corresponding to the columns of the score matrix
$\left [\mathfrak {V}_{\mathbf {i}}\right ]_{\mathbf {i}|k\in \mathbf {i}}$
corresponding to the columns of the score matrix
$\left [\mathfrak {V}_{\mathbf {i}}\right ]_{\mathbf {i}|k\in \mathbf {i}}$
 .
.
Let
$\mathfrak {L}\in \mathbb {R}^{p_k \times d}$
 be a sub-matrix of
$\mathfrak {L}_k$
be a sub-matrix of
$\mathfrak {L}_k$
 , whose columns represent a collection of modes of variation of interest. Typically, this would be either a single mode of variation or modes of variation corresponding to the entire data block
$\mathfrak {L}_{\mathbf {i},k}$
, whose columns represent a collection of modes of variation of interest. Typically, this would be either a single mode of variation or modes of variation corresponding to the entire data block
$\mathfrak {L}_{\mathbf {i},k}$
 . The former will be the specific formulation applied to attain the results in Section 4.2.
We can then test whether the
$i^{th}$
 trait plays a role across any of the d loading values of the matrix of interest
$\mathfrak L$
trait plays a role across any of the d loading values of the matrix of interest
$\mathfrak L$
 :
:

This is accomplished via an empirical F-test. At a high level, we calculate sum of squared differences between the observed response and the predicted response in (3.3), both with and without the modes of variation of interest. Toward that end, define
$\mathcal {S} = \sum _{i \in \mathbf {i}}{\hat {r}_i}$
 , and let
$\hat {\mathbf {X}}_{k}^1 = \hat {\mathfrak {L}}\hat {\mathfrak {V}_{k}^T}$
, and let
$\hat {\mathbf {X}}_{k}^1 = \hat {\mathfrak {L}}\hat {\mathfrak {V}_{k}^T}$
 and
$\hat {\mathbf {X}}_{k}^0 = \hat {\mathfrak {L}^0}(\hat {\mathfrak {V}}_{k}^0)^T$
and
$\hat {\mathbf {X}}_{k}^0 = \hat {\mathfrak {L}^0}(\hat {\mathfrak {V}}_{k}^0)^T$
 . Here,
$(\hat {\mathfrak {V}}_{k}^0)$
. Here,
$(\hat {\mathfrak {V}}_{k}^0)$
 is the matrix
$\hat {\mathfrak {V}}_{k}$
is the matrix
$\hat {\mathfrak {V}}_{k}$
 with the columns of
$\mathfrak {L}^0$
with the columns of
$\mathfrak {L}^0$
 removed, and
$\hat {\mathfrak {L}^0}$
removed, and
$\hat {\mathfrak {L}^0}$
 is the solution to (3.3) with
$\mathfrak {V}_{k}^T$
is the solution to (3.3) with
$\mathfrak {V}_{k}^T$
 replaced by
$(\mathfrak {V}_{k}^0)^T$
replaced by
$(\mathfrak {V}_{k}^0)^T$
 . For a fixed i, the corresponding sum-of-squares becomes:

where
$\mathbf {X}_{k_{[i,j]}}$
 is the
$[i,j]^{th}$
is the
$[i,j]^{th}$
 element of the
$k^{th}$
element of the
$k^{th}$
 data matrix,
$\mathbf {X}_k$
data matrix,
$\mathbf {X}_k$
 . Clearly, the sum of squares
$SSE_{0i}$
. Clearly, the sum of squares
$SSE_{0i}$
 is computed under the null hypothesis (3.4). Finally, the associated test statistics are given by:

Because of the complex structure of the DIVAS Jackstraw loadings, we would not expect (3.5) to follow an F distribution. Instead, we will simulate a permutation-based null distribution against which we compare our empirical F-test statistic. In particular, to generate a sample from the null distribution of the F statistic, we randomly select a trait i, permute the corresponding row (trait) of the original data matrix
$\mathbf {X}_k$
 , fit the loadings using the permuted data, and compute the corresponding test statistics. This is repeated
$s\gg p_k$
, fit the loadings using the permuted data, and compute the corresponding test statistics. This is repeated
$s\gg p_k$
 times. For large
$p_k$
times. For large
$p_k$
 this choice of s can be computationally expensive. Therefore, following Yang et al. (Reference Yang, Hoadley, Hannig and Marron2023), this permutation can be done for m rows simultaneously to speed up computation, but often at the expense of accuracy. Indeed, future work could be done to make this procedure less computationally expensive in general. For the analysis presented in Section 4.2,
$m=1$
this choice of s can be computationally expensive. Therefore, following Yang et al. (Reference Yang, Hoadley, Hannig and Marron2023), this permutation can be done for m rows simultaneously to speed up computation, but often at the expense of accuracy. Indeed, future work could be done to make this procedure less computationally expensive in general. For the analysis presented in Section 4.2,
$m=1$
 ,
$s = 15000$
,
$s = 15000$
 .
.
Similarly, in principle, simulating this null distribution should be based on a complete rerun of DIVAS after each permutation. However, as argued in Yang et al. (Reference Yang, Hoadley, Hannig and Marron2023), this would be extremely computationally expensive. Moreover, in high-dimensional data (such as the HCP data presented here), permuting a small number of traits will have a minimal impact on the common normalized scores output from DIVAS. Therefore, we concur with Yang et al. (Reference Yang, Hoadley, Hannig and Marron2023) in recommending that the original DIVAS common normalized scores be used for each permutation step.
We reject the null hypothesis if our observed F test statistic is larger than the
$(1-\alpha )$
 percentile of the null distribution. Since we desire a test, not for a fixed i but all
$i \in \{1,..., p_k\}$
percentile of the null distribution. Since we desire a test, not for a fixed i but all
$i \in \{1,..., p_k\}$
 , a Bonferroni (Reference Bonferroni1936) correction, dividing by the number of traits in the corresponding data block, is suggested and used to account for multiple testing. It is worth noting that this adjustment is known to be conservative. Indeed, as a consequence of the union bound, it is a level
$\alpha $
, a Bonferroni (Reference Bonferroni1936) correction, dividing by the number of traits in the corresponding data block, is suggested and used to account for multiple testing. It is worth noting that this adjustment is known to be conservative. Indeed, as a consequence of the union bound, it is a level
$\alpha $
 test irrespective of the dependence between p-values. Even though this correction is conservative, our analysis of the HCP-YA still produces biologically interpretable traits that are statistically significant.
3.3 Variational decomposition
We will proceed with a sum-of-squares-like decomposition of each original data block. More specifically, DIVAS produces a low-rank matrix approximation of each component (fully shared, partially shared, and individual) of a given data blocks signal. The squared Frobenius norm of each low-rank matrix can be thought of as a measure of the energy or variability inherent to the original data block that is attributable to said component. For example, we could study the percent of variation in FC that is explained by its pairwise shared space with SC.
Part of our purpose in presenting these variational decompositions will be to juxtapose naturally comparable data blocks, such as FC with SC and cognition with substance use. To do this, we will rely on a notion of relative signal strength which in turn requires that we introduce the notation of estimated partially shared signal matrix
$\hat {\mathbf {A}}_{\mathbf {i},k}=\mathfrak L_{\mathbf {i},k} \mathfrak V_{\mathbf {i}}^\top $
 and
$\hat {\mathbf {A}}_{k} = \sum _{\mathbf {i} | k\in \mathbf {i}} \hat {\mathbf {A}}_{\mathbf {i},k}$
and
$\hat {\mathbf {A}}_{k} = \sum _{\mathbf {i} | k\in \mathbf {i}} \hat {\mathbf {A}}_{\mathbf {i},k}$
 . Thus, the resulting ratio that measures relative signal strength in the
$k^{th}$
. Thus, the resulting ratio that measures relative signal strength in the
$k^{th}$
 block that the
$k_i^{th}$
block that the
$k_i^{th}$
 shared-space (individual space) contributes is

The relative signal strength for each data block in the HCP-YA discovery set is presented in Tables 1–3 of Section 4.1.
FC/SC variational decomposition

Table 1 Long description
The table is divided into two main sections: Functional connectivity (F C) and Structural connectivity (S C). Each section contains three columns: Subspace, variance (represented by the symbol J R-tilde super 2), and Rank.
Functional Connectivity data:
* Individual F C: 51.14% variance, Rank 57.
* F C-S C: 23.45% variance, Rank 27.
* F C-Gene: 13.85% variance, Rank 14.
* F C-Cog: 7.72% variance, Rank 6.
* F C-Use: 3.16% variance, Rank 4.
* F C-S C-Use: 0.67% variance, Rank 1.
Structural Connectivity data:
* S C-F C: 40.27% variance, Rank 27.
* Individual S C: 38.52% variance, Rank 28.
* S C-Gene: 11.58% variance, Rank 9.
* S C-Cog: 4.36% variance, Rank 3.
* S C-Use: 3.87% variance, Rank 3.
* S C-F C-Use: 1.39% variance, Rank 1.
Cog/use variational decomposition

Table 2 Long description
The table is divided into two main sections: Cognition on the left and Substance use on the right. Each section contains three columns: Subspace, R-tilde-squared (percentage), and Rank.
Under the Cognition section:
* Cog-F C has an R-tilde-squared of 62.30% and a Rank of 6.
* Cog-S C has an R-tilde-squared of 31.74% and a Rank of 3.
* Cog-Use has an R-tilde-squared of 5.96% and a Rank of 1.
Under the Substance use section:
* Use-F C has an R-tilde-squared of 38.55% and a Rank of 4.
* Use-F C-S C has an R-tilde-squared of 34.25% and a Rank of 1.
* Use-S C has an R-tilde-squared of 19.55% and a Rank of 3.
* Cog-Use has an R-tilde-squared of 7.65% and a Rank of 1.
3.4 Principal angle analysis
Principal angle analysis is a tool for measuring similarities of DIVAS produced subspaces from related data sets. In this article, we have a particular data set that can be naturally split into discovery and validation sets. This section will provide a method for verifying the reproducibility of DIVAS results via principal angle analysis. Computing the principal angles between subspaces is an established way to quantify angular closeness. Following Miao & Ben-Israel (Reference Miao and Ben-Israel1992), if
$\mathcal {M},\ \mathcal {N}$
 are subspaces of
$\mathbb {R}^d$
are subspaces of
$\mathbb {R}^d$
 such that
$dim(\mathcal {M})= m \leq n = dim(\mathcal {N})$
such that
$dim(\mathcal {M})= m \leq n = dim(\mathcal {N})$
 , the principal angles
$0^\circ \leq \theta _1 \leq \theta _2 \leq ... \leq \theta _m \leq 90^\circ $
, the principal angles
$0^\circ \leq \theta _1 \leq \theta _2 \leq ... \leq \theta _m \leq 90^\circ $
 are defined to satisfy:

where
$x,y$
 are the corresponding principal vectors. All else being equal, comparatively small principal angles indicate subspaces that are closer to each other than those producing large principle angles. As discussed in Marron and Dryden (Reference Marron and Dryden2021, Section 16.2.2), our intuition regarding interpretation of angles degrades in higher dimensions. In particular, subspaces that are similar can exhibit apparently large principle angles.
DIVAS accounts for this with the random direction bound described in Prothero et al. (Reference Prothero, Jiang, Hannig, Tran-Dinh, Ackerman and Marron2024, Section 2.1.2). Intuitively, this provides a stochastic lower bound on the angle between randomly related subspaces. In particular, the random direction bound is a low percentile of a null distribution created by taking angles between a fixed
$\hat {r}$
 -dimensional subspace and unit vectors chosen uniformly at random. As such, any principal angle exceeding this random direction bound is considered large.
This principal angle analysis and comparison will be computed for each subspace present in both the discovery and validation data. Any principal angle below the random direction bound gives indication of reproducibility, and any subspace with a majority of such principal angles shows rigorous evidence of overall reproducibility. While we present principal angle analysis within the context of DIVAS HCP reproducibility, it is general enough to be applied to any situation where subspaces need to be compared.
4 Results
The DIVAS and Jackstraw methods were applied to the HCP-YA discovery data set. Figure 2 illustrates a DIVAS diagnostic plot for this five-block run. Each row represents a different data block, while each column represents a different type of shared, partially shared, or individual space. The number within each cell represents the rank of the subspace such that there is a rank 1 FC-SC-Use space, a rank 27 FC-SC space, etc. Different colors are used to visually distinguish each type of subspace, with a gray zero indicating a space that was indistinguishable from pure noise. This diagnostic indicates no fully shared five-way or partially shared four-way spaces, one partially shared three-way space, a host of pairwise spaces, and three individual spaces.
DIVAS diagnostic plot for five-block run on FC, SC, Cognition (Cog), Substance-Use (Use), and Genetics (Gene). Rank of each subspace is presented within the colored box corresponding to this subspace. Gray boxes indicate that no variation of that subtype is distinguished. For example, the rank 1 FC-SC-Use partially shared space will be investigated in Section 4.2.

Figure 2 Long description
A grid diagram with five rows labeled F C, S C, Cog, Use, and Gene. The x-axis is divided into six main sections from left to right: 5-Way, 4-Way, 3-Way, 2-Way, 1-Way, and Ranks.
* The 5-Way section contains a single gray column with zeros across all rows.
* The 4-Way section contains five columns, all gray with zeros.
* The 3-Way section contains ten columns. One column is highlighted in blue, showing a rank of 1 for F C, S C, and Use, while other columns are gray with zeros.
* The 2-Way section contains ten columns with several red highlighted boxes indicating shared variation. Notable ranks include 276 for F C and S C, 63 for S C and Cog, 43 for S C and Use, and 149 for Use and Gene.
* The 1-Way section contains five columns with green highlighted boxes representing individual variation: F C has 57, S C has 28, and Gene has 130. Cog and Use show 0 in gray boxes.
* The final Ranks column on the far right lists the total ranks for each row: F C is 109, S C is 71, Cog is 10, Use is 7, and Gene is 153.
Genetics variational decomposition

Table 3 Long description
The table consists of three columns: Subspace, J tilde R super 2, and Rank.
* The first row under the headers lists the Individual gene subspace with a J tilde R super 2 value of 83.04% and a Rank of 130.
* The second row lists the Gene-F C subspace with a J tilde R super 2 value of 9.50% and a Rank of 14.
* The third row lists the Gene-S C subspace with a J tilde R super 2 value of 7.46% and a Rank of 9.
The results section will proceed as follows: a variational decomposition aimed at describing how each shared-space contributes to explaining variability in a particular data block, a careful interpretation of Jackstraw significant loadings in the FC-SC-Use subspace to elucidate biological interpretations of our HCP-YA analysis, and a principal-angle validation routine verifying the robust nature of these findings.
4.1 Variational decomposition
Table 1 presents the variational decomposition applied to FC and SC. As expected, the single most influential shared space in FC and SC alike is the pairwise space they share with each other. Roughly 24% of the variation in non-residual signal in FC can be attributed to a shared space with SC, while about 41% of this variation in SC can be attributed to a shared space with FC. These substantial proportions of explained variation in each connectivity type support the findings of Sanwar et al. (Reference Sanwar, Tian, Yeo, Ramamohanarao and Zalesky2021) and Zhang et al. (Reference Zhang, Wang and Zhu2022), which predict FC based on SC, or vice versa.
Table 1 also highlights the specific contribution of genetics to understanding brain connectivity. Genetics accounts for the second most influential partially shared space in explaining both FC and SC, with relative signal strengths of 13.85% in FC and 11.58% in SC. To the best of our knowledge, no previous work has established precise measures of the variability in brain connectivity attributable to genetic SNPs. The fact that genetics explains such a significant portion of this variation suggests that both anatomical brain structures, such as white matter tracts, and their functional associations are strongly influenced by genetic predisposition.
Table 2 provides a similar decomposition for the cognition and substance use data blocks. Notably, FC remains highly significant in explaining both substance use and cognition. The pairwise partially shared space with FC is the most informative space for determining both cognition and substance use. More specifically, 72.80% (38.55% + 34.25%) of the relative signal strength in substance use is attributed to a partially shared space that includes FC. Similarly, 62.30% of the relative signal strength in cognition is attributed to a pairwise partially shared space with FC. Finally, SC also has a non-trivial role to play in explaining cognition (31.74%) and substance-use (53.80% collectively). This underscores the extent to which brain connectivity explains cognitive performance and substance-use patterns (Smith et al., Reference Smith, Nichols, Vidaurre, Winkler, Behrens, Glasser, Ugurbil, Barch, Van Essen and Miller2015; Zhang et al., Reference Zhang, Allen, Zhu and Dunson2019).
We conclude this variational decomposition section by applying (3.6) to the genetics data block, the results of which can be found in Table 3. Genetics, somewhat like cognition, is a data block whose signal was only partitioned into comparatively few subspaces. In particular, it has an individual subspace and two pairwise subspaces. Of these two pairwise partially shared spaces, FC accounts for the most variation in genetics, but brain connectivity as a whole contributes roughly 17% of the non-residual signal variability in genetics. Interestingly, no cognition or use sharedspace was distinguished, indicating that for this group of HCP-YA subjects, genetics does not seem to explain cognition or use, except indirectly through brain connectivity.
4.2 Investigation of shared spaces
Investigating the loadings inherent to particular shared spaces allows for insight at the level of specific traits. We begin by analyzing the rank 1 partially shared space between FC-SC-Use for two reasons. First, it is the subspace containing the contribution from the most data blocks (3). Secondly, while each shared, partially shared and individual space represents a statistically significant subspace, this subspace will be shown to be highly biologically interpretable as well.
Figure 3 shows the FC and SC loadings (in the notation of Sections 3.2 and 3.3, these are
$\mathfrak L_{\{1,2,4\},1}$
 and
$\mathfrak L_{\{1,2,4\},2,}$
and
$\mathfrak L_{\{1,2,4\},2,}$
 respectively) in adjacency matrix form, corresponding to the FC-SC-Use partially shared space. By loadings adjacency matrix, we mean a loadings vector output from DIVAS that has been back-transformed into a connectivity matrix. For example, the FC loadings adjacency matrix corresponding to the rank 1 FC-SC-Use subspace represents the FC loadings vector as an
$87\times 87$
respectively) in adjacency matrix form, corresponding to the FC-SC-Use partially shared space. By loadings adjacency matrix, we mean a loadings vector output from DIVAS that has been back-transformed into a connectivity matrix. For example, the FC loadings adjacency matrix corresponding to the rank 1 FC-SC-Use subspace represents the FC loadings vector as an
$87\times 87$
 matrix. Element
$\{i,j\}$
matrix. Element
$\{i,j\}$
 of this matrix denotes the loadings corresponding to functional connections between region i and region j of the brain. Since these matrices are symmetric, Figure 3 has consolidated the loadings into a single adjacency matrix with FC connections on the upper triangular sub-matrix and SC connections on the lower. Rows 1–9 represent left subcortical regions, while rows 10–18 represent right subcortical. Row 19 represents the subcortical brain stem. Similarly, rows 20–53 represent left cortical regions, and the remaining rows 54–87 represent right cortical regions. There are several key observations to make from this adjacency matrix. Firstly, SC is more sparse than FC. Secondly, the FC loadings is dominated by negative (blue) connections, while the SC loadings has mixed positive and negative connections. It is important to note that Jackstraw Significance Tests have not yet been applied to these loadings.
FC and SC loadings adjacency matrix corresponding to the rank 1 FC-SC-Use subspace. Rows 1–19 represent subcortical (subcort) regions. Rows 20–53 and 54–87 represent the left cortical and right cortical regions, respectively. The upper triangular represents the FC loadings, and the lower triangular represents the SC loadings. Hence, this matrix is not symmetric. SC is more sparse than FC, but both FC and SC appear to be driven by predominantly negative loadings.

Figure 3 Long description
An 87 by 87 adjacency matrix heat map. The vertical axis is divided into three sections from top to bottom. Rows 1 through 19 are labeled subcort. Rows 20 through 53 are labeled left cortical. Rows 54 through 87 are labeled right cortical. A color scale bar at the bottom ranges from negative 0.03 in dark blue to 0 in white and positive 0.03 in dark red. The matrix is split by a diagonal line. The upper triangular region represents F C loadings and shows a dense distribution of blue and red pixels, with a prominent horizontal dark blue band across the subcortical rows. The lower triangular region represents S C loadings and is noticeably more sparse with larger white areas, though it contains clusters of red pixels in the lower right quadrant corresponding to the right cortical regions. Both regions are dominated by blue hues, indicating predominantly negative loadings.
We then applied the Jackstraw tests to these loadings and displayed the significant connections in circle plots shown in Figure 4. The left panel of Figure 4 shows 85 Jackstraw-significant FC connections, while the right panel displays ten Jackstraw-significant SC connections. Although this may seem like a relatively small number of significant connections given the total number of traits, recall the use of a Bonferroni correction at the
$\alpha = 0.05$
 level to account for multiple testing. This adjustment is known to be conservative, often leading to an underestimate of statistical significance. However, the conservatively selected connections help with biological interpretations.
FC (left) and SC (right) significant connections in rank 1 FC-SC-Use subspace. FC regions are reordered to correspond to SC regions. These regions correspond to the adjacency matrix in Figure 3. Abbreviations are used to denote brain regions as in frontal lobe (FL), parietal lobe (PL), occipital lobe (OL), and temporal lobe (TL). Left and right hemispheres are denoted by “-l” and “-r,” respectively, and the subcortical regions are distinguished from the cortical regions by “Subcort.” Observe that the vast majority of both FC and SC significant loadings are negative.

Figure 4 Long description
Two circular diagrams represent brain connectivity.
Panel 1 (Left): Titled 85 Significant F C Connections. The perimeter is labeled with brain regions: F L (Frontal Lobe), P L (Parietal Lobe), T L (Temporal Lobe), O L (Occipital Lobe), and Subcort (Subcortical), with suffixes -l and -r for left and right hemispheres. The interior is dense with curved lines connecting these regions. A color bar on the right scales from negative 0.3 (dark blue) to positive 0.2 (dark red). The majority of lines are dark blue or light blue, indicating negative loadings, with very few yellow or green lines.
Panel 2 (Right): Titled 10 Significant S C Connections. It uses the same perimeter labels and color scale. This diagram is much sparser, showing only ten distinct connection arcs. Most arcs are dark blue, representing negative values, while one prominent arc connecting the lower-left to lower-right is dark red, representing a positive loading.
In both diagrams, the regions are reordered so that F C regions correspond to S C regions, facilitating direct comparison of the connectivity patterns between functional and structural subspaces.
There are numerous observations that can immediately be made by examining these circle plots. Several of the largest negative FC connections by magnitude involve subcortical region 5–the left putamen. Both association (within-hemisphere) and commissural (connecting the left and right hemispheres) connections are represented among these significant traits. Similarly, of the ten significant SC connections, 4 are commissural and 6 are associative. Large connections between subcortical region 5 (left putamen) and subcortical region 8 (left amygdala), as well as between left region 34 (insula) and subcortical region 13 (right caudate), will be investigated further, as they appear particularly influential.
Figure 5 depicts the substance use loadings (
$\mathfrak L_{\{1,2,4\},4}$
 ) corresponding to the rank 1 FC-SC-Use partially shared space. Jackstraw significant traits are given full opacity while insignificant traits are made translucent. Moreover, the bars are color-coded according to type of substance use trait, and aligned so that larger numbers indicate more use (the symbol “
$-$
) corresponding to the rank 1 FC-SC-Use partially shared space. Jackstraw significant traits are given full opacity while insignificant traits are made translucent. Moreover, the bars are color-coded according to type of substance use trait, and aligned so that larger numbers indicate more use (the symbol “
$-$
 ” denotes that this trait was flipped because it was originally coded such that a larger score indicates less, rather than more, substance use). These substance use loadings are predominately driven by alcohol use traits (blue bars), and to a lesser extent marijuana and illicit substance use (yellow and red bars). Also, notice that the bar chart is largely positively oriented, the sole exception being Max Drinks (past 12 months) which is curiously pointing in the opposite direction from Max Drinks (all time). A speculative explanation for this discrepancy could be the difference in time frame playing a role in the tendency to exaggerate extremes. The longer removed from the max drinking instance, the more someone may be inclined to exaggerate the memory. This has certainly been observed in self-reported recollection of other scores (Willard & Gramzow, Reference Willard and Gramzow2008). In any case, the directionality of Figures 4 and 5 gives the interpretation that an individual with a large score will exhibit more pronounced substance use as well as fewer blue connections and more red connections. Therefore, the dominance of negative connections in FC and SC significant loadings lends the intuitive interpretation that substance use (alcohol in particular) is associated with lessened brain connectivity. We will explicitly examine the few connections that stand as exceptions to this finding.
Substance use loadings corresponding to rank 1 FC-SC-Use partially shared space. Bars have been color-coded accorded to type of substance use. For example, marijuana use traits are all depicted in yellow. Jackstraw significant traits will have full opacity while insignificant traits are made translucent. Substance use loadings appear to be predominately driven by alcohol use measures.

Figure 5 Long description
A horizontal bar chart titled Bar Chart of Substance Use Loadings in Shared Space with F C/S C. The y-axis is labeled Substance Use Features and the x-axis is labeled Loadings with a scale from -10 to 10.
From top to bottom, the features and their approximate loadings are:
* Frequency of Drinking 5+ (past 12 months) (-): 10 (Blue, opaque)
* Frequency Drunk (past 12 months) (-): 10 (Blue, opaque)
* Max Drinks (all time): 9.5 (Blue, opaque)
* Number of Symptoms Met for Abuse: 9.2 (Blue, opaque)
* Frequency of Drinking 5+ (all time) (-): 8.8 (Blue, opaque)
* Drinks Per Day (past 12 months): 8.5 (Blue, opaque)
* Number of Dependence Criteria Met: 8.5 (Blue, opaque)
* Frequency of Alcohol Use (all time) (-): 8.2 (Blue, opaque)
* Times Used Opiates: 8.1 (Red, opaque)
* Times Used Illicit Drugs: 8.0 (Red, opaque)
* Frequency Drunk (all time) (-): 8.0 (Blue, opaque)
* Frequency of Alcohol Use (past 12 months) (-): 8.0 (Blue, opaque)
* Number of Days Used Any Tobacco: 7.8 (Grey, translucent)
* Times Used Stimulants: 7.5 (Red, opaque)
* Average Weekend Tobacco Use: 7.5 (Grey, translucent)
* Yes/No Alcohol Abuse: 7.4 (Blue, opaque)
* Yes/No Still Smoking: 7.2 (Grey, translucent)
* Times Used Tobacco Today: 7.1 (Grey, translucent)
* Times Used Cocaine: 7.0 (Red, opaque)
* Drinks Per Day (all time): 6.8 (Blue, opaque)
* Marijuana Times Used: 6.5 (Yellow, opaque)
* Marijuana Dependence: 6.4 (Yellow, opaque)
* Times Used Sedatives: 6.0 (Red, opaque)
* Times Used Hallucinogens: 5.8 (Red, opaque)
* Age of First Drink (-): 5.0 (Blue, opaque)
* Yes/No Dependent: 4.8 (Blue, opaque)
* Marijuana Use Yes/No: 4.2 (Yellow, opaque)
* Average Weekend Cigar Use: 0 (Grey, translucent)
* Total Cigar Use: 0 (Grey, translucent)
* Max Drinks (past 12 months): -10 (Blue, opaque)
Blue bars represent alcohol, red bars represent various illicit drugs, yellow bars represent marijuana, and grey bars represent tobacco.
We can also provide integrated interpretations by linking individual connections to specific substance-use patterns. Figure 4 illustrates a significant negative FC connection between subcortical region 5 (left putamen) and right cortical region 7 (right inferior parietal lobe). Lessened functioning of the left putamen has been linked, through reward processing and motivation, to increased substance use (Bart et al., Reference Bart, Nusslock, Titone, Carroll, Damme, Young, Armstrong, Chein and Alloy2021). Similarly, Norman et al. (Reference Norman, Pulido, Squeglia, Spadoni, Paulus and Tapert2011) demonstrated that lessened activity in both the putamen and (bilateral) inferior parietal lobe are predictive of heightened substance use. A second large and significant negative FC connection exists between subcortcial region 5 and left cortical region 24 (left precuneus). Greater activation of the precuneus region has been shown to lessen the craving cues that are associated with alcohol (Ewing & Chung, Reference Ewing and Chung2019) and cannibis use (Feldstein Ewing et al., Reference Feldstein Ewing, McEachern, Yezhuvath, Bryan, Hutchison and Filbey2013).
Focusing on key negative SC findings, we first highlight the connection between subcortical region 13 (right caudate) and cortical region 34 (left insula). Reduced activity in the insula has been linked to a higher risk of addiction (Droutman et al., Reference Droutman, Read and Bechara2015), while alcohol dependence, in particular, is associated with diminished functional activation in the caudate (Magrabi et al., Reference Magrabi, Beck, Schad, Lett, Stoppel, Charlet, Kiefer, Heinz and Walter2022). Moreover, structural connections between the caudate and insula play a crucial role in decision-making and pain management (Ghaziri et al., Reference Ghaziri, Tucholka, Girard, Boucher, Houde, Descoteaux, Obaid, Gilbert, Rouleau and Nguyen2018). This convergence of evidence strongly supports our finding that decreased SC between these regions correlates with increased substance use, particularly alcohol dependence, potentially due to impaired pain regulation.
A second significant SC connection involves subcortical region 5 (left putamen) and subcortical region 8 (left amygdala). Our FC analysis underscores the importance of the left putamen, as discussed earlier in relation to substance use (Bart et al., Reference Bart, Nusslock, Titone, Carroll, Damme, Young, Armstrong, Chein and Alloy2021; Norman et al., Reference Norman, Pulido, Squeglia, Spadoni, Paulus and Tapert2011). Similarly, the amygdala, a critical hub for reward processing, exhibits marked dysregulation following chronic substance use, including alcohol dependence (Koob, Reference Koob1999). Taken together, these findings suggest that reduced SC between the amygdala and putamen is associated with heightened substance use. This aligns with previous research linking SC between these regions to pain processing and memory, reinforcing the validity of our results (Starr et al., Reference Starr, Sawaki, Wittenberg, Burdette, Oshiro, Quevedo, McHaffie and Coghill2011).
Despite the predominantly negative loadings for SC connections, we did observe a few positive connections, which suggest that increased connectivity in these regions is linked to greater substance use. For instance, left region 12 (lingual gyrus) is positively connected to right region 10 (lateral occipital cortex), both located in the occipital lobe. While previous research, such as Tanabe et al. (Reference Tanabe, Regner, Sakai, Martinez and Gowin2019), associates the occipital lobe more broadly with alcohol and cannabis use, these studies focus on larger regions and describe a “blunted occipital alpha response.” Our findings suggest that further exploration of the specific sub-regions within the occipital lobe could offer new insights. It’s plausible that stimulants, known to enhance sensory perception, may drive this positive connectivity. Additionally, cortical region 3 (right caudal middle frontal lobe) shows positive connectivity with subcortical region 12 (right thalamus). Huang et al. (Reference Huang, Mitchell, Haber, Alia-Klein and Goldstein2018) noted increased thalamic activity when individuals are exposed to drug cues, while activity decreases during response inhibition. Similarly, Goldstein & Volkow (Reference Goldstein and Volkow2002) found that the orbitofrontal cortex, part of the broader frontal lobe, is active during phases of intoxication, craving, and bingeing in addiction, but deactivates during withdrawal. These observations make it intuitive that heightened SC between the caudal frontal lobe and thalamus could be linked to increased substance use.
In totality, our five-way analysis reveals a rank 1 three-way shared space between FC, SC, and substance use with biologically meaningful results. We identified statistically significant negative connections that align with the established roles of individual brain regions and their interactions with substance use. The minority of positive connections observed also fit well with known functions of the involved regions. While the roles of these regions have been documented, several of the specific connections highlighted by our analysis show new associations with substance use that have not been previously recognized.
4.3 Validation
In this section, we validated our discovery data set results using the validation data derived from the HCP-YA. We used the principal angle analysis presented in Section 3.4 for comparing the two sets of DIVAS runs. Table 4 shows the principal angle analysis between corresponding subspaces in the discovery and validation runs. The corresponding minimum principal angle between subspaces is listed in the third column, while the fourth column lists the fraction of principal angles in a given subspace that fall below the random direction bound (Section 3.4). The more thorough DIVAS diagnostic plots for the discovery and validation runs are given in Appendix B, including the aforementioned random direction bound as a dot-dashed line in each cell.
Comprehensive principal angle analysis across original and validation run

Table 4 Long description
The table contains 19 rows of data across four columns.
* S C-Gene: Loadings Gene, Min P A 41.3 degrees, Fraction 1/1.
* S C-Gene: Loadings S C, Min P A 56.3 degrees, Fraction 1/1.
* S C-Cog: Loadings S C, Min P A 61.0 degrees, Fraction 3/3.
* S C-Cog: Loadings Cog, Min P A 33.2 degrees, Fraction 2/3.
* F C: Loadings F C, Min P A 3.9 degrees, Fraction 55/57.
* S C: Loadings S C, Min P A 21.7 degrees, Fraction 25/28.
* F C-Cog: Loadings F C, Min P A 21.3 degrees, Fraction 5/6.
* F C-Cog: Loadings Cog, Min P A 9.9 degrees, Fraction 5/6.
* F C-S C: Loadings F C, Min P A 9.4 degrees, Fraction 22/27.
* F C-S C: Loadings S C, Min P A 9.4 degrees, Fraction 22/27.
* Gene: Loadings Gene, Min P A 3.0 degrees, Fraction 68/96.
* F C-Use: Loadings Use, Min P A 12.1 degrees, Fraction 3/4.
* F C-Use: Loadings F C, Min P A 43.3 degrees, Fraction 2/4.
* S C-Use: Loadings S C, Min P A 76.0 degrees, Fraction 1/2.
* S C-Use: Loadings Use, Min P A 37.9 degrees, Fraction 1/2.
* F C-Gene: Loadings F C, Min P A 30.1 degrees, Fraction 1/1.
* F C-Gene: Loadings Gene, Min P A 66.5 degrees, Fraction 0/1.
* Cog-Use: Loadings Cog, Min P A 65.1 degrees, Fraction 0/1.
* Cog-Use: Loadings Use, Min P A 61.6 degrees, Fraction 0/1.
Of the 11 subspaces present in both of the discovery and validation runs, 9 exhibit a majority of associated principal angles falling below the random direction bound and therefore appear quite reproducible. Brain connectivity loadings, collectively, represent
$137/156 \approx 88\%$
 principal angles below the corresponding random direction bound. Likewise, genetics loadings contain
$69/98 \approx 70\%$
principal angles below the corresponding random direction bound. Likewise, genetics loadings contain
$69/98 \approx 70\%$
 principal angles below its random direction bound. Finally, cognition loadings exhibit
$7/10 = 70\%$
principal angles below its random direction bound. Finally, cognition loadings exhibit
$7/10 = 70\%$
 principal angles below the random direction bound, and
$4/7 \approx 57\%$
principal angles below the random direction bound, and
$4/7 \approx 57\%$
 of use loadings principal angles are less than their random direction bound. This provides strong evidence of the general reproducibility of our analysis, both at the subspace and loadings level.
However, the pairwise cognition and use (i.e., Cog-Use) subspace stands out for its lack of reproducibility. None of its loadings directions fall below the random direction bound. This likely stems from the fact that variables in one data block, substance use, are based on self-reported scores, which are known to have lower reproducibility. Therefore, we focus our discussion on the subspaces derived from the two data blocks to explore the additional potential reasons behind their lower reproducibility.
Appendix Figures B1 and B2 illustrate that while the discovery and validation runs are remarkably similar in shared subspaces, the single three-way partially shared space in the discovery run was FC-SC-Use while in the validation run it was FC-SC-Cog. Moreover, when further investigating the principal angles between the connectivity loadings involved in these shared spaces, the FC components exhibit principal angles that fall well below the random direction bound. Thus, it would appear that the FC portion of these subspaces are reproducible, but there persists some interaction between connectivity and use that is not replicated in the validation run (which in turn, exhibits some interaction between connectivity and cognition). This has bearing on the pairwise Cog-Use subspace because DIVAS segments higher-order spaces first. Specifically, the three-way subspaces are computed prior to the pairwise subspaces, and the pairwise subspaces aim to account for variation that is left unexplained by the three-way (or higher) subspaces. Therefore, when the three-way spaces exhibit slightly different interactions across use and cognition, it only stands to reason that the cognition and use pairwise spaces are going to have different left-over variation to explain.
In conclusion, the large amount of statistical validation of established results produced in Section 4.2, alongside the overwhelming majority of principal angles in Table 4 indicate the reproducibility of our results. The principal angle analysis, specifically, is a particularly rigorous mechanism for assessing reproducibility. Our models’ performance with respect to this metric underscores the unusual precision of our analysis. Future work is warranted to better understand what sorts of interactions persist between cognition, brain connectivity, and substance use, but the presence of such interactions do not hamper the credence of our findings.
5 Discussion
This study contributes several key advancements to both neuroscience and statistical methodology. Most notably, our analysis of the HCP-YA dataset is the first to comprehensively integrate five data blocks, offering a more detailed understanding of the relationships between brain connectivity, genetics, cognition, and substance use. Our findings confirm existing results, such as the substantial variation in SC explained by FC (Zhang et al., Reference Zhang, Wang and Zhu2022), while also uncovering new insights, including the role of genetics in predicting whole-brain connectivity. Methodologically, we introduce several important innovations. Our Jackstraw framework is a substantial abstraction from existing methods (Yang et al., Reference Yang, Hoadley, Hannig and Marron2023) to take full advantage of the rich structure of DIVAS loadings. Similarly, the variational decomposition uses non-residual signal as an elegant measure of relative signal strength across disparate data. Finally, a validation routine based on partitioning first-degree relatives provides a rigorous standard of reproducibility. More specifically, comparing principal angles between subspaces, in genetically related data sets, to a random direction bound carefully quantifies reproducibility.
Despite these advancements, it is important to acknowledge the challenges inherent to analyzing the HCP-YA dataset. The intersection of multiple data blocks and the use of first-degree relatives reduced the sample size, potentially limiting our ability to detect more complex shared structures. A larger sample could reveal additional four- or five-way shared structures that were undetectable in this study. Moreover, while we opt for a non-parametric approach to data integration, we recognize a Gaussian likelihood-based approach as a valuable future direction. Additionally, incorporating reliability and validity measures into the original data acquisition could bolster our understanding of the reproducibility of self-reported use scores. Finally, future work could apply this framework to other datasets, such as the Adolescent Brain Cognitive Development (ABCD) study Casey et al. (Reference Casey, Cannonier, Conley, Cohen, Barch, Heitzeg, Soules, Teslovich, Dellarco, Garavan, Orr, Wager, Banich, Speer, Sutherland, Riedel, Dick, Bjork, Thomas and Dale2018), to further validate our findings.
Nevertheless, both the DIVAS and Jackstraw methodologies provide strong statistical guarantees in the context of HCP-YA data. DIVAS ensures that each signal subspace is distinct from noise and other forms of shared or individual variation, while Jackstraw confirms that the traits we interpret are statistically significant and not spurious. Ultimately, the subspaces identified in this analysis are reproducible, interpretable, and hold biological as well as statistical significance.
Funding statement
This research was supported in part by the National Science Foundation under Grant No. DMS-2113404 and 2210337. We are also grateful to support from Grant No. NIH R25DA058940.
Competing interests
The authors declare none.
APPENDIX
A Data preprocessing details
We present the technical details of HCP data preprocessing.
A.1 FC and SC
For each HCP-YA subject, we download dMRI, T1, and resting state fMRI (rs-fMRI) data. The dMRI session includes six runs, using three gradient tables (b=1000, 2000, and 3000), each acquired with opposite phase encoding polarities. Each table has approximately 90 diffusion-weighted directions and 6 interspersed b0. The scans were performed using a spin echo EPI sequence on a 3T Connectome Scanner, resulting in an isotropic voxel size of 1.25 mm
$^3$
 and 270 diffusion-weighted scans. The T1 image has 0.7 mm
$^3$
and 270 diffusion-weighted scans. The T1 image has 0.7 mm
$^3$
 isotropic resolution. See Van Essen et al. (Reference Van Essen, Ugurbil, Auerbach, Barch, Behrens, Bucholz, Chang, Chen, Corbetta, Curtiss, Della Penna, Feinberg, Glasser, Harel, Heath, Larson-Prior, Marcus, Michalareas, Moeller and Yacoub2012) for detailed acquisition and preprocessing information. We apply the population-based structural connectome mapping (PSC) framework (Zhang et al., Reference Zhang, Descoteaux, Zhang, Girard, Chamberland, Dunson, Srivastava and Zhu2018) to the minimally preprocessed dMRI and T1 data to extract SC. PSC employs a reproducible probabilistic tractography algorithm (Maier-Hein et al., Reference Maier-Hein, Neher, Houde, Côté, Garyfallidis, Zhong, Chamberland, Yeh, Lin, Ji, Reddick, Glass, Chen, Feng, Gao, Wu, Ma, He, Li and Descoteaux2017), leveraging anatomical information from the T1 image to reduce tractography bias. We use the Desikan–Killiany (DK) atlas (Desikan et al., Reference Desikan, Ségonne, Fischl, Quinn, Dickerson, Blacker, Buckner, Dale, Maguire, Hyman, Albert and Killiany2006) to define 68 cortical parcels, and the FreeSurfer template (Fischl et al., Reference Fischl, Salat, Busa, Albert, Dieterich, Haselgrove, Van Der Kouwe, Killiany, Kennedy, Klaveness, Montillo, Makris, Rosen and Dale2002) to define 19 subcortical regions, making a total of 87 ROIs. Streamlines connecting ROI pairs are extracted by dilating gray matter ROIs, isolating pathways by cutting streamlines, and removing outliers. Connectivity strength is quantified by the number of streamlines, a measure widely used in brain imaging-genetic studies (Chiang et al., Reference Chiang, McMahon, de Zubicaray, Martin, Hickie, Toga, Wright and Thompson2011; Zhao et al., Reference Zhao, Chang, Zhang and Zhang2022).
The HCP-YA rs-fMRI data include two left-right and two right-left phase-encoded 15-min eyes-open rs-fMRI runs (Van Essen et al., Reference Van Essen, Ugurbil, Auerbach, Barch, Behrens, Bucholz, Chang, Chen, Corbetta, Curtiss, Della Penna, Feinberg, Glasser, Harel, Heath, Larson-Prior, Marcus, Michalareas, Moeller and Yacoub2012). Each run used 2 mm
$^3$
 isotropic voxels with a 0.72-s repetition time. For each run, we calculate the average time series for each of the 68 cortical ROIs from Desikan et al. (Reference Desikan, Ségonne, Fischl, Quinn, Dickerson, Blacker, Buckner, Dale, Maguire, Hyman, Albert and Killiany2006), along with the 19 subcortical ROIs. Pearson correlations between pairs of ROIs are computed for each run, Fisher z-transformed, averaged across the four runs, and transformed back to correlations.
DIVAS expects each data block to be a
$p_k \times n$
 matrix with n human subjects in the columns and
$p_k$
matrix with n human subjects in the columns and
$p_k$
 traits along the rows. Here,
$p_k$
traits along the rows. Here,
$p_k$
 is the number of traits for the k-th data block. Therefore, each connectivity adjacency matrix is vectorized before they can be stacked in its data block. More specifically, the upper-triangular sub-matrix of each individual’s symmetric adjacency matrix (both structural and functional) is vectorized and stacked horizontally to produce the columns of each connectivity data block. Once created, this data block (matrix) is then object-mean centered (Marron & Dryden (Reference Marron and Dryden2021) and variance thresholded. Recall from Section 2, we use the terminology of data object to avoid potential ambiguities in what may also be termed an observation or observational unit. Specifically, this centering entails subtracting the column vector whose entries are the means of the entries in the corresponding rows of the data matrix. Moreover, since DIVAS is a subspace-based method which learns from features with sufficient variation, the variance thresholding removes any features with row variance less than some threshold,
$0.005$
is the number of traits for the k-th data block. Therefore, each connectivity adjacency matrix is vectorized before they can be stacked in its data block. More specifically, the upper-triangular sub-matrix of each individual’s symmetric adjacency matrix (both structural and functional) is vectorized and stacked horizontally to produce the columns of each connectivity data block. Once created, this data block (matrix) is then object-mean centered (Marron & Dryden (Reference Marron and Dryden2021) and variance thresholded. Recall from Section 2, we use the terminology of data object to avoid potential ambiguities in what may also be termed an observation or observational unit. Specifically, this centering entails subtracting the column vector whose entries are the means of the entries in the corresponding rows of the data matrix. Moreover, since DIVAS is a subspace-based method which learns from features with sufficient variation, the variance thresholding removes any features with row variance less than some threshold,
$0.005$
 in this case.
A.2 Cognition and substance-use
Cognitive performance measures are collected according to the cognition battery of tests in the NIH Toolbox Gershon et al. (Reference Gershon, Wagster, Hendrie, Fox, Cook and Nowinski2013). Ultimately, this data block contains 45 tests of cognitive performance from reading comprehension to spatial awareness collected across 1206 subjects. Similarly, the substance use data block contains 36 self-reported traits ranging from frequency of alcohol use to age of first tobacco use. Variables in both blocks can vary substantially in magnitude. For example, the substance use block contains variables on both age of first drink and drinks per day. Therefore, both the cognition and substance use data blocks are object-mean centered, as described in Appendix A.1, and normalized (to unit variance, i.e., standardized) to further ensure that the scale of any one cognitive test or substance use measure is not dominating DIVAS modes of variation.
Missing data are encountered in both blocks but most severely in the self-reported substance use measures. Any trait missing greater than half of its corresponding observations is removed. This results in six tobacco and marijuana use traits being removed, leaving 30 total substance use traits. No traits are removed from the cognition data block. This leaves a very small minority of observations missing in each data block. Specifically, of the 30 variables remaining in the substance use block,
$15$
 had less than
$1\%$
had less than
$1\%$
 missing observations and no remaining variable exhibited more than
$5\%$
missing observations and no remaining variable exhibited more than
$5\%$
 missing observations. Likewise, of the
$45$
missing observations. Likewise, of the
$45$
 variables in the cognition data block,
$10$
variables in the cognition data block,
$10$
 exhibited no missing observations and all
$45$
exhibited no missing observations and all
$45$
 had fewer than
$1\%$
had fewer than
$1\%$
 missing. These remaining missing data, in both cognition and substance use, are filled using a simple row-mean imputation. Cognition and substance-use are the only two data blocks where missing data are found, and consequently where imputation is performed.
A.3 Genetics
HCP-YA participants provided blood samples from which a cell line could be created (Van Essen et al., Reference Van Essen, Ugurbil, Auerbach, Barch, Behrens, Bucholz, Chang, Chen, Corbetta, Curtiss, Della Penna, Feinberg, Glasser, Harel, Heath, Larson-Prior, Marcus, Michalareas, Moeller and Yacoub2012). SNPs are extracted from these cell lines and made available on the database of Genotypes and Phenotypes (dbGaP)Footnote
1
for each of 1141 subjects. We have the preprocessed SNP data using methods from Zhao et al. (Reference Zhao, Chang, Zhang and Zhang2022). Specifically, any subjects missing more than 10% of its SNPs are removed from consideration. Additionally, any SNPs containing more than 5% missing values, less than 5% minor allele frequency, and a Hardy–Weinberg equilibrium p-value less than
$1\times 10^{-6}$
 are excluded. The remaining data are further pruned using a linkage disequilibrium-based method resulting in 130,452 SNPs. This is still a prohibitively large data block for DIVAS. Therefore, we apply PCA to the SNP data to extract the first
$d=n$
are excluded. The remaining data are further pruned using a linkage disequilibrium-based method resulting in 130,452 SNPs. This is still a prohibitively large data block for DIVAS. Therefore, we apply PCA to the SNP data to extract the first
$d=n$
 principal components as the final traits. Recall that there are 130,452 traits (prior to PCA) and Section 2 details why
$n = 375$
principal components as the final traits. Recall that there are 130,452 traits (prior to PCA) and Section 2 details why
$n = 375$
 . Since the number of traits exceeds the number of human participants, this lossless PCA entails a mere rotation of our data in
$\mathbb {R}^n$
. Since the number of traits exceeds the number of human participants, this lossless PCA entails a mere rotation of our data in
$\mathbb {R}^n$
 . As such, the genetic data block consists of traits that represent linear combinations of the already preprocessed SNPs and should be interpreted with due care.
B DIVAS diagnostics and random direction bound
We present the full DIVAS diagnostics corresponding to the discovery and validations runs discussed in Section 2. Loadings diagnostics will be presented on the left and scores diagnostics on the right.
DIVAS loadings (left) and scores (right) diagnostic plot corresponding to discovery run. Blocks are ordered top-to-bottom as FC-SC-Cog-Use-Gene. Within each row, two angles are presented. The perturbation angle bound is denoted by the dashed line, and the random direction bound is denoted by the dot-dashed line.

Figure B1 Long description
A two-panel multi-plot display. The left panel is titled Joint Structure Loadings Diagnostics and the right panel is titled Joint Structure Score Diagnostics. Both panels share a common vertical structure of five rows representing data blocks: F C, S C, Cog, Use, and Gene.
Horizontal axes are categorized by interaction levels: 5-Way, 4-Way, 3-Way, 2-Way, and 1-Way. Data is visualized as vertical columns within these categories.
* Color Coding: Columns are colored to indicate block involvement: blue for S C, red for Cog and Use, and green for Gene. Gray columns indicate zero or low contribution.
* Data Points: Within the colored columns, black dots and crosses represent individual loadings or scores.
* Angular Bounds: Each row contains two sub-rows showing perturbation angles. A dashed line represents the perturbation angle bound, and a dot-dashed line represents the random direction bound. Numerical angle values (e.g., 78.9 degrees, 45.4 degrees) are printed next to the green Gene block columns.
* Bottom Section: A horizontal gray bar separates the main grid from a bottom row. In the loadings plot, the bottom row is labeled Effective Contribution of Traits with percentage markers at 25 percent, 50 percent, and 75 percent. In the scores plot, the bottom row is labeled Effective Number of Cases with numerical markers at 5, 25, and 125.
* Ranks: The far right of each panel lists numerical ranks corresponding to each block and interaction level, ranging from 0 to 375.
DIVAS loadings (left) and scores (right) diagnostic plot corresponding to validation run. This figure shows the extent to which results from the discovery set are reproduced in the validation set. Within each row, two angles are presented. The perturbation angle bound is denoted by the dashed line, and the random direction bound is denoted by the dot-dashed line.

Figure B2 Long description
Two panels titled Joint Structure Loadings Diagnostics and Joint Structure Score Diagnostics for F C, S C, Cog, Use, Gene (Valid). Both panels share a common x-axis categorized from left to right as 5-Way, 4-Way, 3-Way, 2-Way, 1-Way, and Ranks. The y-axis consists of five main horizontal rows, each containing sub-rows of data points.
Within the grid, columns are color-coded: blue, red, and green, while others are gray or white.
- Blue columns appear in the 3-Way section.
- Red columns are concentrated in the 2-Way section.
- Green columns are located in the 1-Way and Ranks sections.
Each cell contains black data points (dots and crosses). Two horizontal reference lines are present in cells with data: a dashed line representing the perturbation angle bound and a dot-dashed line representing the random direction bound. Numerical values and degree measurements (e.g., 78.8 degrees, 46.1 degrees) are printed to the right of the green columns.
A thick gray horizontal bar separates the main grid from a bottom row. The bottom row in the left panel is labeled Effective Contribution of Traits, and in the right panel, it is labeled Effective Number of Cases. These bottom sections show dense clusters of data points within the colored columns, with percentage markers (25%, 50%, 75%) on the far right of the loadings plot and numerical markers (5, 25, 125) on the scores plot.
Figure B1 shows the diagnostics corresponding to application of DIVAS to the discovery set with 375 subjects. Similar to Figure 2, each row represents a data modality, and each column represents a type of subspace. These plots distinctly offer increased rank information, angle diagnostics, and outlier assessments. More specifically, closer examination of the far right column of each subplot will reveal that there are three ranks presented. The second of these corresponds to the filtered rank which is the dimension of the estimated signal subspace for that data block and was the rank reported in Figure 2. The first and third ranks are the so-called final rank and maximum rank, respectively. The final rank describes the dimension of the subspace spanned by all structure (shared, partially shared, and individual) involving that block. It is often consistent with the filtered rank, though on occasion, the final rank can be larger than the filtered rank (as is the case for substance-use in Figure B1). The maximum rank is the largest possible dimension spanned by structure involving that data block, i.e.,
$p_k \wedge n$
 .
.
These diagnostics also give more detail on the angle bounds, in both object and trait space, used to segment these spaces. Within each pane, the dashed line represents the perturbation angle bound and the dot-dashed line represents the random direction angle bound, each described in detail in Prothero et al. (Reference Prothero, Jiang, Hannig, Tran-Dinh, Ackerman and Marron2024). Relative to these bounds, each direction in a particular subspace is represented by two points:
$\times $
 and
$\bullet $
and
$\bullet $
 . Any
$\times $
. Any
$\times $
 below the dashed perturbation angle bound is strong evidence that the direction can’t be ruled out as joint structure for that data block. Likewise, a
$\bullet $
below the dashed perturbation angle bound is strong evidence that the direction can’t be ruled out as joint structure for that data block. Likewise, a
$\bullet $
 above the dot-dashed random direction bound indicates strong evidence that the direction can’t be ruled out as an arbitrarily chosen direction with respect to that data block.
Finally, the last row of each subplot contains information on drivers of variability and potential outliers. That is to say, the left subplot of Figure B1 reports the effective contribution of traits used in segmenting a direction within a particular subspace. Similarly, the right subplot lists the effective number of cases used in segmenting a direction within a particular subspace, plotted on logarithmic scale. Any direction with a particularly small effective number of cases, indicates that this direction may be driven by an outlying data object. Similarly, any direction with a small effective contribution of traits indicates that the corresponding loadings should be driven by very few traits.
Figure B2 presents the analogous full diagnostic plots for the 377 subject HCP validation run. These diagnostics can be read in exactly the manner described above, so we will only take time to linger over the significance of the random direction bound. Again, this is the dot-dashed line near the top of each pane in both loadings and scores space. For example, the random direction bound, in loadings space, corresponding to the FC data block in the validation run is
$78.8^\circ $
 .
.
Recall that the random direction bound played a crucial role in assessing the reproducibility of subspaces within our principal angle analysis (Section 4.3). More carefully, the random direction bound used in column four of Table 4 is the minimum loading space random direction bound between original and validation runs. As an example for SC, the loadings space random direction bounds are
$80.6^\circ $
 (original) and
$80.7^\circ $
(original) and
$80.7^\circ $
 (validation), so our random direction bound threshold becomes
$80.6^\circ $
(validation), so our random direction bound threshold becomes
$80.6^\circ $
 . Any principal angle in an SC loading surpassing
$80.6^\circ $
. Any principal angle in an SC loading surpassing
$80.6^\circ $
 does not contribute positively to the fraction of principal angles surpassing random direction bound. We choose the minimum of the two random direction bounds to give a conservative estimate of reproducibility.
Lastly, Figure B3 provides a histogram and kernel density estimate for the common normalized scores associated with the rank 1 FC-SC-Use subspace that is analyzed in Section 4.2. As our scores are shared amongst all data blocks included in a shared (or partially shared) space, we only have one set of scores to depict. While we use the loadings in Section 4.2 for most of our interpretations, we present the scores here for completeness. As discussed below Figure 4, an individual with a large score will exhibit more red and fewer blue connections. Likewise this individual with a large score will exhibit a larger frequency of drinking 5+ and a smaller max drinks (past 12 months) (Figure 5).
Histogram and overlaid kernel density estimate of common normalized scores associated with rank 1 FC-SC-Use partially shared space. Shows unimodal structure and no outliers.

Figure B3 Long description
The horizontal X axis is labeled Common Normalized Scores and ranges from minus 0.2 to 0.25 with increments of 0.05. The vertical Y axis is labeled Density and ranges from 0 to 10 with increments of 2. The data consists of blue histogram bars and a smooth red curve representing the kernel density estimate. The distribution is unimodal and approximately bell-shaped, centered slightly to the left of zero. The highest density peak occurs between minus 0.05 and 0, reaching a Y value of approximately 8. The distribution tapers off on both sides, with the left tail ending near minus 0.15 and the right tail extending further to approximately 0.2, showing no significant outliers.
C Additional DIVAS notation and details
This appendix provides a fuller description of the DIVAS methodology discussed in Section 3.1. For full details, see Prothero et al. (Reference Prothero, Jiang, Hannig, Tran-Dinh, Ackerman and Marron2024).
C.1 Identifiability conditions
Let
$\left [\mathbf {V}_{\mathbf {i}} \right ]_{\mathbf {i}|\mathbf {i}\in S}$
 denote horizontal matrix concatenation
$\left [ \mathbf {V}_{\mathbf {i}_1} \cdots \mathbf {V}_{\mathbf {i}_{|S|}} \right ]$
denote horizontal matrix concatenation
$\left [ \mathbf {V}_{\mathbf {i}_1} \cdots \mathbf {V}_{\mathbf {i}_{|S|}} \right ]$
 of all matrices
$\mathbf {V}_{\mathbf {i}}$
of all matrices
$\mathbf {V}_{\mathbf {i}}$
 with
$\mathbf {i}\in S$
with
$\mathbf {i}\in S$
 .
.
Condition 1. Identifiability conditions for decomposition (3.2):
-
1. The columns of each $\mathbf {V}_{\mathbf {i}}$
 are orthonormal.
 -
2. For two different block index sets $\mathbf {i}\neq \mathbf {j}$
, if
$\mathbf {i}\subset \mathbf {j}$
or
$\mathbf {j}\subset \mathbf {i}$
, then the subspaces spanned by the columns of
$\mathbf {V}_{\mathbf {i}}$
and
$\mathbf {V}_{\mathbf {j}}$
in the trait space are orthogonal. -
3. The matrix $\left [\mathbf {V}_{\mathbf {i}}\right ]_{\mathbf {i}|\mathbf {i}\in 2^{\{1,\dots , K\}}}$
, concatenated over all
$\mathbf {i}\in 2^ {\{1,\ldots ,K\}},$
has rank equal to its number of columns. -
4. For all k, the matrix $\left [\mathbf {L}_{\mathbf {i},k}\right ]_{\mathbf {i}\,|\,k\in \mathbf {i}}$
, concatenated over all
$\mathbf {i}\in 2^ {\{1,\ldots ,K\}}$
so that
$k\in \mathbf {i}$
, has rank equal to its number of columns.


The columns of the loadings matrices
$\mathbf {L}_{\mathbf {i}, k}$
 are not required to be orthogonal and may have arbitrary magnitude in order to encode scale information. Under Condition 1, existence and uniqueness of decomposition (3.2) can be proven.
Theorem C.1. For a set of signal matrices
$\mathbf {A}_1,\dots ,\mathbf {A}_K$
 , there exists a set of matrices
$\mathbf {L}_{\mathbf {i},k}, \mathbf {V}_{\mathbf {i}}$
, there exists a set of matrices
$\mathbf {L}_{\mathbf {i},k}, \mathbf {V}_{\mathbf {i}}$
 satisfying (3.2) and identifiability Condition 1. The joint structure matrices
$\mathbf {A}_{\mathbf {i},k}=\mathbf {L}_{\mathbf {i},k}\mathbf {V}_{\mathbf {i}}^\top $
satisfying (3.2) and identifiability Condition 1. The joint structure matrices
$\mathbf {A}_{\mathbf {i},k}=\mathbf {L}_{\mathbf {i},k}\mathbf {V}_{\mathbf {i}}^\top $
 are uniquely determined for all
$\mathbf {i}\in 2^{\{1,\ldots ,K\}}$
are uniquely determined for all
$\mathbf {i}\in 2^{\{1,\ldots ,K\}}$
 and
$k\in \mathbf {i}$
and
$k\in \mathbf {i}$
 .
.
C.2 Signal extraction: initial rank and filtered frank
An estimate of the signal magnitude of
$\mathbf {X}_k$
 is recoverable from a shrunken SVD of
$\mathbf {X}_k$
is recoverable from a shrunken SVD of
$\mathbf {X}_k$
 . Random matrix theory provides numerous possible shrinkage functions, but we opt for a function proposed by Gavish & Donoho (Reference Gavish and Donoho2017). This function represents a compromise between hard and soft thresholding. In particular, the shrinkage function,

is applied, and the number of nonzero singular values is used to determine the initial signal rank,
$\hat {r}_k$
 . This procedure discriminates signal from noise fairly well, but as DIVAS is an angle-based approach, we find that additional angle-based rank selection is needed. Specifically, DIVAS chooses a filtered rank,
$\check {r}$
. This procedure discriminates signal from noise fairly well, but as DIVAS is an angle-based approach, we find that additional angle-based rank selection is needed. Specifically, DIVAS chooses a filtered rank,
$\check {r}$
 , such that the estimated maximum principal angles between true and estimated signal do not exceed
$\xi \theta _0$
, such that the estimated maximum principal angles between true and estimated signal do not exceed
$\xi \theta _0$
 , where
$\xi \in (0, 0.5]$
, where
$\xi \in (0, 0.5]$
 is a tuning parameter and
$\theta _0$
is a tuning parameter and
$\theta _0$
 is the random direction angle bound discussed in Prothero et al. (Reference Prothero, Jiang, Hannig, Tran-Dinh, Ackerman and Marron2024, Section 2.1.2). This filtered rank is the rank depicted in Figure 2 and is also used in specifying the constraints for the optimization problem in (C.2).
C.3 Joint space optimization problem
Let
$\check {r}_k$
 be the filtered rank defined in Appendix C.2. Let
$\mathbf {v}^{\star }$
be the filtered rank defined in Appendix C.2. Let
$\mathbf {v}^{\star }$
 be a candidate direction and
$\hat {\theta }_{Tk}$
be a candidate direction and
$\hat {\theta }_{Tk}$
 be the trait space angle between a candidate direction and the subspace spanned by the first
$\check {r}_k$
be the trait space angle between a candidate direction and the subspace spanned by the first
$\check {r}_k$
 columns of the
$k^{th}$
columns of the
$k^{th}$
 scores matrix. Also, let
$\hat {\theta }_{Ok}$
scores matrix. Also, let
$\hat {\theta }_{Ok}$
 be the object space angle between
$\mathbf {X}_k\mathbf {v}^{\star }$
be the object space angle between
$\mathbf {X}_k\mathbf {v}^{\star }$
 and the subspace spanned by the first
$\check {r}_k$
and the subspace spanned by the first
$\check {r}_k$
 columns of the
$k^{th}$
columns of the
$k^{th}$
 loadings matrix. Finally, let
$\hat {\phi }_k, \hat {\psi }_k$
loadings matrix. Finally, let
$\hat {\phi }_k, \hat {\psi }_k$
 be the trait space and object space angle perturbation bounds, discussed in Appendix C.3, and
$\mathfrak {V}_{\mathbf {j}}$
be the trait space and object space angle perturbation bounds, discussed in Appendix C.3, and
$\mathfrak {V}_{\mathbf {j}}$
 be the concatenation of scores matrices discussed in Section 3.2. (C.2) details this optimization problem:

The objective function minimizes the angle between candidate directions and the estimated trait space subspaces for a block collection. The constraints in (C.2) ensure that the candidate direction lies in the true signal subspace of an included block.
The perturbation angle bound determines a feasibility region around the trait space (object space) of
$\hat {\mathbf {A}}_k$
 which contains the true trait space of signal
$\mathbf {A}_k$
which contains the true trait space of signal
$\mathbf {A}_k$
 with high probability. The Angle Perturbation Theory Section (Section 2.1.2) of Prothero et al. (Reference Prothero, Jiang, Hannig, Tran-Dinh, Ackerman and Marron2024) presents derivations such bounds,
$\phi _k$
with high probability. The Angle Perturbation Theory Section (Section 2.1.2) of Prothero et al. (Reference Prothero, Jiang, Hannig, Tran-Dinh, Ackerman and Marron2024) presents derivations such bounds,
$\phi _k$
 in trait space and
$\psi _k$
in trait space and
$\psi _k$
 in object space. Thus, constraint 1 of (C.2) ensures that the trait space angle between a candidate direction and the subspace spanned by the first
$\check {r}_k$
in object space. Thus, constraint 1 of (C.2) ensures that the trait space angle between a candidate direction and the subspace spanned by the first
$\check {r}_k$
 columns of the
$k^{th}$
columns of the
$k^{th}$
 scores matrix should be at most the trait space angle perturbation bound
$\hat {\phi }_k$
scores matrix should be at most the trait space angle perturbation bound
$\hat {\phi }_k$
 for included blocks. Constraint 2 ensures this same angle is at least
$\hat {\phi }_k$
for included blocks. Constraint 2 ensures this same angle is at least
$\hat {\phi }_k$
 for excluded blocks. Finally, constraint 3 guarantees the object space angle between
$\mathbf {X}_k\mathbf {v}^{\star }$
for excluded blocks. Finally, constraint 3 guarantees the object space angle between
$\mathbf {X}_k\mathbf {v}^{\star }$
 and the subspace spanned by the first
$\check {r}_k$
and the subspace spanned by the first
$\check {r}_k$
 columns of the
$k^{th}$
columns of the
$k^{th}$
 loadings matrix should be at most the object space angle perturbation bound
$\hat {\psi }_k$
loadings matrix should be at most the object space angle perturbation bound
$\hat {\psi }_k$
 .
.
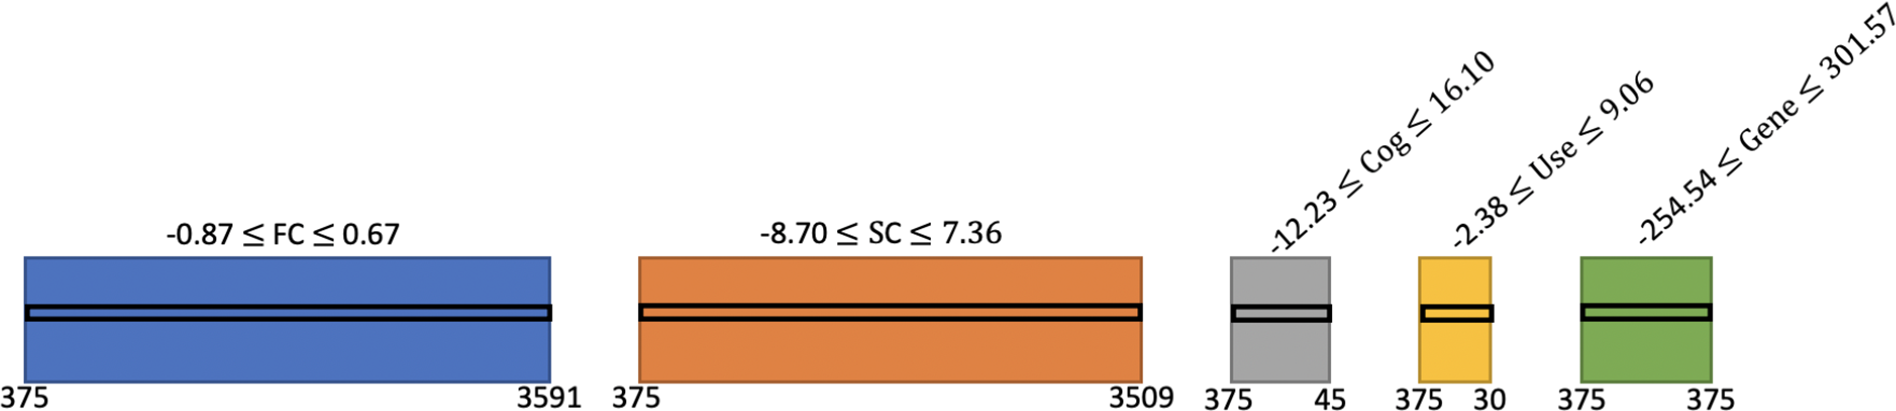
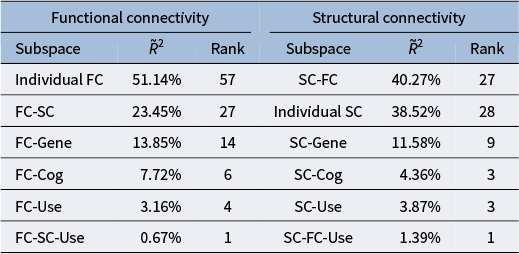
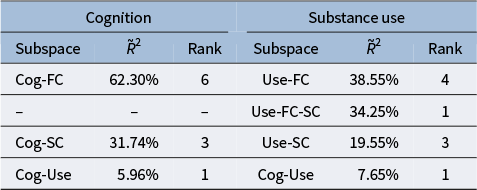

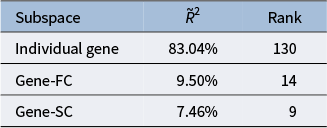


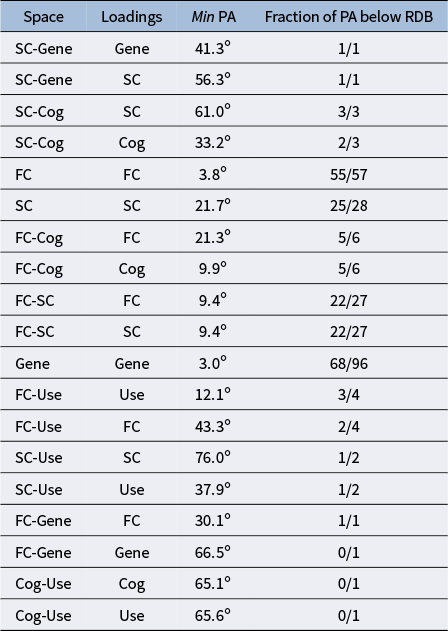


 Open access