

1 INTRODUCTION AND BACKGROUND
The Square Kilometre Array (SKA) is a proposed major internationally funded radio telescope (Dewdney et al. Reference Dewdney, Hall, Schilizzi and Lazio2009) which is expected to be completed in the next decade. It will be many times more sensitive than any existing radio telescope, covering centimetre to metre wavelengths, and will answer fundamental questions about the Universe by surveying the radio sky and studying individual objects in detail (Carilli & Rawlings Reference Carilli and Rawlings2004). It will consist of many antennas, constituting an effective collecting area of about one square kilometre, deployed over two sites in Australia and South Africa.
In the lead-up to the SKA, several next-generation radio telescopes and upgrades are being constructed around the world, including APERTIF (The Netherlands), ASKAP (Australia), e-MERLIN (UK), e-EVN (based in Europe), the Low Frequency Radio Array (LOFAR, The Netherlands), Meerkat (South Africa), the Murchison Widefield Array (MWA; Australia), and the Karl G. Jansky Very Large Array (VLA, USA). Large continuum surveys are being planned for many of these telescopes.
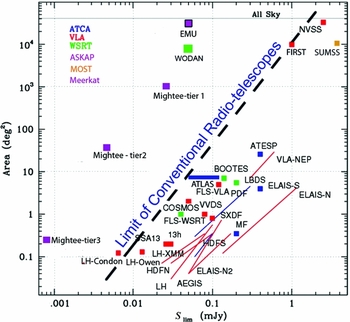
The predicted sensitivities and areas for these surveys are shown in Figure 1, alongside existing 1.4-GHz continuum radio surveys. The largest published radio survey, shown in the top right, is the wide but shallow NRAO VLA Sky Survey (NVSS; Condon et al. Reference Condon, Cotton, Greisen, Yin, Perley, Taylor and Broderick1998). The most sensitive published radio survey is the deep but narrow Lockman Hole observation (Owen & Morison Reference Owen and Morison2008) in the lower left, which has recently been overtaken by an even deeper observation of the same field (Condon et al. Reference Condon2012). All current surveys are bounded by a diagonal line that roughly marks the limit of available telescope time of current-generation radio telescopes. The region to the left of this line is currently unexplored, and this area of observational phase space presumably contains as many potential new discoveries as the region to the right.
Comparison of existing and planned deep 1.4-GHz radio surveys. The horizontal axis shows the 5σ sensitivity and the vertical axis shows the sky coverage. The diagonal dashed line shows the approximate envelope of existing surveys, which is largely determined by the availability of telescope time. For example, to extend NVSS to the sensitivity of EMU would have required over 600 years of (pre-upgrade) VLA time, so in practice this would not have been possible, and this line therefore represents a hard limit to the sensitivity of traditional surveys. The squares in the top left represent the new radio surveys discussed in this paper. Surveys at other frequencies are not shown in this diagram, as their relative sensitivity depends on the assumed spectral index of the sources, although we do include SUMMS at 843 MHz, without making any correction for spectral index. A similar comparison of low-frequency surveys can be found in Tingay et al. (Reference Tingay2012).
Most of these projects have multiple science goals, but they have one goal in common, which is to survey the radio continuum emission from galaxies, in order to understand the formation and evolution of galaxies over cosmic time, and the cosmological parameters and large-scale structures that drive it. In pursuit of this goal, the different teams are developing techniques such as multi-scale deconvolution, source extraction and classification, and multiwavelength cross-identification. Furthermore, these projects share specific scientific goals, some of which require further definition before a well-planned survey can be executed. Finally, each of these new instruments has different strengths, and coordination of surveys between them can help maximise the scientific return from each.
The radio continuum surveys planned for these instruments typically reach orders of magnitude deeper than traditional surveys. Consequently, the resulting surveys will be far more than just a deep version of existing surveys, but will be qualitatively different, in most cases being dominated by star-forming (SF) galaxies. For example, only a total of about 10 deg2 of the sky has been surveyed at 1.4 GHz to the planned 10 μJy beam−1 rms of many of these surveys, in fields such as the Hubble, Chandra, ATLAS, COSMOS, and Phoenix deep fields (Hopkins et al. Reference Hopkins2003; Huynh et al. Reference Huynh, Jackson, Norris and Prandoni2005; Biggs & Ivison Reference Biggs and Ivison2006; Norris et al. Reference Norris2006; Middelberg et al. Reference Middelberg2008b; Miller et al. Reference Miller, Fomalont, Kellermann, Mainieri, Norman, Padovani, Rosati and Tozzi2008; Schinnerer et al. Reference Schinnerer2007; Morrison et al. Reference Morrison, Owen, Dickinson, Ivison and Ibar2010; J. K. Banfield et al., in preparation; G. Guglielmino et al., in preparation; C. A. Hales et al., in preparation).
Surveys at this depth extend beyond the traditional domains of radio astronomy, where sources are predominantly radio-loud galaxies and quasars, into the regime of SF galaxies. At this depth, even the most common active galactic nuclei (AGNs) are radio-quiet AGNs, which make up most of the X-ray extragalactic sources. As a result, the role of radio astronomy is changing. Previous radio-astronomical surveys had their greatest impact in the niche area of radio-loud AGNs. For example, the numbers of sources in NVSS (Condon et al. Reference Condon, Cotton, Greisen, Yin, Perley, Taylor and Broderick1998) and FIRST (Becker, White, & Helfand Reference Becker, White and Helfand1995) are overwhelmingly dominated by AGNs, and only a small fraction of their sources are SF galaxies. In contrast, most sources detected by the next-generation surveys are SF galaxies, so that these surveys are dominated by the same galaxies as are studied by optical and infrared (IR) surveys. As a result, these next-generation radio surveys are an increasingly important component of multiwavelength studies of galactic evolution.
These surveys, however, will also encounter a new set of technical and scientific challenges. For example, the new continuum surveys such as the Evolutionary Map of the Universe (EMU; see Section 2.3) and the Westerbork Observations of the Deep APERTIF Northern-Sky (WODAN; see Section 2.1) should cover the whole sky at sensitivities previously attained only in small fields (~10 μJy beam−1 rms) by instantaneously covering wide fields (~30 deg2) with large bandwidths (~300 MHz) and long integration times (~12 h), and not by virtue of larger collecting areas or lower system noise temperatures. To reach the sensitivities predicted by the radiometer equation, these surveys must have exceptionally high dynamic ranges (e.g., about 42 db for EMU) and low systematic errors. This requires very high quality hardware, calibration techniques, and imaging algorithms. In particular, the primary beams must have <1% uncertainties in reconstructed position, size, and shape. The ASKAP dishes, for example, appear to have good surface and pointing accuracies, and their three-axis mounts maintain a constant footprint of the primary beam on the sky. The electronically formed primary beams of phased-array feeds also have to be very stable, and the survey astronomers need to work closely with the engineers to ensure that amplitude and phase calibration on strong sources in the array field of view (FOV) can be transferred from one primary beam to another. Finally, the success of a survey in the astronomical community depends as much on the survey results being made available to everyone in an easily-accessible fashion (such as through a web portal, or virtual observatory tools, and with useful and intuitive query engines) as on whether the survey actually meets every performance goal, such as sensitivity.
Moreover, some of these projects differ from earlier surveys in that one goal is to cross-identify the detected radio sources with major surveys at other wavelengths, and produce public-domain Virtual Observatory (VO) accessible catalogues as ‘value-added’ data products. This is facilitated by the growth in the number of major surveys spanning all wavelengths, discussed below in Section 4.6.
To address these challenges, a new group, the SKA PAthfinder Radio Continuum Survey (SPARCS) Working Group has been established, with the following goals:
-
• To coordinate developments of techniques, to avoid duplication of effort and ensure that each project has access to best practice.
-
• To hold cross-project discussions of the specific scientific goals, to ensure cross-fertilisation of ideas and optimum survey strategies.
-
• To coordinate the surveys in their choice of area, depth, location on the sky, and other survey parameters, to maximise the scientific return from the surveys.
-
• To distil the SKA pathfinder experiences in order to provide the most relevant and up to date input for SKA planning.
SPARCS was initially proposed during the SKA meeting in Manchester in 2010 March, was formed in 2010 May, and held its first meeting at the Lorentz Center in Leiden, The Netherlands, in 2011 February. This review paper documents the outcomes of that workshop, together with related developments since the workshop. The authors are the speakers and facilitators of the workshop, together with other domain experts who were unable to attend the workshop in person.
This paper describes the SKA pathfinder continuum surveys in Section 2, setting out their scientific goals in Section 3, and identifying the challenges to achieve these goals in Section 4. Section 5 concludes by summarising how these challenges are being addressed, and how SPARCS is helping to coordinate and facilitate this process. We refer to the collection of all surveys discussed in this paper as the SPARCS surveys, and the sources detected in those surveys as the SPARCS sources. We assume the convention for spectral index α that S∝να throughout.
2 PATHFINDERS AND THEIR CONTINUUM SURVEYS
2.1 APERTIF–WODAN
APERTIF, the new Phased Array Feed (PAF) receiver system for the Westerbork Synthesis Radio Telescope (WSRT), will dramatically enlarge the instantaneous FOV of the WSRT (Oosterloo et al. Reference Oosterloo, Verheijen, van Cappellen, Bakker, Heald and Ivashina2009) by replacing the current single front-end feeds by PAFs. Each of the PAFs consists of 121 Vivaldi elements and will detect the radiation field (in dual polarisation) in the focal plane of each dish over an area of about one square metre at an observing frequency of 1.4 GHz. Because of this, many beams can be formed simultaneously for each dish making it possible to image an area of about 8 deg2 on the sky, which is an increase of about a factor of 30 compared to the current WSRT. Its large 300-MHz bandwidth will not only cater for sensitive continuum imaging, but is also crucial for efficient H i and OH emission surveys and for studies of polarised emission from large areas.
The WODAN survey (Röttgering et al. Reference Röttgering2010b) will use APERTIF to survey the northern 25% of the sky (i.e. north of declination +30°) that is inaccessible to ASKAP, to a target rms sensitivity of 10 μJy beam−1 at a spatial resolution of 15 arcsec, although confusion noise with a 15- arcsec beam may increase the observed rms noise level to about 20 μJy beam−1.
2.2 APERTIF–BEOWULF and APERTIF– FRIGG
BEOWULF and FRIGG are both polarisation projects proposed for APERTIF.
The BEOWULF (B-field Estimation and Observational Wide-field Understanding of Large-scale Faraday-structure) survey (Scaife et al. Reference Scaife2010) will use APERTIF to survey an area of 64 deg2 within the Perseus-Pisces supercluster of galaxies in order to construct a finely spaced rotation measure (RM) grid tuned for cosmological and large-scale structure studies of magnetism within both clusters and the filamentary inter-cluster medium. This survey will complement other wide area polarisation surveys: by measuring RMs to 5000 background sources it will give an RM-grid sampling of 3.5 arcmin. The BEOWULF survey will provide vital insights into whether magnetic fields were primordial in clusters of galaxies, or whether the galaxies themselves later injected the field. The survey is ideally suited to APERTIF whose wide FOV enables observations of large-scale structures, and whose frequency coverage is well matched to the comparatively high RMs expected from such a region.
The FRIGG (Faraday Rotation Investigation of Galaxies and Groups) survey (Beck et al. Reference Beck2010) will observe large areas around four large northern nearby spiral galaxies, the bridge between M 31 and M 33, and five galaxy groups. Its goal is to measure grids of Faraday RMs of background sources and faint diffuse emission, in order to unravel the extent and dynamical importance of cosmic magnetic fields in galaxies and in intergalactic space in galaxy groups.
2.3 ASKAP–EMU
The Australian SKA Pathfinder (ASKAP; Johnston et al. Reference Johnston2007, Reference Johnston2008; Deboer et al. Reference Deboer2009) is a new radio telescope being built on the Australian SKA site in Western Australia, at the Murchison Radio-astronomy Observatory, with a planned completion date of 2013–14. It will consist of 36 12-metre antennas distributed over a region 6 km in diameter. Each antenna is equipped with a PAF (Bunton & Hay Reference Bunton and Hay2010) of 96 dual-polarisation pixels operating in a frequency band of 700–1800 MHz. As a result, ASKAP will have an FOV up to 30 deg2. To ensure good calibration, the antennas are a novel three-axis design, with the feed and reflector rotating to mimic the effect of an equatorial mount, ensuring a constant position angle of the PAF and sidelobes on the sky.
In continuum mode, ASKAP will observe a 300-MHz band, split into 1-MHz channels, with full Stokes parameters measured in each channel. The data will be processed in a multi-frequency synthesis mode, in which data from each channel are correctly gridded in the uv plane. As well as producing images and source catalogues, the processing pipeline will also measure spectral index, spectral curvature, and all polarisation products across the band. All data processing steps, from the output of the correlator to science-quality images, spectra, and catalogues, are performed in automated pipelines (Cornwell et al. Reference Cornwell2011) running on a highly distributed parallel processing computer. These steps include flagging bad data, calibration, imaging, source-finding, and archiving.
EMU (Norris et al. Reference Norris2011b) will use ASKAP to make a deep (10 μJy beam−1 rms) radio continuum survey of the entire southern sky, extending as far north as +30°. EMU will cover roughly the same fraction (75%) of the sky as the benchmark NVSS survey (Condon et al. Reference Condon, Cotton, Greisen, Yin, Perley, Taylor and Broderick1998), but will be 45 times more sensitive, and will have an angular resolution (10 arcsec) 4.5 times better. Because of the excellent short-spacing uv coverage of ASKAP, EMU will also have higher sensitivity to extended structures. Like most radio surveys, EMU will adopt a 5σ cut-off, leading to a source detection threshold of 50 μJy beam−1. EMU is expected to generate a catalogue of about 70 million galaxies, and all radio data from the EMU survey will be placed in the public domain as soon as the data quality has been assured.
Together, EMU and WODAN (see Section 2.1) will provide full-sky 1.3-GHz imaging at ~ 10–15 arcsec resolution to an rms noise level of 10 μJy beam−1, providing an unprecedented sensitive all-sky radio survey as a legacy for astronomers at all wavelengths. The EMU and WODAN surveys will overlap by a few degrees of declination to provide a comparison and cross-validation, to ensure consistent calibration, and to check on completeness and potential sources of bias between the surveys.
2.4 ASKAP-POSSUM
POSSUM (POlarisation Sky Survey of the Universe’s Magnetism) is an all-sky ASKAP survey of linear polarisation (Gaensler et al. Reference Gaensler, Landecker and Taylor2010). It is expected that POSSUM will be commensal with EMU, and that the two surveys will overlap considerably in their analysis pipelines and source catalogues. POSSUM will provide a catalogue of polarised fluxes and Faraday RMs for approximately three million compact extragalactic sources. These data will be used to determine the large-scale magnetic field geometry of the Milky Way, to study the turbulent properties of the interstellar medium (ISM), and to constrain the evolution of intergalactic magnetic fields as a function of cosmic time. POSSUM will also be a valuable counterpart to EMU, in that it will provide polarisation properties or upper limits to polarisation for all sources detected by EMU.
2.5 e-MERLIN
The e-MERLIN array (Garrington et al. Reference Garrington2004), operated by the University of Manchester, is a significant upgrade to the existing telescopes which form the MERLIN array in the UK. Consisting of seven telescopes, spread across the UK with a maximum baseline of 217 km, e-MERLIN provides high angular resolution (10–150 mas) imaging and spectroscopy in three broad cm-wavebands (1.3–1.8, 4–8, and 22–24 GHz). The e-MERLIN project includes a major upgrade to the existing telescope hardware, including the installation of new receivers, analogue and digital electronics, optical-fibre links to each telescope and a powerful new digital correlator at Jodrell Bank Observatory. This upgrade increases the usable bandwidth by more than two orders of magnitude, compared with the old MERLIN system, so that the continuum sensitivity is increased by a factor of between 10 and 30. In addition, the increase in bandwidth will enable multi-frequency synthesis, dramatically improving the uv coverage for continuum observations and enabling simultaneous spectral-index imaging.
The e-MERLIN upgrade is well underway with new receivers in service, the dedicated optical fibre network and the digital transmission equipment operational and returning 30 Gbit s−1 of data from each telescope back to a new correlator. Currently, e-MERLIN is undergoing the final stages of instrument commissioning and will be fully operational during 2013.
These upgrades to the system allow e-MERLIN to typically provide μJy sensitivity with up to 4 GHz of instantaneous bandwidth. This sensitive continuum imaging can be simultaneously combined with powerful spectral line and polarisation capabilities provided by the new highly flexible WIDAR correlator which is a twin of the new VLA correlator and has been developed by DRAO in Canada.
The e-MERLIN array is an important SKA pathfinder instrument covering a unique scientific niche due to its baseline lengths, which are intermediate between those provided by the VLA and VLBI arrays. Technically this provides a test-bed for the development of fibre-based data transport and time distribution over distances spanning many hundreds of kilometres. Scientifically, results stemming from its high angular resolution will provide significant input into the eventual locations of dish receptors as part of SKA Phase 1.
e-MERLIN is an open-user instrument with twice yearly proposal deadlines. As with many other new radio facilities, however, it has pre-allocated a large fraction of observing time to large key-science projects. Eleven large e-MERLIN ‘legacy’ projectsFootnote 1 have been allocated a total of 5000 h (approximately 50% of the available observing time) over the first five semesters of operation. These key projects span a wide range of astrophysics from studies of planet formation, pulsar proper motions, stars, nearby normal and SF galaxies, classical radio galaxies, strong gravitational lenses, galaxy clusters, and the physics of high-redshift star formation and AGN-dominated galaxies. In each of these programs, the strengths of e-MERLIN, in terms of its sensitivity and critically high angular resolution at centimetre wavelengths, are being exploited to provide a spatially resolved view of these sources, complementing studies planned or underway with other SKA pathfinder instruments, and new facilities at other wavelengths.
2.6 VLA
The Karl G. Jansky Very Large Array (VLA: Napier Reference Napier2006) represents a major upgrade to the VLA. Although the upgraded VLA was not designed to be a survey telescope or an SKA pathfinder, its high sensitivity, continuous frequency coverage, flexible wideband correlator, and scaled array configurations make the VLA a useful complement to the dedicated pathfinders, and to the all-sky continuum surveys that are being planned. For example, the VLA could observe ‘reference fields’ covering a few small areas of sky with higher angular resolution (e.g. 5 arcsec) and sensitivity (e.g. 5 μJy beam−1 rms) than the 1.4-GHz EMU and WODAN surveys in order to join those surveys seamlessly and provide a reference for resolution corrections, flux densities, positions, etc. of the faintest survey sources.
The VLA is a general-purpose user instrument, open to researchers around the world. The VLA upgrade is approaching completion, and algorithms for making 20-cm images with large fractional bandwidth and high dynamic range are now being tested on real data. The ultimate continuum sensitivity limits (source confusion or dynamic range) of the full SKA depend on the surface density on the sky of sub-μJy sources. If dynamic range permits, by imaging a single field at 20 cm to the confusion limit with 5- arcsec resolution, the VLA in its B configuration will place a tight statistical constraint on the source density of objects fainter than 1 μJy.
2.7 e-VLBI
The SKA will be a real-time instrument with preferably 25% of its collecting area forming long baselines that extend up to 3000 km. Data caching and transportation, distribution of the clock signal and operations of this array will present a great technical challenge. The European VLBI Network (EVN) as an SKA pathfinder is addressing these issues within the framework of the NEXPReS project (http://www.nexpres.eu/). The primary goal of NEXPReS is to support and develop real-time electronic-VLBI (e-VLBI) operations in the EVN and on global scales.
Science observations with the e-EVN have routinely been carried out since 2006. The possibility of operating a real-time VLBI array with baselines exceeding 12000 km was recently demonstrated by Giroletti et al. (Reference Giroletti2011). Relaxing the data storage limitations at the telescopes creates an obvious advantage for the EVN. This allows for more flexible operations to carry out transient science (see Section 3.7), it may provide seamless data transport at >1 Gbps data rates for superior sensitivity, and makes it possible to conduct automated observations for efficient VLBI surveys or to respond to external triggers.
The importance of long baselines (and even the possibility of baselines to space) for the SKA has been discussed by Fomalont & Reid (Reference Fomalont and Reid2004) and Gurvits (Reference Gurvits2004). Present-day observations of faint, compact radio sources are beginning to shed light on the science that could be done with one or two orders of magnitude better sensitivity. The mJy sky is thought to be dominated by AGNs, compact on milliarcsec scales, while in the sub-mJy regime SF galaxies become increasingly important, and a number of objects are now known which show both strong AGN activity and vigorous star formation activity (e.g. Afonso et al. Reference Afonso, Mobasher, Chan and Cram2001; Pérez-Torres et al. Reference Pérez-Torres, Alberdi, Romero-Cañizales and Bondi2010; Norris et al. Reference Norris, Lenc, Roy and Spoon2012). VLBI, and the long baselines of SKA, will play a key role in distinguishing between AGN and SF galaxies.
The long baselines of the SKA will be particularly important for studying the details of feedback processes between AGN and star formation (Croton et al. Reference Croton2006), the role of binary AGN mergers in galaxy evolution and feedback (e.g. Dotti, Sesana & Decarli Reference Dotti, Sesana and Decarli2012), the first supermassive black holes (SMBHs) at the highest redshifts (Falcke, Körding, & Nagar Reference Falcke, Körding and Nagar2004; Frey et al. Reference Frey, Paragi, Gurvits, Cseh and Gabányi2010, Reference Frey, Paragi, Gurvits, Gabányi and Cseh2011), and several other applications (see Godfrey et al. Reference Godfrey2012 for a review).
In traditional VLBI observations, the FOV was severely limited by time- and bandwidth smearing. Since the sub-mJy sky is densely populated with radio sources, VLBI observations are moving from the traditional mode of observing single, bright, widely-separated objects to a mode which allows observations of wide fields. This transition poses a significant technological challenge, because the combination of high resolution and wide fields requires high spectral and temporal resolution in correlation, to prevent loss of coherence arising from averaging effects (bandwidth and time smearing). Early wide-field VLBI experiments (e.g. Garrett, Wrobel & Morganti Reference Garrett, Wrobel and Morganti2005) were limited by the hardware VLBI correlators and by limited computing resources. Recently, software correlators running on cheap commodity computers have provided the power and flexibility needed for VLBI observations of wide fields (Deller et al. Reference Deller2011).
Since sources detectable with VLBI, even in the sub-mJy regime, are relatively sparsely distributed, it has proved to be more efficient to generate multiple phase centres with small FOVs directed towards known locations of radio emission, rather than to image huge blank portions of the sky. Alternative, equivalent approaches have also been proved to be successful (Morgan et al. Reference Morgan, Mantovani, Deller, Brisken, Alef, Middelberg, Nanni and Tingay2011). The multi-phase centre technique has only recently been brought to production (Middelberg et al. Reference Middelberg2011b) but has already demonstrated that galaxies can contain a radioactive AGN even when an AGN is not evident in comprehensive radio, optical, and X-ray observations (Middelberg et al. Reference Middelberg2012).
Wide-field VLBI observations require new calibration steps to reach the full sensitivity of the data, such as primary beam corrections and multi-phase centre self-calibration, which help to make the technique useful for a wide range of applications. For example, the multi-phase centre technique can be used to image many sources around a faint target to aid in self-calibration. While no single source may be sufficiently strong for self-calibration, the ensemble of sources can provide a robust solution. The technique may also be used to provide an astrometric reference, or to image many background sources to probe a foreground object.
2.8 LOFAR
LOFAR, the Low Frequency Radio Array, is a pan-European radio phased-array telescope that is currently being commissioned. The two types of antennas, one optimised for 30–80 MHz and the other for 110–240 MHz, are grouped together in stations the size of soccer fields. Forty stations are distributed over an area of diameter of 100 km in the Netherlands, and a further eight stations are located in Germany, UK, Sweden, and France. The signals from the antennas are digitised to form many beams on the sky, making LOFAR an extremely efficient survey instrument. LOFAR has already generated images that are the deepest ever at these low frequencies.
A key motivation of LOFAR is to provide the entire international astronomical community with surveys of the radio sky that have a long-lasting legacy value for a broad range of astrophysical research. The LOFAR continuum survey (Röttgering et al. Reference Röttgering2010a) will cover the northern half of the sky (i.e. north of declination 0°). LOFAR will be especially complementary to WODAN and EMU in surveying the sky at high sensitivity and resolution but at a much lower frequency.
The three fundamental areas of astrophysics that have driven the design of the planned LOFAR surveys are (i) the formation of massive galaxies at the epoch of reionisation (EoR), (ii) magnetic fields and shocked hot gas associated with the first bound clusters of galaxies, and (iii) star formation processes in distant galaxies. The areas, depths, and frequencies of the surveys have been chosen to contain (i) ~100 powerful radio galaxies close to or at the EoR, (ii) ~100 radio haloes at the epoch when the first massive bound galaxy clusters appeared, and (iii) ~100 protoclusters. The resulting survey parameters are based on estimates of luminosity functions for powerful radio galaxies by Wilman et al. (Reference Wilman2008), for radio haloes by Enßlin & Röttgering (Reference Enßlin and Röttgering2002) and Cassano et al. (Reference Cassano, Brunetti, Röttgering and Brüggen2010b), and for protoclusters by Venemans et al. (Reference Venemans2007).
To achieve the goals of the LOFAR surveys, a three-tiered approach has been adopted (Röttgering et al. Reference Röttgering2010a). Tier 1 is a 2π steradian survey reaching an rms of 0.07 mJy at 15–65 and 120–180 MHz, and is designed to detect ~100 cluster haloes at z>0.6 and ~100 z > 6 radio galaxies. Tier 2 is a deep survey over 500 deg2 at 30, 60, and 150 MHz. At 150 MHz, this will require 55 pointings, to be centred on the following science targets:
-
• 25 well-studied extragalactic fields with superb existing multiwavelength data;
-
• 15 fields centred on clusters or superclusters;
-
• 15 fields centred on nearby galaxies.
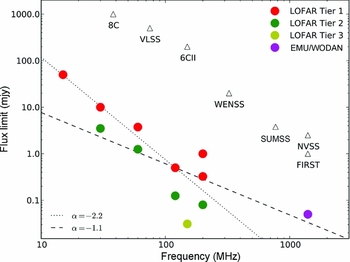
Tier 3 is an ‘ultra-deep’ survey at 150 MHz covering a single pointing of 100 deg2 reaching the confusion level of 7 μJy beam−1 rms. Figure 2 shows the resulting depth versus frequency.
Flux limits (5σ) of the proposed LOFAR surveys compared with other radio surveys. The triangles represent existing surveys. The lines represent different power laws (with α = −1.6 and −0.8) to illustrate how, depending on the spectral indices of the sources, the LOFAR surveys will compare with others.
WODAN and EMU have an enormous synergy with the LOFAR surveys: virtually all the 5×10⁷ radio sources from the LOFAR all-sky surveys will have their flux density at 1 400 MHz measured (i.e. Figure 1). Together they will yield data for all radio loud AGNs in the northern hemisphere and most luminous starbursts up to z = 2. The resulting densely populated radio colour–colour diagrams will be a powerful tool to spectrally discriminate between very rare radio sources with extreme radio spectra, such as diffuse emission from clusters and very distant radio galaxies. Nearby resolved sources will have spectral index and spectral curvature maps, a very rich source of information to constrain many physical parameters. As the combined surveys will cover the entire sky, measurements of the integrated Sachs–Wolfe (ISW) effect, galaxy auto-correlation functions, and cosmic magnification will substantially tighten cosmological model parameters (Raccanelli et al. Reference Raccanelli2011).
LOFAR will also support a Key Science Project on Cosmic Magnetism (MKSPFootnote 2 ), which is likely to make significant contributions to our knowledge of the magnetic sky (see Section 3.5).
2.9 MeerKAT/Mightee
MeerKAT (Jonas Reference Jonas2009) is the South African SKA pathfinder telescope. MeerKAT Phase 1 will consist of 64 dishes, each 13.5 m in diameter, equipped with single-pixel receivers. An offset Gregorian dish configuration has been chosen because the unblocked aperture provides good optical performance, sensitivity, and imaging quality. It also facilitates the installation of multiple receiver systems in the primary and secondary focal areas. MeerKAT’s 64-dish array layout will be distributed over two components. A dense inner component will contain 70% of the dishes with a Gaussian uv distribution with a dispersion of 300 m. The outer component will contain the remaining 30% of the dishes, having a Gaussian uv distribution with a dispersion of 2 500 m and a longest baseline of 8 km. A potential future extension (MeerKAT Phase 2) could see seven additional dishes being added to extend the longest baselines to about 20 km. MeerKAT will support a wide range of observing modes, including deep continuum, polarisation and spectral line imaging, pulsar timing, and transient searches. The plan is to provide standard data products, including an imaging pipeline. A number of ‘data spigots’ will also be available to support user-provided instrumentation.
Seventy per cent of observing time on MeerKAT, for the first few years, is allocated for large survey projects of 1 000 h or more, while the remaining 30% is reserved for smaller PI-driven proposals (of which 5% will be director’s discretionary time). Proposals for key projects were solicited in 2010, and 10 projects were selected. Two (a pulsar timing and a deep H i survey) were chosen as top priority, and a further eight as second priority, one of which is MIGHTEE.
The MIGHTEE survey (van der Heyden & Jarvis Reference Van der Heyden and Jarvis2010) aims to probe to much fainter flux densities (0.1–1 μJy beam−1 rms) than the EMU/WODAN surveys, over smaller areas (~35 deg2) at higher angular resolution, at an observing frequency of 1.4 GHz. The higher sensitivity and resolution will enable exploration of AGN, SF galaxies, and galaxy clusters from the EoR through to the present day. The MIGHTEE survey strategy will follow a three-tiered approach both in survey area and in sensitivity, using the longer baselines to be able to probe below the confusion limit of the shorter baseline surveys such as EMU and WODAN.
Tier 1 will cover 1 000 deg2 using MeerKAT Phase 1 at 1.4 GHz to a target rms flux density of 5 μJy beam−1. This will allow detailed studies of the distant Universe and the evolution of the lower luminosity radio source populations into the EoR. Tier 2 will exploit the longer baselines of MeerKAT Phase 2 and increased bandwidth to observe a single 35 deg2 pointing down to 1 μJy beam−1 rms. This will enable studies of the evolution of Milky Way-type galaxies up to z ~ 4 and pioneering weak lensing analyses at radio wavelengths. These observations will also be used to test techniques to increase dynamic range in preparation for the full SKA. Tier 3 will cover a much smaller area (1 deg2) to 0.1 μJy beam−1 rms. This will allow us to isolate the level of AGN activity in SF galaxies and to investigate the morphological properties of AGN from z ~ 0.5 to ~6.
2.10 Murchison Widefield Array
The MWA (Lonsdale et al. Reference Lonsdale2009; Tingay et al. Reference Tingay2012) is a low-frequency synthesis telescope under construction at Boolardy, Western Australia, adjacent to ASKAP. It is due for completion in 2013, making it the first of the SKA precursor telescopes to commence full operation. It consists of 2048 dual-polarisation dipole antennas, arranged as 128 ‘tiles’, each consisting of a 4 × 4 array of dipoles designed to operate in the 80-300 MHz frequency range. Each tile performs an analogue beam-forming operation, narrowing the FOV to an electronically steerable 25° at 150 MHz. The majority of the tiles (112) are scattered across a roughly 1.5-km core region, forming an array with very high imaging quality, and an FOV of several hundred square degrees at a resolution of several arcmin. The remaining 16 tiles are located outside the core, yielding baselines up to 3 km to allow higher angular resolution. The MWA calibration and imaging is undertaken on 24 IBM iDataPlex dual Xeon servers, each housing 2 NVIDIA Tesla M2070 Graphics Processing Units. The correlated data are calibrated in real time using novel position-dependent self-calibration algorithms.
MWA is focused on four key science projects (Bowman et al. Reference Bowman2012): (a) the detection and characterisation of three-dimensional brightness temperature fluctuations in the 21-cm line of neutral hydrogen during the EoR at redshifts from 6 to 10, (b) solar imaging and remote sensing of the inner heliosphere via propagation effects on signals from distant background sources, (c) high-sensitivity exploration of the variable radio sky, and (d) wide-field galactic and extragalactic astrophysics including a deep all-sky survey over the MWA frequency range with full polarimetry and spectral resolution. An initial survey of 2 400 deg2 on the prototype ‘32T’ system has recently been completed (Bernardi et al. Reference Bernardi2012) and a full sky survey south of +30° is being planned for the full array.
2.11 Other survey telescopes
We acknowledge that many other radio telescopes, such as the Giant Metre Wave Radio Telescope (GMRT; Ananthakrishnan & Pramesh Rao Reference Ananthakrishnan and Pramesh Rao2001) and the Very Long Baseline Array (VLBA; Napier et al. Reference Napier1994), are also making very significant contributions both to the continuum survey science and to the survey techniques necessary for the SKA, but are outside the scope of this paper.
3 SCIENCE GOALS
3.1 The radio sky
The goal of most SKA pathfinder radio continuum surveys is to make a deep radio continuum survey of a significant fraction of the sky. For example, EMU and WODAN together will cover the entire sky at 1.4 GHz to a depth of about 10–15 μJy beam−1 rms with an angular resolution of 10–15 arcsec. LOFAR will complement this with a low-frequency survey of comparable intrinsic sensitivity, and VLA and MeerKAT will be able to probe individual objects, or survey smaller areas, to a much greater depth. The largest comparable survey currently existing is the benchmark NVSS survey (Condon et al. Reference Condon, Cotton, Greisen, Yin, Perley, Taylor and Broderick1998), compared with which EMU plus WODAN will be about 40 times more sensitive, with an angular resolution about four times better, and with higher sensitivity to extended structures. EMU and WODAN together are expected to detect and catalogue about 100 million sources.
At the sensitivity level of these surveys, the radio sky has already been studied by a number of deep surveys, and the flux-density-dependent surface-density statistics have been extensively measured (Figure 3). However, these surveys cover a total of only a few square degrees (Hopkins et al. Reference Hopkins2003; Huynh et al. Reference Huynh, Jackson, Norris and Prandoni2005; Biggs & Ivison Reference Biggs and Ivison2006; Norris et al. Reference Norris2006; Middelberg et al. Reference Middelberg2008b; Miller et al. Reference Miller, Fomalont, Kellermann, Mainieri, Norman, Padovani, Rosati and Tozzi2008; Schinnerer et al. Reference Schinnerer2007; Morrison et al. Reference Morrison, Owen, Dickinson, Ivison and Ibar2010; J. K. Banfield et al., in preparation; Guglielmino et al., in preparation; C. A. Hales et al., in preparation). We know broadly what types of galaxy we will detect, and their approximate redshift distribution (see Figure 4) but a number of significant questions remain:
-
• What types of object dominate the source counts at low fluxes?
-
• Are there undiscovered populations?
-
• What causes the scatter between different surveys at low fluxes?
-
• Do we need better simulations to guide research in this area?
-
• How do environment and large-scale structure affect the evolution of radio sources?
The Euclidean normalised differential radio source counts at 1.4 GHz, based on and updated from the distribution shown in Hopkins et al. (Reference Hopkins2003). The solid curve is the polynomial fit from Hopkins et al. (Reference Hopkins2003), and the dashed curve is an updated polynomial fit. The horizontal dot–dashed line represents a non-evolving population in a Euclidean universe. The shaded region shows the prediction based on fluctuations due to weak confusing sources ( a ‘P(D) analysis’) from Condon (Reference Condon1974) and Mitchell & Condon (Reference Mitchell and Condon1985).

Expected redshift distribution of sources with S 1.4>10 μJy beam−1, based on the SKADS simulations (Wilman et al. Reference Wilman2008, Reference Wilman, Jarvis, Mauch, Rawlings and Hickey2010). The five lines show the distributions for SF galaxies (SFG), starburst galaxies (SB), radio-quiet quasars (RQQ), and radio-loud galaxies of Fanaroff–Riley types I and II (FRI and FR2; Fanaroff & Riley Reference Fanaroff and Riley1974). The vertical scale shows the total number of sources expected to be detected.

At high flux densities, the source counts (Figure 3) are dominated by AGNs, following a smooth power-law distribution from Jansky levels down to about 1 mJy. Below 1 mJy, the normalised source counts flatten, suggesting an additional population of radio sources. The source counts below 1 mJy are less well constrained, with a scatter between different surveys which can reach a factor of ~2–3.
While some fraction of this scatter may be due to cosmic variance (e.g. I. Prandoni et al., in preparation), that cannot be the only cause. For comparison, in the X-ray band, the scatter between the GOODS North and South fields is only ~25% (~3σ). Furthermore, Condon et al. (Reference Condon2012) have shown that some of the largest variations can be accounted for by errors in the many necessary corrections for effects such as resolution bias, clean bias, Eddington bias, and completeness corrections, together with imaging errors such as excessive deconvolution, bandwidth smearing, and insufficient beam sampling in the image plane. There is also an inconsistency in that some authors measure the numbers of radio components, while other measure the numbers of sources, each of which may consist of several components, the numbers of which in turn may vary as a function of flux density.
Resolving this discrepancy is critical, since this factor of 2–3 scatter introduces large uncertainties in the comparison of observed number counts with detailed, model-based predictions. Obviously, radio surveys need to move beyond the small-area surveys that have previously dominated the literature. It is also essential that, before the large radio surveys start, we obtain consensus on how to image and analyse radio survey data to produce reliable and consistent source flux densities and source counts.
3.1.1 The radio sky at μJy levels: AGN or star formation?
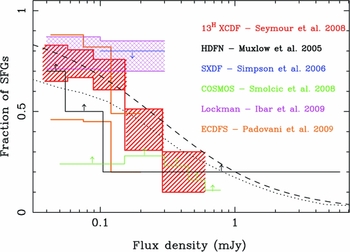
After years of intense debate, it is now clear that while SF galaxies contribute significantly to the sub-mJy counts, they do not dominate it above ~200μJy. Recent results (e.g. Seymour et al. Reference Seymour2008; Smolčić et al. Reference Smolčić2008; Padovani et al. Reference Padovani, Mainieri, Tozzi, Kellermann, Fomalont, Miller, Rosati and Shaver2009), which are summarised in Figure 5, show that both SF galaxies and AGNs contribute significantly to the source counts. About half of these AGNs are radio-quiet, characterised by relatively low radio-to-optical flux density ratios and radio powers, as compared with radio quasars (see also Prandoni Reference Prandoni2010). Above 1 mJy, the contribution of radio-quiet objects to the source counts is insignificant, and they are dominated by radio-loud AGNs.
Differential fraction of SF galaxies as a function of 1.4-GHz flux density, taken from Norris et al. (Reference Norris2011b). Shaded boxes, and the two lines for Padovani et al., show the range of uncertainty in the survey results. Arrows indicate constraints from other surveys. These results show that the fraction of SF galaxies increases rapidly below 1 mJy and, at the 50 μJy survey limit of EMU/WODAN, about 75% of sources will be SF galaxies.
To probe the radio-quiet AGN component, it is therefore necessary to analyse the deepest radio fields (S ≤ 100 − 200 μJy), where most sources are typically associated with SF galaxies. Radio-quiet AGNs share many properties with SF galaxies: they have similar radio luminosities (1022–1024 W Hz−1), steep radio spectra (α < −0.5), and similar infrared/radio flux ratios (e.g. Roy et al. Reference Roy, Norris, Kesteven, Troup and Reynolds1998).
In addition, radio-quiet AGNs are often associated with faint optical galaxies characterised by Seyfert-2-like spectra, containing both SF and AGN components. Even when available, if optical spectroscopy is not of sufficient quality, it can be difficult to derive reliable emission line ratios, and distinguish between starburst and Seyfert 2 spectra, through BPT (Baldwin, Phillips, & Terlevich Reference Baldwin, Phillips and Terlevich1981) diagrams (see e.g. Prandoni et al. Reference Prandoni, Morganti and Mignano2009). This makes it difficult to distinguish radio-quiet AGNs from SF galaxies, even with multiwave length information, although the availability of X-ray data can help (Padovani et al. Reference Padovani, Miller, Kellermann, Mainieri, Rosati and Tozzi2011).
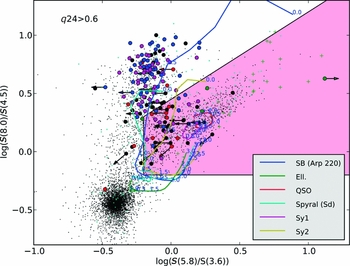
Spitzer IRAC colours, when available, can be very effective in separating radio-quiet AGNs from SF galaxies as shown in Figure 6, where the well-known IRAC colour–colour plot (Lacy et al. Reference Lacy2004) is exploited for the First Look Survey (FLS) deep radio field. A fraction of sources with typical AGN IRAC colours appear to be genuine radio-quiet AGNs, and account for ~45% of the overall AGN component in the FLS.
IRAC colour–colour plot of the FLS radio sources with q 24 = log (S 24μ/S 1.4GHz > 0.6 (filled symbols), from Prandoni et al. (Reference Prandoni, Morganti and Mignano2009). Colours refer to optical spectral classification: SF galaxies (blue); narrow/broad line AGNs (green); early-type galaxies (red); galaxies with narrow emission line, which do not have a secure optical classification (magenta); sources with no optical spectroscopy available (black). Arrows indicate upper/lower limits. The lines indicate the expected IRAC colours as a function of redshift for different source types (see legend). The expected location for AGNs is highlighted in pink. For reference, we also show IRAC colours of (a) all FLS IRAC-identified radio sources (no optical identification selection applied, cyan dots); (b) the entire FLS IR-selected star/galaxy population (no radio selection applied, black dots); and (c) a sample of high-redshift obscured (type-2) quasars (Martinez-Sansigre et al. Reference Martinez-Sansigre2006), green crosses.
A number of other methods can also be used to distinguish AGNs from SF galaxies in radio surveys (e.g. Norris, Middelberg, & Boyle Reference Norris, Middelberg and Boyle2008), including
-
• radio morphology (e.g. Biggs & Ivison Reference Biggs and Ivison2008; Biggs, Younger & Ivison Reference Biggs and Ivison2010),
-
• radio spectral index (e.g. Ibar et al. Reference Ibar, Ivison, Biggs, Lal, Best and Green2009, Reference Ibar, Ivison, Best, Coppin, Pope, Smail and Dunlop2010),
-
• radio–far-infrared ratio (e.g. Norris et al. Reference Norris2006; Middelberg et al. Reference Middelberg2008b),
-
• radio–near-infrared ratio (e.g. Willott et al. Reference Willott, Rawlings, Jarvis and Blundell2003),
-
• radio polarisation (e.g. C. A. Hales et al., in preparation),
-
• radio variability (e.g. Norris et al. Reference Norris, Middelberg and Boyle2008; Chatterjee et al. Reference Chatterjee and Murphy2010; Murphy et al. Reference Murphy2012),
-
• optical and IR colours, including the use of spectral energy distribution (SED) templates (e.g. Lacy et al. Reference Lacy2004),
-
• optical line ratios (e.g. Baldwin et al. Reference Baldwin, Phillips and Terlevich1981),
-
• X-ray hardness ratio (e.g. Rosati et al. Reference Rosati2002),
-
• X-ray power (e.g. Padovani et al. Reference Padovani, Miller, Kellermann, Mainieri, Rosati and Tozzi2011),
-
• radio source brightness measured by VLBI (e.g. Kewley et al. Reference Kewley, Heisler, Dopita, Sutherland, Norris, Reynolds and Lumsden2000; Parra et al. Reference Parra, Conway, Aalto, Appleton, Norris, Pihllström and Kewley2010; Alexandroff et al. Reference Alexandroff2012).
None of these techniques is foolproof and universal, and a combination of techniques is necessary to provide unambiguous classification. In preparation for the daunting task of classifying tens of millions of radio sources, we need to define reliable methods for classifying radio sources.
3.1.2 Composite galaxies
It is well established (e.g. Roy et al. Reference Roy, Norris, Kesteven, Troup and Reynolds1998) that the radio emission from Seyfert galaxies contains significant contributions from both AGN and SF activity, and there is growing recognition (Norris et al. Reference Norris, Middelberg and Boyle2008; Lutz et al. Reference Lutz2010; Shao et al. Reference Shao2010; Seymour et al. Reference Seymour2011) that this may also be true of high-luminosity galaxies, particularly at high redshift. Many of these galaxies are not simply ‘star-forming’ or ‘AGNs’ but include a significant contribution from both. In extreme cases (Norris et al. Reference Norris, Lenc, Roy and Spoon2012), a galaxy may appear to be ‘pure AGN’ at one wavelength and ‘pure SF’ at another.
Particularly at high redshifts, such composite AGN/SF systems constitute a significant fraction of radio sources, and so a simple classification into AGN or SF galaxy is inadequate. Instead, the contribution to the galaxy’s luminosity from both AGN and SF activity must be assessed, to measure the relative contributions from underlying physical properties such as black hole and galaxy mass, star-formation rate (SFR), environment, etc. However, the relative contribution will vary depending on the observing band, and so comprehensive multiwavelength data are required. However, such detailed information will be hard to obtain for very large samples, perhaps necessitating a simpler classification scheme, which may lead to oversimplifications or even to incorrect interpretation of the data.
It is therefore essential to develop methods which fit the SED of a given radio source with both a starburst and AGN component (e.g. Afonso et al. Reference Afonso, Mobasher, Chan and Cram2001). This approach is clearly only possible for fields with good multiwavelength data, but will inform analysis of fields with lower quality ancillary data. Observations from Spitzer and Herschel cover the bulk of the energy output of most galaxies and can be used to distinguish the starburst and AGN components. For example, the far-IR is directly related to the SFR, and, if the FIR–radio correlation remains true at all redshifts (e.g. Mao et al. Reference Mao, Huynh, Norris, Dickinson, Frayer, Helou and Monkiewicz2011a, and references therein), can be used to determine what fraction of the radio emission is due to star formation. Hence, the remaining radio emission would be due to AGN activity. The AGN bolometric luminosity can be estimated from the mid-IR component which is not necessarily proportional to the AGN emission at radio wavelengths. Once the starburst and AGN fractional contribution to individual sources are determined, it is possible to construct derived results such as luminosity functions and relative contributions by type to the source counts.
3.1.3 Are there undiscovered populations of radio sources?
The cosmic radio background (CRB) has been well studied at high frequencies by instruments such as COBE and WMAP, but is less well studied at low frequencies.
Fixsen et al. (Reference Fixsen2011) measured the background sky temperature at five frequencies between 3 and 90 GHz using an in situ calibrator on board the balloon-borne ARCADE2 experiment. These authors found an excess radio sky temperature above that due to the cosmic microwave background (CMB) below 10 GHz. The CRB was measured to have an excess of 50±7 mK at 3.3 GHz above a CMB temperature of 2.730 ± 0.004 K, which is a factor of five higher than expected from known source populations.
The ARCADE2 result is either due to an instrumental or calibration problem (e.g. incorrectly subtracting the Galactic foreground emission), or it is a startling result which will necessitate a drastic revision of our models of extragalactic radio sources. Given that Fixsen et al. (Reference Fixsen2011) appear to have taken careful steps to avoid errors, there is a prima facie case that this result is correct, and the radio-astronomical community has been galvanised to search for this putative new population. Since it is inconsistent with known radio source populations (e.g. De Zotti et al. Reference De Zotti, Massardi, Negrello and Wall2010; Padovani Reference Padovani2011), it must, if confirmed, be caused by another population. For example, the radio emission could be caused by dark matter annihilation (Fornengo et al. Reference Fornengo, Lineros, Regis and Taoso2011), in which case the emission would trace the dark matter distribution of cluster galaxies, resulting in a scale size of ~ arcmin. Other mechanisms are also possible, such as diffuse emission from clusters or haloes, or very low surface brightness emission from extended AGN radio lobes, or from a population of dwarf galaxies.
Condon et al. (Reference Condon2012) have conducted a deep survey with the VLA which shows that the ARCADE2 result cannot be caused by a population of compact objects spatially associated with galaxies. It is therefore either due to a diffuse population of objects which cannot be detected with the shortest baselines of the VLA observations, or they are due to an instrumental or calibration error. A number of observational programs continue with the VLA and ATCA to determine the cause of this result.
3.1.4 Simulations
There is widespread agreement that the SKADS continuum sky (Wilman et al. Reference Wilman2008) represents the current state of the art in simulations of the radio sky. Such simulations have two distinct functions.
-
• They represent useful approximations to the real sky which can be used to test algorithms and design surveys.
-
• They can be viewed as an attempt to encapsulate the current ‘best knowledge’ of the sky, and can therefore be used to test models of radio source evolution.
These two functions have different implications for future updates of the SKADS continuum sky. For example, the SKADS continuum sky was constructed from the best information then available of the radio luminosity functions (RLFs) of different populations of radio objects, and deeper and wider surveys have since become available. The SKADS simulation also assumes that sources are members of distinct populations, omitting the composite sources in which both star formation and AGN activity contribute to their radio luminosity. Such small differences from the real sky are unlikely to be important for the design of a survey, but will be important if SKADS is to be used to test theoretical models.
A useful, and relatively simple, modification to the SKADS continuum sky would be to change the assumed luminosity function for one or more of the populations in order to assess how that might influence the results of various continuum surveys. This change might be implemented in a parametric way, allowing users to specify parameters of a luminosity function.
More difficult would be an attempt to incorporate ‘best knowledge’, with the aim of producing ‘realistic’ sky images. Experience from the Herschel mission bolsters the concern that identifying and incorporating information can be extremely difficult. Similarly, incorporating polarisation information would be useful, so that one could calculate Faraday RMs, but would be quite difficult in practice because of the need to trace the geodesic of a photon in order to determine the RM. Nevertheless, there are efforts underway to insert realistic source shapes into the SKADS sky, and the SKADS team is investigating how to add the signature of the cosmic dipole.
It would be very useful to include models of more complex structures in the SKADS sky, such as those of large radio sources, diffuse cluster sources, and structures near the Galactic plane, which could potentially limit the lowest Galactic latitude to which an ‘all-sky’ survey could probe. However, as described in Section 4.3, imaging a field containing many compact sources may have similar issues as to imaging a field containing large-scale structure.
3.2 The evolution of star formation
The cosmic star formation history has been studied thoroughly over the past decade and a half, building up a remarkably consistent picture. As shown in Figure 5, only a small fraction of radio sources above 1 mJy are SF galaxies. Below 1 mJy, a much larger volume of the SF galaxy population becomes detectable, and the population becomes significant at flux densities below about 0.2 mJy. SF galaxies will therefore dominate the deep and wide area continuum surveys proposed with the ASKAP, APERTIF, and MeerKAT telescopes, probing the entire sky to depths of about 50 μJy beam−1.
The star formation history is now well established up to almost the EoR. The space density of SFR declines by an order of magnitude between a redshift of unity and zero, and is almost flat at higher redshifts, with the suggestion of a decline above a redshift of z ~ 5 (Hopkins & Beacom Reference Hopkins and Beacom2006). At higher redshifts there is still some discrepancy, with evidence from Lyman dropout sources suggesting a dramatic decline above z = 6 (Bouwens et al. Reference Bouwens, Illingworth, Franx and Ford2008), and evidence from gamma-ray bursts suggesting a much slower decline (Kistler et al. Reference Kistler, Yüksel, Beacom, Hopkins and Wyithe2009). The mass dependence of the SFR density has also begun to be constrained, with the contribution of more massive galaxies to the SFR density increasing at higher redshift (e.g. Juneau et al. Reference Juneau2005; Feulner et al. Reference Feulner, Gabasch, Salvato, Drory, Hopp and Bender2005; Mobasher et al. Reference Mobasher2009). Environmental effects as well have been shown to change with redshift, with star formation in high density, cluster like environments being enhanced at early times (Elbaz et al. Reference Elbaz2007) but suppressed at later times (Lewis et al. Reference Lewis2002; Gomez et al. Reference Gomez2003).
Together these lines of evidence point to a picture where star formation at the earliest times is dominated by massive systems in the densest regions, which rapidly exhaust their fuel, ultimately becoming the progenitors of today’s brightest cluster galaxies and cD galaxies. At later epochs, the star formation is dominated by somewhat lower mass systems in somewhat less dense environments, similar to cluster outskirts, which in turn exhaust their fuel, until at the lowest redshifts the star formation is dominated by low-mass galaxies living in the least dense environments (Figure 7). This picture is still simplistic, and omits significant details such as how the evolving luminosity function of SF galaxies changes with galaxy mass and environment, and whether and how the stellar initial mass function varies (e.g. Gunawardhana et al. Reference Gunawardhana2011).
An illustration of the density dependence of the downsizing of galaxy SFRs, using optical images from a variety of sources. At the highest redshifts (z > 3), star formation is occurring predominantly in massive galaxies (those that become local massive ellipticals) that live in the most overdense regions (that evolve into today’s massive clusters). At lower redshifts (1 < z < 3), where EMU/WODAN will be sensitive to the most extreme SF systems, star formation is dominated by lower mass systems, in less dense environments. By the current epoch, star formation is limited primarily to low-mass galaxies in the outskirts of clusters and in the lowest-density environments.

3.2.1 Measuring star formation rates from radio observations
At redshifts between 1 ≲ z ≲ 3, when galaxies were undergoing rapid evolution, the star formation activity appears to have been dominated by dusty, heavily obscured, starbursting galaxies (e.g. Chary & Elbaz Reference Chary and Elbaz2001; Caputi et al. Reference Caputi2007; Magnelli et al. Reference Magnelli2010; Murphy et al. Reference Murphy, Chary, Dickinson, Pope and Lin2011). Optical and near-infrared observations are therefore seriously hampered by dust extinction. Thus, deep radio continuum surveys provide an important tool for measuring the cosmic star formation history of the Universe.
A key result from the next generation of wide and deep radio surveys will therefore be the measurement of the radio luminosity due to star formation in a wide range of galaxies. Converting this radio luminosity to a SFR depends on a conversion factor which is principally based on the infrared/radio correlation (Yun et al. Reference Yun, Reddy and Condon2001; Bell Reference Bell2003; Seymour et al. Reference Seymour2008). However, this correlation has not yet been well determined at the high end of the luminosity function, since the number of ultraluminous IR galaxies (ULIRGs) in these papers is very small, or at high redshifts, although evidence so far suggests the correlation remains constant (Mao et al. Reference Mao, Huynh, Norris, Dickinson, Frayer, Helou and Monkiewicz2011a).
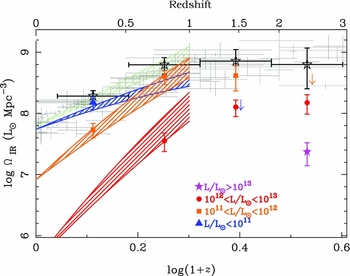
At high redshifts, however, we know that the comoving SFR density is increasingly dominated by more luminous galaxies (with naturally higher SFRs). In Figure 8, we show the comoving infrared luminosity density, a proxy for the comoving SFR density, as a function of redshift. We also separate the contribution by infrared luminosity and find that ULIRGs represent an increasing fraction of the total star formation budget above a redshift of unity. Hence, if we are to use deep radio surveys to probe the star formation history of the Universe at high redshift, we must obtain a considerably more accurate conversion of the radio luminosity to SFR for galaxies with high SFRs. This conversion factor could also depend upon other parameters such as stellar mass, environment, and metallicity.
The comoving infrared luminosity density of SF galaxies as a function of redshift, separated into four infrared luminosity ranges. The shaded regions are from Le Floc’h et al. (Reference Le Floc’h2005) and the bold points are derived from the analysis of faint radio sources in the 13H field (Seymour et al. Reference Seymour2008) where the SF radio luminosities have been converted to infrared luminosities using the relation of Bell (Reference Bell2003). The faint, grey points are from the compilation of Hopkins & Beacom (Reference Hopkins and Beacom2006) converted to IR luminosity density. The figure shows that ULIRGs make an increasing contribution to the total star formation budget above redshifts of unity.
3.2.2 Measuring SFRs at 10 GHz
Radio continuum emission from galaxies typically arises from two processes that are both tied to the massive SFR. At low frequencies (e.g. ≲ 2 GHz), the radio continuum is dominated by non-thermal synchrotron emission arising from cosmic-ray (CR) electrons that have been accelerated by shocks from supernova remnants and are propagating through a galaxy’s magnetised ISM. This physical link to massive star formation provides the foundation for the far-infrared (FIR)–radio correlation (e.g. Helou, Soifer, & Rowan-Robinson Reference Helou, Soifer and Rowan-Robinson1985; Condon Reference Condon1992; Yun et al. Reference Yun, Reddy and Condon2001; Murphy et al. Reference Murphy2006). However, this link is not at all direct given that there are a large number of physical processes affecting the propagation of CR electrons and the heating of dust (e.g. CR diffusion, magnetic field strength/structure, dust grain sizes and composition) that must conspire together to keep this relation intact (Bell Reference Bell2003).
High frequency (~10–100 GHz) radio emission, on the other hand, offers a relatively clean way to quantify the current star formation activity in galaxies. At these frequencies, emission is generally optically thin and dominated by free–free radiation, which is directly proportional to the ionising photon rate of young, massive stars. While this picture could be complicated by the presence of anomalous dust emission (e.g. Kogut et al. Reference Kogut, Banday, Bennett, Gorski, Hinshaw and Reach1996; de Oliveira-Costa et al. Reference de Oliveira-Costa, Kogut, Devlin, Netterfield, Page and Wollack1997; Leitch et al. Reference Leitch, Readhead, Pearson and Myers1997), which occurs at these frequencies and is thought to arise from spinning dust grains (e.g. Erickson Reference Erickson1957; Draine & Lazarian Reference Draine and Lazarian1998), it is currently unclear whether this component contributes significantly to globally integrated measurements (Murphy et al. Reference Murphy2010). Thus, higher frequency radio observations may be particularly powerful for precisely measuring the star formation history of the Universe unbiased by dust.
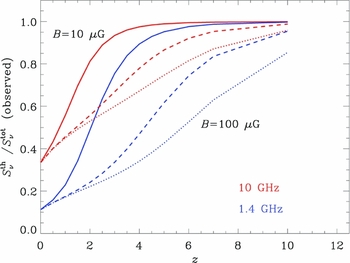
For example, surveys at ν ≳ 10 GHz start to probe the rest-frame ν ≳ 30 GHz emission from SF galaxies by z≳2 for which ≳50% of the emission is thermal (free–free). This is illustrated in Figure 9, where the thermal fraction of the observed 10- and 1.4-GHz emission is shown against redshift for SF galaxies having intrinsic magnetic field strengths of 10, 50, and 100 μG while still obeying the FIR–radio correlation at z = 0. In addition to measuring higher rest-frame frequencies with increasing redshift, this calculation also accounts for the suppression of a galaxy’s non-thermal emission due to rapid cooling of CR electrons from inverse Compton (IC) scattering off the CMB, whose radiation field energy density scales roughly as U CMB~(1 + z)4 (Murphy Reference Murphy2009). By z ≳ 4, nearly 80% of observed 10-GHz radio continuum is due to free–free emission for a galaxy having a large (i.e. 50 μG) magnetic field.
The fraction of radio emission of SFG due to thermal processes as a function of redshift. Galaxy magnetic fields of 10 (solid lines), 50 (dashed lines), and 100 μG (dotted lines) are shown. The radio emission from observations at 10 GHz is dominated by free–free processes beyond a redshift of z≳2 even for magnetic field strengths of ~100 μG, making it an ideal measure for the current SFR of high-z galaxies (Murphy Reference Murphy2009).
Additionally, we can compare the relative sensitivity requirements of surveys at 10 and 1.4 GHz to detect cosmologically important galaxies at early epochs.
This is shown in Figure 10, where we show the expected 10- and 1.4-GHz flux densities from galaxies having a range in IR (8–1000 μm) luminosities and an intrinsic magnetic field of 50 μG. This figure essentially shows the selection function of radio surveys to SF galaxy populations as a function of redshift. While higher frequency surveys need to be much more sensitive to detect the same luminosity class of galaxies at 1.4 GHz, this becomes less of a problem at higher redshifts. For example, by z≳4, the sensitivity requirement of a 10-GHz survey is less than a factor of ~2 deeper than a corresponding 1.4-GHz survey to detect the same population of SF systems. For an intrinsic magnetic field of 10 μG, this small discrepancy between point source sensitivity requirements for 10- and 1.4-GHz surveys occurs at a z≳2. Given that high-frequency observations are almost as sensitive to high-z SF galaxies as low-frequency observations, and that higher frequency observations provide a much more robust measure of star formation activity, surveys at ν≳10 GHz will be invaluable for accurately tracing the star formation history of the Universe.
The expected 10 GHz (solid line) and 1.4 GHz (dotted line) flux densities for galaxies of different IR luminosities assuming an intrinsic magnetic field strength of 50 μG. The depths of possible future surveys taken by the VLA, MeerKAT (MIGHTEE), and SKA are shown. Since the non-thermal emission from SF galaxies should be suppressed by increased IC scattering of CR electrons off of the CMB, the discrepancy between the point source sensitivity requirements of surveys at 1.4 and 10 GHz falls below a factor of ~2 by z ≳ 4.

Figure 10 also shows the expected depths from potential continuum surveys using the VLA, MeerKAT, and SKA. The tentative Tier 4 and 5 steps of the MIGHTEE survey plan to map 0.25 and 0.01 deg2 down to an rms of 1 and 0.2 μJy at 12 GHz, respectively. Although the precise area on the sky has not yet been defined, obvious targets are the Chandra Deep Field-South and COSMOS fields. While the depth of a megasecond exposure is shown for the VLA, the area of such a survey would be restricted by the small primary beam at 10 GHz (θPB ≈ 4 – 5 arcmin). However, VLA surveys reaching μJy depths for entire fields such as GOODS-N at 10 GHz have already been proposed, allowing synergy with future ALMA observations. Clearly, the SKA will revolutionise any such high-frequency continuum surveys using either the VLA or MeerKAT by being ≳2 orders of magnitude deeper for the same integration times.
3.3 Evolution of AGNs
3.3.1 The AGN component in deep radio fields
Radio source counts at μJy levels are dominated by SF galaxies, but their contribution decreases rapidly with increasing flux density (e.g. Seymour et al. Reference Seymour2008), and AGNs contribute significantly at radio fluxes below 1 mJy (e.g. Gruppioni et al. Reference Gruppioni1999; Georgakakis et al. Reference Georgakakis, Mobasher, Cram, Hopkins, Lidman and Rowan–Robinson1999; Magliocchetti et al. Reference Magliocchetti, Maddox, Wall, Benn and Cotter2000; Prandoni et al. Reference Prandoni, Gregorini, Parma, de Ruiter, Vettolani, Zanichelli, Wieringa and Ekers2001; Afonso et al. Reference Afonso, Mobasher, Koekemoer, Norris and Cram2006; Norris et al. Reference Norris2006; Mignano et al. Reference Mignano, Prandoni, Gergorini, Parma, de Ruiter, Wieringa, Vettolani and Ekers2008; Smolčić et al. Reference Smolčić2008; Padovani et al. Reference Padovani, Mainieri, Tozzi, Kellermann, Fomalont, Miller, Rosati and Shaver2009). Recent estimates of their relative contributions are summarised in Figure 5.
Models of the sub-mJy radio population (e.g. Wilman et al. Reference Wilman2008) therefore include three main components:
-
• SF galaxies,
-
• The extrapolation to low flux densities of the classical radio-loud AGN population (radio galaxies and radio-QSOs),
-
• A radio-quiet (or low-luminosity) AGN component.
The unexpected presence of large numbers of AGN-type sources at sub-mJy levels implies a large population of low/intermediate power AGNs, which may have important implications for the black hole-accretion history of the Universe. It will be particularly important to determine the accretion mode (see Section 3.3.2) of these low-power AGNs.
Radio and optical studies of the Australia Telescope ESO Slice Project (ATESP) sub-mJy sample (Prandoni et al. Reference Prandoni, Parma, Wieringa, de Ruiter, Gregorini, Mignano, Vettolani and Ekers2006; Mignano et al. Reference Mignano, Prandoni, Gergorini, Parma, de Ruiter, Wieringa, Vettolani and Ekers2008) have shown that at fluxes 0.4 < S < 1 mJy, a prominent class of low-luminosity (P < 1024 W Hz−1) AGNs associated with early-type galaxies appears. These sources have typically flat or inverted radio spectra (α> − 0.5) and compact sizes (d<10–30 kpc). This source class produces a flattening of the average spectral index at flux densities around 0.5–1 mJy. A similar flattening has been found also in deep low-frequency (350 MHz) surveys (Owen et al. Reference Owen, Morrison, Klimek and Greisen2009; Prandoni et al. Reference Prandoni, Bernardi, Vincenzo and de Bruyn2011). Radio spectral index studies (e.g. Prandoni et al. Reference Prandoni, de Ruiter, Ricci, Parma, Gregorini and Ekers2010) suggest that this class of objects is presumably associated with core-dominated self-absorbed FRI-like radio galaxies, perhaps representing a low-luminosity extension of the classical radio-loud radio galaxy population, which dominates at flux densities S≫1 mJy. On the other hand, deeper radio fields have shown that flat/inverted radio spectra become less frequent at lower flux densities (100 < S < 400 μJy) (Owen et al. Reference Owen, Morrison, Klimek and Greisen2009; Prandoni et al. Reference Prandoni, Morganti and Mignano2009), where steep-spectrum SF galaxies and radio-quiet AGNs are increasingly important.
Our current understanding of the AGN component in deep radio fields can be summarised as follows:
-
• above flux densities S ~ 400 μJy, there is no clear evidence for a radio-quiet AGN component;
-
• sub-mJy radio-loud AGNs are mostly low-power, compact (self-absorbed) jet-dominated systems, and seem to be a low power counterpart of the classical bright radio galaxy population;
-
• at lower flux densities, radio-quiet AGNs become increasingly important and at S ~ 100 μJy they account for about 45% of the overall AGN component;
-
• radio-quiet AGNs show radio/optical/IR properties consistent with radio follow-up of optically selected radio-quiet AGNs (Kukula et al. Reference Kukula, Dunlop, Hughes and Rawlings1998), compact radio sizes, steep radio spectra, luminosities of P < 1024 W Hz−1, and Seyfert-2 optical spectra and/or mid-IR colours.
Multiwavelength analyses of larger and deeper radio samples are needed to confirm these results, and to obtain quantitative constraints for evolutionary modelling of faint AGNs. We can expect this field to move forward significantly in the next years, thanks to the combination of wide-field and all-sky surveys (sampling large local volumes) and very deep fields (sampling low powers at high redshifts) planned with the facilities described in this paper. An example of what can be obtained is illustrated in Figure 11, where we show the AGN luminosity function at different redshifts that can be derived from the combination of EMU and MIGHTEE.
AGN luminosity function at different redshifts expected from the combination of ASKAP and MeerKAT deep surveys (based on models described by Prandoni, de Ruiter, & Parma Reference Prandoni, de Ruiter, Parma and Lobanov2007).

3.3.2 Accretion modes
AGN activity, and associated black-hole growth, occurs in at least two different modes, each of which may have an associated feedback effect upon the AGN host galaxy:
-
(i) A fast accretion mode (often referred to as cold-mode accretion or quasar-mode accretion) associated with quasars (Silk & Rees Reference Silk and Rees1998); this radiatively efficient accretion mode may be important in curtailing star formation at high redshifts and setting up the tight relationship between black hole and bulge masses observed in the nearby Universe (e.g. Magorrian et al. Reference Magorrian1998).
-
(ii) A radiatively inefficient slow accretion mode (often referred to as hot-mode accretion or radio-mode accretion) (Croton et al. Reference Croton2006; Bower et al. Reference Bower, Benson, Malbon, Helly, Frenk, Baugh, Cole and Lacey2006), the observational manifestation of which is low-luminosity radio sources; this mode is thought to be responsible for maintaining elliptical galaxies at lower redshifts as ‘old, red and dead’ (e.g. Best et al. Reference Best, Kaiser, Heckman and Kauffmann2006) and for preventing strong cooling flows in galaxy clusters (e.g. Fabian et al. Reference Fabian2003).
One of the most fundamental issues in understanding the role of AGNs in galaxy formation is the need to measure accurately the cosmic evolution of quasar activity and the accretion history of the Universe, and to compare this with the build-up of the stellar populations of galaxies. Do black holes and their host galaxies grow coevally, or does one precede the other? What is the primary mode of black hole growth?
Much of the growth of black holes is believed to occur in an obscured phase, and these ‘Type-2’ AGNs are difficult to identify. Even the deepest current X-ray observations do not detect the most heavily absorbed sources which cosmic X-ray background synthesis models predict exist in abundance (e.g. Gilli et al. Reference Gilli, Comastri and Hasinger2007), implying that much high-z quasar activity has yet to be detected directly. These ‘radio-quiet’ quasars are not radio-silent, and their radio luminosity distribution peaks at about L 1.4GHz≈1023 W Hz−1 (e.g. Cirasuolo et al. Reference Cirasuolo, Celotti, Magliocchetti and Danese2003). Deep radio surveys with the SKA pathfinders therefore offer an alternative route to identifying these distant AGNs, in a manner unbiased by dust and gas absorption at other wavelengths. Combined with multiwavelength data sets to separate source populations, the relative contribution of radio-quiet AGNs to the faint radio source population can be determined. This will enable investigation of the dependence of the fraction of obscured AGNs on luminosity and cosmic epoch, and thus the history of radiatively efficient accretion in the Universe to be determined.
The deep and wide radio surveys will also allow study of the role of low-luminosity radio sources in galaxy evolution. The low-luminosity radio-AGN population is dominated by a population of sources in which there is little evidence for radiative emission from an accretion disc, and the bulk of the accretion power is channelled into the expanding radio jets (e.g. Merloni & Heinz Reference Merloni and Heinz2007; Hardcastle et al. Reference Hardcastle, Evans and Croston2007; Best et al. Reference Best and Heckman2012). These jets pump energy into their environments, inflating cavities and bubbles in the surrounding intergalactic and intracluster medium (ICM), from which estimates of the mechanical energy associated with the jets can be made (e.g. Cavagnolo et al. Reference Cavagnolo, McNamara, Nulsen, Carilli, Jones and Bîrzan2010). Studies of radio AGNs in the nearby Universe have shown that the fraction of galaxies that host radio-loud AGNs (with L 1.4GHz>1023 W Hz−1) is a strong function of stellar mass (e.g. Best et al. Reference Best, Kauffmann, Heckman, Brinchmann, Charlot, Ivezić and White2005), and that the time-averaged energetic output associated with recurrent radio source activity may indeed be sufficient to control the rate of growth of massive galaxies. However, sensitivity limits of current large-area radio surveys mean that these low-luminosity sources are only observed in the nearby Universe. How does the relation between galaxy mass and radio-AGN fraction (the radio source duty cycle) evolve with redshift out to the peak epoch of galaxy formation? Out to what redshift does radio-AGN heating continue to balance cooling? What is the differential evolution of the radiatively efficient and inefficient accretion modes (cf. Best et al. Reference Best and Heckman2012), and is evidence for ‘down-sizing’ in the radio source population (e.g. Rigby et al. Reference Rigby, Best, Brookes, Peacock, Dunlop, Röttgering, Wall and Ker2011) confirmed? What drives these processes? These are all questions for the next-generation radio arrays, coupled with high-quality multiwavelength data sets. Large-area surveys are required in order to study a sufficient volume to include the full range of galaxy environments, given the very important role that large-scale environment can play in the evolution of galaxies.
3.3.3 Ultra-steep spectrum radio sources below the mJy barrier
Another exciting prospect for the upcoming generation of radio continuum surveys is that of finding complete populations of high-redshift radio galaxies (HzRGs). These are among the most luminous galaxies and seem to be associated with the most massive systems (e.g. van Breugel et al. Reference van Breugel, De Breuck, Stanford, Stern, Röttgering and Miley1999; Jarvis et al. Reference Jarvis, Rawlings, Eales, Blundell, Bunker, Croft, McLure and Willott2001a; Willott et al. Reference Willott, Rawlings, Jarvis and Blundell2003; Rocca-Volmerange et al. Reference Rocca-Volmerange, Le Borgne, De Breuck, Fioc and Moy2004; De Breuck et al. Reference De Breuck, Downes, Neri, van Breugel, Reuland, Omont and Ivison2005; Seymour et al. Reference Seymour2007) often going through a phase of violent star formation at the 1 000 M⊙ yr−1 level and showing large gas and dust reservoirs (e.g. Dunlop et al. Reference Dunlop, Hughes, Rawlings, Eales and Ward1994; Ivison Reference Ivison1995; Hughes, Dunlop, & Rawlings Reference Hughes, Dunlop and Rawlings1997; Ivison et al. Reference Ivison1998; Papadopoulos et al. Reference Papadopoulos, Röttgering, van der Werf, Guilloteau, Omont, van Breugel and Tilanus2000; Archibald et al. Reference Archibald, Dunlop, Hughes, Rawlings, Eales and Ivison2001; Klamer et al. Reference Klamer, Ekers, Sadler, Weiss, Hunstead and De Breuck2005; Reuland et al. Reference Reuland2003, Reference Reuland, Röttgering, van Breugel and De Breuck2004, Reference Reuland2007; but see Rawlings et al. Reference Rawlings, Willott, Hill, Archibald, Dunlop and Hughes2004). HzRGs are considered to be the progenitors of the brightest cluster ellipticals and have been used as beacons to identify overdensities in the distant universe, i.e. proto-cluster environments at z ~ 2.5 (e.g. Stevens et al. Reference Stevens2003; Venemans et al. Reference Venemans2007). Identifying and tracing the evolution of HzRGs offers a unique path to study galaxy and large-scale structure formation and evolution from the earliest epochs, and extensive studies will finally become possible over the next few years.
Until recently, searches for HzRGs have been limited to wide-area (and thus relatively shallow) surveys. This is appropriate as the luminosities of HzRGs are large enough to make them detectable to very high redshifts (beyond z~5) at flux densities of tens or even hundreds of mJy. For example, TN J0924−2201, the most distant known radio galaxy at z = 5.2, exhibits a 1.4-GHz flux of over 70 mJy (De Breuck et al. Reference De Breuck, van Breugel, Röttgering and Miley2000; van Breugel et al. Reference van Breugel, De Breuck, Stanford, Stern, Röttgering and Miley1999). But understanding a population, its origin and evolution, and how it fits in the overall galaxy population requires more than just the detection and study of the most extreme objects. The selection of more complete samples, over a wider redshift range, requires deeper surveys over wide areas. However, the large population of low-z (z ≲ 1–2) SF galaxies at sub-mJy levels presents a considerable difficulty for studies of HzRGs, as efficient ways of distinguishing between AGNs and SF galaxies are then necessary.
One of the most successful tracers of HzRGs relies on the relation between the radio spectral index and redshift (e.g. Tielens, Miley, & Willis Reference Tielens, Miley and Willis1979; Chambers et al. Reference Chambers, Miley, van Breugel and Huang1996). Although an ultra-steep (radio) spectrum (USS; α ≲ −1) is not a necessary condition for a high redshifts, and, in fact, the USS selection misses a possibly large fraction of HzRGs (e.g. Waddington et al. Reference Waddington, Windhorst, Cohen, Partridge, Spinrad and Stern1999; Jarvis et al. Reference Jarvis, Rawlings, Willott, Blundell, Eales and Lacy2001b, Reference Jarvis, Teimourian, Simpson, Smith, Rawlings and Bonfield2009; Schmidt, Connolly, & Hopkins Reference Schmidt, Connolly and Hopkins2006), a higher fraction of high-redshift sources can be found among those with the steepest radio spectra. The USS criterion is so effective that most of the radio galaxies known at z>3.5 have been found using it (see Miley & De Breuck Reference Miley and De Breuck2008, for an overview of the selection of HzRGs). Surprisingly, there is still no satisfactory explanation for this spectral index–redshift correlation, as neither (a) a combination of an increased spectral curvature with redshift and the redshifting of a concave radio spectrum (e.g., Krolik & Chen Reference Krolik and Chen1991) to lower radio frequencies nor (b) radio jets expanding in dense environments, more frequently observed in distant proto-clusters, which would appear with steeper spectral indices (Klamer et al. Reference Klamer, Ekers, Bryant, Hunstead, Sadler and De Breuck2006; Bryant et al. Reference Bryant, Johnston, Broderick, Hunstead, De Breuck and Gaensler2009; Bornancini et al. Reference Bornancini, O’Mill, Gurovich and Lambas2010) seem to explain the observations.
With the next generation of radio continuum surveys, the search for USS HzRGs will be extended to the whole sky and to microJansky flux levels. Although such collections have been assembled before (e.g. Bondi et al. Reference Bondi2007; Owen et al. Reference Owen, Morrison, Klimek and Greisen2009; Afonso et al. Reference Afonso, Heald and Serra2009; Ibar et al. Reference Ibar, Ivison, Biggs, Lal, Best and Green2009), only very recently has it been possible to characterise them. Using deep optical and infrared imaging of the Lockman Hole, Afonso et al. (Reference Afonso2011) have started a detailed analysis of the μJy USS radio source population, something that will be possible over a significant fraction of the sky using radio surveys such as EMU, WODAN, and LOFAR.
This first detailed analysis of the USS μJy population used the deep multiwavelength coverage of the Lockman Hole. The sample selection was made using ultra deep VLA 1.4-GHz (reaching 6 μJy rms) and GMRT 610-MHz data (15 μJy rms), and resulted in 58 sources with a spectral index of α1400 610 ≤ − 1.3. The deep IR coverage at 3.6 μm and 4.5 μm provided by the Spitzer Extragalactic Representative Volume Survey (SERVS; Mauduit et al. Reference Mauduit2012) resulted in an extremely high identification rate, above the 80% level. Mid-infrared colours are compatible with a significant AGN presence among the radio-faint USS population. Spectroscopic redshifts for 14 sources and photometric redshifts for a further 19 sources were used for the redshift distribution of these sources, ranging from z~0.1 to ~2.8 and peaking at z~0.6 (see Figure 12). Twenty-five sources have no redshift estimate, including the faintest sources at infrared wavelengths, which indicates that higher redshifts are likely in this population. In this respect, they may be similar to the Infrared-Faint Radio Sources (IFRS), first identified by Norris et al. (Reference Norris2006), and which appear to be very high redshift dusty radio galaxies (Garn & Alexander Reference Garn and Alexander2008; Huynh, Norris, & Middelberg Reference Huynh, Norris and Middelberg2010; Middelberg et al. Reference Middelberg, Norris, Tingay, Mao, Phillips and Hotan2008a, Reference Middelberg, Norris, Hales, Seymour, Johnston–Hollitt, Huynh, Lenc and Mao2011a; Norris et al. Reference Norris, Tingay, Phillips, Middelberg, Deller and Appleton2007, Reference Norris2011a; Cameron et al. Reference Cameron, Keith, Hobbs, Norris, Mao and Middelberg2011; Zinn, Middelberg, & Ibar Reference Zinn, Middelberg and Ibar2011).
Redshift distribution for radio-faint USS sources in the Lockman Hole, from Afonso et al. (Reference Afonso2011). Filled histogram denotes sources with a spectroscopic redshift determination, while the open region refers to photometric redshift estimates. A further 25 USS sources (43% of the full sample) exist but with no redshift estimate, mostly at fainter 3.6 μm fluxes and likely to be found at higher redshifts.

A comparison with the SKADS Simulated Skies models (Figure 13) indicates that FRIs and RQ AGNs may constitute the bulk of the USS population at μJy radio flux densities (FRIIs are thought to dominate above the mJy level). According to the models, the USS technique will be as efficient for the selection of very high-z radio sources at μJy fluxes as when applied at much higher flux density levels. This raises exciting prospects for the next generation of wide-field radio surveys, as it increases the potential for detailed studies of sources at very high redshifts and understanding of the evolution of the AGN activity in the Universe.
Predictions from the SKADS simulated skies models for the redshift distributions of radio source populations, irrespective of their radio spectral indices, for a radio survey reaching a detection sensitivity of 100 μJy at 610 MHz over 0.6 deg2, similar to the Lockman Hole radio survey considered in Afonso et al. (Reference Afonso2011). The observed redshift distribution for USS sources in that work is also displayed.

These prospects are strengthened by the recent work of Ker et al. (Reference Ker, Best, Rigby, Röttgering and Gendre2012), who have shown that redshift and spectral index are correlated in spectroscopically complete samples, and argue that this is due both to the dense intergalactic medium and the early evolutionary stage of the AGN, although they, together with Zinn et al. (Reference Zinn, Middelberg, Norris, Hales, Mao and Randall2012), also show that the redshift–spectral index correlation is weaker than other potential redshift indicators.
3.3.4 The luminosity-dependent evolution of the radio luminosity function
Section 3.3.2 described how AGN radio jets interact with the surrounding intergalactic and ICM to prevent both large-scale cluster cooling flows and the continued growth of massive ellipticals (e.g. Fabian et al. Reference Fabian2006; Best et al. Reference Best, Kaiser, Heckman and Kauffmann2006, Reference Best, von der Linden, Kauffmann, Heckman and Kaiser2007; Croton et al. Reference Croton2006; Bower et al. Reference Bower, Benson, Malbon, Helly, Frenk, Baugh, Cole and Lacey2006). Determining the evolution of the RLF is therefore important for understanding the timescales on which they impose these effects.
A key early study of radio-loud AGN by Dunlop & Peacock (Reference Dunlop and Peacock1990) found increases of two to three orders of magnitude at a redshift of two, compared with the local Universe, in the comoving number density of both flat and steep spectrum radio-loud sources. They also saw indications of a high-redshift (z~2.5) decline in density, but their work, and that of subsequent studies in this area (e.g. Shaver et al. Reference Shaver, Wall, Kellermann, Jackson and Hawkins1996; Jarvis et al. Reference Jarvis, Rawlings, Willott, Blundell, Eales and Lacy2001b; Waddington et al. Reference Waddington, Dunlop, Peacock and Windhorst2001), has been limited by the inability to probe the depth and volume necessary to probe the high-redshift behaviour. This has motivated the development of the Combined EIS–NVSS Survey of Radio Sources (CENSORS; Best et al. Reference Best, Arts, Röttgering, Rengelink, Brookes and Wall2003), which has been designed to maximise the information for high-redshift, steep spectrum sources close to the break in the RLF. CENSORS is a 1.4-GHz-selected sample and contains 135 sources complete to a flux density of 7.2 mJy. It is currently 78% spectroscopically complete (Ker et al. Reference Ker, Best, Rigby, Röttgering and Gendre2012), with the remaining redshifts estimated via either the K–z or I–z magnitude–redshift relations.
The CENSORS sample, together with additional radio data, source counts, and local RLF, is used to investigate the evolution of the steep spectrum luminosity function via a new grid-based modelling method in which no assumptions are made about the high-redshift behaviour (Rigby et al. Reference Rigby, Best, Brookes, Peacock, Dunlop, Röttgering, Wall and Ker2011). Instead, the RLF variations are determined by allowing the space densities at various points on a grid of radio luminosities and redshifts to each be free parameters, and then simply finding the best-fitting values to this many-dimensional problem. The modelling finds conclusive evidence, at >3σ significance, for a luminosity-dependent high-redshift decline in space density for the steep-spectrum sources. At low radio powers (P 1.4GHz=1025–1026 W Hz−1) the space densities peak at z ≳ 1, but move to higher redshift for the higher powers (z ≳ 3 for P 1.4GHz>1027 W Hz−1). This is illustrated in Figure 14, and is similar to the ‘cosmic downsizing’ seen for other AGN populations (e.g. De Zotti et al. Reference De Zotti, Massardi, Negrello and Wall2010; Wall Reference Wall2008; Hasinger, Miyaji, & Schmidt Reference Hasinger, Miyaji and Schmidt2005; Richards et al. Reference Richards2005). These results are robust to the estimated redshift errors and to variation in the radio spectral index with redshift.
The dependence of the redshift of the peak in space density (z peak) on radio power for the best-fitting steep spectrum grid, showing that the numbers of the most powerful radio sources peak at the highest redshifts (Rigby et al. Reference Rigby, Best, Brookes, Peacock, Dunlop, Röttgering, Wall and Ker2011). The shaded region and error bars give two different determinations of the spread in the measurements.

The evolution of low-luminosity radio AGNs is less well understood than that of radio-loud AGNs, with some studies finding no evidence for any evolution of the RLF for low-luminosity radio AGNs (e.g. Clewley & Jarvis Reference Clewley and Jarvis2004) and others finding that low-luminosity AGNs (LLAGNs) do evolve with redshift, although more slowly (less than a factor of 10 from z = 0 to 1.2) than their high-luminosity counterparts (Smolčić et al. Reference Smolčić2009; McAlpine & Jarvis Reference McAlpine and Jarvis2011). Best et al. (Reference Best and Heckman2012) suggest that the luminosity dependence of the evolution of the AGN RLF may be attributed to the varying fractions of hot and cold mode sources with redshift. Recent results (Mauch & Sadler Reference Mauch and Sadler2007; Sadler et al. Reference Sadler2007; Padovani et al. Reference Padovani, Miller, Kellermann, Mainieri, Rosati and Tozzi2011; Mao et al. Reference Mao2012) fail to resolve this discrepancy, with ambiguity added by factors such as evolution, cosmic variance, differences in classification, differences in terminology, and the difficulty of distinguishing LLAGNs from SF galaxies, or the bulge from the disc of a galaxy. Next-generation radio surveys using SKA pathfinders can resolve this discrepancy provided we develop reliable techniques for distinguishing the AGN component from the SF component of a galaxy.
3.3.5 Environment
Studies of galaxies in groups and clusters by Best et al. (Reference Best, von der Linden, Kauffmann, Heckman and Kaiser2007) and Wake et al. (Reference Wake, Croom, Sadler and Johnston2008) have shown that the environment of a radio galaxy has a significant effect on the radio emission. Sabater et al. (Reference Sabater, Leon, Verdes-Montenegro, Lisenfeld, Sulentic and Verley2008, Reference Sabater, Verdes–Montenegro, Leon, Best and Sulentic2012) built on this result by comparing (a) the radio AGN activity in a sample of isolated galaxies (AMIGA sample; Verdes-Montenegro et al. Reference Verdes–Montenegro, Sulentic, Lisenfeld, Leon, Espada, Garcia, Sabater and Verley2005) with that of a matched sample of galaxies in clusters (Miller & Owen Reference Miller and Owen2001; Reddy & Yun Reference Reddy and Yun2004) and (b) the optical AGN activity for the AMIGA sample with that of a matched sample of galaxies in compact groups (Martinez et al. Reference Martinez2010). The results of all these studies show that radio AGN activity is strongly influenced by the environment while this influence is less clear for optical AGN activity (Miller et al. Reference Miller, Nichol, Gómez, Hopkins and Bernardi2003).
3.3.6 Black hole spin
A further area of study from radio observations is the study of black hole physics. For a given accretion rate, as traced by the X-ray to mid-infrared SED, AGNs show a huge range of radio luminosities. This suggests that some extra parameter, independent of the accretion rate, is controlling the jet power of the AGN. The spin of the black hole is a very attractive candidate, for both observational and theoretical reasons (e.g. Wilson & Colbert Reference Wilson and Colbert1995). Spin is effectively a hidden parameter, which will barely show itself in the SED of the AGN. In addition, spinning black holes can convert rotational energy into jet power, meaning that jets can be powered with nominal efficiencies close to or exceeding unity. Observations of the most powerful radio AGNs suggests the jet power is comparable or larger than the rate of accretion of energy (e.g. Fernandes et al. Reference Fernandes2011).
Radio observations allow us to estimate the jet power, and combining these with observations at X-ray energies or optical wavelengths can allow an estimate of the accretion rate and spin. For example, Martínez-Sansigre & Rawlings (Reference Martínez-Sansigre and Rawlings2011) consider the jet powers of SMBHs with m • ≥ 108 M⊙. The authors use a suite of semi-analytic models and general relativistic (GR) magnetohydrodynamic (MHD) simulations that predict the jet efficiencies as a function of spin, and find that these efficiencies can approximately explain the radio loudness of optically bright quasars.
Martínez-Sansigre & Rawlings (Reference Martínez-Sansigre and Rawlings2011) also find that they can explain the local RLF of high- and low-excitation galaxies independently (HEGs and LEGs, respectively), and that the HEGs and LEGs have different best-fitting spin distributions. The LEGs, modelled as advection-dominated accretion flows (ADAFs) or low-accretion rate SMBHs, have a bimodal spin distribution, with the SMBHs having typically low (â ~ 0) or high (â ~ 1) spins. The probability density of the high-spin peak is significant, typically ~33% of the total probability density. On the other hand, the HEGs, modelled as SMBHs accreting at a high fraction of their Eddington rate, are found to have typically low spins (â ~ 0 only), with a small or non-existent component of high spin. The radio LFs of HEGs and LEGs given by these spin distributions can be extrapolated to high redshift, where they correctly reproduce the total radio LF of all AGNs at z = 1. Due to the strong evolution of the high-Eddington rate SMBHs (as reflected by the evolution of the X-ray LF), this modelling also predicts that the z = 1 radio sources above a radio luminosity density ~1026 W Hz−1 sr−1 (at 151 MHz) should show exclusively HEG spectra, while the fraction of LEGs should increase rapidly at lower radio luminosity densities.
Since the space density of HEGs increases rapidly, the typical spin of SMBHs will change with redshift. At z~0, most of the SMBHs will have the bimodal distribution inferred for the LEGs, with a high fraction of SMBHs having a high spin (Figure 15, top). At z ≳ 1, the space density of HEG radio sources is larger than that of LEG sources, so that the SMBHs will typically have the distribution of spins of the HEGs, dominated by a low-spin component (Figure 15, bottom).
Inferred spin distributions for SMBHs at z = 0 and 1, from Martínez-Sansigre & Rawlings (Reference Martínez-Sansigre and Rawlings2011). The vertical dashed lines mark the mean value at each redshift. Bottom: the spin distribution at z = 1 is dominated by the low-spin population, with a minor component of high-spin SMBHs. Top: at z = 0 a larger fraction of SMBHs possess a high spin, so that the mean spin is higher.

The evolution of the spin from SMBHs (with m • ≥ 108 M⊙) can hence be described as evolving from predominantly low spins in high-Eddington rate systems at z ≳ 1, to a bimodal spin distribution at z~0, for mostly low-Eddington rate systems. At the epoch of highest accretion, the typical spin is low and at later epochs the fraction of SMBHs with high spins increases (Figure 16). This can be understood in terms of chaotic accretion (e.g. King, Pringle, & Hofmann Reference King, Pringle and Hofmann2008) spinning the accreting SMBHs down, whereas major mergers spin the SMBHs up (e.g. Rezzolla et al. Reference Rezzolla, Barausse, Dorband, Pollney, Reis-swig, Seiler and Husa2008). At earlier epochs, there is a plentiful supply of cold gas, so that accretion spins SMBHs down. As this gas disappears, however, the breaking mechanism that spins SMBHs down is removed, while some SMBHs will still experience major mergers. Hence, a population of high-spin SMBHs gradually appears.
Top: mean spin of SMBHs with m • ≥ 108 M⊙, from Martínez-Sansigre & Rawlings (Reference Martínez-Sansigre and Rawlings2011). There is a gradual increase of the mean spin between z ≳ 1 and z = 0, which is most likely due to a fraction of SMBHs undergoing major mergers and subsequent chaotic accretion. Bottom: cosmological simulation of the mean spin from Fanidakis et al. (Reference Fanidakis, Baugh, Benson, Bower, Cole, Done and Frenk2011), which includes chaotic accretion and mergers, and which is in excellent agreement with the inference based on radio observations (top).

3.4 Galaxy clusters and large-scale structure
Clusters of galaxies are the most massive systems in the present Universe. They are not isolated regions, but evolving regions at the intersections of filaments and sheets in the large-scale structure.
Tens of thousands of clusters are currently known, but only a few are known at z>1 (Wilson et al. Reference Wilson2008; Kodama et al. Reference Kodama2007), with the highest cluster redshift at z = 2.07 (Gobat et al. Reference Gobat2011).
Radio observations of galaxy clusters are powerful probes of the physics of the ICM, but they also provide a complementary way to trace the evolution of large-scale structure of the Universe up to very large distances. These studies also have the potential to explore the way in which galaxy evolution (star formation and nuclear activity) depends on its environment.
Radio observations have shown the existence of diffuse large-scale synchrotron radiation from the ICM, implying that non-thermal components, magnetic fields and relativistic particles, are mixed with the hot ICM. The origin of these components is still unclear and a subject of lively debate. Potentially these components contribute to the energy of the ICM and drive complex physical processes that may significantly alter our present (simplified) view of the ICM (Schekochihin et al. Reference Schekochihin, Cowley, Kulsrud, Hammett and Sharma2005; Subramanian, Shukurov, & Haugen Reference Subramanian, Shukurov and Haugen2006; Brunetti & Lazarian Reference Brunetti and Lazarian2011).
Radio emission from clusters of galaxies is generated both by the constituent galaxies and by diffuse emission in the ICM.
The radio emission from constituent galaxies often extends well beyond the galaxy optical boundaries and interacts with the ICM. This interaction is observed in tailed radio galaxies (see Section 3.4.3), and radio sources filling X-ray cavities at the centre of cool-core clusters (McNamara & Nulsen Reference McNamara and Nulsen2007; Feretti & Giovannini Reference Feretti and Giovannini2008).
Diffuse sources are typically grouped into three classes (Feretti & Giovannini Reference Feretti and Giovannini1996; Kempner et al. Reference Kempner, Blanton, Clarke, Enßlin, Johnston–Hollitt and Rudnick2004):
-
• Haloes, which are steep-spectrum Mpc-scale diffuse sources in the central regions of X-ray luminous clusters (e.g. Ferrari et al. Reference Ferrari, Govoni, Schindler, Bykov and Rephaeli2008; Venturi Reference Venturi2011; Feretti et al. Reference Feretti, Giovannini, Govoni and Murgia2012),
-
• Relics, which are located in the peripheral regions of both merging and relaxed clusters and caused by cluster–cluster shocks,
-
• Mini-haloes, which are hosted in relaxed cool-core clusters, are centrally located, and usually surround a powerful radio galaxy, such as 3C84 in the Perseus cluster.
Even amongst these classifications, there is ambiguity, with the term ‘relic’ being used to describe both old galaxies and shock-accelerated regions of diffuse electrons. Furthermore, some amorphous radio objects, such as the diffuse ‘Phoenixes’ (Kempner et al. Reference Kempner, Blanton, Clarke, Enßlin, Johnston–Hollitt and Rudnick2004) and ‘roundish relics’ (Feretti et al. Reference Feretti, Giovannini, Govoni and Murgia2012), cannot easily be so classified.
There are two ways in which these classifications could be improved. First, we could build in more physics to link observations to thermal and non-thermal physical processes in galaxy clusters, but must ensure that current observational/theoretical expectations do not bias our classification. Second, we could use a comparison of radio and X-ray surface brightness distributions.
SKA pathfinder surveys will discover hundreds of diffuse radio haloes in regions of the sky where there are no known clusters (Cassano et al. Reference Cassano, Brunetti, Norris, Röttgering, Johnston–Hollitt and Trasatti2012) and even more tailed radio galaxies (Mao et al. Reference Mao, Sharp, Saikia, Norris, Johnston–Hollitt and Lovell2010a; Norris Reference Norris2011). Radio emission in clusters is therefore likely to become an important tool both for studying clusters themselves, and for detecting large numbers of clusters to study cosmology and trace large-scale structure formation.
3.4.1 Radio haloes
About 40 giant radio haloes are known so far in the redshift range 0 ≤ z ≤ 0.55. The GMRT Radio Halo Survey (Venturi et al. Reference Venturi, Giacintucci, Dallacasa, Cassano, Brunetti, Bardelli and Setti2008), in combination with the NVSS and WENSS surveys, allows a statistical exploration of radio haloes in galaxy clusters in the redshift range 0 ≤ z ≤ 0.4 (Cassano et al. Reference Cassano, Brunetti, Venturi, Setti, Dallacasa, Giacintucci and Bardelli2008). The cluster radio properties were found to be bimodal: only a fraction of massive clusters host haloes, while no Mpc-scale radio emission is detected in the majority of clusters at current sensitivity levels. The radio luminosity of these ‘radio-quiet’ clusters is less than one-tenth of that of the observed radio haloes (Brunetti et al. Reference Brunetti, Venturi, Dallacasa, Cassano, Dolag, Giacintucci and Setti2007, Reference Brunetti, Cassano, Dolag and Setti2009). X-ray follow-up of these observations shows that radio haloes are found only in merging clusters while ‘radio-quiet’ clusters are systematically more relaxed systems (Cassano et al. Reference Cassano, Ettori, Giacintucci, Brunetti, Markevitch, Venturi and Gitti2010a).
The radio properties of haloes correlate with the thermal properties of the parent clusters and the radio power of haloes increases with X-ray luminosity, suggesting a direct connection between the thermal and non-thermal cluster properties (Feretti et al. Reference Feretti, Dallacasa, Govoni, Giovannini, Taylor and Klein1999, Reference Feretti, Giovannini, Govoni and Murgia2012; Bacchi et al. Reference Bacchi, Feretti, Giovannini and Govoni2003; Cassano et al. Reference Cassano, Brunetti and Setti2006; Brunetti et al. Reference Brunetti, Venturi, Dallacasa, Cassano, Dolag, Giacintucci and Setti2007, Reference Brunetti, Cassano, Dolag and Setti2009).
According to a prominent scenario for the origin of giant radio haloes, a fraction of the gravitational binding energy of dark matter haloes released during cluster mergers can be channelled into turbulence. This turbulence may in turn accelerate relativistic particles (Brunetti et al. Reference Brunetti, Setti, Feretti and Giovannini2001; Petrosian Reference Petrosian2001) explaining the connection observed between radio haloes and cluster mergers.
The source of the synchrotron electrons in these haloes is unclear, as acceleration of electrons from the thermal pool to relativistic energies by MHD turbulence in the ICM cannot provide sufficient energy (Petrosian Reference Petrosian and East2008). Instead, there must be a pre-existing population of relativistic (or supra-thermal) seed particles that are then reaccelerated by turbulent acceleration during mergers. One possibility is that the seeds are secondary electrons generated by collisions between CRs and thermal protons (Brunetti & Blasi Reference Brunetti and Blasi2005; Brunetti & Lazarian Reference Brunetti and Lazarian2011). These hybrid models predict that Mpc-scale synchrotron emission from secondary electrons (‘pure hadronic haloes’) must also be present in relaxed clusters, with a radio luminosity 10–20 times smaller than that of merging clusters (Brunetti & Lazarian Reference Brunetti and Lazarian2011). This emission should be detectable with EMU/WODAN. Figure 17 shows the 1.4-GHz RLF of radio haloes in the local Universe (z = 0.1): at higher radio luminosities, turbulent cluster haloes dominate, but at lower luminosities the RLF is dominated by ‘hadronic’ haloes in relaxed systems. Additional sources of seed supra-thermal electrons include shocks, AGNs, galaxies, and magnetic reconnection, so relaxed clusters may have an even higher radio luminosity. If EMU fails to detect radio haloes in relaxed clusters, this will provide a strong constraint on secondary particles and on the energy content of CRs in the ICM.
Luminosity functions at 1.4 GHz of giant radio haloes in the redshift range 0.1 ≤ z ≤ 0.2. The red dashed line marks the contribution from ‘hadronic’ haloes in relaxed clusters, while the blue dashed line marks the contribution from haloes in merging ‘turbulent’) clusters. The black solid line gives the total luminosity functions (Cassano et al. Reference Cassano, Brunetti, Norris, Röttgering, Johnston–Hollitt and Trasatti2012). The arrows show the EMU and NVSS sensitivities at that redshift.

An extrapolation of the radio power of haloes at 1.4 GHz versus the cluster X-ray luminosity indicates that clusters with Lx < 1044 erg s−1 should host haloes of power L 1.4 < 1023 W Hz−1. With a typical size of 1 Mpc, their surface brightness could be too low to be detected at 1.4 GHz. However, less powerful radio haloes should be also smaller in size (Feretti et al. Reference Feretti, Giovannini, Govoni and Murgia2012), implying that they should be easily detected by the EMU survey. A comparison between 1.4 GHz data with low-frequency data (LOFAR) will be crucial to test turbulence properties. A large number of ‘hadronic haloes’ may be detected at 1.4 GHz (see Figure 17), emphasising the importance of comparing the EMU and LOFAR surveys.
If turbulence is responsible for the origin of haloes, then the radio-emitting electrons are accelerated up to energies mec 2γ m ≤ several GeV, where the synchrotron and IC losses quench the acceleration by MHD turbulence. Radio haloes will therefore steepen at a frequency ν s ∝γ2 m b, making it difficult to detect haloes at higher frequencies (Brunetti et al. Reference Brunetti2008).
Only the few most energetic mergers in the Universe can generate giant radio haloes with ν s ≥ 1 GHz (Cassano et al. Reference Cassano and Brunetti2005). Most mergers instead consist of major mergers between less massive systems, or minor mergers in massive systems (Cassano et al. Reference Cassano, Brunetti and Setti2006, Reference Cassano, Brunetti, Röttgering and Brüggen2010b), which will therefore have steeper spectra (smaller ν s ). Recent Monte Carlo calculations based on turbulent acceleration in galaxy clusters predict that LOFAR, reaching rms =0.1 mJy beam−1 at 120 MHz over the northern hemisphere, will detect more than 350 radio haloes at redshift z ≤ 0.6, increasing the number of known haloes by a factor of nearly ten (Enßlin & Röttgering Reference Enßlin and Röttgering2002; Cassano et al. Reference Cassano, Brunetti and Setti2006). More than half of these haloes will be ‘ultra-steep spectrum’ haloes, with ν s < 600 MHz (Cassano et al. Reference Cassano, Brunetti, Röttgering and Brüggen2010b), providing a clear test of the importance of turbulence in particle acceleration in merging clusters.
3.4.2 Radio relics
Relics (occasionally termed radio phoenixes) are irregular, elongated diffuse sources which are generally located at the periphery of the cluster, with the linear size of 400–1 500 kpc (Giovannini & Feretti Reference Giovannini and Feretti2002). Most have a steep spectrum (α< −1), and are linearly polarised at a level of ~10%–30%. They show an asymmetric transversal profile and spectral index distribution. Current models suggest that they are caused by diffusive shock acceleration of electrons in old radio-emitting regions, triggered by a cluster merger event. Currently, ~34 clusters are known to contain at least one relic source. Eleven of these also have a radio halo and ten have a double relic.
The existence of relic sources suggest cluster-wide magnetic fields of about 0.1–1 μG and relativistic electrons of ~ GeV energies in large peripheral regions where the density of the hot ICM is low and galaxies are scarce.
Few radio relics have been well studied and few have deep high resolution radio maps, so that their size and flux density may be underestimated. Most radio spectra have been obtained with a limited frequency range and very few spectral index images have been published. Because most relics are located at the cluster periphery, they are often outside, or at the edge, of available X-ray images, making it difficult to compare radio and X-ray data. However, a few relics have been found and studied in detail (e.g. Johnston-Hollitt Reference Johnston–Hollitt2003; van Weeren et al. Reference van Weeren, Röttgering, Brüggen and Hoeft2010; Brown, Duesterhoeft, & Rudnick Reference Brown, Duesterhoeft and Rudnick2011).
A few relics show a curved shape radio spectrum and a diffuse, filamentary morphology. They often have been found near the central cD galaxy, suggesting a possible connection with a past activity of this galaxy, but in A1664 (see Figure 18) and in A548b (Feretti Reference Feretti, Bacchi, Slee, Giovannini, Govoni, Andernach and Tsarevsky2006) the relic is far from the cluster centre.
Radio image (contours) overlaid on X-ray images (colour) of three representative clusters: (top) the radio relic in the cluster A1664 (Govoni et al. Reference Govoni, Feretti, Giovannini, Böhringer, Reiprich and Murgia2001), (centre) the giant radio halo in A2163 (Feretti et al. Reference Feretti, Fusco-Femiano, Giovannini and Govoni2001), and (bottom) the double relic in A3376 (Bagchi et al. Reference Bagchi, Durret, Neto and Paul2006).

Figure 19 compares the radio and X-ray power of radio haloes and relics, showing that both the relic and halo power are correlated with the parent cluster X-ray luminosity, although this may be influenced by selection effects. The relics have a larger dispersion than the haloes, confirming that shocks are more efficient than turbulence in accelerating relativistic electrons or amplifying magnetic fields. This correlation confirms the link between relics and cluster mergers and shows that the SPARCS surveys will enable the study of large-scale magnetic fields in low density regions at the cluster periphery. Such correlations have recently been discussed by Feretti et al. (Reference Feretti, Giovannini, Govoni and Murgia2012).
Halo (blue) and relic (red) radio power at 1.4 GHz in units of W Hz−1 versus cluster X-ray luminosity.

3.4.3 Tailed radio galaxies
Tailed radio galaxies include wide-angle tails (WATs) and narrow-angle tails (NATs). They are common in large clusters (Blanton et al. Reference Blanton, Gregg, Helfand, Becker and White2000, Reference Blanton, Gregg, Helfand, Becker and Leighly2001, Reference Blanton2003) and appear to represent radio-loud AGNs in which the jets are distorted by the ICM (Mao et al. Reference Mao, Sharp, Saikia, Norris, Johnston–Hollitt and Lovell2010a). Mao et al. (Reference Mao, Sharp, Saikia, Norris, Johnston–Hollitt, Middelberg and Lovell2011b) have found six tailed galaxies in the 7 deg2 of the Australia Telescope Large Area Survey (ATLAS), suggesting that ~40 000 new clusters will be detected by EMU, using the tailed galaxies as tracers. With higher spatial resolution, more tailed galaxies become visible, and Dehghan et al. (Reference Dehghan, Johnston–Hollitt, Mao, Norris, Miller and Huynh2011), using high-resolution images of the same ATLAS fields, find 12 tailed galaxies in 4 deg2, implying ~105 tailed galaxies in EMU. Importantly, such galaxies can be detected out to high redshifts of z~ 0.5 and beyond (Wing & Blanton Reference Wing and Blanton2011; Mao et al. Reference Mao, Sharp, Saikia, Norris, Johnston–Hollitt and Lovell2010a), providing a powerful diagnostic for finding clusters.
3.5 The magnetic sky
Magnetic fields are very important at all scales in the Universe, exerting their influence at very small scales in the ISM, at large scales in galaxies and clusters, and on the vast scale of cosmic filaments. Yet we still have limited understanding of the magnetic contribution to the energy balance in these structures, and their dynamical influence and contribution to the evolution of different classes of object. Our best tools for measuring cosmic magnetic fields are radio observations of synchrotron radiation and its linear polarisation, which are sensitive to total and ordered magnetic fields, respectively, and Faraday rotation, which is sensitive to magnetic fields along the line of sight.
One of the areas which will benefit most from SKA pathfinder surveys is the study of radio continuum polarisation. The prospects for wide-field deep imaging, with broad wavelength coverage, and (in PAF-equipped telescopes) with excellent control over the primary beam response, combine to make the suite of pathfinders excellent for the study of polarisation. The two major polarisation surveys which are currently planned with SKA pathfinders are (i) the LOFAR Key Science Project on Cosmic Magnetism (see Section 2.8) and (ii) ASKAP-POSSUM project (see Section 2.4). They are highly complementary, spanning more than a decade in observing frequency, and will probe widely differing regimes of magnetised plasmas. Moreover, together they can observe both hemispheres. There are a number of other surveys aimed at recovering high density grids of rotation measures (RM grids) towards different astrophysical regions, notably the APERTIF–BEOWULF and APERTIF–FRIGG surveys (Section 2.2), the e-MERLIN Super-CLASS survey (Section 2.5; Battye et al. Reference Battye2011), and the RM grid component of the MeerKAT MIGHTEE Survey (Section 2.9).
The primary tool for analysing the polarisation data from the pathfinders is the ‘RM synthesis’ technique (Burn Reference Burn1966; Brentjens & de Bruyn Reference Brentjens and de Bruyn2005). The essence of this technique is to perform a Fourier transform of the observed complex polarisation vector from the frequency (strictly, λ2) domain to the ‘Faraday depth’ domain. The Faraday depth refers to the line-of-sight integral of the thermal electron density and magnetic field strength. In simple situations, it is more commonly known as the Faraday RM, while this simple relation breaks down for synchrotron emission and Faraday rotation in the same medium, various emitting and rotating layers along the line of sight, or more than one polarised feature with different RMs within an angular resolution element. The output of the RM synthesis technique is a reconstruction of the Faraday dispersion function, which describes the complex polarisation vector as a function of the Faraday depth (Brentjens & de Bruyn Reference Brentjens and de Bruyn2005; Heald Reference Heald2009). Other techniques for identifying magnetic field structures from RM synthesis observations continue to be developed (e.g. Beck et al. Reference Beck, Frick, Stepanov and Sokoloff2012).
The technique allows the detection of very faint polarised emission even when the RM is very high (i.e. corresponding to the polarisation angle rotating by more than a turn across the observing band) and avoids nπ ambiguities. Better precision in the Faraday depth domain is obtained by observing with wide bandwidth, and access to high values of |RM| is provided by high spectral resolution—both of which are included in the specifications of all of the pathfinders.
High-quality polarisation observations address diverse science goals, ranging from local to cosmological scales. Here, we summarise a subset of these and discuss the impact of the pathfinder surveys on these fields.
3.5.1 The large-scale structure of the Milky Way magnetic field
Knowledge of the strength and orientation of the large-scale magnetic field in the Milky Way is crucial for studies of the origin and evolution of Galactic magnetism, but is also valuable for extragalactic topics such as ultra-high energy CRs, CMB polarisation, and magnetism in external galaxies, galaxy clusters, and intergalactic space.
Models constrained by observational RM data from pulsars, extragalactic sources, and diffuse Galactic synchrotron emission attempt to determine reversals in the spiral magnetic pattern of the Milky Way, and to measure the large-scale configurations of the field in the Milky Way disc and halo (e.g. Beck Reference Beck2011; Noutsos et al. Reference Noutsos, Johnston, Kramer and Karastergiou2008; Van Eck et al. Reference Van Eck2011; Sun et al. Reference Sun, Reich, Waelkens and Enßlin2008; Jansson et al. Reference Jansson, Farrar, Waelkens and Enßlin2009; Nota & Katgert Reference Nota and Katgert2010; Mao et al. Reference Mao, Gaensler, Haverkorn, Zweibel, Madsen, McClure-Griffiths, Shukurov and Kronberg2010b), all of which are key to understanding the evolution of galactic magnetic fields. However, controversy still exists about the existence and location of reversals, and the overall 3D configuration of the magnetic field in the Milky Way’s disc and halo.
Major constraints to these large-scale magnetic field models will come from the rotation measure grid of RMs from compact extragalactic sources, most of which probe Galactic Faraday rotation. The SKA pathfinders ASKAP, LOFAR, APERTIF, and MeerKAT have complementary programs to observe RMs of extragalactic point sources to construct an RM grid with an average density of 100 RMs per square degree over the entire sky. These efforts will provide a polarised source density two orders of magnitude higher than the recent NVSS RM catalogue (Taylor, Stil, & Sunstrum Reference Taylor, Stil and Sunstrum2009), which has already proved useful for a wide range of analyses (e.g. McClure-Griffiths et al. Reference McClure-Griffiths, Madsen, Gaensler, McConnell and Schnitzeler2010; Schnitzeler Reference Schnitzeler2010; Stil, Taylor, & Sunstrum Reference Stil, Taylor and Sunstrum2011).
3.5.2 The turbulent, magnetised interstellar medium
Magnetised turbulence in the ISM plays a major role in many physical processes such as star formation, total ISM pressure equilibrium, CR scattering, gas mixing, and radio wave propagation (Scalo & Elmegreen Reference Scalo and Elmegreen2004).
At high Galactic latitudes, in the Galactic thick disc and halo, RM variations are small, and can be observed at long wavelengths. Spectropolarimetric observations of the Galactic foreground emission at mid-latitudes around 350 MHz, made using WSRT, show a wealth of small-scale polarisation at angular resolutions down to a few arcmin (Haverkorn, Katgert, & de Bruyn Reference Haverkorn, Katgert and de Bruyn2003a, Reference Haverkorn, Katgert and de Bruyn2003b; Schnitzeler et al. Reference Schnitzeler, Katgert, Haverkorn and de Bruyn2007; Schnitzeler, Katgert, & de Bruyn Reference Schnitzeler, Katgert and de Bruyn2009). At even lower frequencies of 150 MHz, Bernardi et al. (Reference Bernardi2009) observed abundant structure in diffuse polarisation at intermediate latitudes. Therefore, LOFAR RM synthesis observations at mid- and high-latitude are expected to discover a wealth of small-scale RM structures in the magneto-ionised gas. This will be used to characterise the power spectrum of magnetic field fluctuations at high latitudes, i.e. in the Galactic gaseous halo and disc–halo connection.
In addition, calculation of the spatial gradient of diffuse polarisation can allow direct visualisation of turbulent structures in the ISM, from which we can infer fundamental properties such as Mach number and Alfvén speed (Gaensler et al. Reference Gaensler2011; Burkhart, Lazarian, & Gaensler Reference Burkhart, Lazarian and Gaensler2012).
Closer to the Galactic plane, the larger RM values will cause partial or complete depolarisation of low-frequency emission, but are well suited to observations with ASKAP, APERTIF, and MeerKAT. The RM grid allows statistical analysis of interstellar magnetised turbulence as a function of position (Haverkorn et al. Reference Haverkorn, Brown, Gaensler and McClure-Griffiths2008), while RM synthesis of the diffuse polarised emission allows disentangling of synchrotron emitting and Faraday rotating layers (Brentjens Reference Brentjens2011). It will also be possible to map out magnetic field strength and structure in discrete structures such as supernova remnants, planetary nebulae, superbubbles, H ii regions, Galactic chimneys, and high-velocity clouds (see, e.g., Beck & Gaensler Reference Beck and Gaensler2004).
3.5.3 Faraday screens
At 1.4 GHz, the diffuse polarised sky typically bears little resemblance to the total intensity sky (e.g. Landecker et al. Reference Landecker2010). A widely accepted interpretation for this characteristic is that the detected polarised features are the signature of Faraday rotation rather than structure in the Galactic synchrotron emission. The exceptions are supernova remnants (Section 3.8.3) and pulsar wind nebulae (Section 3.8.4).
Observations have shown that the synchrotron emission of external galaxies is very smooth and the WMAP results have confirmed that for our Galaxy too. However, at lower radio frequencies, surveys show a lot of small-scale structure caused by Faraday rotation. A typical radio telescope operating in the 1.4-GHz wavelength range proves to be more sensitive to the Faraday rotation of an ionised and magnetised medium than to its bremsstrahlung signature.
The Faraday rotation structures we find in linear polarisation images are called ‘Faraday Screens’. These Faraday Screens are still not well understood. Questions about these features we have to answer include:
-
• Are those features created by variation of the magnetic field or the free electron distribution (or a combination of both)?
-
• Can we correlate (or anti-correlate) these features with other tracers of the ISM?
-
• How can we explain features that do not correlate with anything?
-
• Can RM synthesis help to reveal the characteristics of these features?
-
• Can we relate these features with structures seen in the RM distribution determined from extra-galactic point sources?
A large wide-field survey such as POSSUM will help to better understand these features and reveal their true nature
3.5.4 Nearby galaxies
Spiral galaxies have typical magnetic field strengths of the order of 10 μG. They typically show ordered field patterns consistent with the spiral pattern in the plane, a higher level of magnetic turbulence in the arms themselves, and an X-shaped configuration in the high-latitude regions. A concise review of the properties of magnetic fields in galaxies is provided by Beck (Reference Beck2009).
The WSRT–SINGS Survey has investigated the global magnetic field properties across a small sample of nearby galaxies with diffuse polarised emission (Braun, Heald, & Beck Reference Braun, Heald and Beck2010). This work showed that azimuthal patterns in polarised intensity and RM (Heald, Braun, & Edmonds Reference Heald, Braun and Edmonds2009) are consistent with a magnetic field configuration consisting of an axisymmetric spiral in the disc and a quadrupolar poloidal pattern away from the plane, as predicted by the dynamo theory of magnetic field amplification (e.g. Widrow Reference Widrow2002). A critical component of the model is that turbulent magnetic fields in the SF disc depolarise synchrotron radiation from the far side of the disc (see Burn Reference Burn1966, for a description of this Faraday dispersion effect). In face-on galaxies this effect, together with trailing spiral arms, results in the observed patterns. At higher and lower radio frequencies, the effects of Faraday dispersion will be reduced and enhanced, respectively, giving rise to different patterns in the polarised synchrotron radiation.
The polarisation surveys planned with ASKAP and LOFAR will thus be complementary in that they will trace ordered magnetic fields in significantly different volumes within nearby galaxies. Although depolarisation by Faraday dispersion is much stronger at LOFAR frequencies, this is mitigated by the fact that CR electrons that have diffused far from their acceleration sites (i.e. regions of massive star formation) will have lower energies because of synchrotron losses. Thus, synchrotron radiation from this aged CR population will peak at LOFAR frequencies, and should trace ordered fields in the far outer regions of galaxies. At the other end of the spectrum, high-frequency observations with MeerKAT and the VLA can ‘see through’ the SF disc, and trace the fields in the SF regions directly. The suite of SKA pathfinders can thereby provide complementary polarimetric studies leading to an ‘onion-peel’ polarimetric view of diffuse synchrotron emission in nearby galaxies.
3.5.5 Magnetic field evolution in galaxies
Beyond the nearby Universe, SKA pathfinder telescopes have insufficient angular resolution to map the synchrotron radiation across discs of galaxies. However, Stil et al. (Reference Stil, Krause, Beck and Taylor2009) have shown that polarised radiation with a preferred, and wavelength-independent, orientation will be detected in unresolved galaxies. Thus statistical studies of the magnetic fields in distant galaxies will be possible. These same sources are also expected to be excellent background probes in the RM grid.
Within the picture of the turbulent dynamo, the amplitude of the regular magnetic fields in galaxies is expected to decrease at higher redshift. The variation of galactic magnetic field strength with epoch may be reflected in the redshift dependence of the FIR/radio correlation (see Murphy Reference Murphy2009).
3.5.6 Galaxy clusters
The ICM of galaxy clusters consists not only of hot thermal gas (T~107–108 K) emitting in the X-ray domain, but also of magnetic fields and relativistic particles that may give rise to synchrotron radio emission. The most direct evidence for the presence of magnetic fields are the so-called radio haloes and radio relics (see Section 3.4). Other evidence for cluster magnetic fields comes from the Faraday rotation of radio sources that lie within or behind the cluster along our line of sight (e.g. Clarke, Kronberg, & Bohringer Reference Clarke, Kronberg and Bohringer2001; Johnston-Hollitt & Ekers Reference Johnston–Hollitt and Ekers2004).
Magnetic fields are thought to play an important role in the development of large-scale structure in the Universe, but their origin and evolution are still poorly understood. Cosmological simulations indicate that the magnetic field strength resulting from the adiabatic compression of the gas falling into the cluster potential well cannot account for more than 1% of the magnetic field strength that is inferred from observations, so that other amplification mechanisms are required (Dolag et al. Reference Dolag, Bykov and Diaferio2008). Cosmological simulations also predict that processes related to the cluster formation, such as merger events and shear flows, can in principle amplify the magnetic field up to the observed values. Hence, measurements of the ICM magnetic field, such as the power spectrum and radial profile, are necessary to test these predictions, and to measure the amplification of the magnetic field during cluster formation. Magnetic fields may also affect thermal conduction in the ICM, and so measuring the magnetic field strength is crucial to understand the origin of the relativistic particles responsible for the radio halo and relic emission.
3.5.7 Faraday rotation measures and ICM magnetic fields
A powerful method to constrain the magnetic field properties in the ICM is to study the Faraday rotation of sources that are within or behind the cluster along our line of sight (e.g. Krause et al. Reference Krause, Alexander, Bolton, Geisbüsch, Green and Riley2009). Recently, Bonafede et al. (Reference Bonafede, Feretti, Murgia, Govoni, Giovannini, Dallacasa, Dolag and Taylor2010) have constrained the magnetic field in the Coma cluster by observing seven sources at different projected distances from the cluster centre. The resulting RM images have been compared with the mock RM images obtained with the FARADAY code (Murgia et al. Reference Murgia, Govoni, Feretti, Giovannini, Dallacasa, Fanti, Taylor and Dolag2004) for different magnetic field configurations. The magnetic field that best reproduces the Coma observations has a central value B 0 = 4.7 μG, and declines with the gas density profile n according to B(r) = n(r)0.5. Murgia et al. (Reference Murgia, Govoni, Feretti, Giovannini, Dallacasa, Fanti, Taylor and Dolag2004), Govoni et al. (Reference Govoni, Murgia, Feretti, Giovannini, Dolag and Taylor2006), and Vogt & Enßlin (Reference Vogt and Enßlin2005) have achieved similar results on smaller samples. These studies require deep multi-frequency observations of several sources located at different projected distances from the cluster centre, so only a small number of clusters have been studied. The sensitivity of current radio telescopes is insufficient to study a large number of galaxy clusters with many RM probes per cluster, but the next generation of radio telescopes will make this possible.
3.5.8 Fractional polarisation of radio sources and magnetic field in the ICM
When synchrotron emission from a cluster or background source crosses the ICM, regions with similar intrinsic direction of the polarisation plane, Ψint, going through different paths, will be subject to differential Faraday rotation. If the magnetic field in the foreground screen is tangled on scales smaller than the observing beam, radiation with similar Ψint but opposite orientation will be averaged out, and the observed degree of polarisation will be reduced (beam depolarisation). In the central region of a cluster, B and n are higher, resulting in a higher RM, and lower fractional polarisation FP . Sources at larger radii experience a lower RM, and so suffer from less depolarisation.
Bonafede et al. (Reference Bonafede, Govoni, Feretti, Murgia, Giovannini and Brüggen2011) selected a sample of massive galaxy clusters and used the NVSS data (Condon et al. Reference Condon, Cotton, Greisen, Yin, Perley, Taylor and Broderick1998) to analyse the polarisation of radio sources as a function of the projected distance from the cluster centre. They find that, statistically, the fractional polarisation decreases with the cluster projected distance. By comparing this trend with that predicted by magnetic field models, they estimate the magnetic field in the cluster centre to be ~5 μG. The advantage of this approach is that it does not need multi-frequency observations. This effect can be investigated with radio surveys at a single frequency in full polarisation mode. Although such studies do not provide detailed information on magnetic fields in specific clusters, they allow us to understand the average properties of magnetic fields in the ICM, and potentially even on larger scales.
3.5.9 The origin of cosmic magnetism
Galaxies and the ICM can only account for about one-third of the baryon density in the local Universe expected from a concordance cosmology. The majority of the missing matter is likely to reside in a warm–hot intergalactic medium (WHIM), which in turn is expected to reside in the cosmic web of the large-scale structure. Detection of the magnetic field found in this cosmic web, or placing stringent upper limits on it, will provide powerful observational constraints on the origin of cosmic magnetism.
Various mechanisms have been suggested for the origin of magnetic fields in our Universe. One possibility is that the fields are truly primordial and that a seed field formed prior to recombination in the very early Universe (Banerjee & Jedamzik Reference Banerjee and Jedamzik2003). Alternatively, fields could have been produced via the Weibel instability, a small-scale plasma instability formed at structure formation shocks (Medvedev et al. Reference Medvedev, Silva, Fiore, Fonseca and Mori2004). Both of these mechanisms occurred early in cosmic history, prior to galaxy formation, and are therefore referred to as early-type mechanisms. In contrast, possible late-type mechanisms are processes where the field was injected into the WHIM via the action of jets from AGNs and other outflows such as galactic winds (e.g. Kronberg Reference Kronberg2004).
The SKA pathfinder polarisation surveys will together generate a rich data set from which a wide, high-density, broad bandwidth RM grid may be built, and weak magnetic fields in intergalactic filaments may be detected for the first time. A lower limit for the intergalactic magnetic field has been determined (10−15 G; Dolag et al. Reference Dolag, Kachelriess, Ostapchenko and Tomàs2011).
In the filamentary structures of the cosmic web, field strengths are expected to be far more sensitive to the origin of the magnetic fields than in larger gravitationally bound structures where turbulent amplification will have led to saturation of the field. Specifically, the strength and penetration of magnetic fields in filaments is expected to be much lower if the field arises from a ‘late’ astrophysical source (AGNs, galactic winds, etc.), compared with that arising from a primordial one, and simulations have demonstrated that the strength of these turbulently amplified early-type seed fields range typically between 0.1 and 0.01 μG (Ryu et al. Reference Ryu, Kang, Cho and Das2008). Consequently, observations of the filamentary cosmic web are invaluable for inferring the origin of cosmic magnetism. Although the predicted field strengths are extremely low, such RMs are observationally accessible with the SKA pathfinder telescopes.
In addition, the rotation of emission from background radio sources through the large-scale structure filaments within e.g. superclusters of galaxies can also be used to infer the origin of cosmic magnetism. A statistical analysis of these RMs to measure the power spectrum of the magnetic field of the cosmic web (Kolatt Reference Kolatt1998), using cross-correlations with other large-scale structure indicators, will also provide stronger constraints than individual RMs. These measurements will also probe the distribution and density of thermal gas at the interface between clusters and the cosmic web, which has important consequences for a number of related areas in astrophysics and will be highly complementary to X-ray and Sunyaev–Zel’dovich studies of these structures. However, because of the low temperatures of these regions, RM measurements may provide the only way to probe them.
3.5.10 High-redshift rotation measures
Studies of high-redshift objects (e.g. Kronberg et al. Reference Kronberg, Bernet, Miniati, Lilly, Short and Higdon2008, who examined the redshift dependence of the spread of RMs) suggest that the amplification of magnetic fields occurred more rapidly than the expectations of mean-field dynamo theory. The conclusions of this type of work are so far limited by small samples, together with uncertainties in the removal of the Milky Way foreground RM structure. SKA pathfinders will provide RM grids that will enable this kind of study to be done with significantly lower uncertainty. A better comparison with the predictions of dynamo theory (see e.g. Arshakian et al. Reference Arshakian, Beck, Krause and Sokoloff2009) will thus become possible.
3.6 Cosmology
The SKA pathfinder surveys (here referred to as SPARCS surveys) will not only be an important preparation for SKA surveys, but will also be able to deliver important cosmological results themselves. Earlier surveys were able to provide valuable constraints on cosmology and cosmic evolution (e.g. Blake & Wall Reference Blake and Wall2002; Overzier et al. Reference Overzier, Röttgering, Rengelink and Wilman2003). Here we show that SPARCS surveys will be able to constrain cosmological models and parameters via several probes: the ISW effect (Sachs & Wolfe Reference Sachs and Wolfe1967), the lensing effect known as cosmic magnification, and source count correlations.
The source count correlation function (or if measured in Fourier space, the power spectrum) is a well-known statistic measuring the excess probability that sources are clustered together on different scales. In the radio surveys considered here, we assume that individual redshifts will not be available, so the power spectrum will be measured on the 2D celestial sphere, by measuring the spatial auto-correlation function of the radio sources in the SPARCS surveys.
Cosmic magnification is a gravitational lensing effect, where the number density of background sources is affected by foreground structures in two competing ways. First, lensing dilates the background patch of sky, reducing the background number density. Second, the lensing expands the size of background sources while maintaining their surface brightness, resulting in an increase of apparent luminosity of sources, increasing the number density above any given detection threshold. Either of these effects can dominate depending on the luminosity function, so there may be either a correlation or anti-correlation of background number density with foreground structures. The effect is sensitive to the geometry of the Universe and the growth of structures in the Universe. In our case, we correlate background SPARCS radio sources with foreground sources from shallower optical surveys, such as SDSS (Abazajian et al. Reference Abazajian2009) for northern surveys, Skymapper (Keller et al. Reference Keller2007) or DES (The Dark Energy Survey Collaboration 2005) for southern surveys.
The ISW effect is a gravitational redshift, due to the evolution of the gravitational potential while photons pass through under- or overdensities in their path from the last scattering surface to us. In an Einstein–de Sitter universe, the blueshift of a photon falling into a well is cancelled by the redshift as it climbs out. But in a cosmology where there are evolving gravitational potentials, photons will experience a net blue- or redshift, leading to a net change in photon temperature, which accumulates along the photon path. This translates into CMB temperature anisotropies proportional to the variation of the gravitational potentials:
 \begin{equation}
\frac{\delta T}{T} \propto \int[ \dot{\Psi }(z) +\dot{\Phi }(z) ] \text{d}z .
\end{equation}
\begin{equation}
\frac{\delta T}{T} \propto \int[ \dot{\Psi }(z) +\dot{\Phi }(z) ] \text{d}z .
\end{equation}
The ISW effect can contribute significantly to the CMB temperature fluctuations on large angular scales, but it enhances only the low ℓ multipoles, and is smaller than other CMB anisotropies. For this reason, in order to detect the effect, we have to cross-correlate CMB temperature maps with tracers of the potential wells (Crittenden & Turok Reference Crittenden and Turok1996) such as galaxies; if the potential evolves, then we should observe a correlation between CMB temperature anisotropies and the galaxy distribution. For the tests considered here, we cross-correlate the SPARCS radio sources with the CMB data from WMAP or Planck.
3.6.1 Calculating probe predictions
Here we consider the measurements of the three probes discussed above (source count correlations, cosmic magnification, and ISW) and calculate the resulting constraints obtained with the LOFAR, WODAN, and EMU surveys (see Raccanelli et al. Reference Raccanelli2011 for details about the surveys and the assumed distributions and bias).
To predict the redshift distribution for these surveys, we use the latest empirical simulations developed for the SKA continuum survey (Wilman et al. Reference Wilman2008). This simulation provides different prescriptions for the redshift evolution of the various populations which dominate the radio source counts at five different radio frequencies: 150, 610, 1 400, 4 860, and 18 000 MHz. Catalogues are generated from the S 3 database,Footnote 3 using the radio flux-density limits of different surveys, and we perform our analysis by extracting a catalogue from the database with cuts at the 10 σ detection levels of the forthcoming surveys.
The S 3 simulation provides us with a source catalogue in which sources are identified by type (e.g. SB, SFG, FRI, FRII, and RQQ). The bias is computed separately for each galaxy population using the formalism of Mo & White (Reference Mo and White1996), in which each population is assigned a dark matter halo mass chosen to reflect the observed large-scale clustering. With this framework, the increasing bias b(z) with redshift would lead to excessively strong clustering at high redshift, so the bias for each population is held constant above a certain cut-off redshift (see Wilman et al. Reference Wilman2008, for details).
We calculate the angular power spectra for each of the probes, i.e. source-source, radio background–optical foreground, and source CMB. Each of these is a projection of the density power spectrum, see Raccanelli et al. (Reference Raccanelli2011) for details. For instance, the ISW cross-power spectrum is given by
 \begin{equation}
C_{\ell }^{gT} = \left\langle a_{{\ell }m}^g a_{{\ell }m}^{T*} \right\rangle = 4 \pi \int \frac{\text{d}k}{k} \Delta ^2(k) W_{\ell }^g(k) W_{\ell }^T(k),
\end{equation}
\begin{equation}
C_{\ell }^{gT} = \left\langle a_{{\ell }m}^g a_{{\ell }m}^{T*} \right\rangle = 4 \pi \int \frac{\text{d}k}{k} \Delta ^2(k) W_{\ell }^g(k) W_{\ell }^T(k),
\end{equation}
The galaxy window function, which enters all three power spectra, is written as
 \begin{equation}
W_{\ell }^g(k) = \int \frac{\text{d}N}{\text{d}z} b(z) D(z) j_{\ell }[k\eta (z)] \text{d}z,
\end{equation}
\begin{equation}
W_{\ell }^g(k) = \int \frac{\text{d}N}{\text{d}z} b(z) D(z) j_{\ell }[k\eta (z)] \text{d}z,
\end{equation}
We can write corresponding correlation functions as a function of the angular separation θ:
 \begin{equation}
C(\theta ) = \sum _{\ell } \frac{2\ell +1}{4 \pi } C_{\ell } L_{\ell }(\cos \theta ),
\end{equation}
\begin{equation}
C(\theta ) = \sum _{\ell } \frac{2\ell +1}{4 \pi } C_{\ell } L_{\ell }(\cos \theta ),
\end{equation}
3.6.2 Predictions for the pathfinders
We have calculated correlation functions or power spectra for the ISW, cosmic magnification, and source counts for the forthcoming radio surveys. For example, in Figure 20 we show our result for the CMB–LSS cross-correlation using the predicted redshift distributions and bias for the LOFAR Tier 1 survey, where we assume the standard ΛCDM+GR model and the shaded areas are cosmic-variance errors, calculated via
 \begin{equation}
\sigma _{C_{\ell }^{gT}} = \sqrt{\frac{\left(C_{\ell }^{gT}\right)^2 + C_{\ell }^{gg}C_{\ell }^{TT}}{(2\ell +1)f_{\rm sky}}},
\end{equation}
\begin{equation}
\sigma _{C_{\ell }^{gT}} = \sqrt{\frac{\left(C_{\ell }^{gT}\right)^2 + C_{\ell }^{gg}C_{\ell }^{TT}}{(2\ell +1)f_{\rm sky}}},
\end{equation}
 \begin{equation}
\sigma ^2 (\theta ) = \sum _\ell \left(\frac{2\ell +1}{4\pi }\right)^2 P_{\ell }^2(\cos {\theta }) \sigma _{C_{\ell }^{gT}}^{2} .
\end{equation}
\begin{equation}
\sigma ^2 (\theta ) = \sum _\ell \left(\frac{2\ell +1}{4\pi }\right)^2 P_{\ell }^2(\cos {\theta }) \sigma _{C_{\ell }^{gT}}^{2} .
\end{equation}
Predicted correlations of the CMB with the LOFAR Tier 1 survey data. As a comparison, we also show error bars from current NVSS measurements. Note the improvement we obtain with one of the pathfinders over current constraints on all scales.

Now we wish to predict the combined cosmological measurements that the SKA pathfinders should allow. In order to do this, we perform a joint analysis including CMB+SNIa priors, ISW, cosmic magnification, and the auto-correlation of radio sources. We test deviations from the standard ΛCDM+GR model for two cases: we first parameterise modifications of the theory of gravity; and then alternatively, we assume GR to be the correct model to describe gravity and consider a dynamical dark energy model.
3.6.3 Modified gravity constraints
We want to test deviations from GR using the {η, μ} parameters, which are defined via
 \begin{eqnarray}
\frac{\Phi }{\Psi } = \eta (a,k),
\end{eqnarray}
\begin{eqnarray}
\frac{\Phi }{\Psi } = \eta (a,k),
\end{eqnarray}
 \begin{eqnarray}
k^2 \Psi = -4 \pi G a^2 \mu (a,k) \rho \Delta ,
\end{eqnarray}
\begin{eqnarray}
k^2 \Psi = -4 \pi G a^2 \mu (a,k) \rho \Delta ,
\end{eqnarray}
 \begin{equation}
\Delta = \delta + 3 \frac{aH}{k}v;
\end{equation}
\begin{equation}
\Delta = \delta + 3 \frac{aH}{k}v;
\end{equation}
We model the time evolution of μ and η as (see Zhao et al. Reference Zhao, Giannantonio, Pogosian, Silvestri, Bacon, Koyama, Nichol and Song2010 for details)
 \begin{eqnarray}
\eta (z) = \frac{1-\eta _0}{2} \left( 1+\tanh \frac{z - z_s}{\Delta z} \right) + \mu _0,
\end{eqnarray}
\begin{eqnarray}
\eta (z) = \frac{1-\eta _0}{2} \left( 1+\tanh \frac{z - z_s}{\Delta z} \right) + \mu _0,
\end{eqnarray}
 \begin{eqnarray}
\mu (z) = \frac{1-\mu _0}{2} \left( 1+\tanh \frac{z - z_s}{\Delta z} \right) + \mu _0.
\end{eqnarray}
\begin{eqnarray}
\mu (z) = \frac{1-\mu _0}{2} \left( 1+\tanh \frac{z - z_s}{\Delta z} \right) + \mu _0.
\end{eqnarray}
Predicted constraints on parameters using EMU+WODAN. The outer dotted ellipse shows the current constraints and the innermost grey ellipse shows the constraints available using EMU+WODAN with the three probes described. Bottom panel: dark energy parameters, showing current and predicted 68% CL constraints. Top panel: modified gravity parameter constraints.

3.6.4 Constraints on dark energy evolution
To study how well the SKA pathfinders will constrain the evolution of dark energy we use the {w 0, wa } parameterisation (Linder Reference Linder2003) of the dark energy equation of state:
 \begin{eqnarray}
w(a) = w_0 + w_a (1-a).
\end{eqnarray}
\begin{eqnarray}
w(a) = w_0 + w_a (1-a).
\end{eqnarray}
3.6.5 Bias
To obtain constraints on cosmological parameters from continuum surveys, the redshift distribution and bias of radio sources needs to be known. Here we suggest a method for measuring the bias of radio sources at high redshift. We cross-match FIRST radio sources (Becker et al. Reference Becker, White and Helfand1995) with SDSS-DR7 data (Abazajian et al. Reference Abazajian2009) and use photometric redshifts in the DR7 catalogue to obtain an estimate of the redshift distribution of the optically identified sources. To probe the high-z radio continuum population, we assume that the z-distribution of all FIRST sources is given by the SKADS simulation (Wilman et al. Reference Wilman2008) and we subtract off the distribution of the optically identified sources to estimate the z-distribution of the unidentified sources. By measuring the angular correlation function of the unidentified sources and comparing this with predictions for dark matter clustering, we will then be able to estimate the bias at z ~ 0.7. Some initial results using this technique are presented in Passmoor et al. (Reference Passmoor, Cress, Faltenbacher, Johnston, Smith, Ratsimbazafy and Hoyle2013).
If SKA pathfinder surveys are to be used to measure cosmological parameters, it will be important to continue and extend this work to obtain a better estimate of bias for different classes of radio source, and also to understand the sensitivity of the derived cosmological parameters to uncertainty in the value of the bias parameter.
3.6.6 The effect of redshifts on cosmological tests
The cosmology discussion to this point makes the conservative assumption that no redshifts are available for individual radio sources, although we do know the redshift distribution of the different classes of source, and the already impressive results shown in Figure 21 are calculated using this assumption. While less than about 1% of radio sources in SPARCS surveys are likely to have spectroscopic redshifts at the time of the data releases, photometric and statistical redshift information is likely to be available for ~50% of sources, as described in Section 4.7.
Camera et al. (Reference Camera, Santos, Bacon, Jarvis, McAlpine, Norris, Raccanelli and Röttgering2012) have explored the impact of photometric redshifts on the cosmological measurements from EMU and WODAN. Using only the galaxy clustering angular power spectrum and dark energy constraints, they find that even approximate photometric redshifts obtained from SDSS and SkyMapper yield a significant improvement to the constraints provided by the radio data alone.
An alternative approach has been suggested by Norris et al. (Reference Norris2011b), using radio data alone. Sources with detected polarisation in the POSSUM survey (see Section 2.4) are virtually all AGNs, with an expected median redshift of 〈z〉~1.8, while the remaining unpolarised EMU sources will be a mixture of AGNs and SFGs, with an expected median redshift of 〈z〉~1.1. The unpolarised sources can therefore be treated as a separate population from the polarised sources for the purposes of the cosmological tests described above, giving two radio source samples at different redshift ranges, thus potentially yielding a measurement of the time-dependent component of the dark energy and modified gravity parameters. However, modelling is required to establish whether this technique yields a significant improvement over other techniques.
3.6.7 Weak lensing
Weak gravitational lensing by large-scale dark matter in the Universe distorts the images of faint background galaxies. Measurements of this ‘cosmic shear’ effect as a function of redshift can provide powerful constraints on dark energy and its evolution over cosmic time (e.g. Albrecht et al. Reference Albrecht2006; Peacock et al. Reference Peacock, Schneider, Efstathiou, Ellis, Leibundgut, Lilly and Mellier2006). The measurements require a large number of well-resolved galaxies to reduce the ‘shape noise’ associated with the intrinsic variety of galaxy shapes. Most cosmic shear studies to date have therefore been at optical wavelengths. Radio measurements have typically been less effective because of smaller number densities and poorer spatial resolution. Chang, Refregier, & Helfand (Reference Chang, Refregier and Helfand2004), however, made a statistical detection of cosmic shear in the VLA FIRST survey, and Patel et al. (Reference Patel, Bacon, Beswick, Muxlow and Hoyle2010) used VLA and MERLIN data to explore radio weak lensing techniques.
Measuring weak lensing at radio wavelengths potentially offers a number of advantages over optical surveys in terms of minimising instrumental and astrophysical systematic effects. For example, radio telescopes have highly stable and well-understood point-spread functions (PSFs), which makes them particularly suited for measuring the small distortions caused by weak lensing. In addition, a future weak lensing survey conducted with the SKA could yield redshifts for a significant fraction of the lensed galaxies through the detection of their H i emission lines (e.g. Blake et al. Reference Blake, Bacon, Fluke, Kitching, Miller, Power and Wilman2007). Uncertainties and biases associated with photometric redshift errors would consequently be greatly reduced with an SKA lensing survey.
A major astrophysical cause of systematic error in weak lensing measurements is the intrinsic alignment in galaxy shapes, caused by tidal torquing during the galaxy formation process. Cleanly separating these from the extrinsic alignments caused by weak lensing will be crucial for interpreting precision weak lensing measurements in the future. Brown & Battye (Reference Brown and Battye2011a) showed that polarisation, which is routinely measured at radio wavelengths can, in principle, discriminate between the lensing distortions and intrinsic alignments.
Blake et al. (Reference Blake, Bacon, Fluke, Kitching, Miller, Power and Wilman2007) have explored the potential of the SKA to perform a precision weak lensing survey. The potential advantages described above would make such a survey highly complementary to future large-scale optical lensing surveys. The SKA pathfinders offer excellent opportunities to develop the field of radio weak lensing and to demonstrate the above techniques and advantages on real data. For example, large-area surveys with arcsec resolution with LOFAR can test weak lensing techniques on large radio data sets. Moreover, the e-MERLIN telescope offers an exciting opportunity to perform deep sub-arcsec radio imaging over a large FOV which will be an ideal testbed for investigating radio lensing techniques. This potential has recently been recognised with the award of ~ 800 h of e-MERLIN legacy survey time for the Supercluster Assisted Shear Survey (SuperCLASS), which will image a 1.75 deg2 region of sky containing a supercluster to a depth of 4 μJy beam−1 with 0.2-arcsec resolution, including polarisation information. This study is expected to detect ~1–2 galaxies per square arcmin, which will be used to map the dark matter distribution in the vicinity of the supercluster (Brown & Battye Reference Brown and Battye2011b).
3.7 Variability and transients
Transient and variability studies are key science drivers for SKA pathfinder instruments, and potentially for the SKA as well. Here we briefly discuss some of the key issues that need to be considered and addressed on the road to the SKA, potentially via pathfinder instruments. We also highlight some of the outcomes that can potentially be achieved through future surveys.
Blind and dedicated radio transient surveys can potentially
-
• discover new classes of energetic objects (‘unknown-unknowns’),
-
• monitor known transient and variable radio sources (‘known-knowns’),
-
• search for previously undetected transient and variable sources (‘known-unknowns’),
-
• explore the intervening medium via extreme scattering events, and
-
• search for a SETI signal.
Table 1 summarises our current knowledge of variable radio sources (see also Condon et al. Reference Condon, Ledden, Odell and Dennison1979 and references therein), showing observations at a variety of cadences, frequencies, and Galactic latitudes. A complex variety of variability is reported; in some cases short timescale variations at low frequencies are attributed to interstellar scintillation, while long-term variations at GHz frequencies are in some cases attributed to AGN activity. A systematic experiment to map the surface density of variable radio sources as a function of flux, frequency, and cadence would be an invaluable step on the road to the SKA.
A selection of variable source statistics taken from the literature. ρ gives the snapshot rate of sources (deg−2). t char gives the characteristic timescale on which the variability was sampled. ΔS/S gives the fractional change in flux (please refer to individual publications for further details).

(a) 0.5% at 2.695 GHz and 0.98% at 8.085 GHz. Values are derived from the average (daily) fractional change in 16 sources.
(b) 4.1% at 0.820 GHz and 3.5% at 1.41 GHz. Values are derived from the average modulation index (rms/mean) in 13 flat spectrum sources.
(c) Also see Rickett (Reference Rickett1986).
(d) Observations in the direction of the Galactic plane.
Source variability (including bright calibrators; see Gaensler & Hunstead Reference Gaensler and Hunstead2000) may affect the calibration and clean strategies required for future surveys and will ultimately impact on the final dynamic range and image fidelity (e.g. see Stewart, Fenech, & Muxlow Reference Stewart, Fenech and Muxlow2011). Therefore, characterising the variability and abundance of known radio sources is a necessity for planning future surveys and calibration strategies. Many of the compact nJy sources to be studied by the SKA will be affected by scintillation (Dennison & Condon Reference Dennison and Condon1981; Rickett Reference Rickett1986). Furthermore, at these sensitivities highly variable sources in the range 1 μJy–1 mJy will yield a dynamic range of 1 000:1 (and greater). Carilli, Ivison, & Frail (Reference Carilli, Ivison and Frail2003) report a surface density of highly variable sources of up to 18 deg−2 (see Table 1) at a detection threshold of ~0.1 mJy: such a high abundance could seriously impact SKA surveys.
Possible transient sources range from extrasolar planets at frequencies below 50 MHz (Grießmeier, Zarka, & Spreeuw Reference Grießmeier, Zarka and Spreeuw2007) to brown dwarf flares at 8 GHz (Berger Reference Berger2002). Early blind searches for transient sources suggest that a bright (≥0.1 Jy), frequent, population of GHz transients does not exist (see e.g. Croft et al. Reference Croft2010, Reference Croft, C., Keating, Law, Whysong, Williams and Wright2011; Bower et al. Reference Bower2010; Bower & Saul Reference Bower and Saul2011; Bell et al. Reference Bell2011). The benchmark survey of Bower et al. (Reference Bower, Saul, Bloom, Bolatto, Filippenko, Foley and Perley2007) which predicted a substantial number of radio transients in the sub-mJy range has recently been revised by Frail et al. (Reference Frail, Kulkarni, Ofek, Bower and Nakar2012), lowering the predicted surface density of sources. An all-sky survey could however still potentially detect several thousand new transients, though a much lower yield would also be consistent with the current uncertainties (see e.g. Bannister et al. Reference Bannister, Murphy, Gaensler, Hunstead and Chatterjee2011; Murphy et al. Reference Murphy2012).
So far many surveys have been conducted in the GHz regime, at low frequencies, synchrotron sources may be optically thick with lower peak fluxes. Coherent processes therefore might dominate transient detections below 1 GHz, and rate estimates should differentiate between the two processes. Exploring the transient rates at low frequencies is an especially important goal for pathfinders such as LOFAR and the LWDA (Fender, Wijers, & Stappers Reference Fender, Wijers and Stappers2008; Lazio et al. Reference Lazio2010) and ultimately SKA-Low.
A goal for the transient key science projects is to sample a given field on a logarithmic range of timescales, perhaps commensally with a project revisiting a given field at a variety of timescales to build up the necessary sensitivity. A further goal of the variability studies will be to follow up on objects (such as pulsars or radio stars) which may be detected in the large continuum surveys, and may be manifested in the image as having spoke-like features, as discussed in Section 3.8.4. When the EMU and WODAN surveys start, transient and variability studies through projects such as VAST (Chatterjee et al. Reference Chatterjee and Murphy2010; Murphy et al. Reference Murphy2012) can be performed commensally via comparison with previous catalogues such as SUMSS (Bock, Large, & Sadler Reference Bock, Large and Sadler1999) and NVSS (Condon et al. Reference Condon, Cotton, Greisen, Yin, Perley, Taylor and Broderick1998). Through commensal and targeted observations a more complete census of the abundance of transients and variables can be achieved prior to SKA operations.
3.8 Galactic science
The proposed wide-field surveys such as EMU and POSSUM include the Galactic plane, giving the opportunity to create a sensitive atlas of discrete Galactic radio continuum sources. Most of these sources represent the interaction of stars at various stages of evolution with their environment. The high sensitivity of the surveys allows access to all stages of H ii regions from the optically thick hyper-compact kind presumably related to the earliest stages of a ‘turned-on’ star to large H ii regions related to massive mature or giant stars producing strong stellar winds. Due to the high resolution of these surveys we can detect the youngest, most compact supernova remnants and pulsar wind nebulae. We can detect and study planetary nebulae giving us insight in the late stages of the evolution of low-mass stars. And we can detect radio stars and pulsars. High-sensitivity polarisation surveys such as POSSUM will also open the door to the identification of currently unexplained polarisation features known as Faraday screens.
At 1.4 GHz, the main mechanisms for radio emission from discrete Galactic objects are thermal free–free emission from H ii regions and planetary nebulae and non-thermal synchrotron emission from supernova remnants and pulsar wind nebulae. Resolved Galactic sources can be separated by their spectral and linear polarisation properties. Young H ii regions such as compact, ultra-compact, and hyper-compact sources are optically thick at frequencies around 1.4 GHz, and thus easy to separate from not only Galactic but also extragalactic sources even if they are not resolved. Large evolved H ii regions have flat optically thin spectra compared with supernova remnants that may show similar structures but have steeper spectra, and are typically linearly polarised. Pulsar wind nebulae also have flat radio spectra, but are linearly polarised. Comparisons with surveys at other wavelength such as infrared or X-ray will further help to discriminate individual sources of interest for follow-up studies.
3.8.1 H ii regions
The high sensitivity of the planned wide-field 1.4-GHz surveys such as EMU and WODAN allows access to all stages of the evolution of H ii regions, even though free–free emission near 1.4 GHz will be optically thick for the very dense ultra- and hyper-compact H ii regions (UCHII and HCHII, respectively), which are too small to be resolved by a 10-arcsec beam, unless they are very nearby. UCHII and HCHII represent a very young phase in the development of an H ii region (Churchwell Reference Churchwell2002).
Expected flux densities at 1.4 GHz for the most compact H ii regions are displayed in Figure 22. The separation between ultra-compact and hyper-compact H ii regions is at a diameter of about 0.02 pc. Hence, EMU will be able to detect all ultra-compact H ii regions and also many hyper-compact objects. There is still confusion about what a hyper-compact H ii region actually is. Are they just extremely compact ultra-compact H ii regions or a new class of objects? There is evidence that HCHIIs have somewhat different spectral characteristics than the UCHIIs, which might be explained by a density gradient within the ionised gas (Kurtz Reference Kurtz2005). So far only a small number of HCHIIs are known. A more complete census of these objects with a sensitive wide-field survey is required to get a more complete picture of the evolutionary process of H ii regions. Follow-up observations at higher radio frequencies or a comparison with high radio frequency surveys is then required to determine physical characteristics which will help to unravel the true nature of these objects.
Predicted peak radio flux density of unresolved UCHIIs and HCHIIs at 1.4 GHz as a function of distance from the sun. UCHIIs and HCHIIs with different diameters are displayed. We assumed a constant electron temperature of 8 000 K, a homogeneous distribution of material, and high optical depth (τ ≫ 1.0).

We can also probe the magnetic field inside H ii regions by either studying the RM signature of polarised point sources ‘shining through’ the object (e.g. Harvey-Smith, Madsen, & Gaensler Reference Harvey-Smith, Madsen and Gaensler2011) or by studying overlapping or even related diffuse polarised emission (e.g. Foster et al. Reference Foster, Kothes, Sun, Reich and Han2006).
3.8.2 Planetary nebulae
Planetary nebulae (PNe) are the most abundant compact Galactic sources in the NVSS (Condon et al. Reference Condon, Cotton, Greisen, Yin, Perley, Taylor and Broderick1998). Condon & Kaplan (Reference Condon and Kaplan1998) identified 680 NVSS radio sources brighter than 2.5 mJy with planetary nebulae. Assuming a detection limit of 50 μJy, EMU will be able to detect unresolved PNe up to seven times farther away than NVSS, potentially leading to a significant increase of the number of PNe detected at radio frequencies. PNe can be very useful tools for measuring extinction and probing SFRs of stars not massive enough to produce supernovae or H ii regions (Condon & Kaplan Reference Condon and Kaplan1998; Condon, Kaplan, & Terzian Reference Condon, Kaplan and Terzian1999). Identification of these PNe, however, will be difficult.
The ionised low-density circumstellar material of nearby planetary nebulae, released during the Asymptotic Giant Branch (AGB) wind phase of the central stellar object, is illuminated by background linear polarised emission through Faraday rotation. Free thermal electrons embedded in a magnetised medium rotate background linear polarisation emission to create an RM signature observable at 1.4 GHz. A typical radio telescope operating in this wavelength range proves to be more sensitive to the Faraday rotation of a plasma region than to its bremsstrahlung signature. Linear polarisation studies of nearby planetary nebulae can reveal important information about the mass loss history of old AGB stars or white dwarfs that cannot be obtained easily any other way (e.g. Ransom et al. Reference Ransom, Uyanıker, Kothes and Landecker2008, Reference Ransom, Kothes, Wolleben and Landecker2010).
3.8.3 Supernova remnants
Only 274 supernova remnants (SNRs) have been discovered so far in our Galaxy (Green Reference Green2009).Footnote 4 However, the estimated population of SNRs is much higher (maybe 500–1 000; Helfand et al. Reference Helfand, Becker, White, Fallon and Tuttle2006). This discrepancy is mainly caused by a strong bias towards bright extended objects. These are the mature SNRs expanding into a medium- to high-density environment. There are two groups of missing SNRs. The compact, presumably very young, objects were missed by previous wide-field surveys, because they are either confused by other nearby objects or mistaken for extragalactic sources if they are not resolved. The second group of missing SNRs are low surface brightness SNRs. A population of more than 1 000 SNRs for our Galaxy can also be extrapolated using the Canadian Galactic Plane Survey (CGPS; Taylor et al. Reference Taylor2003) and its supernova remnant catalogue (Kothes et al. Reference Kothes, Fedotov, Foster and Uyanıker2006). The CGPS is a radio continuum and H i survey of the Outer Galaxy. Since the distance to the edge of the Galaxy, and hence to every object in the survey, is very short, the ~1 arcmin resolution at 1 420-MHz radio continuum (≤1 pc) is sufficient to resolve any SNR—even those which are very young.
EMU and POSSUM will have a very similar spatial resolution than the CGPS but much higher sensitivity. The 10-arcsec beam translates to about the same spatial resolution at the most distant edge of the Galaxy through the inner part of the Milky Way (≈20 kpc) than the CGPS beam does towards the Outer Galaxy. Hence, we would expect to detect a similar number density of SNRs. This indicates that EMU in conjunction with POSSUM could discover more than 500 new SNRs. Resolved SNRs can be easily distinguished from extragalactic sources and Galactic H ii regions by an analysis of structure and spectral and polarisation signatures.
Radio polarisation observations of SNRs can also be a powerful tool to probe the magnetic field into which these objects are expanding. SNRs act as magnifying glasses of ambient magnetic fields, since they freeze and compress it into the expanding shell of the swept up material. Radio polarisation and RM studies can reconstruct the 3D ambient magnetic field, as demonstrated in the studies by Uyanıker, Kothes, & Brunt (Reference Uyanıker, Kothes and Brunt2002), Kothes & Brown (Reference Kothes and Brown2009), and Harvey-Smith et al. (Reference Harvey-Smith, Gaensler, Kothes, Townsend, Heald, Ng and Green2010). Radio polarisation studies of SNRs with EMU and POSSUM can probe the large-scale magnetic field of the Inner Galaxy, detect potential field reversals, and probe the transition from the Galactic plane to the halo.
3.8.4 Pulsars and their wind nebulae
Pulsars generate magnetised relativistic particle winds, inflating an expanding bubble called a pulsar wind nebula (PWN), which is confined by the expanding supernova ejecta. Electrons and positrons are accelerated at the termination shock some 0.1 pc distant from the pulsar and interact with the magnetic field to produce synchrotron emission across the entire electromagnetic spectrum. At GHz frequencies, the flat spectrum PWNe stand out from steep spectrum SNRs and can be distinguished from H ii regions by their linear polarisation signal.
The high resolution and sensitivity of the proposed wide-field 1.4-GHz surveys will enable us to built a more complete census of Galactic pulsar wind nebulae down to unprecedented levels.
The number of pulsars at high Galactic latitudes is poorly constrained since most surveys concentrate on a narrow band along the Galactic plane. Out of the 1 433 pulsars with measured 1 400-MHz fluxes listed in the ATNF Pulsar Catalogue (Manchester et al. Reference Manchester, Hobbs, Teoh and Hobbs2005), 1 410 have integrated fluxes above 50 μJy. Only 310 of those have Galactic latitudes |b| > 5°. Sensitive high-resolution radio continuum surveys will enable us to get a more complete picture of the pulsar distribution in the Milky Way and their RMs will help to constrain the configuration and strength of the large-scale Galactic magnetic field.
Pulsars should be distinguishable from other point-like radio sources because of their steep radio continuum spectra, their polarisation, and artefacts caused by short-term variability. These observational signatures will be complemented by the variability and transient surveys discussed in Section 3.7.
3.8.5 Radio stars
Radio stars emit a tiny fraction of their total luminosity in the radio band. For example, the quiet Sun has a radio luminosity of 1014 W, which is only ~10−12 of its bolometric luminosity. Nevertheless, in many cases, radio observations of stars and stellar systems have revealed astrophysical phenomena, not detectable by other means, that play a fundamental role in our understanding of stellar evolution and of physical processes that operates in stellar atmospheres.
Generally, the brightest stellar radio emission appears to be associated with magnetically induced phenomena, such as stellar flares, related to the presence of a strong and/or variable stellar magnetic field (high brightness temperature) or with enhanced mass loss (large emitting surface).
Among the brightest radio sources are active stars and binary systems, including flare stars, RS CVns, and Algol binary systems, characterised by strong magnetic activity which drives high energy processes in their atmospheres. Their radio flux density is highly variable and it usually shows two different regimes: quiescent periods, during which a basal flux density of few mJy is observed, and active periods, characterised by a continuous strong flaring which can last for several days (Umana et al. Reference Umana, Trigilio, Tumino, Catalano and Rodonó1995).
Both quiescent and flaring radio emission show spectral and polarisation characteristics consistent with non-thermal radio emission, probably driven by the magnetic activity manifested at other wavelengths. In this scenario, the radio flux is due to gyrosynchrotron emission (Guedel Reference Guedel2009), caused by the interaction of the stellar magnetic field with mildly relativistic particles. A similar mechanism causes the radio emission from pre-main sequence (PMS) stars and X-ray binaries. Non-thermal radio emission is also seen from shocks of colliding winds in massive binaries.
Stellar radio flares can occur also as narrow band, rapid, intense, and highly polarised (up to 100%) radio bursts, which are particularly common at low frequency (<1.5 GHz). They are believed to be the result of coherent emission mechanisms, requiring a strong magnetic field (which may be variable) and a source of energetic particles. Coherent burst emission has been observed in RS CVns, flare stars, brown dwarfs (BD), and chemically peculiar stars (CPs) (Slee, Wilson, & Ramsay Reference Slee, Wilson and Ramsay2008; Berger Reference Berger2002; Trigilio et al. Reference Trigilio, Leto, Leone, Umana and Buemi2000). Coherent emission has been detected in just a few tens of stars, because of the limited sensitivity of the available instruments.
Stellar radio emission often exhibits significant circular polarisation (Trigilio et al. Reference Trigilio, Leto, Umana, Buemi and Leone2011; Ravi et al. Reference Ravi2010). While some extragalactic sources do exhibit circular polarisation (e.g. Rayner, Norris, & Sault Reference Rayner, Norris and Sault2000), the degree of polarisation is small (typically ~ 0.01%), compared with the levels up to 100% seen in radio stars. It is therefore important, for the purposes of distinguishing stars from extragalactic objects, that surveys record circular as well as linear polarisation.
Thermal emission (bremsstrahlung emission) is expected from winds associated with WR and OB stars, shells surrounding PNe, and novae and jets from symbiotic stars and class 0 PMS stars (Guedel Reference Guedel2002). In all these cases, radio continuum emission is an important diagnostic to understand the underlying physics. For example, radio continuum observations are the most precise way yet to determine the mass loss of stellar winds. This is particularly important when other diagnostics cannot be used, such as in the case of dust-enshrouded objects (Umana et al. Reference Umana, Buemi, Trigilio and Leto2005).
Since no sensitive survey for radio stars has yet been conducted, little statistical information on stellar radio emission is available. Forecasts of the number of sources detectable with SPARCS surveys rely on radio observations of small samples of stellar sources, usually selected on the basis of observed peculiarities at other wavelengths. Assuming typical radio luminosities for each type of radio star, we conclude that stellar winds and non-thermal radio emission from many active binaries, flares stars, PMS will be easily detected with an rms sensitivity of 10 μJy beam−1 (EMU), while SKA (1 μJy beam−1 rms) will be able to detect a quiescent Sun at 10 pc (see Figure 23).
Typical radio spectrum of several classes of radio emitting stars. Fluxes have been derived from the radio luminosity (Seaquist, Krogulec, & Taylor Reference Seaquist, Krogulec and Taylor1993; Guedel Reference Guedel2002; Umana, Trigilio, & Catalano Reference Umana, Trigilio and Catalano1998; Trigilio et al. Reference Trigilio, Leto, Umana, Buemi and Leone2008; Berger Reference Berger2006) assuming an appropriate distance for each type of radio star (10 pc for flare stars, 100 pc for active binary systems, 1 kpc for supergiants, OB and WR, 500 pc for CP stars). The bandwidth and sensitivity of EMU have also been indicated.

Until now, targeted observations of well-known radio stars have constituted the best approach to investigate their radio emission mechanisms (e.g. flare development, spectral and polarisation evolution, emission mechanism, etc.). An all-sky survey would significantly enlarge the known stellar radio emitting database, free from selection effects. Results from such a survey would provide new insights into the physics of active stellar systems and plasma processes.
Two areas of stellar radio emission will particularly benefit from SKA and SPARCS surveys. One is the study of gyrosynchrotron stellar flares, where multi-epoch, multi-frequency observations will enable the detection of serendipitous flaring activity, allowing the derivation of a typical behaviour (occurrence rate, variation amplitude, etc.) from a statistical study of a larger source population. Moreover, detailed studies of a large number of stellar coronae will be possible, allowing us to understand the nature of energy release in the upper atmospheres of stars of different mass and age and to investigate the correlation between radio and X-ray emission and thus on the Neupert effect (Guedel Reference Guedel2009). The expected sensitivity will also test the presence of superflares on solar-type stars, and search for correlations with an orbiting hot Jupiter (Maehara et al. Reference Maehara2012).
The other important area is related to the study of coherent emission. The EMU plus WODAN surveys will offer the best opportunity yet to determine how common coherent radio emission is from stellar and sub-stellar systems. The detection of coherent emission from a large fraction of surveyed stars will have immense implications for our understanding of both stellar magnetic activity and the dynamo mechanism generating magnetic fields in fully convective stars and brown dwarfs (Hallinan et al. Reference Hallinan, Antonova, Doyle, Bourke, Lane and Golden2008; Ravi et al. Reference Ravi, Hallinan, Hobbs and Champion2011). Coherent emission observed in active and BD stars shares several characteristics with that observed in CP stars (Trigilio et al. Reference Trigilio, Leto, Leone, Umana and Buemi2000), since both require a large-scale magnetosphere and are similar to the low frequency coherent radio emission observed from the magnetised planets in our solar system (Trigilio et al. Reference Trigilio, Leto, Umana, Buemi and Leone2011). The well-known topology of CPs magnetic fields, independently derived from optical observations, makes this kind of object an excellent laboratory for stellar magnetosphere studies. Matching of predicted emission with that observed yields parameters of the radio source, such as the surface magnetic field, the number density of the emitting electrons, and the energy spectrum of the electrons. In turn, this provides clues to the acceleration process, the size of the magnetosphere (Alfvén radius) and the inclination of the rotational axis.
If coherent emission is present in many radio active stars, with the same characteristics, it will constitute an excellent diagnostic for star magnetospheres, and a powerful probe of magnetic field topology. In one CP star (CU Vir) the coherent emission is stable on a timescale of years, and has been used to time the rotation of the star, revealing a likely change of its period (Trigilio et al. Reference Trigilio, Leto, Umana, Buemi and Leone2008; Ravi et al. Reference Ravi2010). The discovery of other similar radio lighthouses will enable high-precision studies of the rotation period, and thus angular momentum evolution, in different classes of stars.
3.9 Unexpected discoveries
Experience has shown that many great discoveries in astronomy have been made, not by testing a hypothesis, but by observing the sky in an innovative way. The necessary conditions for this to take place are (a) a telescope observing an unexplored part of the observational phase space (frequency, resolution, time domain, area of sky, etc.); (b) an intelligent observer who understands the instrument sufficiently well to distinguish between artefact and discovery; and (c) a prepared and enthusiastic mind ready to accommodate and interpret a new discovery.
SKA pathfinder surveys will easily satisfy (a), if only in terms of the numbers of objects surveyed. However, their petabytes of data, and arms-length access, may prevent an observer from satisfying (b) and (c). Although we may hope that someone will eventually stumble across any unexpected phenomena in the data, the impenetrable size of the database implies dark nooks that may never be fully explored. If we rely on serendipity, discoveries may remain undiscovered, for ever.
An alternative is to harness data-mining techniques to help the intelligent observer search for the unexpected. For example, the WTF (Widefield ouTlier Finder) (e.g. Norris et al. Reference Norris2011b) project will systematically mine the EMU database, searching for the unexpected by discarding objects that already fit known classes of object, using a variety of approaches including
-
• decision tree analysis
-
• cluster analysis
-
• k-furthest neighbour (kFN) by analogy with the kNN technique (P.-C. Zinn et al., in preparation)
-
• Bayesian analysis.
Identified objects/regions will be either processing artefacts (which are themselves important for data quality control), statistical outliers of known classes of object, or, in a few cases, genuinely new classes of object.
4 TECHNICAL CHALLENGES
4.1 Survey design and quality
The SKA pathfinder radio continuum surveys may be characterised by the following parameters:
-
• point-source detection limit,
-
• angular resolution,
-
• brightness sensitivity,
-
• dynamic range,
-
• frequency coverage,
-
• polarisation,
-
• accuracy:
-
– flux densities,
-
– positions,
-
– polarisation,
-
– image fidelity,
-
– uniformity in sensitivity.
-
All of these need to be addressed for these surveys. Ironically, the more ambitious a survey, the more susceptible it will be to small systematic errors. The ambition of the surveys therefore needs to be matched by a corresponding level of effort to understand subtle sources of error and uncertainty. For example, many radio astronomers have been content to tolerate 10% uncertainty in their measurements of flux density, while we know that our instruments are, in principle, capable of measuring flux densities to 1%. Reasons for this failure include deconvolution errors, errors in primary beam shape and pointing, failing to correct for missing extended flux, resolution bias, bandwidth smearing, time smearing, CLEAN bias, Eddington bias, etc. To overcome these effects (and probably find new effects which we have not yet met) will doubtless require a significant amount of effort to understand the instrument and its errors, but that effort is justified by the scientific return from these enormous surveys.
It will also be important to present the data to users in ways that are clear and unambiguous, with uniform coverage and easily understood survey parameters. For example, most surveys produce catalogues chosen at a ~5σ level of confidence. For some purposes, a less reliable catalogue at a 3σ level (for greater numbers of sources) may be useful, while for other studies a threshold of 8σ or 10σ level (for greater reliability) may be more appropriate (e.g. Raccanelli et al. Reference Raccanelli2011 assume 10σ). While an 8σ subset can always be chosen from a 5σ sample, it may cause less confusion amongst users for the survey to generate these different levels of catalogue.
It is also important to remember that these surveys will be used for purposes that have not yet been thought of. For example, one of the most exciting results from the NVSS was the measurement of the RM sky (and hence the Galaxy’s magnetic field; Taylor et al. Reference Taylor, Stil and Sunstrum2009). That was not planned at all during the survey, but was subsequently possible because the survey had excellent continuum calibration.
Management of large surveys is likely to be an issue, with previous large radio surveys having had relatively few people with the responsibility for conducting the survey in contrast to the emerging model in which large teams are responsible.
4.2 The SPARCS reference fields
The uniformity required from the SPARCS surveys cannot be achieved by simply ensuring that the calibrators are on the same flux scale, although this is an essential first step. For example, the fluxes of strong sources in the first ATLAS data release (Norris et al. Reference Norris2006; Middelberg et al. Reference Middelberg2008b) agreed with those measured by the VLA, while weaker ATCA sources were systematically weaker than weak VLA sources, an effect which turned out to be caused by incorrect assumptions about bandwidth smearing in mosaicked ATCA data (Hales et al. Reference Hales, Murphy, Curran, Middelberg, Gaensler and Norris2012). Other subtle flux-dependent effects doubtless await us, and consistency between our calibrator sources will not be sufficient to detect or fix them. There have even been suggestions of declination-dependent calibration effects (Parra et al. Reference Parra, Conway, Aalto, Appleton, Norris, Pihllström and Kewley2010).
During the commissioning of the SPARCS telescopes, particularly those using the relatively untried PAF technologies, it will be important to repeatedly survey well-studied fields containing a grid of sources, pushing the sensitivity and dynamic range until all the effects are well understood and can be corrected for.
The measured flux densities of sources in radio surveys are subject to a large number of subtle corrections and bias effects, and even expert radio astronomers do not always agree on these. For example, there is a continuing debate on the measured scatter in the radio source counts at low flux densities (see Figure 3), with some proponents arguing that it is caused by cosmic variance, and others arguing that it is due to processing and calibration differences. In some cases, reprocessing or reobserving (e.g. Condon et al. Reference Condon2012) has shown that some variations are caused by different processing paths, although cosmic variance may be sufficient in other cases. The problem may be even worse for EMU and WODAN, as both rely on new PAF technology. To extract the maximum science output from these major projects, relying on new PAF technology that has yet to be sufficiently battle tested, requires careful characterisation of individual survey systematics.
To achieve this, we propose three reference fields at declination ~ + 30°, 0°, and −30°), which can be observed by all existing and new radio telescopes. Where possible, they have been chosen to overlap with a field that is well studied at other wavelengths, to maximise the science to be obtained from these observations. The two southern fields are in the CDFS-ATLAS field (Norris et al. Reference Norris2006) and the COSMOS field (Schinnerer et al. Reference Schinnerer2007). A northern field (15:30, +29:00) has been chosen within the overlap range of ATCA and Westerbork, within the SLOAN survey area, and at least 2.5° away from any strong (>0.5 Jy) sources. It is planned to observe all three fields, as far and deeply as possible, with all existing survey telescopes (VLA, ATCA, Westerbork, LOFAR, GMRT, etc.) as well as the new SPARCS surveys.
4.3 Calibration
Calibration and imaging of SKA pathfinder surveys is likely to present significantly new challenges compared to earlier surveys. For example:
-
• Direction-dependent calibration is likely to be important not only for low frequencies, such as LOFAR, but also for intermediate frequencies, such as EMU and probably even for VLA and MeerKAT.
-
• Because all data are acquired in a spectral-line mode, flagging the data for RFI affects the weighting of the data.
-
• The timescale of gain variations, such as those resulting from pointing errors, is important. For example, wind gusts have a particularly dramatic effect on pointing errors, in part because the errors scale as the square of the wind velocity. The result is quite rapid pointing variations, which may be difficult to track and correct.
-
• Experience from multi-epoch observations with the WSRT has illustrated the importance of monitoring the calibration information over time. In particular, there can be time variability of the calibration information (e.g., a variable source in the FOV of the calibrator), which could affect the calibration or result in apparent variables.
-
• The scientific drivers for high dynamic range imaging need to be identified and kept clear. There may not be a need for uniform and high dynamic range across the entire sky.
4.4 Imaging
At the excellent sensitivities offered by SKA pathfinder telescopes, imaging and calibration algorithms need to deal simultaneously with issues of
-
• wide bandwidth (e.g. primary beam corrections and polarisation leakage terms change with frequency),
-
• wide-field imaging,
-
• advanced multi-scale deconvolution techniques for imaging extended emission,
-
• directionally-dependent effects such as instrumental and ionospheric errors,
-
• the need for high dynamic range and high polarisation purity.
Furthermore, the inherent data volumes are large (typically petabytes) so that computational efficiency and the number of data traversals are important parameters to consider in designing post-processing strategies.
4.4.1 Existing algorithms
Two distinct approaches are being pursued in the community to correct for wide-field and direction-dependent effects, which can be classified as (a) projection algorithms and (b) faceting algorithms (Bhatnagar Reference Bhatnagar2009).
Projection algorithms are based on physical modelling of the various direction-dependent (DD) terms of the measurement equation and incorporating them as part of the forward and reverse transforms. These algorithms therefore do not require assumptions about the source brightness distribution. This allows them to take advantage of the FFT algorithm for Fourier transforms, as well as integrate well with advanced deconvolution techniques for scale-sensitive wide-band imaging.
Faceting algorithms, on the other hand, are based on data partitioning in such a way that standard direction independent techniques can be applied to the partitions (Nijboer & Noordam Reference Nijboer and Noordam2007; Mitchell et al. Reference Mitchell, Greenhill, Wayth, Sault, Lonsdale, Cappallo, Morales and Ord2008; Smirnov Reference Smirnov2011). This approach is phenomenological by design requiring no physical understanding or modelling of the DD term in the measurement equation. They can however suffer from non-optimal use of the available signal-to-noise ratio (due to data partitioning), curse of dimensionality (too many degrees of freedom) and computational load. To alleviate some of these problems, in addition to the problem of degrees of freedom, assumptions about the structure of the brightness distribution typically have to be made.
The W-Projection algorithm (Cornwell, Golap & Bhatnagar Reference Cornwell, Golap and Bhatnagar2008) incorporates the effects of non-coplanar baselines and corrects for its effects during imaging. The A-Projection algorithm (Bhatnagar et al. Reference Bhatnagar, Cornwell, Golap and Uson2008) similarly accounts for the time, frequency, and polarisation dependence of the antenna primary beams modelling the antenna aperture illumination patterns (or the measured illumination patterns). The combined AW-Projection algorithm therefore can be used at low frequencies where the effects of the W-Term as well as that of antenna primary beams limit the imaging performance. Antenna pointing errors are thought to limit the imaging performance at high frequencies and in mosaic imaging at all frequencies. Using A-Projection for forward and reverse transforms, the Pointing SelfCal algorithm (Bhatnagar, Cornwell, & Golap Reference Bhatnagar, Cornwell and Golap2004) solves for the time-dependent antenna pointing errors. The pointing solutions are then incorporated as part of the A-Projection to correct for the effects of antenna pointing errors.
The Multi-Scale Clean (Cornwell Reference Cornwell2008) and Asp-Clean (Bhatnagar & Cornwell Reference Bhatnagar and Corwnell2004) algorithms are advanced image deconvolution techniques for imaging fields with extended emission. The MS-MFS algorithm (Rau & Cornwell Reference Rau and Cornwell2010) for wide-band multi-frequency synthesis not only deals with the deconvolution of extended emission, but also accounts for spatially resolved spectral index variation across the FOV. The combination of AW-Projection and MS-MFS algorithms can therefore be used to account simultaneously for all the dominant wide-field wide-band effects which are expected to limit the imaging performance with SKA pathfinder telescopes.
The algorithmic design of the combined AW-Projection and MS-MFS algorithm is such that it falls in the category of embarrassingly parallel algorithm. To mitigate the fundamentally higher computing load, work is in progress to deploy these combined advanced algorithms on high-performance computing (HPC) platforms, typically consisting of a cluster of computers with multi-core CPUs and high bandwidth interconnect (Bhatnagar, Ye, & Schiebel Reference Bhatnagar, Ye and Schiebel2009).
Since these algorithms also need to iterate over a large volume of data, computing clusters connected to a parallel file system (e.g. the Lustre file system) and using multi-threaded I/O techniques are currently being used. Tests with up to a few Terabytes of data show close to linear scaling in computing with number of computing nodes, although this is subject to the achievable compute-to-I/O ratio. Work is in progress to address the problem of improving this ratio while keeping the resulting memory footprint in reasonable limits. For SKA-sized data sets, iterating over the entire data set might not be feasible. Work is in progress to devise computing schemes and algorithms that may eliminate or at least reduce the number of iterations involving the entire data.
4.4.2 Development of new deconvolution algorithms
In the last few years, the theory of compressed sensing (CS; Donoho Reference Donoho2006; Candès, Romberg & Tao Reference Candès, Romberg and Tao2006) has been developed by the signal/image processing community, and may be applicable to radio-astronomical image deconvolution.
The theory of CS mostly addresses random sampling, sparse signals, and coarse-grained dictionaries. In radio interferometry, sampling is usually structured, astronomical images are not sparse, and dictionaries must be fine-grained to adequately represent the images. Theoretical CS results therefore do not usually improve estimates of astrophysical sources from interferometric data. However, a key ingredient of the CS framework, sparse representations (Mallat Reference Mallat2008), has demonstrated significant improvements in radio-astronomical deconvolution, and has been used as a tool for deconvolution of extended and diffuse sources in the image plane (Wiaux et al. Reference Wiaux, Jacques, Puy, Scaife and Vandergheynst2009a; Li et al. Reference Li, Cornwell and de Hoog2011a; Dabbech, Mary, & Ferrari Reference Dabbech, Mary and Ferrari2012) as well as in Faraday depth (Li et al. Reference Li, Brown, Cornwell and de Hoog2011b).
Sparse representation theory (Fornassier Reference Fornassier2010) may be seen as a generalisation of ideas exploited in clean (e.g. Högbom Reference Högbom1974; Wakker & Schwarz Reference Wakker and Schwarz1988; Cornwell Reference Cornwell2008). clean performs an iterative deconvolution by using a dictionary of shifted PSFs to construct a sparse dictionary of point sources. Sparse representation theory aims to construct a dictionary of more complex geometrical features than point sources, addressing three fundamental issues of astronomical image restoration. First, the sparsity of the dictionary reduces the indeterminacy and instability caused by the zeros of the transfer function of an interferometer. Second, the theory allows flexible and sophisticated models that can cope with complex astrophysical sources. Third, it offers computationally efficient optimisation techniques to solve the resulting deconvolution problem.
Sparse representations can take either of two approaches: synthesis and analysis (Elad et al. Reference Elad, Starck, Querre and Donoho2005).
In the synthesis approach, the unknown intensity distribution x (of size (N, 1), say) is assumed to be sparsely synthesisable by a few atoms of a given full rank dictionary S of size (N, L). Hence, we write x as x = S ± bγ, where ±bγ (the synthesis coefficients vector) is sparse. In contrast, the analysis approach assumes that x is not correlated with some atoms of an analysis dictionary A of size (N, L): A T x is sparse.
Since real images can often be approximated by a linear combination of a few elementary geometrical features, the synthesis approach is more intuitive and has been the focus of more research. Its design simplicity has also made it popular in image processing applications such as compression, de-noising, and in-painting. However, because a synthesis-based deconvolved image is restricted to a subspace of the synthesis dictionary, the resulting astrophysical images may be too rough to be realistic. On the other hand, since the signal is not built from a small number of atoms, the analysis approach may be more robust to ‘false detections’. However, the number of unknowns in the synthesis approach (the number of atoms in the dictionary) may be much larger than in the analysis approach. Thus, while analysis-based optimisation strategies may be computationally and qualitatively more efficient for large dictionaries (Starck, Murtagh, & Fadili Reference Starck, Murtagh and Fadili2010), the question of which approach is best remains open (Gribonval & Schnass Reference Gribonval and Schnass2009, and references therein).
Regardless of the approach chosen, a sparsity-based deconvolution method still requires a dictionary, chosen from a class of images (Mallat Reference Mallat2008). Astronomical wavelet dictionaries are widely used, but sometimes fail to represent asymmetric structures adequately. In such cases, it may be necessary to use other transforms designed for specific classes of objects, such as curvelets, which are optimum for curved, elongated patterns such as planetary rings or galaxy arms, and shapelets, which are often optimum for galaxy morphologies. Modelling complex images may require several dictionaries to be concatenated into a larger dictionary (Chen, Donoho & Saunders Reference Chen, Donoho and Saunders1998; Gribonval & Nielsen Reference Gribonval and Nielsen2003), although computational issues limit the size of dictionaries, especially for radio synthesis images containing hundreds of thousands of Fourier samples.
Several deconvolution methods that combine these approaches have recently been suggested (e.g. Suksmono Reference Suksmono2009; Wiaux et al. Reference Wiaux, Jacques, Puy, Scaife and Vandergheynst2009a, Reference Wiaux, Puy, Boursier and Vandergheynst2009b; Vannier et al. Reference Vannier, Mary, Millour, Petrov, Bourguignon and Theys2010; Wenger et al. Reference Wenger, Darabi, Sen, Glassmeier and Magnor2010; McEwen & Wiaux Reference McEwen and Wiaux2011)), including successful simulations of SKA pathfinder observations. Li et al. (Reference Li, Cornwell and de Hoog2011a) present a classical synthesis approach with an IUWT (Isotropic Undecimated Wavelet Transform) synthesis dictionary, Carillo, McEwen, & Wiaux (Reference Carrillo, McEwen and Wiaux2012) used an analysis approach using a concatenation of wavelet bases, and Dabbech et al. (Reference Dabbech, Mary and Ferrari2012) defined a hybrid analysis-by-synthesis approach.
While the theoretical results of CS have not yet generated tools which can be used routinely for synthesis imaging, they have brought new perspectives from the domain of sparse representations: improved sparsity models and improved optimisation algorithms. The increased research effort on fundamental models for sparse representations (analysis/synthesis/hybrid models) leads to improved models and thus to improved reconstruction. Research in sparse representations is active and growing, and promises valuable future developments in radio-astronomical deconvolution algorithms.
4.5 Source extraction and measurement
There are many approaches to source extraction, each with different strengths and weaknesses, so it is important to mount a joint effort to determine how an optimum source finder would work, and what algorithms to implement. In such a joint effort, a reference data set should be subjected to the various algorithms, for optimum comparability.
Building a source finder is likely to be subject to compromise, and current source finders fall well short of what may be theoretically achievable. For example, no source finder currently accounts for variations in the PSF across the image. Development of an ‘optimum’ source finder may well require collaboration with computer scientists with no astronomy background to develop signal extraction algorithms. It is likely that no single algorithm will be optimum for all scenarios.
4.5.1 Compact source extraction
Two main areas of recent focus have been investigations into the impact of background and noise estimation on the detection of compact sources, and a rigorous comparison of existing source finding software tools. The first of these focuses on source detection, where the background and noise levels in an image are characterised (Huynh et al. Reference Huynh, Hopkins, Norris, Hancock, Murphy, Jurek and Whiting2012).
The second focuses on source characterisation, where islands of pixels are described or fit in some well-defined manner (Hancock et al. Reference Hancock, Murphy, Gaensler, Hopkins and Curran2012). The most common way to describe a source in radio astronomy is as a group of Gaussian components.
The process of background characterisation has been explored by Huynh et al. (Reference Huynh, Hopkins, Norris, Hancock, Murphy, Jurek and Whiting2012), who tested the steps of background and noise measurement, and of the choice of a threshold high enough to reject false sources yet not so high that the catalogues are significantly incomplete. This analysis explored the results from testing the background and thresholding algorithms as implemented in the SExtractor, Duchamp/Selavy, and sfind tools on simulated data. The result of this analysis shows clearly that it will be crucial to first develop and then implement an automated algorithm for establishing the appropriate scale size on which to estimate the ‘local’ background and rms noise values for each image, and that this may not be common to all images. This analysis also suggests that the false discovery rate approach (Hopkins et al. Reference Hopkins2002) to thresholding may be the most robust, optimising for both completeness and reliability.
The source characterisation stage has been found to have its own distinct issues (Hancock et al. Reference Hancock, Murphy, Gaensler, Hopkins and Curran2012). For a selection of commonly used source finding tools (sfind, SExtractor, imsad, and Selavy) there are significant differences in the way that islands of sources are divided into components and subsequently fit. This is exacerbated with examples of sources which are blended or adjacent, especially when there is a large difference in the relative flux densities (even though the fainter component(s) may in their own right be very high signal-to-noise ratio objects). Such behaviour has particular implications for variable objects. If one such source were variable or transient, this behaviour could be missed if a source finding program is not able to correctly decompose the island. If a source finder’s ability to decompose an island into components is related to the clipping limit, or background noise, then a source of constant flux could be interpreted as transient or variable due to irregularities in the source characterisation process.
These issues have triggered the development of new algorithms (e.g. Hancock et al. Reference Hancock, Murphy, Gaensler, Hopkins and Curran2012; Hales et al. Reference Hales, Murphy, Curran, Middelberg, Gaensler and Norris2012) that aim to determine the correct number of components within an island, and to generate an initial parameter set for the fitting of multiple Gaussian components. Hancock et al. (Reference Hancock, Murphy, Gaensler, Hopkins and Curran2012) use a Laplace transform, to identify regions of negative curvature in the pixel intensity profiles, combined with the map defined from the islands of pixels above a threshold, to automate the process of identifying the numbers of components in each island, and their initial position and peak flux density estimates.
Another clear requirement that has developed from these analyses is the need to quantify the false detection rate of sources as a function of signal-to-noise ratio level, and perhaps other image or telescope parameters, in order to assess the likelihood that any detected source is actually real. The impact of even a 0.1% false detection rate when catalogues of many tens or hundreds of millions of sources are being anticipated is clearly large.
These initial steps have demonstrated that while source finding has been ubiquitous in radio astronomy for many decades, there is still scope for optimising and quantifying the process, and that careful attention will need to be paid to these details in the lead up to the new generation of radio telescopes. There will be many lessons to be learned in order to ensure that source measurement using the SKA, ultimately, can be made as robust as possible.
4.5.2 Extended source extraction
Many of the feature recognition algorithms widely applied in fields such as optical character recognition, machine vision, or medical imaging are absent from the repertoire of techniques routinely employed by astrophysicists. However, the increasing complexity and scale of astronomical data are driving an interest in more advanced feature extraction techniques for astronomical contexts. In particular, radio surveys on next-generation telescopes will generate image data containing tens of millions of astronomical sources, many of which will be extended.
Localised kernel transforms, such as the wavelet transform, are often used for astronomical purposes, including diffuse source detection (e.g. detection of diffuse X-ray emission in the COSMOS field; Finoguenov et al. Reference Finoguenov, David, Zimmer and Mulchaey2006). They are created either by modifying a conventional kernel transforms, or by using exotic basis functions, and are supplemented by a localisation algorithm to allow the target to be located. The success of these methods relies on ‘matching’ the basis function to the problem at hand. Given the variety of source morphologies in astronomical images, no single transform will adequately detect all sources. Localised kernel transforms work best in cases where a single class of objects can be matched to a suitable set of basis functions, and can also be used to separate diffuse from point source components using curvelet, ridgelet, or á trous transforms (e.g. Figure 24).
Feature extraction in the HST image of Abell 370 from Starck, Donoho, & Candés (Reference Starck, Donoho and Candés2003). The top left panel shows the original HST image, top right shows the co-added image from the ridgelet and the curvelet transforms which extract extended features, bottom left shows the reconstruction from the à trous algorithm which responds to point sources, and bottom right shows the addition of the results of all three transforms.

Compressive processes rely on the fact that pixels in an image are not independent, so it is possible to encode the patterns in the image rather than the pixel-by-pixel information. This provides a more efficient ‘compressed’ representation of the information by providing a ‘model’ of the image. Object detection is then applied to this ‘model’ rather than to the real data, greatly reducing the complexity of the problem. Compression attempts to preserve the information inherent in the original image but does not attempt to abstract geometric or semantic information. Compressive techniques therefore preserve large-scale noise features in addition to diffuse sources. The use of compressive sampling for deconvolution has been discussed in Section 4.4.2.
Template matching is a process where an image is correlated with a target object of known form, and is similar to ‘matched filtering’. This technique has been used in radio astronomy for pulsar timing prediction (van Straten Reference van Straten2006; Oslowski et al. Reference Oslowski, van Straten, Hobbs, Bailes and Demorest2011), transient source detection (Trott et al. Reference Trott, Wayth, Macquart and Tingay2012), and to remove radio point source contaminants from diffuse source backgrounds (Pindor et al. Reference Pindor, Wyithe, Mitchell, Ord, Wayth and Greenhill2011). Two disadvantages of template matching are that (a) it is hard to control the required number of filters, resulting in a greater number than for localised kernel transforms, and (b) each template must fit a range of orientation and scaling. Even when the computational complexity of template matching is reduced by combining it with a scale-invariant transform such as the Mellin transform, orientation must still be calculated making this technique very computationally expensive. On the other hand, it has the advantages that (a) the templates do not have to be precise, and cartoon-like models suffice; (b) the method is robust against artefacts; (c) it can be applied in either the image or Fourier domains; and (d) it returns the size, orientation, location type of detected sources.
Hough transforms can find and characterise geometrical objects such as lines, circles, and ellipses. In general, the Hough transform is equivalent to template matching for some geometric shape, although it inherently incorporates scaling and orientation constraints. Circle or elliptical Hough transforms are particularly relevant to astronomical source detection to determine questions such as the size and location of a circle/ellipse, and have the advantage that the geometrical abstraction limits the number of filters required (e.g. different types of objects contain circular and arc-like features). The circle Hough transform (CHT) can find partial circular objects and is robust to noise. The CHT inputs an image and outputs a 3D array in which two dimensions represent the possible locations for the centres of circles and the third dimension spans the set of possible circle radii. Peaks in this so-called ‘Hough space’ therefore correspond to circles in the input image. In its simplest form, the circle Hough transform is computationally challenging, with both computational effort and memory consumption scaling as O(n 3) when transforming an n×n pixel image. Recently, the transform has been recast via a convolution approach which reduces the complexity to O(n 2)log n (Hollitt Reference Hollitt2009, Reference Hollitt2012). Although this is not the fastest approach for astronomical source detection, it has been applied as a source detection method for a variety of extended radio sources with arc-like features including supernova remnants, tailed radio galaxies, and radio relics (Hollitt & Johnston-Hollitt Reference Hollitt and Johnston–Hollitt2009, Reference Hollitt and Johnston–Hollitt2012). For example, Figure 25 shows the detection of a supernova remnant. Hough transforms return semantically useful information such as position, size, orientation, and eccentricity, but will produce somewhat less information than a full template matching process. For example, it cannot distinguish between a supernova remnant and a tailed radio galaxy.
Application of the circle Hough transform to detect radio supernova remnants in the Molonglo Galactic Plane Survey. Left to right: the original image of G315.4−2.3, the location and size of the remnant as found by the CHT, the original image with ten times the Gaussian noise and the response of the CHT in the noise case (yellow) compared with the original (black), which demonstrates the robustness of CHTs to noise (Hollitt & Johnston-Hollitt Reference Hollitt and Johnston–Hollitt2012).

Segmentation methods assume nothing about a source but rather seek to group pixels together based on differences with the background. Three main classes of segmentation methods are used in astrophysics: region growing, edge detection, and waterfalling. The simplest version of a segmentation method is to set a threshold and assume everything above that threshold is a target. In practice, adjoining pixels above the threshold are grouped together as a single target. This approach is usually too simplistic and requires an extension via one of the three subclasses above. Region growing, which includes floodfilling techniques, compares adjacent pixels at the edge of a target and groups them together based on some tolerance in pixel value (e.g. Duchamp and BLOBCAT; Whiting Reference Whiting2012; C. A. Hales et al., in preparation). This technique alone is poor at dealing with disjointed areas, although it may be heuristically augmented to define nearby areas as one object. Another method, edge detection, uses thresholds to find the borders between different ‘types’ of pixel. This is rarely useful in astronomy because sources have ‘soft’ edges. Waterfalling involves considering the image as a topographic surface and calculating the intensity gradient, pixels with the lowest gradient denoting watershed lines which are used to bound regions. An advantage of segmentation methods is their speed, making them good for large area surveys. One of the downfalls of segmentation methods is that no semantic information is returned. An additional classifier step is required to be applied to the output of segmentation algorithms to determine semantic properties.
While algorithms for the detection of point sources are well established, automatic detection and characterisation of diffuse sources presents a significant challenge to large radio surveys. While methods such as local kernel transforms, template matching, and Hough transforms have been demonstrated to detect and characterise diffuse sources, they are too computationally expensive to apply to large images. The favoured approach at present is therefore a combination of segmentation algorithms with heuristics to extract diffuse source catalogues. This combined process is not likely to be sufficient for future survey science goals and some combination of techniques, possibly applied on different resolution scales, will be required.
4.6 Classification and cross-identification
The large area surveys proposed by the SKA pathfinder projects will return many tens to hundreds of millions of sources, requiring automated techniques both to group components into sources and to identify the counterparts at other wavelengths.
Table 2 lists the current, or planned, large-area multiwavelength surveys that have significant overlap with next-generation radio surveys. Based on analysis of current deep multiwavelength fields such as COSMOS and GOODS-N (Scoville et al. Reference Scoville2007; Schinnerer et al. Reference Schinnerer2007; Morrison et al. Reference Morrison, Owen, Dickinson, Ivison and Ibar2010; Giavalisco et al. Reference Giavalisco2004), we estimate that, assuming a limit of rms ~ 10 μJy beam−1 at 1.4 GHz, ~50% will have counterparts in areas coincident with deep optical surveys (i.e. DES and Pan-STARRS), while ~70% will have near-IR counterparts in the overlap regions with surveys such as Vista Hemisphere Survey (VHS) and VIKING. However, because most of the deeper surveys only cover small areas, about 50% of radio sources will have no counterparts at other wavelengths, with this fraction falling to at most 30% in the ~1 000–2 000 deg2 overlap with the deepest large-area optical–near IR surveys.
Key multiwavelength surveys with which EMU/WODAN data will be cross-identified (restricted to surveys larger than 1 000 deg2) adapted from Norris et al. (Reference Norris2011b). All magnitudes are in AB.

Notes. The ‘detectable’ column is the fraction of 1.4-GHz EMU/WODAN sources that are in principle detectable by the multiwavelength survey to its 5σ limit. The ‘matched’ column is the fraction of 1.4 GHz sources which are both detectable and in the area of sky covered by the multiwavelength survey. The sensitivity shown for the WISE survey is for the 3.5 μm band.
aDenotes 5σ point source detection. However, in many cases, a priori positional information will enable 3σ data to be used, resulting in a higher detection rate.
bBeing an H i survey, WALLABY will measure redshifts for all detected galaxies out to z = 0.26.
cPer 4 km s−1 channel achieved in 8-h integration.
References. 1Wright et al. (Reference Wright2010); 2Kaiser et al. (Reference Kaiser2010); 3B. S. Koribalski et al. (in preparation); 4Ivezic et al. (Reference Ivezic, Tyson, Allsman, Andrew and Angel2008); 5Keller et al. (Reference Keller2007); 6 http://www.ast.cam.ac.uk/research/instrumentation.surveys.and.projects/vista; 7Abazajian et al. (Reference Abazajian2009); 8The Dark Energy Survey Collaboration (2005); 9Shanks (Reference Shanks2005); 10 http://www.eso.org/sci/observing/policies/PublicSurveys/sciencePublicSurveys.html
Padovani (Reference Padovani2011) has estimated cross-identification rates for the SKA down to nJy radio flux densities. Figure 26 plots R mag versus 1.4-GHz radio flux density and shows the expected R mag for various classes of sources that will be found in the radio surveys.
R mag versus the 1.4-GHz radio flux density for faint radio sources. The diagonal dashed line indicates the maximum value for SFG and the approximate dividing line between radio-loud and radio-quiet AGNs, with SFGs and radio-quiet AGNs expected to populate the top left part of the diagram. The typical R magnitudes of the three classes at S 1.4 = 1 μJy are also shown, with SFG split into starbursts and spirals. Finally, the mean radio and R mag values for sources from the VLA-CDFS sample, with error bars indicating the standard deviation, are also marked. The horizontal dot–dashed lines indicate the approximate point-source limits of planned and existing surveys.

Figure 26 shows that, down to 50 μJy, ≈50% of SFGs should be detected by the SDSS (northern hemisphere) and SkyMapper (southern hemisphere), while most AGNs will be fainter. Pan-STARSS and the LSST should detect most of the radio sources down to this flux density but on longer timescales (e.g. by ~2 028 in the case of the LSST, assuming a start of operations in 2018). Surveys reaching 1 μJy (e.g. those from the VLA and MIGHTEE) will obviously have much fainter counterparts and might require JWST and the Extremely Large Telescopes (ELTs) for the optical identification of most of their sources, which however will be covering a relatively small FOV (up to a few arcmin2). X-ray surveys are intrinsically much less sensitive than optical/IR surveys and will detect only a very small fraction of the AGNs detected by radio surveys (Padovani Reference Padovani2011).
The requirements for spectroscopic redshifts are obviously even more difficult. For example, long exposures (~10 h) with 8/10 m telescopes can secure redshifts in the case of strong emission lines down to R mag≈26. Large-area spectroscopic surveys, however, cannot reach these magnitudes. For example, current magnitude limits are r ≤ 17.8 (galaxies) and i ≤ 19.1 (quasars) for the SDSS and bJ ≤ 20.85 for the 2dF QSO redshift survey.
The source density of potential matches will probably be >1 per radio beam, so simply taking the nearest neighbour to the radio source in other catalogues is not a feasible approach. Furthermore, radio sources will typically have more than one component per source, so a simple nearest-neighbour algorithm will attempt to match sources to the lobes of an FRII galaxy as well as to the core. Clearly, more sophisticated matching algorithms must be considered
A significant number of techniques exist to facilitate the matching of catalogues. Techniques such as the p-statistic (Downes et al. Reference Downes, Peacock, Savage and Carrie1986) and the likelihood ratio (Sutherland & Saunders Reference Sutherland and Saunders1992) make use of the number density of background (and true counterpart) sources to ‘weigh’ potential counterparts within a given search radius, but cannot take into account the likelihood that several radio components may correspond to one optical component. More recently, Budavári & Szalay (Reference Budavári and Szalay2008) outlined a Bayesian method to determine the most likely match. This method, while similar to the likelihood ratio, is distinct in that it does not consider the source density, and hence is less biased towards faint counterparts (although potentially less reliable for very high source densities). A Bayesian approach (Budavári Reference Budavári2011) also allows a number of other constraints to be built into the process for selecting the most likely candidate. This can in principle even extend to including the knowledge that the core of an FRII is associated with a host galaxy while the lobes are not. This balance between reliability of matches, and completeness as a function of flux, will be key in deciding which algorithm is appropriate for the scientific exploitation of radio surveys.
Finally, it is likely that any automated algorithm will fail on complex radio sources, which may include those which are most scientifically interesting. For these cases, a ‘Citizen Science’ approach is being developed to enlist the help of thousands of enthusiastic amateurs, in collaboration with the Galaxy Zoo group (Lintott et al. Reference Lintott2008) to examine each of the millions of complex sources by eye. The ‘Radio Zoo’ project expects to release its first prototype in early 2013.
4.6.1 The likelihood ratio technique for radio source cross-identification
The likelihood ratio (LR) technique (e.g. Richter Reference Richter1975; Sutherland & Saunders Reference Sutherland and Saunders1992; Cilegi et al. Reference Ciliegi, Zamorani, Hasinger, Lehmann, Szokoly and Wilson2003) can be used to identify optical/near-infrared counterparts with sources selected from low resolution survey data. Smith et al. (Reference Smith2011) discuss a recent application of this Bayesian technique to identify 2 423 optical counterparts to 6 621 sources from the Herschel-Astrophysical TeraHertz Large Area Survey (Herschel-ATLAS; Eales et al. Reference Eales2010), selected at 250 μm.
The LR technique relies on the brightness and astrometric properties of the input catalogues in general, and each individual source in particular, to determine the ratio of the probability that two objects are related, to the probability that they are unrelated. After using an empirical method to account for the fraction of sources which are not detected in the optical/near-infrared catalogue, we can determine the reliability of each association, with values ranging from 0 (not related) to 1 (a match).
The likely positional uncertainties, coupled with the probable optical/near-infrared catalogues that will be available for identifying counterparts to the new catalogues that these surveys will generate, suggest that, apart from the problem of radio sources with multiple components, the problem will be very similar to that addressed using the LR technique in the Herschel-ATLAS.
McAlpine et al. (Reference McAlpine, Smith, Jarvis, Bonfield and Fleuren2012) have begun detailed investigations based on existing deep radio survey data and new near-infrared data from the VISTA VIDEO survey to quantify how effective the LR technique will be for these purposes, and how it will be affected by using data of different sensitivity and spatial resolution.
4.6.2 Bayesian approaches
Budavári & Szalay (Reference Budavári and Szalay2008) propose Bayesian hypothesis testing for cross-identification. Given a set of detections, one can ask directly whether the measured directions are consistent with a common single object. This hypothesis is tested against its complement using the Bayes factor, which is the likelihood ratio
 \begin{equation}
B = \frac{L_{\rm {}same}}{L_{\rm {}not}},
\end{equation}
\begin{equation}
B = \frac{L_{\rm {}same}}{L_{\rm {}not}},
\end{equation}
 \begin{equation}
B = \frac{2}{\sigma _1^2 + \sigma _2^2}\, \exp \left\lbrace -\frac{\psi ^2}{2\big(\sigma _1^2 + \sigma _2^2\big)} \right\rbrace ,
\end{equation}
\begin{equation}
B = \frac{2}{\sigma _1^2 + \sigma _2^2}\, \exp \left\lbrace -\frac{\psi ^2}{2\big(\sigma _1^2 + \sigma _2^2\big)} \right\rbrace ,
\end{equation}
4.7 Measuring redshifts
To obtain the full value of a radio survey, it is essential to have multiwavelength identification and redshifts. However, only about 1% of radio sources from these surveys will have spectroscopic redshifts (Section 4.6), and so it is necessary to rely on photometric redshifts or even statistical redshifts.
The most popular way to compute photometric redshifts is via fitting of templates of galaxies to the measured multi-band photometry of target galaxies. Clearly, the accuracy of the result depends not only on the library of templates, but also on the number of photometric points available and their associated errors. Other techniques, such as k-nearest neighbour (kNN) implementations, support vector regression models, self-organised maps, Gaussian processing, neural-networks, and rainbow forest, do not make any assumptions about the SED of the galaxies or the type and amount of extinction. Instead, they build on a simple colour–redshift relation using a training sample of sources with reliable spectroscopic redshifts. These methods are very efficient and fast whenever the training sample is representative of the entire population, and become less reliable outside the redshift range for which they were trained.
About 20% of EMU sources will have photometric data from the six optical bands of the Skymapper survey, the two near-infrared bands of VHS, and the four mid-infrared bands of WISE (see Table 2). Typically, with these available data sets, an error in redshift of ~0.03 can be reached for normal galaxies up to redshift z~1.5 using either standard (SED template fitting) or empirical (machine learning) techniques.
About 20% of identified sources will be classified as AGNs, based on one or more of the following criteria: (a) radio morphology, (b) radio polarisation, (c) X-ray detection, (d) a radio spectral index very different from α~ −0.7, and (e) a radio/IR ratio very different from the canonical SF value. About 5% of the sources will be QSOs, detectable by the next X-ray all-sky survey, eROSITA (Cappelluti et al. Reference Cappelluti2011; Merloni et al. Reference Merloni2012), and for these sources a special treatment must be adopted (Salvato et al. Reference Salvato2009, Reference Salvato2011).
About 80% of the EMU sources will have an optical counterpart that is fainter than r = 22 mag AB and for these sources the ancillary multiwavelength data set will be coarse and non homogeneous. Finally, the training sample with spectroscopic redshift available at high redshift may not be as complete as at z < 1, hampering the empirical photometric redshift techniques.
With the final goal of providing the most reliable photometric redshift for the larger number of sources possible, the EMU redshift working group is testing all the methods mentioned above, trying to understand the advantages and disadvantages of each of them, and thus applying the most suitable, or a combination, of the methods, depending on (a) the available depth of the multiwavelength data and (b) on the redshift range available for the training sample. We started experimenting on COSMOS field (Scoville et al. Reference Scoville2007) representative of a pencil beam survey (2 deg2) with a very deep and homogeneous multiwavelength data set, but for which the training spectroscopic sample is limited to low-redshift radio sources, and with a strong component of X-ray-detected sources. Other fields which we will be testing are the larger area ATLAS (Norris et al. Reference Norris2006; Middelberg et al. Reference Middelberg2008b), which has deep but non-homogeneous ancillary data, and GAMA (310 deg2), for which the training spectroscopic sample is rich but representing only the nearby universe (r < 20 mag) and with limited availability of ancillary data.
In addition to the optical, near, and mid-infrared data, we will make use of the radio properties of the sources. While for the empirical methods the radio flux will be used as an additional band, for the SED-fitting technique, we will use the radio properties as a prior for limiting the redshift range or the templates used for the possible solutions.
The ‘statistical redshift’ concept, introduced by Norris (Reference Norris2011), recognises that a probabilistic estimate of redshift for a large sample can be useful, even if many of them are incorrect, provided that the level of incorrectness and incompleteness can be accurately calibrated. Even a non-detection can carry useful information, and radio data themselves can add significantly to the choice of SED template. For example,
-
• high-redshift radio galaxies can be identified from their strong radio emission coupled with a NIR non-detection (Willott et al. Reference Willott, Rawlings, Jarvis and Blundell2003; Norris et al. Reference Norris2011a);
-
• a steep radio spectral index increases the probability of a high redshift (De Breuck et al. Reference De Breuck, van Breugel, Stanford, Röttgering, Miley and Stern2002);
-
• the angular size of a particular galaxy class can be loosely correlated with redshift (Wardle & Miley Reference Wardle and Miley1974);
-
• polarised radio sources are nearly always AGNs (C. A. Hales et al., in preparation), while unpolarised sources are mainly SF galaxies. Therefore, for the EMU/WODAN surveys, polarised sources have a mean z~1.8, while unpolarised sources have a mean z~1.1.
4.8 Data issues
4.8.1 Stacking and data-intensive research
Stacking is used to explore the properties of a class of objects which are below the detection limit of a survey. For example, the radio flux of RQQs can be measured by averaging the measured radio flux at the position of each RQQ in a radio survey, even though each individual RQQ has a flux well below the detection limit.
More generally, the process of stacking involves combining (typically by taking a censored mean or median) the data at the position where such objects are expected in the survey. The noise tends to cancel, while any low level of flux density in the sources adds, resulting in a detection threshold very much lower than that of the unstacked survey. Stacking at radio wavelengths has been used very successfully (e.g. Boyle et al. Reference Boyle, Cornwell, Middelberg, Norris, Appleton and Smail2007; White Reference White, Helfand, Becker, Glikman and de Vries2007; Ivison et al. Reference Ivison2007, Reference Ivison2010; Dunne et al. Reference Dunne2009; Messias et al. Reference Messias, Afonso, Hopkins, Mobasher, Dominici and Alexander2010; Bourne et al. Reference Bourne, Dunne, Ivison, Maddox, Dickinson and Frayer2011) on high-resolution data for the purpose of studying faint populations which are below the detection threshold of the radio image, and has proved to be a powerful tool for studying SFRs, AGN activity, radio-infrared correlation, and measuring the fraction of the extragalactic background contributed by various source populations. Jack-knifing techniques are currently being explored to provide more information about the flux density distribution of stacked sources than is available from a simple mean or median (Rees et al., in preparation).
The unprecedented area-depth product of SPARCS surveys makes them very suitable for stacking. For example, stacking a sample of a million optically selected galaxies in the EMU data will result in a noise level of ~10 nJy. Because of the wide area of the EMU, WODAN, and LOFAR surveys, even rare classes of sources can be stacked, and it should also be possible to create stacked images of extended sources, such as clusters. However, the extent to which such deep stacking will be successful will depend on the extent to which imaging artefacts are cancelled by stacking. Stacking is also not without its hazards, and can be biased by a number of effects such as failure to account for the PSF, particularly in the presence of confusion and in highly clustered fields (Bourne et al. Reference Bourne, Dunne, Ivison, Maddox, Dickinson and Frayer2011; Greve et al. Reference Greve2010; Penner et al. Reference Penner2011; Chary, Cooray, & Sullivan Reference Chary, Cooray and Sullivan2008; Béthermin et al. Reference Béthermin, Dole, Beelen and Aussel2010).
Other examples of data-intensive research include:
-
• Identification of sources which do not fit into known categories of radio source, and so are likely to be artefacts or exciting new classes of source, as discussed in Section 3.9.
-
• Extraction of low surface brightness radio emission to detect the WHIM synchrotron emission from cosmic filaments or sheets, by cross-correlating with optical galaxies selected from other surveys.
-
• Cross-correlation of low-redshift galaxies with high-redshift galaxies, or the CMB, to test cosmology and fundamental physics as discussed in Section 3.6.
4.8.2 Survey versus pointed data
Since surveys compete for observing time with conventional ‘pointed’ observations, it is useful to consider their role compared with projects doing detailed science on particular sources or fields. Clearly both modes are valuable and complementary. Surveys provide source lists for follow-up observations of particular sources, as well as finding and characterising calibrators for other radio observations. However, the huge volume of data from the new radio surveys will trigger a shift in the way astronomers ‘observe’. The ingenuity currently applied to devising a key experiment, and crafting a successful proposal, will be applied to devising novel ways of mining the data. To some extent, this is already happening, and about three times as many citations are delivered by results from the HST/STScI archive than from the papers written by PIs. The surveys discussed here will also have an enormous legacy value, since they will be hard to improve on until the technology makes a further major step forward.
5 CONCLUSION
The SKA Pathfinder Radio Continuum Survey working group (SPARCS) has been established to coordinate the science and technical developments associated with continuum surveys being planned or undertaken with the SKA pathfinder telescopes (APERTIF, ASKAP, VLA, e-MERLIN, e-EVN, LOFAR, MeerKAT). This review paper was triggered by the first SPARCS workshop, and is an attempt not only to share the knowledge residing in the individual pathfinder projects but also to establish a baseline of knowledge from which all projects can move on, and which can be used to optimise the development of the SKA. A primary outcome of the first SPARCS workshop was to rethink aspects of the way we are constructing the SKA pathfinder telescopes and designing the surveys. For example, it became clear that the impact of these surveys on cosmology and fundamental physics may dwarf the key science goals we have been working on for the last few years. That places demands on source-measurement accuracy and uniformity which in turn impacts on calibration and imaging accuracy.
Key demonstrable outcomes of the workshop include this review paper, and the establishment of a series of reference fields in both hemispheres which are now starting to be observed with major existing telescopes (VLA, ATCA, Westerbork) and will be observed with the new pathfinder telescopes (LOFAR, Aperitif, ASKAP, MeerKAT) to ensure consistency and uniformity across the surveys.
In this review paper, we have explored the current state of science to be tackled with the SPARCS surveys, and identified the most pressing challenges. We conclude that:
-
• The SKA pathfinder telescopes and upgrades, and their planned continuum surveys, have complementary capabilities which will lead to ground breaking science. Particularly exciting are (a) the ability of EMU and WODAN to cover the entire sky with high sensitivity and resolution, detecting about 100 million galaxies; (b) the ability of LOFAR to make complementary observations of much of that region at low frequency; (c) the ability of POSSUM and BEOWULF to obtain detailed information about the magnetic sky over the same region; and (d) the ability of e-MERLIN, VLA, e-EVN, and MIGHTEE to study selected areas and objects with very high sensitivity and resolution.
-
• Together, these surveys are likely to make major inroads on some of the pressing questions about the origin and evolution of galaxies, including distinguishing AGN and SF components of galaxies, tracing the evolution of the luminosity function for both, and exploring the causes and signatures of hot-mode and cold-mode accretion.
-
• Amongst the sources detected by the surveys will be very high redshift galaxies, possibly the highest discovered, but identifying them, and measuring their redshift will be challenging.
-
• The SPARCS surveys are likely to detect tens to hundreds of thousands of new clusters, and will also map the extended halo and relic emission from a fraction of these. Comparison with X-ray observations is likely to yield new insights into the physics of clusters and the growth of structure in the Universe.
-
• The measurement of polarisation and RMs is an important part of the surveys, and is likely to yield insight not only into the physics of the radio galaxies but into the origin of cosmic magnetism. There is a good chance that the intergalactic magnetic field will be detected and traced by these surveys.
-
• Even without redshifts, several cosmological probes can use SPARCS survey data to measure cosmological parameters and test models of gravity, with significantly more precision than current analyses. The combination of WODAN and EMU is likely to yield the best measurement yet of the ISW effect. The most powerfully constraining probe of dark energy parameters turns out to be the source count correlations, while ISW provides the most stringent constraints on modified gravity theories. If photometric redshifts can be obtained for a significant subset of the radio sources, then these cosmological tests become even more powerful.
-
• Variable and transient sources are currently poorly studied, and the SPARCS surveys are likely to change this field significantly. In addition to constraining models of e.g. black hole accretion, these studies are also likely to result in unexpected discoveries.
-
• While most SPARCS surveys are focussed on extragalactic science, they will also produce the best high-resolution data yet on the Galaxy, detecting essentially every SNR and UCHII region in the Galaxy, and vastly increasing the number of known radio stars. It is essential that this scientifically important aspect of the SPARCS surveys is not neglected in our drive to answer the key questions of extragalactic astrophysics.
-
• Because the SPARCS surveys are opening up a large area of unexplored parameter space, it is likely that they will make unexpected discoveries. It is important not to leave this process to chance, but to recognise it as a legitimate goal of large surveys, and to plan processes and software accordingly, to mine the deluge of data that these surveys will produce.
To achieve these exciting scientific goals, many technical challenges must be addressed by the survey instruments. Given the limited resources of the global radio-astronomical community, it is essential that we pool our skills and knowledge. We do not have sufficient resources to enjoy the luxury of re-inventing wheels. We face significant challenges in calibration, imaging, source extraction and measurement, classification and cross-identification, redshift determination, stacking, and data-intensive research. As the SPARCS instruments extend the observational parameters, we will face further unexpected challenges in calibration, imaging, and interpretation. If we are to realise the full scientific potential of these expensive instruments, it is essential that we devote enough resources and careful study to understanding the instrumental effects and how they will affect the data. The prime role of SPARCS is to facilitate the process of doing so by ensuring we share resources and expertise across the projects.
ACKNOWLEDGMENTS
We are indebted to the Lorentz Center in Leiden for hosting and funding the workshop in 2011 February, which gave rise to this paper. Parts of this research were supported by the Australian Research Council Centre of Excellence for All-sky Astrophysics (CAASTRO), through project number CE110001020. Part of the research described in this paper was carried out at the Jet Propulsion Laboratory, California Institute of Technology, under a contract with the National Aeronautics and Space Administration. JA gratefully acknowledges support from the Science and Technology Foundation (FCT, Portugal) through the research grants PTDC/FIS/100170/2008, PTDC/CTE-AST/105287/2008, and PEst-OE/FIS/UI2751/2011. CF and AD acknowledge financial support by the Agence Nationale de la Recherche through grant ANR-09-JCJC-0001-01. AD acknowledges financial support from the joint PhD program of Observatoire de la Côte d’Azur and Conseil régional Provence-Alpes-Côte d’Azur.


