

1. Introduction
Recent migration literature has highlighted four recurring features from the perspective of the source country: first, Migration constitutes a significant portion of the population, with examples such as Mexico, Peru, Guatemala, and El Salvador where more than 10% of the population resides abroad. Second, migrants maintain economic ties with their home country by regularly sending remittances to their relatives. These remittances play a crucial role in the economies of source countries, amounting to an average of around 5% of GDP in 2005. Notably, there is substantial variability in the volume of remittances received by different countries, as illustrated in Fig. A2. In 45 economies out of a sample of 155 countries, remittances accounted for more than 5% of GDP in 2005. The significance of remittances as a source of external resources for developing economies was emphasized in World Bank reports from 2006 (World Bank (Reference Bank2006)). According to these findings, remittances rank as the second largest source of external resources for developing economies, surpassed only by Foreign Direct Investment. Remarkably, remittances surpass the combined total of foreign aid resources received by these economies. Third, skilled migration is prevalent among migrants, with the skilled migration rate being nearly 5,8 times higher than the average unskilled migration rate. This phenomenon, often termed as “brain drain” in the literature, is a common occurrence in many developing economies, as depicted in Fig. A1. Fourth, return migration has emerged as a significant trend for source countries, with approximately $10-20\%$
of migrants returning to their birthplace after a period of migration, according to OECD reports in 2008 (OECD (2008)).
$10-20\%$
of migrants returning to their birthplace after a period of migration, according to OECD reports in 2008 (OECD (2008)).
A notable issue in migration literature is the strong correlation among the characteristics of international migration, including high migration rates, brain drain, remittances, and return migration. This correlation poses challenges for empirically identifying the effects of policies that impact these different aspects of migration. As a result, empirical studies often focus on individual aspects separately, as noted in the literature review. Given the difficulty of empirically studying these interconnected stylized facts, our paper addresses this gap by constructing a theoretical model that captures them within a dynamic general equilibrium framework. In this model, migration decisions are made at the household level, and the stylized facts emerge endogenously. This enables us to conduct simulations to evaluate the effects of economic policies on migration, brain drain, and the return of migrants. Moreover, modeling migration within a dynamic general equilibrium framework allows us to examine the effects of high migration on prices, such as wages and interest rates, and the secondary effects these changes may trigger in migration patterns. For instance, an influx of highly qualified migrants could lead to wage increases due to a shortage of skilled labor, thereby incentivizing further migration (and return migration) by providing additional resources to cover migration costs. Furthermore, the general equilibrium analysis enables us to identify the role of the government and the externalities generated by skilled migration on non-migrant households, including the depletion of human capital and the reduction in available workers. Importantly, the joint modeling of these various aspects of migration within a dynamic general equilibrium context has received limited attention in the literature.
The paper makes two primary contributions. First, it expands upon the neoclassical model to account for key empirical features of migration from the perspective of the source country. These features include brain drain, remittances, and return migration. In the model, multi-member families with varying skill levels are subject to un-insurable idiosyncratic labor productivity shocks. A negative shock may prompt migration, with the household selecting one member to migrate. Upon returning to the home country, the migrant worker possesses enhanced human capital. On the production side, a representative firm utilizes capital, skilled, and unskilled labor to produce output, with production exhibiting capital-skill complementarity.
Second, we utilize the model to explore specific economic effects of migration. These include: (a) Examining the general equilibrium effects of skilled migration and remittances. This analysis is intriguing as it sheds light on how skilled migration and remittances can influence resource allocation in the economy through changes in prices. Furthermore, by considering the general equilibrium nature of counterfactual scenarios, we uncover insights that previous literature may have overlooked. For instance, we investigate how migration impacts families without migrants. (b) Assessing the welfare effects of migration, which sparks discussions about the political and economic implications of migration. (c) Investigating whether the combined effects of remittances and return migration can sufficiently offset the negative consequences of brain drain. Given that the model encompasses skilled migration, remittances, and return migration, it serves as a natural framework for addressing this issue. (d) Analyzing the effectiveness of policy interventions aimed at mitigating the impacts of skilled migration. Specifically, we focus on policies targeting skilled return migration, migration costs, remittances, and the probability of migration (see Table A1).
The study concludes that migration, when modeled within a general equilibrium framework, yields substantial economic and welfare effects, particularly in countries where skilled migration (brain drain) and remittances play a significant role. Overall, migration is found to enhance the total welfare of households. However, these effects exhibit considerable heterogeneity: while migration benefits the most skilled households, it diminishes welfare for the least skilled households. This disparity arises from the fact that most migrants are skilled workers who can afford migration costs. Due to capital-skill complementarity, a reduction in skilled workers diminishes returns on capital and wages for unskilled workers. Importantly, these findings underscore the general equilibrium effects of migration, which impact households even in the absence of migrants abroad.
One endogenous result of the paper is brain drain, which aligns with the positive-selection hypothesis of migration as tested by Chiquiar and Hanson (Reference Chiquiar and Hanson2005) using data from Mexico.Footnote 1 According to their study, Mexican immigrants, although typically less educated than US natives, boast higher average levels of education than residents of Mexico. Remarkably, if Mexican immigrants in the United States were compensated based on prevailing skill prices in Mexico, they would likely occupy the middle and upper segments of Mexico’s wage distribution.
Return migration is a prominent feature of migration literature, wherein approximately 20% of migrants return to their source country, often with enhanced human capital (brain gain) and increased productivity, which subsequently benefits the source country’s economy. Additionally, some migrants opt not to return and instead send remittances, which also have a positive impact on the source country’s economy. Using our model we demonstrate that the combined effects of return migration and remittances may not fully counterbalance the impact of skilled migration in terms of GDP and human capital. While skilled migration may yield positive welfare effects on average, there exists significant heterogeneity in its impact, with unskilled households experiencing negative welfare effects. These findings underscore the complexities of migration dynamics and the nuanced effects it can have on source countries. Despite the potential benefits of skilled migration, careful consideration must be given to its distributional effects and its overall impact on economic outcomes.
The remainder of the paper is structured as follows: Section 2 provides a comprehensive review of the existing literature. Section 3 outlines the model economy, detailing its key components and assumptions. Section 4 establishes the concept of competitive equilibrium within the framework of the model. Section 5 elucidates the calibration procedure employed to ensure the model’s alignment with empirical evidence. Section 6 presents the results of our analysis, highlighting key findings and insights derived from the model. Finally, in Section 7, we offer concluding remarks summarizing the main findings of the study.
2. Literature review
The migration of skilled workers can indeed have detrimental effects on the source country’s economy, given that education and human capital are vital determinants of long-term economic growth (Lucas (Reference Lucas1998)). Specifically, when a trained or educated individual migrates, the country loses the investment made in their education. Early migration literatureFootnote 2 has extensively highlighted this phenomenon as a negative consequence for developing economies, as it exacerbates the scarcity of skilled workers. However, other literatureFootnote 3 suggests that migration can also yield positive economic implications for source countries, potentially offsetting the initial negative effects of skilled migration. According to this body of research, migration prospects can stimulate investment in education due to the higher returns available abroad (Mountford (Reference Mountford1997), Vidal (Reference Vidal1998), Beine et al. (Reference Beine, Docquier and Rapoport2001), Chen (Reference Chen2006), Docquier and Rapoport (Reference Docquier and Rapoport2007)). Our approach incorporates these driving forces and suggests that, on average, migration may indeed have positive effects on the source economy.
The role of migration and remittances as a household strategy to cope with idiosyncratic shocks has been extensively explored in the migration literature, notably by Lucas and Stark (Reference Lucas and Stark1985) and Rosenzweig and Stark (Reference Rosenzweig and Stark1989). This body of work supports the notion that households utilize migration and remittances to smooth consumption and mitigate risk exposure in developing economies. Empirical evidence also corroborates this claim, as income and remittances exhibit a negative relationship. We contribute additional evidence supporting the insurance function of remittances by examining the relationship between the source country’s relative income (measured as the source country GDP to host country GDP ratio) and the remittances-GDP ratio. Through regression analysis controlling for country-specific fixed effects, we find a negative relationship between these two ratios, consistent with the insurance hypothesis of remittances (see Fig. A3).
In our analysis, we conceptualize migration as a family decision, recognizing that household consumption smoothing due to migration is captured by considering multi-member households. This approach aligns with the literature emphasizing emigration as a family decision (Mincer (Reference Mincer1978)). Moreover, there is a growing body of literature employing a multi-member household framework to analyze migration decisions within a general equilibrium framework (Chort and Senne (Reference Chort and Senne2018)).
Several empirical studies have extensively documented the multifaceted role of remittances. From an aggregate perspective, remittances contribute to economic growth, investment, and aggregate savings (Fajnzylber and López (Reference Fajnzylber and López2007)). Examining the microeconomic dimension, researchers such as Fajnzylber and López (Reference Fajnzylber and López2007) and Acosta (Reference Acosta2006) demonstrate how remittances influence the allocation of time and resources within households, illustrating reductions in work hours in countries like El Salvador and Nicaragua. Additionally, this body of literature has investigated the impact of remittances on income distribution, poverty alleviation, output, and overall economic growth. Another strand of research focuses on examining the combined effects of remittances and skilled migration within a unified framework. Studies in this domain have generated significant econometric evidence highlighting the substantial economic effects of both brain drain and remittances in developing economies (Faini (Reference Faini2007), Docquier and Rapoport (Reference Docquier and Rapoport2007), among others). These studies shed light on the complex interplay between remittances, skilled migration, and their implications for economic development and welfare outcomes.
An issue that has received partial attention in the migration literature is the indirect effect of skilled workers’ departure, which operates through an externality channel. The premise behind this issue is that the reduction in the human capital stock due to skilled migration may lead to a decrease in the returns to other factors in the economy, such as physical capital and labor (Hall and Jones (Reference Hall and Jones1999)). Also, the existence of externalities associated with human capital may justify public policy interventions aimed at mitigating the impacts of brain drain. Our approach contributes to this aspect of the migration literature by incorporating the externality channel of skilled migration into our analysis. We explicitly account for the indirect effect of skilled workers’ departure through this externality channel. This aspect is highlighted in existing literature; for example, Delogu et al. (Reference Delogu, Docquier and Machado2018) investigate the externality effect of migration on tertiary education in source countries using a multi-country dynamic model. Similarly, Biavaschi et al. (Reference Biavaschi, Burzyński, Elsner and Machado2020) employ a multi-country dynamic model to examine the welfare effects of skilled emigration from a global perspective, capturing the externality effect of skilled emigration, which results in a composition effect varying according to the characteristics of the countries involved (source and host).
Return migration has garnered increased attention in recent years, fueled by the fact that approximately one-fifth of migrants return to their birth country following a migration spell (OECD (2008)). The economic implications of this phenomenon are substantial, as return migrants have the potential to bolster the human capital of the source country—a phenomenon known as brain gain. Studies indicate that, on average, return migrants exhibit a 20% increase in their human capital compared to their pre-migration levels. Mayr and Peri (Reference Mayr and Peri2008) demonstrate that the human capital gain of return migrants in the host economy serves as a significant driver of return migration. Moreover, return migration has the potential to counteract the brain drain effects of skilled migration. The economic effects of return migration have been extensively studied from both theoretical and empirical perspectives. A key question addressed by this literature concerns the magnitude of the economic implications of return migration and whether these effects, along with remittances, are sufficient to offset the negative consequences of skilled migration. While the current literature has provided some insights into this question, the debate remains ongoing and the approaches employed are often limited. One notable limitation of the existing return migration literature is its reliance on partial equilibrium analysis.Footnote 4 By incorporating the most important channels through which migration influences economic outcomes, our approach extends the return migration literature by offering insights into the significance of the return migration channel within a general equilibrium framework. This enables a more comprehensive understanding of the economic impacts of return migration and its potential to mitigate the adverse effects of skilled migration.
Meghir et al. (Reference Meghir, Mobarak, Mommaerts and Morten2019) provide insights into the potential welfare gains for rural households in Bangladesh through policies that encourage migration. Their study employs a structural partial equilibrium model that incorporates temporary migration, including full return migration. They demonstrate that policies promoting migration could lead to a significant improvement in the welfare of rural households, estimated at 12,9%. One key aspect of their findings is the consideration of risk in migration decisions. The study suggests that if migration is perceived as risky, implementing a temporary subsidy could incentivize migration by improving risk sharing mechanisms. This subsidy enables individuals to engage in profitable temporary migration, thereby enhancing their welfare and contributing to overall economic well-being in rural areas of Bangladesh.
A notable feature highlighted in the literature review is that the study of migration has predominantly been approached from an empirical and/or partial equilibrium perspective. However, there is a growing body of literature that examines international migration, brain drain, and return migration within a general equilibrium framework.Footnote 5 Theoretical advancements in this direction have been made, with efforts focusing on applying the two-period life-cycle Overlapping Generations (OLG) model to the migration literature. Galor and Stark (Reference Galor and Stark1990, Reference Galor and Stark1991) are among the pioneering researchers who introduced this framework, paving the way for further theoretical developments in understanding the broader economic implications of migration dynamics.
Despite significant advancements in migration research, the comprehensive analysis of the welfare effects of migration remains an area that requires further attention. Understanding the welfare implications of migration policies and dynamics is vital for making informed decisions and formulating effective policies.
The papers closely related to ours include Vidal (Reference Vidal1998), Docquier and Rapoport (Reference Docquier and Rapoport2007), Chami et al. (Reference Chami, Cosimano and Gapen2006), and Di Giovanni et al. (Reference Di Giovanni, Ortega and Levchenko2015). Vidal’s work constructs a general equilibrium model based on Galor and Stark (Reference Galor and Stark1990, Reference Galor and Stark1991). However, our approach differs in that we utilize a fully specified general equilibrium model with heterogeneous agents, rather than a two-period life-cycle representative agent OLG model. Vidal explores the effect of migration on human capital formation and output analytically, demonstrating that migration can incentivize human capital formation in the source country, potentially fostering economic growth. On the other hand, Docquier and Rapoport (Reference Docquier and Rapoport2007) analyze the consequences of skilled migration for source countries using a one-period representative agent general equilibrium model. They find that an optimal high-skilled migration rate is positive and discuss the effects of migration and education policies on human capital. Their analysis suggests that policies restricting the international mobility of high-skilled individuals could diminish the long-run level of human capital stock and output. Chami et al. (Reference Chami, Cosimano and Gapen2006) evaluate the optimality of labor income taxes and monetary growth in the presence of remittances using a general equilibrium model with representative agents. However, their model lacks certain features crucial to the migration literature, such as human capital considerations, migration decisions, and agents heterogeneity. Our study aims to bridge these gaps by employing a fully specified general equilibrium model with heterogeneous agents, allowing for a comprehensive analysis of the welfare and economic implications of migration dynamics, including human capital and migration decisions.
Di Giovanni et al. (Reference Di Giovanni, Ortega and Levchenko2015) propose an alternative approach to studying migration within a general equilibrium framework. Their paper assesses the welfare impact of observed levels of migration and remittances using a quantitative general equilibrium multi-sector model of the world economy, calibrated to aggregate and firm-level data. While this model offers an alternative method to evaluate the general equilibrium and welfare effects of migration in a framework that includes international trade, there are differences compared to our approach. They use country averages as the unit of analysis, and their welfare measure is the average income of workers rather than the CEV. Additionally, their model does not incorporate a competitive transition when evaluating the welfare effects of migration. Aubry et al. (Reference Aubry, Burzynski and Docquier2016) also adopt a multi-country model of migration within OECD countries. They demonstrate that the welfare effects of migration vary heterogeneously across OECD countries. This study contributes to understanding the nuanced impacts of migration within specific regional contexts, shedding light on how different countries may experience diverse welfare outcomes in response to migration flows.
3. The model
Our model builds upon the stochastic neoclassical growth model with heterogeneous agents and incomplete markets, as established by Aiyagari (Reference Aiyagari1994). We extend Aiyagari’s framework to incorporate key features relevant to economies where migration, remittances, return migration, and brain drain play significant quantitative roles. Here are the main features of the model:
-
Migration in Incomplete Markets: We analyze migration within an incomplete market setup, allowing us to explore the insurance aspect of migration and remittances.
-
Household-Level Migration Decisions: Recognizing that migration decisions are often made at the household level, we incorporate optimal migration decisions into our model.
-
Inclusion of Human Capital: We explicitly consider the human capital of workers, acknowledging the importance of skills and education in migration dynamics and economic outcomes.
-
Schooling Externality: To capture the negative impact of brain drain on worker productivity, we introduce a schooling externality. This justifies potential policy interventions to address brain drain.
-
Endogenous Remittances: We model remittances as endogenous, allowing households with migrants abroad to decide on the optimal amount of remittances to send.
-
Competitive Firms with Capital-Skilled Labor Complementarity: Firms operate under competitive conditions with a production function characterized by capital-skilled labor complementarity.
-
Stylized General Equilibrium Framework: We integrate these features into a stylized general equilibrium framework to analyze the interactions between migration dynamics and economic outcomes comprehensively.
By incorporating these elements, the model provides a comprehensive framework for studying the complex interplay between migration and economic dynamics in economies where migration-related factors are significant.
3.1 Environment
The model structure consists of a small open economyFootnote
6
populated by infinitely lived risk-averse workers. Agents discount future consumption using $\beta ^{\ast }$
as the subjective discount factor. The number of households in this economy remains constant, normalized to 1 for simplicity. Additionally, households are assumed to be born and die at a constant rate
$\beta ^{\ast }$
as the subjective discount factor. The number of households in this economy remains constant, normalized to 1 for simplicity. Additionally, households are assumed to be born and die at a constant rate $\phi$
each period, ensuring a stable aggregate population.Footnote
7
Newborn households start with no assets. In this setup, the effective discount factor is represented as
$\phi$
each period, ensuring a stable aggregate population.Footnote
7
Newborn households start with no assets. In this setup, the effective discount factor is represented as $\beta =(1-\phi )\beta ^{\ast }$
.
$\beta =(1-\phi )\beta ^{\ast }$
.
In this economy, heterogeneity exists at the household level, primarily in terms of household size. The number of workers in each household varies based on the migration state. In the non-migration state, each household comprises $n$
workers, whereas in the migration state, it consists of
$n$
workers, whereas in the migration state, it consists of $n-1$
workers. Additionally, workers are heterogeneous ex ante based on their skill level. We consider two skill levels: unskilled workers, indexed as “
$n-1$
workers. Additionally, workers are heterogeneous ex ante based on their skill level. We consider two skill levels: unskilled workers, indexed as “ $U$
,” and skilled workers, indexed as “
$U$
,” and skilled workers, indexed as “ $S$
.”
$S$
.”
Households exhibit ex ante heterogeneity due to the distribution of skills within each household. With $n$
workers per household, and each worker being either skilled or unskilled, there can be up to
$n$
workers per household, and each worker being either skilled or unskilled, there can be up to $n+1$
distinct household types based on this distribution of skills.Footnote
8
We let
$n+1$
distinct household types based on this distribution of skills.Footnote
8
We let $i$
,
$i$
, $i\in \{1,2,\ldots,n+1\}$
, denote the
$i\in \{1,2,\ldots,n+1\}$
, denote the $i$
-th household type and
$i$
-th household type and $j$
,
$j$
, $j\in \{1,2,\ldots,n\},$
denote the
$j\in \{1,2,\ldots,n\},$
denote the $j$
-th household member.
$j$
-th household member.
In the model, each individual has one unit of time available, which must be allocated to work. The gross labor income of the $i$
-th household is represented by:
$i$
-th household is represented by: $\sum _{j=1}^{n}w_{ij}h_{ij}z_{ij}$
, where
$\sum _{j=1}^{n}w_{ij}h_{ij}z_{ij}$
, where $w_{ij}$
is the wage per efficiency units of hours of work for the
$w_{ij}$
is the wage per efficiency units of hours of work for the $j$
-th household member in the
$j$
-th household member in the $i$
-th household type. Likewise,
$i$
-th household type. Likewise, $h_{ij}$
denotes the human capital stock and
$h_{ij}$
denotes the human capital stock and $z_{ij}$
is the idiosyncratic productivity shock. Both the wage and the human capital can only take two values, depending on the worker’s skill level:
$z_{ij}$
is the idiosyncratic productivity shock. Both the wage and the human capital can only take two values, depending on the worker’s skill level: $w_{ij}\in \{w_{U},w_{S}\}$
and
$w_{ij}\in \{w_{U},w_{S}\}$
and $h_{ij}\in \{h_{U},h_{S}\}$
.
$h_{ij}\in \{h_{U},h_{S}\}$
.
In this economy, the government plays a dual role. It taxes the total income of workers at a rate $\tau$
and returns the collected tax revenues to each household in the form of lump-sum transfers. It’s important to note that this distortionary tax affects both labor income and the return on savings. Additionally, transfers consist of a lump-sum transfer
$\tau$
and returns the collected tax revenues to each household in the form of lump-sum transfers. It’s important to note that this distortionary tax affects both labor income and the return on savings. Additionally, transfers consist of a lump-sum transfer $\Lambda _{1}$
to each household and return migration transfers
$\Lambda _{1}$
to each household and return migration transfers $\Lambda _{2}$
.
$\Lambda _{2}$
.
The idiosyncratic productivity of household members is correlated, meaning that if one member experiences a positive productivity shock, it’s likely that the others will also be affected similarly. This correlation is captured by the joint household productivity process $Z_{i}$
, where
$Z_{i}$
, where $Z_{i}=[z_{i1},\ldots,z_{in}],$
follows a continuous vector autoregressive (VAR) process
$Z_{i}=[z_{i1},\ldots,z_{in}],$
follows a continuous vector autoregressive (VAR) process $Z_{i}^{\prime }=\varrho Z_{i}+\upsilon _{i},$
where
$Z_{i}^{\prime }=\varrho Z_{i}+\upsilon _{i},$
where $\upsilon \sim N(0,\Sigma )$
,
$\upsilon \sim N(0,\Sigma )$
, $\Sigma$
is the varianze-covarianze matrix, and
$\Sigma$
is the varianze-covarianze matrix, and $\varrho$
denotes the autoregressive coefficient of each worker’s productivity process.
$\varrho$
denotes the autoregressive coefficient of each worker’s productivity process.
The human capital of each individual $h_{ij}$
is determined by a production function:
$h_{ij}$
is determined by a production function: $h_{ij}=\varphi \exp (\phi _{0}s_{ij}+\phi _{1}\overline{S})$
. Here,
$h_{ij}=\varphi \exp (\phi _{0}s_{ij}+\phi _{1}\overline{S})$
. Here, $s_{ij}$
represents the years of education,
$s_{ij}$
represents the years of education, $\overline{S}$
is the average years of education in the economy,
$\overline{S}$
is the average years of education in the economy, $\varphi$
is a scale parameter for standardization of human capital,
$\varphi$
is a scale parameter for standardization of human capital, $\phi _{0}$
represents the private return to education, and
$\phi _{0}$
represents the private return to education, and $\phi _{1}$
captures the externality induced by the average years of education in the economy. Introducing the concept of private return to education to capture individual-level heterogeneity in the loss of human capital due to skilled migration is an addition to the model. This approach allows for a better understanding of the effects of migration on human capital, as it accounts for the differential effects on individuals based on their education levels. Moreover, by incorporating the notion of private returns, we are also recognizing the potential negative externalities associated with skilled migration, which can have broader implications for the economy beyond just the individuals directly involved in migration. Even though education is exogenous in the model the formulation captures the externality of the average human capital loss due to endogenous skilled migration. Furthermore, the introduction of this schooling externality provides a rationale for implementing policies aimed at preventing or mitigating the negative effects of skilled migration.
$\phi _{1}$
captures the externality induced by the average years of education in the economy. Introducing the concept of private return to education to capture individual-level heterogeneity in the loss of human capital due to skilled migration is an addition to the model. This approach allows for a better understanding of the effects of migration on human capital, as it accounts for the differential effects on individuals based on their education levels. Moreover, by incorporating the notion of private returns, we are also recognizing the potential negative externalities associated with skilled migration, which can have broader implications for the economy beyond just the individuals directly involved in migration. Even though education is exogenous in the model the formulation captures the externality of the average human capital loss due to endogenous skilled migration. Furthermore, the introduction of this schooling externality provides a rationale for implementing policies aimed at preventing or mitigating the negative effects of skilled migration.
The model captures the schooling externality channel of migration, wherein skilled migration influences aggregate schooling levels. However, an inherent limitation is that the education decision is treated as exogenous. Consequently, the model may overlook additional education effects associated with migration and remittances. For instance, remittances can positively impact education by supporting children’s educational expenses and fostering higher schooling levels in the economy. This is supported by literature such as Stark (Reference Stark1991), and Rapoport and Docquier (Reference Rapoport and Docquier2005). However, empirical evidence also suggests potential negative effects of migration on education. For example, migration of family members may discourage children’s educational progress due to the prospect of seeking employment abroad, which may not require or reward educational credentials from the home country. Studies like Pederzini and Meza (Reference Pederzini and Meza2008), McKenzie and Rapoport (Reference McKenzie and Rapoport2011) have found that rural youth in migrant households are less likely to attend school and may have lower educational attainment compared to those in non-migrant households. Therefore, while migration and remittances may have positive impacts on education through financial support, they can also have negative consequences on schooling participation and attainment. Thus, the endogenous effects of migration and remittances on education are complex and could be offset in aggregate terms by the mixed effects they exert.
Households have the option to save, with only one asset available for this purpose denoted by $a$
, where
$a$
, where $a\in A$
and
$a\in A$
and $A$
represents a compact set defining the savings state space. However, households face borrowing constraints, implying that their savings must be non-negative
$A$
represents a compact set defining the savings state space. However, households face borrowing constraints, implying that their savings must be non-negative $(a\geq a$
,
$(a\geq a$
, $a=0)$
. As a result, households can only finance their expenses—including consumption, migration costs, and savings—using their labor income or the interest generated by their accumulated wealth. This incomplete market scenario arises because there is only one asset available for households to use in insuring against idiosyncratic shocks.
$a=0)$
. As a result, households can only finance their expenses—including consumption, migration costs, and savings—using their labor income or the interest generated by their accumulated wealth. This incomplete market scenario arises because there is only one asset available for households to use in insuring against idiosyncratic shocks.
The household utility is represented by $u(c)$
and it is strictly increasing and concave in consumption (
$u(c)$
and it is strictly increasing and concave in consumption ( $u^{\prime }(c)\gt 0$
and
$u^{\prime }(c)\gt 0$
and $u^{\prime \prime }(c)\lt 0)$
. The instantaneous utility of a household without migrants abroad, referred to as the “stayer household,” is specified by the following functional form.
$u^{\prime \prime }(c)\lt 0)$
. The instantaneous utility of a household without migrants abroad, referred to as the “stayer household,” is specified by the following functional form.
 \begin{equation} u(c)=n\frac{c^{1-\sigma }}{1-\sigma } \end{equation}
Each stayer household makes optimal decisions every period regarding per capita consumption, savings, and migration. Migration is regarded as a family decision, meaning that each stayer household chooses to send one of its family members abroad.Footnote
9
Every period, a stayer household receives a migration offer, the probability of which depends on the household’s type ( $p_{i}$
). The migration cost is denoted by
$p_{i}$
). The migration cost is denoted by $\Delta$
and is paid from the household budget during the migration period.
$\Delta$
and is paid from the household budget during the migration period.
The incorporation of migration probability by skill type into the model underscores the importance of institutional arrangements and policy frameworks in shaping migration patterns and brain drain dynamics. By allowing for differential migration opportunities based on skill level, the model reflects real-world phenomena such as quota systems that prioritize skilled migration in many host countries. The emphasis on skilled workers receiving more migration opportunities aligns with observed trends where host countries often have policies favoring skilled or high-demand workers for immigration. Such quota systems or skill-based selection criteria reflect the perceived economic benefits of attracting skilled labor, which may contribute to brain drain concerns for source countries.
Introducing a migration technology that incorporates both a common migration cost and skill-specific migration offers is a realistic approach to capture the complexities of migration decisions, particularly in contexts with high heterogeneity among workers. The migration cost by itself does not generate enough migration rate by skill type (as we shown in the sensitivity analysis section). By considering both factors, the model can accurately represent the factors influencing individual migration decisions and the overall migration rate by skill type. The migration offer by skill type allows for a more accurate representation of migration dynamics, as it acknowledges that not all individuals may have the opportunity to migrate even if they desire to do so. This mirrors real-world scenarios where individuals may be willing to migrate but are constrained by factors such as access to migration opportunities.
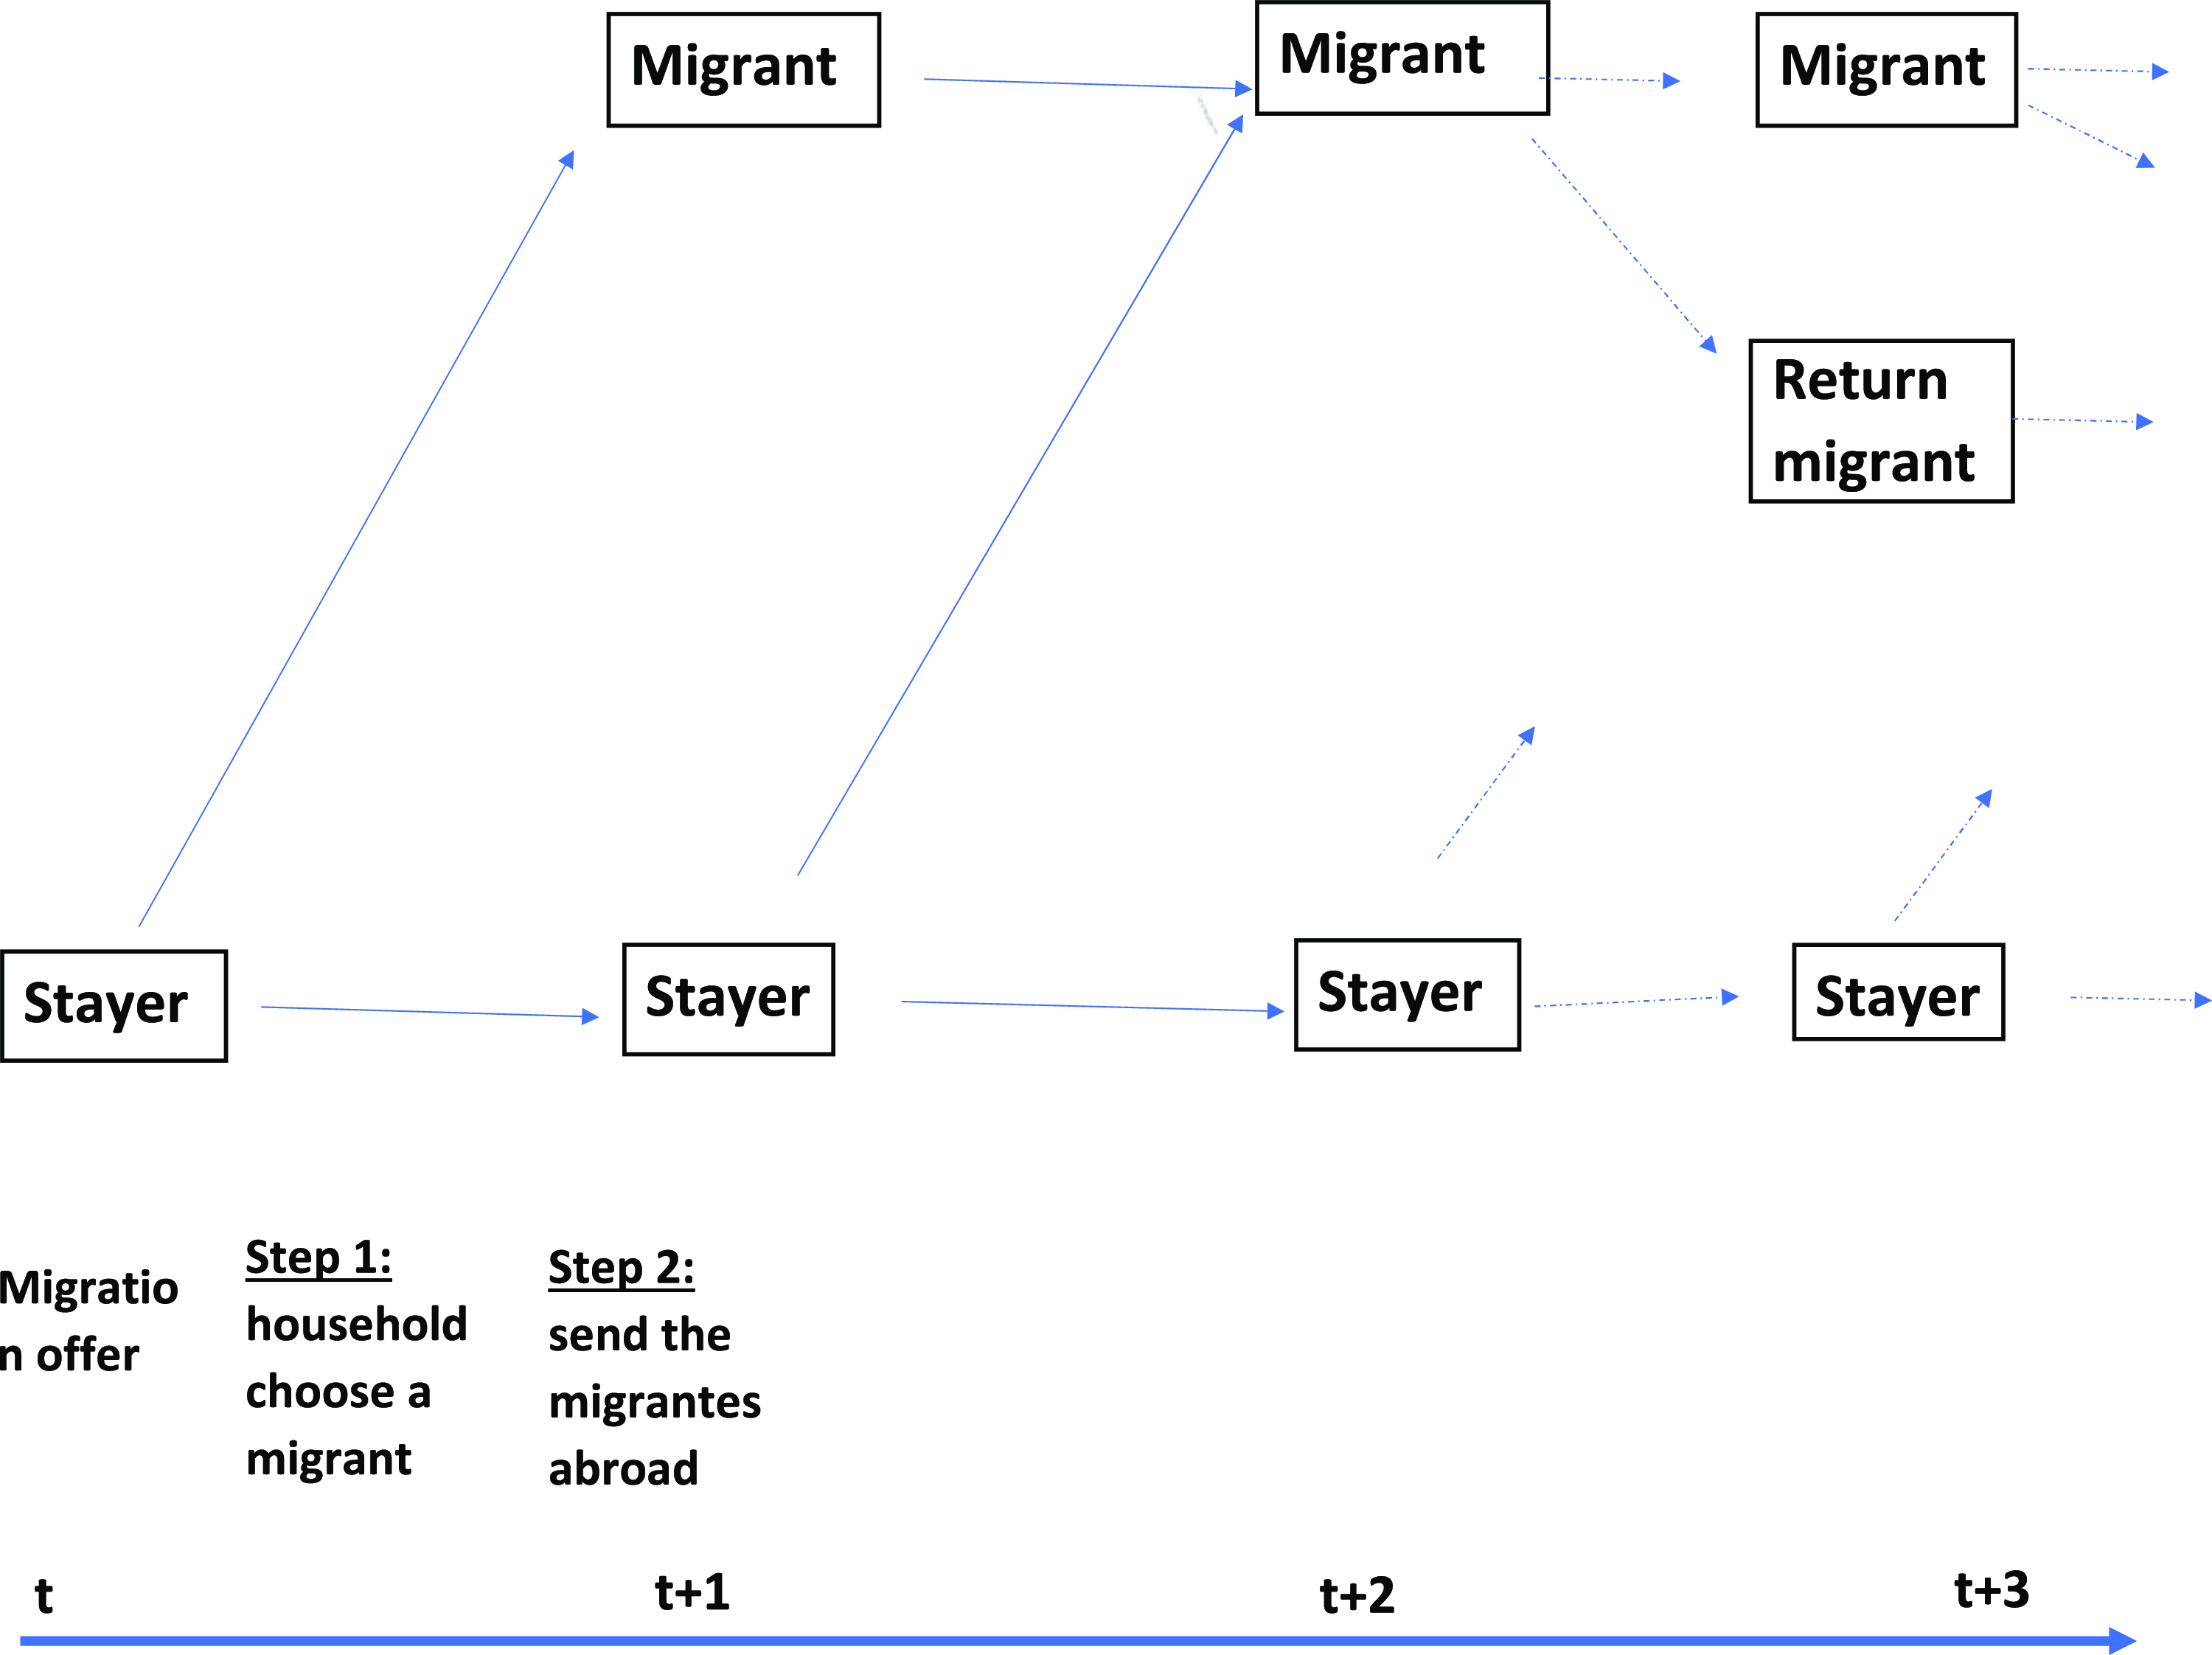
The migration decision is based on a two-step comparative advantage mechanism. In the first step, the household chooses the potential migrant from among members of the family. It is done by comparing the household lifetime value of migration for each member. At this stage, the current productivity shock as well as the future expected productivity shocks for each household member is known such that the household may know which household member has the best comparative advantage to migrate in terms of the household lifetime value of migrating. Given that productivity shocks are discretized, it may be the case that two (or more) household members may have the same skill and productivity shock such that both may have the same lifetime value. In such a case the household decides to send abroad one member randomly. In the second step, and once the migration offer arrives, the household decides to send abroad the potential migrant if the offer is good enough in terms of the household lifetime utility.Footnote
10
(See Fig. 1 for a graphic description of the migration decision process). Labor income abroad is exogenous. We let $\overline{w}_{U}$
denote unskilled migrants’ labor income and
$\overline{w}_{U}$
denote unskilled migrants’ labor income and $\overline{w}_{S}$
denote skilled migrants’ labor income.Footnote
11
$\overline{w}_{S}$
denote skilled migrants’ labor income.Footnote
11
Timing of the household migration decision process.
Note: Stayer is a household without migrants and Migrant is a household with a migrant abroad. Return migration is allowed after 2 periods of migration.
A migrant household values the utility of each of its members, including the member that works abroad. We denote by $\widetilde{c}$
the consumption of the migrant worker, and the instant utility of a migrant household is represented by the following functional form.
$\widetilde{c}$
the consumption of the migrant worker, and the instant utility of a migrant household is represented by the following functional form.
 \begin{equation} u(c)=(n-1)\frac{c^{1-\sigma }}{1-\sigma }+\frac{\widetilde{c}^{1-\sigma }}{1-\sigma } \end{equation}
We consider that the migration decision period is a special one. The first-period migration problem differs from the remaining periods since during this period remittances are zero. This assumption makes the model more realistic. During the first period, the migrant must assimilate to the new labor market conditions in the host economy. Additionally, they must spend resources to cover some expenditures like installation costs as well as job search efforts in the host economy. These features would reduce the ability to generate income during the migration period and therefore may limit the migrant’s ability to send remittances. The assumption also allows us to set up the return migrant problem, in this case, return migration is allowed only after one period of migration.
The decision on remittances is made by the household and depends on the prevailing economic conditions in both the source and the host country. We believe that households with a migrant abroad face uncertainty surrounding the remittances that they could potentially receive. We introduce the variable $R$
, which denotes the migrant’s option to send remittances.
$R$
, which denotes the migrant’s option to send remittances. $R$
can take two values:
$R$
can take two values: $R=0$
if the migrant has the option to send remittances and
$R=0$
if the migrant has the option to send remittances and $R=1$
otherwise. The uncertainty of remittances is captured by the probability of sending remittances, denoted by
$R=1$
otherwise. The uncertainty of remittances is captured by the probability of sending remittances, denoted by $\pi _{re}$
,
$\pi _{re}$
, $\pi _{re}=\Pr ob(\textrm{R}=1)$
. Formally,
$\pi _{re}=\Pr ob(\textrm{R}=1)$
. Formally, $R$
is a two-state stochastic variable that follows an independent and identically distributed (
$R$
is a two-state stochastic variable that follows an independent and identically distributed ( $i.i.d.$
) process.Footnote
12
The migrant may send remittances every period except during the migration period. Additionally, once the remittances option is realized, the household decides on the optimal monetary value of remittances through the policy rule
$i.i.d.$
) process.Footnote
12
The migrant may send remittances every period except during the migration period. Additionally, once the remittances option is realized, the household decides on the optimal monetary value of remittances through the policy rule $Re(.)$
. Note that labor income abroad (
$Re(.)$
. Note that labor income abroad ( $\overline{w}_{U}$
,
$\overline{w}_{U}$
, $\overline{w}_{S}$
) and
$\overline{w}_{S}$
) and $\pi _{re}$
summarize the economic conditions in the host economy; good economic conditions may translate into both higher remittances and a higher probability of sending back remittances.
$\pi _{re}$
summarize the economic conditions in the host economy; good economic conditions may translate into both higher remittances and a higher probability of sending back remittances.
Introducing a remittance probability parameter in the model is a realistic way to account for the observed phenomenon where not every household with a migrant abroad receives remittances. This acknowledges the various barriers and constraints, both financial and institutional, that may affect the ability of migrants to send remittances back to their home countries. The inclusion of remittance probability allows the model to capture the complexities of the remittance process, which can be influenced by factors such as the level of financial development and inclusion in the host country, as well as regulatory and institutional arrangements affecting remittance channels. For example, migrants may face high transaction costs, limited access to banking services, or legal restrictions on remittance transfers, all of which can affect the likelihood of remittance transmission. By incorporating remittance probability as a parameter, the model can simulate different scenarios reflecting varying levels of ease or difficulty in sending remittances, thereby providing insights into the potential impacts of policy interventions aimed at reducing barriers to remittance transfers.
In the model, migrants are allowed to return after staying at least one period in the host country. Return migration is incentivized by a cash transfer policy, denoted as $(\Lambda _{2})$
, which is conditional on the returning migrant’s skill level. These transfers are funded by distortionary income tax revenues. In this setup, the government has an interest in promoting skilled return migration, as increasing the average human capital of the economy can lead to welfare improvements through the externality channel. Moreover, it is assumed that return migrant transfers are permanent. This assumption aligns with many return migration policies worldwide, which often provide support to return migrants for extended periods.
$(\Lambda _{2})$
, which is conditional on the returning migrant’s skill level. These transfers are funded by distortionary income tax revenues. In this setup, the government has an interest in promoting skilled return migration, as increasing the average human capital of the economy can lead to welfare improvements through the externality channel. Moreover, it is assumed that return migrant transfers are permanent. This assumption aligns with many return migration policies worldwide, which often provide support to return migrants for extended periods.
Return migration is modeled as an absorbing state, meaning that once a migrant worker returns, they remain in the source country indefinitely. Finally, output production occurs in a competitive market environment with a constant returns to scale production function, similar to the framework described by Krusell et al. (Reference Krusell, Ohanian, RÌos-Rull and Violante2000). We will explain in detail the production process later.
3.2 Recursive representation
3.2.1 Household problem
Denote by $V(a,\Theta,Z;\,i)$
the lifetime value function of a type
$V(a,\Theta,Z;\,i)$
the lifetime value function of a type $i$
stayer household, where
$i$
stayer household, where $a$
accounts for the household’s asset position, and
$a$
accounts for the household’s asset position, and $\Theta =\{h_{i1},h_{i2}\ldots,h_{in}\}$
is the household’s stock of human capital. Similarly,
$\Theta =\{h_{i1},h_{i2}\ldots,h_{in}\}$
is the household’s stock of human capital. Similarly, $Z=\{z_{i1},z_{i2},\ldots z_{in}\}$
is the household’s idiosyncratic productivity shock, and
$Z=\{z_{i1},z_{i2},\ldots z_{in}\}$
is the household’s idiosyncratic productivity shock, and $\Theta _{-k}=\{h_{i1},\ldots h_{ik-1},h_{ik+1},\ldots,h_{in}\}$
represents the household’s stock of human capital when the
$\Theta _{-k}=\{h_{i1},\ldots h_{ik-1},h_{ik+1},\ldots,h_{in}\}$
represents the household’s stock of human capital when the $k$
-th family member has migrated. Likewise
$k$
-th family member has migrated. Likewise $Z_{-k}$
is the household’s productivity shock when the
$Z_{-k}$
is the household’s productivity shock when the $k$
-th member has migrated.Footnote
13
$k$
-th member has migrated.Footnote
13
The stayer household problem. The problem of a household with no migrants abroad has the following recursive representation:
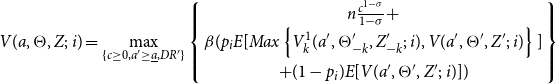 \begin{equation} V(a,\Theta,Z;\,i)=\max _{\{c\geq 0,a^{\prime }\geq \underline{a},DR^{\prime }\}}\left \{ \begin{array}{c} n\frac{c^{1-\sigma }}{1-\sigma }+ \\ \beta (p_{i}E[Max\left \{ V_{k}^{1}(a^{\prime },\Theta _{-k}^{\prime },Z_{-k}^{\prime };\,i),V(a^{\prime },\Theta ^{\prime },Z^{\prime };\,i)\right \} ] \\ +(1-p_{i})E[V(a^{\prime },\Theta ^{\prime },Z^{\prime };\,i)])\end{array}\right \} \end{equation}
Subject to
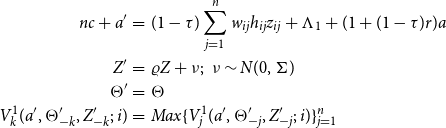 \begin{eqnarray*} nc+a^{\prime } &= &(1-\tau )\sum _{j=1}^{n}w_{ij}h_{ij}z_{ij}+\Lambda _{1}+(1+(1-\tau )r)a \\ Z^{\prime } &=&\varrho Z+\nu ;\text{ }\nu \sim N(0,\Sigma ) \\ \Theta ^{\prime } &=&\Theta \\ V_{k}^{1}(a^{\prime },\Theta _{-k}^{\prime },Z_{-k}^{\prime };\,i) &=&Max\{V_{j}^{1}(a^{\prime },\Theta _{-j}^{\prime },Z_{-j}^{\prime };\,i)\}_{j=1}^{n} \end{eqnarray*} $\qquad \qquad$ $V_{k}^{1}(a,\Theta _{-k},Z_{-k};\,i)$
denotes the lifetime value of a type
$V_{k}^{1}(a,\Theta _{-k},Z_{-k};\,i)$
denotes the lifetime value of a type $i$
household in which its
$i$
household in which its $k$
-th family member migrated at the beginning of the current period. As we mentioned before, the migration decision implies a two-step procedure. In the fist step, the family chooses its potential migrant by a comparative advantage mechanism; formally, the
$k$
-th family member migrated at the beginning of the current period. As we mentioned before, the migration decision implies a two-step procedure. In the fist step, the family chooses its potential migrant by a comparative advantage mechanism; formally, the $k$
-th family member is the potential migrant if
$k$
-th family member is the potential migrant if $V_{k}^{1}(a,\Theta _{-k},Z_{-k};\,i)=Max\{V_{j}^{1}(a,\Theta _{-j},Z_{-j};\,i)\}_{j=1}^{n}$
. In the second step, the household faces the migration decision, which is made by comparing the household’s lifetime value of staying in the source country with the household’s lifetime value when the potential migrant migrates.
$V_{k}^{1}(a,\Theta _{-k},Z_{-k};\,i)=Max\{V_{j}^{1}(a,\Theta _{-j},Z_{-j};\,i)\}_{j=1}^{n}$
. In the second step, the household faces the migration decision, which is made by comparing the household’s lifetime value of staying in the source country with the household’s lifetime value when the potential migrant migrates. $DR(.)$
represents the household’s migration decision rule at the beginning of the current period:
$DR(.)$
represents the household’s migration decision rule at the beginning of the current period: $DR(.)=1$
if migration is the best option,
$DR(.)=1$
if migration is the best option, $V_{k}^{1}(a,\Theta _{-k},Z_{-k};\,i)\gt V(a,\Theta,Z;\,i)$
, and
$V_{k}^{1}(a,\Theta _{-k},Z_{-k};\,i)\gt V(a,\Theta,Z;\,i)$
, and $DR(.)=0$
otherwise.
$DR(.)=0$
otherwise.
First-period migration problem. The problem of a type $i$
household in which its
$i$
household in which its $k$
-th member migrated at the beginning of the period has the following recursive represen tation:
$k$
-th member migrated at the beginning of the period has the following recursive represen tation:
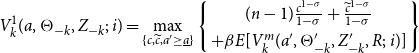 \begin{equation} V_{k}^{1}(a,\Theta _{-k},Z_{-k};\,i)=\max _{\{c,\widetilde{c},a^{\prime }\geq \underline{a}\}}\left \{ \begin{array}{c} (n-1)\frac{c^{1-\sigma }}{1-\sigma }+\frac{\widetilde{c}^{1-\sigma }}{1-\sigma } \\ +\beta E[V_{k}^{m}(a^{\prime },\Theta _{-k}^{\prime },Z_{-k}^{\prime },R;\,i)]\end{array}\right \} \end{equation}
Subject to
 \begin{eqnarray*} (n-1)c+a^{\prime }+\Delta &\leq &(1-\tau )\sum _{j\neq k}^{n}w_{ij}h_{ij}s_{ij}+\Lambda _{1}+(1+(1-\tau )r)a \\ Z_{-k}^{\prime } &=&\varrho Z_{-k}+\nu _{-k};\text{ }\nu _{-k}\sim N(0,\Sigma _{-k}) \\ \Theta _{-k}^{\prime } &=&\Theta _{-k} \\ \widetilde{c} &=&\overline{w}_{ik} \end{eqnarray*} $\ \qquad \qquad \qquad \qquad$ $V_{k}^{m}(a^{\prime },\Theta _{-k}^{\prime },Z_{-k}^{\prime },R;\,i)$
denotes the lifetime value of a type
$V_{k}^{m}(a^{\prime },\Theta _{-k}^{\prime },Z_{-k}^{\prime },R;\,i)$
denotes the lifetime value of a type $i$
household in which its
$i$
household in which its $k$
-th member had migrated sometime before the current period. We include
$k$
-th member had migrated sometime before the current period. We include $R$
as a state variable in this case, since the optimal monetary value of remittances is chosen conditional on the realization of the opportunity to send remittances.
$R$
as a state variable in this case, since the optimal monetary value of remittances is chosen conditional on the realization of the opportunity to send remittances.
Migration problem. The problem of a type $i$
household in which its
$i$
household in which its $k$
-th member lives abroad has the following recursive representation:
$k$
-th member lives abroad has the following recursive representation:
 \begin{equation} V_{k}^{m}(a,\Theta _{-k},Z_{-k},R;\,i)=\max _{\{c,\widetilde{c},a^{\prime },\textrm{Re},DR2\}}\left \{ \begin{array}{c} (n-1)\frac{c^{1-\sigma }}{1-\sigma }+\frac{\widetilde{c}^{1-\sigma }}{1-\sigma } \\ +\beta E[\max \{V_{k}^{m}(a^{\prime },\Theta _{-k}^{\prime },Z_{-k}^{\prime },R^{\prime };\,i);V_{k}^{re}(a^{\prime },\overline{\Theta }_{k}^{\prime },Z^{\prime };\,i)\}]\end{array}\right \} \end{equation}
Subject to
 \begin{eqnarray*} (n-1)c+a^{\prime } &= &(1-\tau )\sum _{j\neq k}^{n}w_{ij}h_{ij}z_{ij}+\Lambda _{1}+(1+(1-\tau )r)a+R\ast \textrm{Re} \\ Z_{-k}^{\prime } &=&\varrho Z_{-k}+\nu _{-k};\text{ }\nu _{-k}\sim N(0,\Sigma _{-k}) \\ \widetilde{c}+R\ast \textrm{Re} &= &\overline{w}_{k} \\ \Theta _{-k}^{\prime } &=&\Theta _{-k} \\ R &\sim &iid \end{eqnarray*}
The problem of a migrant household includes a decision on remittances ( $Re$
), which is conditional on the realization of the opportunity to send remittances. If the migrant is allowed to send remittances
$Re$
), which is conditional on the realization of the opportunity to send remittances. If the migrant is allowed to send remittances $(R=1)$
, then the household will decide on the optimal monetary value of the transfer; otherwise, remittances are zero, and the migrant abroad consumes his income. Additionally, the migrant budget constraint holds with equality (thus, consumption + remittances = wage abroad); hence the underlying assumption is that the migrant cannot save beyond the possibility to send remittances.
$(R=1)$
, then the household will decide on the optimal monetary value of the transfer; otherwise, remittances are zero, and the migrant abroad consumes his income. Additionally, the migrant budget constraint holds with equality (thus, consumption + remittances = wage abroad); hence the underlying assumption is that the migrant cannot save beyond the possibility to send remittances. $V_{k}^{re}(a^{\prime },\overline{\Theta }_{k}^{\prime },Z^{\prime };\,i)$
is the lifetime value of a type
$V_{k}^{re}(a^{\prime },\overline{\Theta }_{k}^{\prime },Z^{\prime };\,i)$
is the lifetime value of a type $i$
household in which its
$i$
household in which its $k$
-th member has returned from migration. The household also decides over the return migration policy rule
$k$
-th member has returned from migration. The household also decides over the return migration policy rule $DR2(.)$
, which can take two values,
$DR2(.)$
, which can take two values, $DR2(.)=0$
if return migration is an optimal choice and
$DR2(.)=0$
if return migration is an optimal choice and $DR2(.)=1$
otherwise.
$DR2(.)=1$
otherwise. $\overline{\Theta }_{k}=\{h_{i1,}\ldots h_{ik-1,}\overline{h}_{ik,}h_{ik+1,}\ldots h_{in,}\}$
represents the human capital stock of a family when its
$\overline{\Theta }_{k}=\{h_{i1,}\ldots h_{ik-1,}\overline{h}_{ik,}h_{ik+1,}\ldots h_{in,}\}$
represents the human capital stock of a family when its $k$
-th member returns from the host country.
$k$
-th member returns from the host country.
Return migration problem. The problem of a return migrant household, whose $k$
-th member has returned, has the following recursive representation.
$k$
-th member has returned, has the following recursive representation.
 \begin{equation} V_{k}^{re}(a,\overline{\Theta }_{k},Z;\,i)=\max _{\{c,a^{\prime }\}}\left \{ n\frac{c^{1-\sigma }}{1-\sigma }+\beta E[V_{k}^{re}(a^{\prime },\overline{\Theta }_{k}^{\prime },Z^{\prime };\,i)]\right \} \end{equation}
Subject to
 \begin{eqnarray*} nc+a^{\prime } &\leq &(1-\tau )(\sum _{j\neq k}^{n}w_{ij}h_{ij}z_{ij}+w_{k}\overline{h}_{k}z_{k})+(1+(1-\tau )r)a+\Lambda _{1}+1_{[\Xi _{ik}=S]}\Lambda _{2} \\ Z^{\prime } &=&\varrho Z+\nu ;\text{ }\nu \sim N(0,\Sigma ) \\ \overline{\Theta }_{k}^{\prime } &=&\overline{\Theta }_{k} \end{eqnarray*}
where $V_{k}^{re}(a,\overline{\Theta }_{k},Z;\,i)$
denotes the value of a household with a return migrant. The two terms
$V_{k}^{re}(a,\overline{\Theta }_{k},Z;\,i)$
denotes the value of a household with a return migrant. The two terms $\Lambda _{2}$
and
$\Lambda _{2}$
and $1_{[\Xi _{ik}=S]}$
capture the government’s return migration policy:
$1_{[\Xi _{ik}=S]}$
capture the government’s return migration policy: $\Lambda _{2}$
is the monetary transfer for return migrants and
$\Lambda _{2}$
is the monetary transfer for return migrants and $1_{[\Xi _{ik}=S]}$
Footnote
14
is an indicator function that is equal to one only when the returning migrant is skilled (
$1_{[\Xi _{ik}=S]}$
Footnote
14
is an indicator function that is equal to one only when the returning migrant is skilled ( $\Xi _{ik}=S)$
. We consider that the migrant may gain in terms of human capital during his migration spell. The human capital of the returning migrant is denoted by
$\Xi _{ik}=S)$
. We consider that the migrant may gain in terms of human capital during his migration spell. The human capital of the returning migrant is denoted by $\overline{h}_{k}$
and it is proportional to the before-migration stock of human capital (
$\overline{h}_{k}$
and it is proportional to the before-migration stock of human capital ( $\overline{h}_{k}=\zeta h_{k})$
. The term
$\overline{h}_{k}=\zeta h_{k})$
. The term $\zeta \gt 1$
represents the human capital gain during the migration spell.Footnote
15
Finally, we assume that the returning migrant worker will stay in the source country; in terms of the model it means that return migration is an absorbing state.
$\zeta \gt 1$
represents the human capital gain during the migration spell.Footnote
15
Finally, we assume that the returning migrant worker will stay in the source country; in terms of the model it means that return migration is an absorbing state.
The state of the economy, denoted by $\Omega$
, includes all possible values of the state variables: wealth, human capital, productivity shock, migration status, and remittances. Additionally, an index variable
$\Omega$
, includes all possible values of the state variables: wealth, human capital, productivity shock, migration status, and remittances. Additionally, an index variable $M$
, where
$M$
, where $M\in{0,1}$
, is included to track the current migration status of each household: households without migrants are denoted by
$M\in{0,1}$
, is included to track the current migration status of each household: households without migrants are denoted by $M=0$
, and those with a migrant abroad are denoted by
$M=0$
, and those with a migrant abroad are denoted by $M=1$
. Then, the policy rules that solve the household problem can be represented in the following manner:
$M=1$
. Then, the policy rules that solve the household problem can be represented in the following manner: $a^{\prime }(\Omega ;\,i)$
,
$a^{\prime }(\Omega ;\,i)$
, $c(\Omega ;\,i)$
,
$c(\Omega ;\,i)$
, $\widetilde{c}(\Omega ;\,i)$
,
$\widetilde{c}(\Omega ;\,i)$
, $DR(\Omega ;\,i)$
, and
$DR(\Omega ;\,i)$
, and $\textrm{Re}(\Omega ;\,i)$
.
$\textrm{Re}(\Omega ;\,i)$
.
3.2.2 Production
Production takes place in a competitive environment. There is a continuum of firms that have access to a nested CES production function as used in Krusell et al (Reference Krusell, Ohanian, RÌos-Rull and Violante2000).
 \begin{equation} Y=F(K,H_{U},H_{S})=\left [ \chi \left \{ \eta K^{\rho }+(1-\eta )H_{S}^{\rho }\right \} ^{\frac{\delta }{\rho }}+(1-\chi )H_{U}^{\delta }\right ] ^{\frac{1}{\delta }}, \end{equation}
where $\chi$
and
$\chi$
and $\eta$
are the share parameters. The parameters
$\eta$
are the share parameters. The parameters $\delta$
and
$\delta$
and $\rho$
govern the elasticity of substitution between unskilled labor input and physical capital, and between skilled labor input and physical capital, respectively.
$\rho$
govern the elasticity of substitution between unskilled labor input and physical capital, and between skilled labor input and physical capital, respectively. $K$
is the aggregate capital stock that depreciates at a constant rate
$K$
is the aggregate capital stock that depreciates at a constant rate $\delta _{k}$
,
$\delta _{k}$
, $H_{U}$
is the aggregated efficiency units of unskilled labor and
$H_{U}$
is the aggregated efficiency units of unskilled labor and $H_{S}$
is the aggregated efficiency units of skilled labor. This type of production function reflects complementarity between capital and skilled labor, as well as between capital and unskilled labor. The complementarity between capital and skilled labor may be higher than the complementarity between capital and unskilled labor. This feature allows the model to capture a well-documented aspect of the brain-drain literature: the departure of skilled workers can negatively impact the source country by reducing the return to capital due to the scarcity of skilled labor. Aggregate variables are computed by summing up the corresponding variables at the individual level.
$H_{S}$
is the aggregated efficiency units of skilled labor. This type of production function reflects complementarity between capital and skilled labor, as well as between capital and unskilled labor. The complementarity between capital and skilled labor may be higher than the complementarity between capital and unskilled labor. This feature allows the model to capture a well-documented aspect of the brain-drain literature: the departure of skilled workers can negatively impact the source country by reducing the return to capital due to the scarcity of skilled labor. Aggregate variables are computed by summing up the corresponding variables at the individual level.
Aggregated variables are computed from individual policy rules and by using the measure (size) of each worker. The measure of households of type $i$
is denoted by
$i$
is denoted by $\alpha _{i}$
and it is computed from the stationary distribution
$\alpha _{i}$
and it is computed from the stationary distribution $\mu _{i}(\Omega ),$ $\int \limits _{\Omega }d\mu _{i}(\Omega )=\alpha _{i}$
. The total measure of households is normalized to one:
$\int \limits _{\Omega }d\mu _{i}(\Omega )=\alpha _{i}$
. The total measure of households is normalized to one: $\sum \limits _{i=1}^{n+1}\alpha _{i}=1$
. Furthermore, given that the economy is inhabited by households of different sizes, the number of persons is represented by
$\sum \limits _{i=1}^{n+1}\alpha _{i}=1$
. Furthermore, given that the economy is inhabited by households of different sizes, the number of persons is represented by $N=\sum \limits _{i=1}^{n+1}\alpha _{i}N_{i}$
, where
$N=\sum \limits _{i=1}^{n+1}\alpha _{i}N_{i}$
, where $N_{i}$
represents the number of persons of type
$N_{i}$
represents the number of persons of type $i$
. The latter is computed by adding up the persons of both the stayers’ and the migrants’ households:
$i$
. The latter is computed by adding up the persons of both the stayers’ and the migrants’ households: $N_{\tau }=\int \limits _{\Omega,M=0}nd\mu _{i}(.)+\int \limits _{\Omega,M=1}(n-1)d\mu _{i}(.)$
. The aggregate stock of physical capital is obtained from
$N_{\tau }=\int \limits _{\Omega,M=0}nd\mu _{i}(.)+\int \limits _{\Omega,M=1}(n-1)d\mu _{i}(.)$
. The aggregate stock of physical capital is obtained from $K=\sum \limits _{i}\alpha _{i}\left \{\int a^{\prime }(\Omega ;\,i)d\mu _{i}\right \}$
.Footnote
16
Similarly, aggregate labor in efficiency units of each skill type
$K=\sum \limits _{i}\alpha _{i}\left \{\int a^{\prime }(\Omega ;\,i)d\mu _{i}\right \}$
.Footnote
16
Similarly, aggregate labor in efficiency units of each skill type $(H_{U},H_{S})$
is computed by aggregating the efficiency units of labor provided by each type of worker. This aggregation considers both the idiosyncratic productivity shock and the human capital stock of each worker.
$(H_{U},H_{S})$
is computed by aggregating the efficiency units of labor provided by each type of worker. This aggregation considers both the idiosyncratic productivity shock and the human capital stock of each worker.
3.2.3 The government
The government operates under a balanced budget constraint, where total expenditures (TRA) are equal to total revenues (TAX). Total revenue is derived from aggregated distortionary taxes on total income, including both labor income and savings returns. Total expenditure, on the other hand, encompasses aggregated lump-sum transfers ( $\Lambda _{1}$
) and return migration transfers (
$\Lambda _{1}$
) and return migration transfers ( $\Lambda _{2}$
). While the primary functions of the government involve taxes and transfers, it may also influence migration policy, remittances policy, and return migration policy. Through simulations, we can explore the impact of these policies on model outcomes.
$\Lambda _{2}$
). While the primary functions of the government involve taxes and transfers, it may also influence migration policy, remittances policy, and return migration policy. Through simulations, we can explore the impact of these policies on model outcomes.
4. The stationary competitive equilibrium
Definition 1.
A recursive competitive equilibrium consists of a set of policy rules for the household regarding consumption, savings, migration and remittances: $c\left \{ \Omega ;\,i\right \}$
;
$c\left \{ \Omega ;\,i\right \}$
; $\widetilde{c}\left \{ \Omega ;\,i\right \}$
;
$\widetilde{c}\left \{ \Omega ;\,i\right \}$
; $a^{\prime }\left \{ \Omega ;\,i\right \}$
;
$a^{\prime }\left \{ \Omega ;\,i\right \}$
; $DR\left \{ \Omega ;\,i\right \}$
;
$DR\left \{ \Omega ;\,i\right \}$
; $\textrm{Re}\left \{ \Omega ;\,i\right \}$
; a stationary probability measure of households
$\textrm{Re}\left \{ \Omega ;\,i\right \}$
; a stationary probability measure of households $[\mu _{i}]$
; aggregate factors, output and prices:
$[\mu _{i}]$
; aggregate factors, output and prices: $K,H,H_{U}, H_{S}, Y, r, w_{U,}, w_{S}, \overline{w}_{U}, \overline{w}_{S}$
; total tax revenues
$K,H,H_{U}, H_{S}, Y, r, w_{U,}, w_{S}, \overline{w}_{U}, \overline{w}_{S}$
; total tax revenues $TAX$
and total transfers
$TAX$
and total transfers $TRA$
; and household value functions,
$TRA$
; and household value functions, $V(.)$
;
$V(.)$
; $V^{1}(.)$
;
$V^{1}(.)$
; $V^{m}(.)$
, such that the following conditions hold:
$V^{m}(.)$
, such that the following conditions hold:
(i) Given $r,w_{U}, w_{S}$
, agents’ decision rules
$r,w_{U}, w_{S}$
, agents’ decision rules $\left \{ c(.);\, \widetilde{c}(.);\,a^{\prime }(.);\,DR(.);\,\textrm{Re}(.)\right \}$
solve the household problem (from 3) to (5).
$\left \{ c(.);\, \widetilde{c}(.);\,a^{\prime }(.);\,DR(.);\,\textrm{Re}(.)\right \}$
solve the household problem (from 3) to (5).
(ii) The goods market clears.
 \begin{equation} F(K,H_{U},H_{S})-(1-\delta _{k})K=\sum \limits _{i=1}^{n+1}\alpha _{i}\left \{ \begin{array}{c} \int \limits _{\Omega }[\mathbf{1}_{[M=0]}nc(.)+\mathbf{1}_{[M=1]}(n-1)c(.)+a^{\prime }(.)+ \\ \mathbf{1}_{[DR=1]}\ast \Delta -\mathbf{1}_{[R=1]}\ast \textrm{Re}(.)]d\mu _{i}\end{array}\right \} \end{equation}
(iii) The factors market clears. Aggregate capital and aggregate labor are computed from individual decisions.
(iv) Firms maximize profits in a competitive market. Prices are defined by the following conditions.
 \begin{eqnarray} r+\delta _{k} &=&\frac{\partial }{\partial K}F(K,H_{U},H_{S}) \end{eqnarray}
 \begin{eqnarray} w_{U} &=&\frac{\partial }{\partial H_{U}}F(K,H_{U},H_{S}) \end{eqnarray}
 \begin{eqnarray} w_{S} &=&\frac{\partial }{\partial H_{S}}F(K,H_{U},H_{S}) \end{eqnarray}
(v) Government balances its budget: aggregate tax revenues are equal to total lump-sump transfers
 \begin{equation*} TAX=TRA \end{equation*}
(vi) Aggregate and individual years of education are consistent.Footnote 17
 \begin{equation*} \overline {S}=\frac {s_{U}N_{U}+s_{S}N_{S}}{N} \end{equation*}
(vii) The law of motion of distribution is stationary.
 \begin{equation*} \mu _{i}^{\prime }=\mu _{i} \end{equation*}
We now turn to describing the calibration procedure.
5. Calibration
We calibrate the parameters of the model to ensure that the stationary equilibrium closely mirrors key economic features of a typical small economy where migration, remittances, and brain drain are significant factors. Guatemala is economy that fulfills those requirements: First, the migration rateFootnote
18
in Guatemala is high, since around $11\%$
of the adult population lives abroad. Second, brain drain is important, since the skilled migration rate is around three times the unskilled migration rate. Finally, the yearly remittances flow in Guatemala represents around
$11\%$
of the adult population lives abroad. Second, brain drain is important, since the skilled migration rate is around three times the unskilled migration rate. Finally, the yearly remittances flow in Guatemala represents around $10\%$
of GDP during the period 2004–2009.
$10\%$
of GDP during the period 2004–2009.
We calibrate the parameters of the model following a two-step strategy. In the first step we solve the model without return migration, and in the second step we introduce return migration by using the parameters of the model with migration. The two-step procedure allows us to identify the return migration outcomes.
In the first step of our calibration strategy, the value of a group of parameters is chosen based on the fact that each of them is closely related to the value of a specific moment or target. Then, the simulated method of moments provides a systematic way to estimate the remaining parameters by matching additional moments or targets generated by the model with those observed in the data. We briefly explain our calibration strategy.
The length of time is one year. The probability of dying is chosen so that a worker spends on average 45 years working ( $\phi =0,02)$
. The risk-aversion parameter is fixed at
$\phi =0,02)$
. The risk-aversion parameter is fixed at $\sigma =2,5$
, which is consistent with the common use in the neoclassical literature.
$\sigma =2,5$
, which is consistent with the common use in the neoclassical literature.
We follow a common procedure from the labor economics and migration literature and we relate skills with school attainment (Heckman et al. (Reference Heckman, Lochner and Taber1998), Docquier and Marfouk (Reference Docquier and Marfouk2005)). Workers in our model are 25 years or older and the number of skilled agents is approximated by the number of persons who finished secondary or high school education. Similarly, unskilled workers are those with, at most, a primary education. The number of workers per household is set at $n=3$
, which is consistent with the average number of working age persons per household in Guatemala.
$n=3$
, which is consistent with the average number of working age persons per household in Guatemala.
The measure of households of each type ( $\alpha _{i}$
) is estimated from ENCOVI-2006.Footnote
19
Skilled workers are identified by their education level and the following rule is used to compute
$\alpha _{i}$
) is estimated from ENCOVI-2006.Footnote
19
Skilled workers are identified by their education level and the following rule is used to compute $\alpha _{\tau }$
. Type 1 is represented by those households in which the proportion of skilled workers is less than or equal to
$\alpha _{\tau }$
. Type 1 is represented by those households in which the proportion of skilled workers is less than or equal to $25\%$
(
$25\%$
( $\alpha _{1}=0,51)$
; type 2 is represented by those households in which the proportion of skilled workers is more than
$\alpha _{1}=0,51)$
; type 2 is represented by those households in which the proportion of skilled workers is more than $25\%$
but less than or equal to
$25\%$
but less than or equal to $50\%$
(
$50\%$
( $\alpha _{2}=0,04)$
; in type 3 the proportion of skilled workers is more than
$\alpha _{2}=0,04)$
; in type 3 the proportion of skilled workers is more than $50\%$
but less than or equal to
$50\%$
but less than or equal to $75\%$
(
$75\%$
( $\alpha _{3}=0,16)$
; and in type 4, the proportion of skilled workers is more than
$\alpha _{3}=0,16)$
; and in type 4, the proportion of skilled workers is more than $75\%$ $(\alpha _{4}=0,29)$
. In the model, since each household has 3 members, household type is identified by the following rule: in household type 1 all members are unskilled, in household type 2 one member is skilled and two members are unskilled, in household type 3 two members are skilled and one member unskilled, and in household type 4 all household members are skilled.
$(\alpha _{4}=0,29)$
. In the model, since each household has 3 members, household type is identified by the following rule: in household type 1 all members are unskilled, in household type 2 one member is skilled and two members are unskilled, in household type 3 two members are skilled and one member unskilled, and in household type 4 all household members are skilled.
Remittances arrive with probability $\pi _{re}=0.30$
. This choice is consistent with the fact that around
$\pi _{re}=0.30$
. This choice is consistent with the fact that around $30\%$
of households with migrants abroad receive remittances (ENCOVI-2006).
$30\%$
of households with migrants abroad receive remittances (ENCOVI-2006).
Three parameters characterize the $VAR(1)$
productivity process. Both the autoregressive coefficient (
$VAR(1)$
productivity process. Both the autoregressive coefficient ( $\varrho )$
as well as the standard deviation (
$\varrho )$
as well as the standard deviation ( $\sigma _{v})$
of the idiosyncratic productivity shock are the same for each family member. Additionally, we consider that the correlation coefficient of the productivity shock between two family members (
$\sigma _{v})$
of the idiosyncratic productivity shock are the same for each family member. Additionally, we consider that the correlation coefficient of the productivity shock between two family members ( $\rho _{v})$
is similar for each pair of workers. We set
$\rho _{v})$
is similar for each pair of workers. We set $\varrho =0,70$
and
$\varrho =0,70$
and $\rho _{v}=0,5$
.
$\rho _{v}=0,5$
. $\sigma _{v}$
will be estimated by the simulated method of moments. Each of the idiosyncratic productivity processes is discretized to a 5-state discrete shock using an extension of the Tauchen (Reference Tauchen1986) procedure for multivariate processes.
$\sigma _{v}$
will be estimated by the simulated method of moments. Each of the idiosyncratic productivity processes is discretized to a 5-state discrete shock using an extension of the Tauchen (Reference Tauchen1986) procedure for multivariate processes.
We borrow some parameters of the production function from the corresponding literature. The elasticity of substitution between skilled labor and capital $(\frac{1}{1-\rho }=0,6)$
is consistent with the values reported by Krusell et al. (Reference Krusell, Ohanian, RÌos-Rull and Violante2000).Footnote
20
We consider that capital is relatively more complementary to skilled labor than it is to unskilled labor
$(\frac{1}{1-\rho }=0,6)$
is consistent with the values reported by Krusell et al. (Reference Krusell, Ohanian, RÌos-Rull and Violante2000).Footnote
20
We consider that capital is relatively more complementary to skilled labor than it is to unskilled labor $(\frac{1}{1-\delta }=2)$
. Given that our model is being applied to a representative developing economy in which skilled labor is scarce, our assumption may be realistic enough. This assumption, however, needs to be tested by using specialized household surveys that are scarce in developing economies like Guatemala. The share parameters,
$(\frac{1}{1-\delta }=2)$
. Given that our model is being applied to a representative developing economy in which skilled labor is scarce, our assumption may be realistic enough. This assumption, however, needs to be tested by using specialized household surveys that are scarce in developing economies like Guatemala. The share parameters, $\chi$
and
$\chi$
and $\eta$
, are closely related to the wage premium and the capital income share. The wage premium in Guatemala is 4,7 and it is equal to the relative income of skilled and unskilled workers (see Table 1). They are estimated by the simulated method of moments as we will explain later. The physical capital depreciation rate is set at
$\eta$
, are closely related to the wage premium and the capital income share. The wage premium in Guatemala is 4,7 and it is equal to the relative income of skilled and unskilled workers (see Table 1). They are estimated by the simulated method of moments as we will explain later. The physical capital depreciation rate is set at $\delta _{k}=9\%$
.
$\delta _{k}=9\%$
.
Characteristics of workers by skill type

Note: The average income is standardized to 1.
Source: Encuesta Nacional sobre Condiciones de Vida 2006.
Two moments are used to identify the labor income abroad ( $\overline{w}_{S}$
and
$\overline{w}_{S}$
and $\overline{w}_{U}$
): the skill gap abroad (
$\overline{w}_{U}$
): the skill gap abroad ( $\frac{\overline{w}_{S}}{\overline{w}_{U}})$
and the relative earnings between the host and the source country (
$\frac{\overline{w}_{S}}{\overline{w}_{U}})$
and the relative earnings between the host and the source country ( $\frac{W^{Host}}{W^{Source}})$
. We set the skill gap abroad equal to
$\frac{W^{Host}}{W^{Source}})$
. We set the skill gap abroad equal to $2,8$
consistent with the values reported from the CPS (2000); furthermore, we use the ratio
$2,8$
consistent with the values reported from the CPS (2000); furthermore, we use the ratio $\frac{GDP^{USA}}{GDP^{Guatemala}}=8,0$
in per capita terms as a proxy for the relative labor earnings between these two countries.
$\frac{GDP^{USA}}{GDP^{Guatemala}}=8,0$
in per capita terms as a proxy for the relative labor earnings between these two countries. $\overline{w}_{U}$
is set based on the value of the skill gap
$\overline{w}_{U}$
is set based on the value of the skill gap $(\overline{w}_{S}=2,8\overline{w}_{U})$
abroad and
$(\overline{w}_{S}=2,8\overline{w}_{U})$
abroad and $\overline{w}_{S}$
is estimated together with the remaining parameters.
$\overline{w}_{S}$
is estimated together with the remaining parameters.
The tax rate, $\tau$
, is set at
$\tau$
, is set at $0,1$
so that the tax revenue is around
$0,1$
so that the tax revenue is around $10\%$
of GDP. The lump-sum transfer
$10\%$
of GDP. The lump-sum transfer $tr1$
is set in equilibrium and it balances the government budget. We target an equilibrium in which the average years of education is around
$tr1$
is set in equilibrium and it balances the government budget. We target an equilibrium in which the average years of education is around $8,5$
, which is close to the average years of education of the adult population who finished at least a primary education (ENCOVI-2006). We also target the average years of education by skill type, 6 for unskilled workers and 12,9 for skilled workers (see Table 1).
$8,5$
, which is close to the average years of education of the adult population who finished at least a primary education (ENCOVI-2006). We also target the average years of education by skill type, 6 for unskilled workers and 12,9 for skilled workers (see Table 1).
Choosing parameters for the human capital production function that align with empirical evidence is crucial for ensuring validity of the model’s predictions. The values we’ve selected for the private and social returns to education are grounded in existing research on Guatemala and Mexico. The private return for one additional year of education, as estimated from the Mincer Equation literature for Guatemala ( $\phi _{0}=0,1$
), reflects the individual-level benefits individuals derive from investing in education (Montenegro and Patrinos (Reference Montenegro and Patrinos2014)). This value captures the earnings increase associated with higher levels of education and serves as a proxy for the private incentives for education. Additionally, setting the social return of education to 0,01, (
$\phi _{0}=0,1$
), reflects the individual-level benefits individuals derive from investing in education (Montenegro and Patrinos (Reference Montenegro and Patrinos2014)). This value captures the earnings increase associated with higher levels of education and serves as a proxy for the private incentives for education. Additionally, setting the social return of education to 0,01, ( $\phi _{1}=0,01$
) as observed in the study by Céspedes (Reference Céspedes2014) for Mexico, accounts for the broader societal benefits of education beyond just individual earnings. The scale parameter
$\phi _{1}=0,01$
) as observed in the study by Céspedes (Reference Céspedes2014) for Mexico, accounts for the broader societal benefits of education beyond just individual earnings. The scale parameter $\varphi$
is set at
$\varphi$
is set at $\frac{1,0}{7,5}$
. This value is chosen so that the saving policies belong to a computationally feasible space.
$\frac{1,0}{7,5}$
. This value is chosen so that the saving policies belong to a computationally feasible space.
The remaining eight parameters $(\beta,p_{i},\Delta,\chi,\eta,\sigma _{v},\overline{w}_{S})$
are jointly estimated by using the Nelder-Mead (1965) algorithm. Briefly, the method consists of choosing iteratively these parameters such that the moments delivered by the model are close enough to the empirical moments. The parameters considered helps to identify the eight moments of Table 2. We briefly mention what moments help identify which parameters. The discount factor identifies the capital output ratio. The type-specific migration probabilities identify the type-specific migration rates. The migration cost identifies the migration cost—labor income ratio. The skill premium is closely related to
$(\beta,p_{i},\Delta,\chi,\eta,\sigma _{v},\overline{w}_{S})$
are jointly estimated by using the Nelder-Mead (1965) algorithm. Briefly, the method consists of choosing iteratively these parameters such that the moments delivered by the model are close enough to the empirical moments. The parameters considered helps to identify the eight moments of Table 2. We briefly mention what moments help identify which parameters. The discount factor identifies the capital output ratio. The type-specific migration probabilities identify the type-specific migration rates. The migration cost identifies the migration cost—labor income ratio. The skill premium is closely related to $\eta$
and the capital income share is identified by
$\eta$
and the capital income share is identified by $\chi$
. The skilled labor income abroad is related to the host country—source country labor income gap. Finally, the standard error of the productivity sock identifies the labor income standard error.Footnote
21
$\chi$
. The skilled labor income abroad is related to the host country—source country labor income gap. Finally, the standard error of the productivity sock identifies the labor income standard error.Footnote
21
Parameters of the calibrated model with return migration

Computing the stationary equilibrium involves iteratively adjusting prices, lump-sum transfers, and average years of education until the economy reaches a state where market-clearing conditions are satisfied. This iterative process ensures that factor prices align with their marginal productivities, individual education levels match aggregate education targets, and government revenues match expenditures.Footnote 22 The calibrated parameters of the model are summarized in Table 2. In Appendix A.2 we explain our computational procedure.
In the second step of the calibration process, we integrate return migration into the model by building upon the solution obtained in the first step, which focused solely on migration. Return migration introduces two additional parameters: the return migration transfer, denoted as $\Lambda _{2}$
, and the brain-gain parameter, denoted as
$\Lambda _{2}$
, and the brain-gain parameter, denoted as $\zeta$
. We calibrate these parameters using two empirical moments that help identify their values: The percentage of migrants who return to their birth country after a period of migration, which typically ranges between 15% to 20%, and the average increase in human capital experienced by returning migrants, which is typically around 20% higher than their human capital level before migration. To incorporate return migration into the model, we keep the lump-sum transfer
$\zeta$
. We calibrate these parameters using two empirical moments that help identify their values: The percentage of migrants who return to their birth country after a period of migration, which typically ranges between 15% to 20%, and the average increase in human capital experienced by returning migrants, which is typically around 20% higher than their human capital level before migration. To incorporate return migration into the model, we keep the lump-sum transfer $\Lambda _{1}$
equal to the solution obtained from the migration-only model. We then iterate over the tax rate to ensure that aggregated tax revenues are equal to total transfers, including
$\Lambda _{1}$
equal to the solution obtained from the migration-only model. We then iterate over the tax rate to ensure that aggregated tax revenues are equal to total transfers, including $\Lambda _{2}$
. This proportional tax approach helps support
$\Lambda _{2}$
. This proportional tax approach helps support $\Lambda _{2}$
, which facilitates the return migration process while maintaining fiscal balance within the model. With
$\Lambda _{2}$
, which facilitates the return migration process while maintaining fiscal balance within the model. With $\zeta =1,2$
Footnote
23
and
$\zeta =1,2$
Footnote
23
and $\Lambda _{2}=0,4$
the model generates moments that are close to the corresponding empirical ones.
$\Lambda _{2}=0,4$
the model generates moments that are close to the corresponding empirical ones.
Table 3 presents a comparison between the model’s predicted moments and their corresponding empirical targets. We observe that the model closely replicates several key economic features: The model predicts a capital output ratio of $2,05$
, which is in close proximity to the observed value of
$2,05$
, which is in close proximity to the observed value of $2,2$
. The model’s predicted migration rates for skilled and unskilled workers are consistent with their observed counterparts, the skilled migration rate in the model is
$2,2$
. The model’s predicted migration rates for skilled and unskilled workers are consistent with their observed counterparts, the skilled migration rate in the model is $17,2\%$
, matching the targeted value of
$17,2\%$
, matching the targeted value of $17\%$
, similarly, the unskilled migration rate is
$17\%$
, similarly, the unskilled migration rate is $6,0\%$
, aligning with the empirical data. In terms of inequality, the model generates a skill gap of
$6,0\%$
, aligning with the empirical data. In terms of inequality, the model generates a skill gap of $4,71$
, which closely resembles the empirically observed level of inequality. Overall, these results indicate that the model effectively captures important economic produces outcomes that are consistent with real-world observations.
$4,71$
, which closely resembles the empirically observed level of inequality. Overall, these results indicate that the model effectively captures important economic produces outcomes that are consistent with real-world observations.
Moments
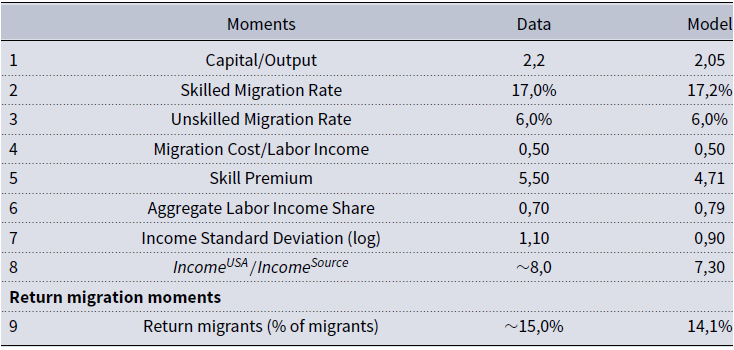
The endogenous generation of brain drain and the approximate match of remittances to empirical data are notable features of our model. The model predicts a skilled migration rate nearly three times higher than the unskilled migration rate, reflecting real-world trends where skilled individuals are more likely to migrate. Additionally, remittances account for approximately 10% of GDP in the model, aligning closely with empirical observations from 2008. These are indicators of the models’ performance, since they were not targeted by the calibration procedure and they were endogenously delivered by the model.
Finally, after comparing the empirical moments and the moments generated by the model, we conclude that our model is a good approximation of the economy under consideration.Footnote 24 We now attempt to use the model to perform a set of experiments in order to answer some of the questions posed.
5.1 Some limitations of the GE approach
The general equilibrium model captures the main features of an economy with high-skilled migration; however, it may have some limitations because we do not consider all aspects and/or sectors of the economy in the migration source country. It’s understandable that a comprehensive analysis of migration and its macroeconomic effects would require considering various aspects beyond the scope of our model. Computational limitations can indeed constrain the complexity of the model and the inclusion of additional factors such as international trade or the impact of remittances on the balance of payments as well as the financial market. These macro aspects of migration and remittances are remarkable for an economy with high migration and international remittances. However, by focusing on the household-level decision to migrate and incorporating key features of migration dynamics, our model provides valuable insights into the microeconomic implications of migration and remittances.
Likewise, the effects of international migration on the labor market of the host country are not modeled. This assumption is based on the observation that the source country is small and the impact on the labor market of the host country is minimal due to the relatively small size of the migrant population compared to the host country’s labor force. For example, total migrants from Guatemala in 2020 represent 0,1% of the US labor force and it is unlikely that they will affect wages in the destination country. However, as we introduce in our model, the education wage premium in the destination country is considered a relevant element in the decision to migrate according to the education of the workers.
6. Results
6.1 Accounting for the quantitative effects of migration
Conducting a counterfactual experiment to compare the outcomes of a model with migration against a scenario where migration is not allowed can offer valuable insights into the overall impact of migration on various economic indicators and welfare. By contrasting these two scenarios, we can evaluate how migration influences key variables such as labor market outcomes, income distribution, aggregate production, and overall welfare levels in the economy.
The non-migration model is a particular case of the migration model in which we set the migration probability equal to zero for each household type $(p_{i}=0$
for
$(p_{i}=0$
for $i=1,\ldots,n)$
. The competitive equilibrium of the no-migration model is computed by using the same parameters of the migration model, it ensures that any differences in outcomes between the two models are solely attributable to the presence or absence of migration and remittances. We also compute the competitive transition path along the two steady-state solutions. Analyzing the competitive transition path along the two steady-state solutions can provide valuable insights into how the economy adjusts over time in response to changes in migration policy and its implications for long-term economic dynamics.
$i=1,\ldots,n)$
. The competitive equilibrium of the no-migration model is computed by using the same parameters of the migration model, it ensures that any differences in outcomes between the two models are solely attributable to the presence or absence of migration and remittances. We also compute the competitive transition path along the two steady-state solutions. Analyzing the competitive transition path along the two steady-state solutions can provide valuable insights into how the economy adjusts over time in response to changes in migration policy and its implications for long-term economic dynamics.
The quantitative long-run effects of migration, as summarized in columns 3 and 5 of Table 4, reveal significant impacts on the source country’s economy. Migration influences the economy in three primary aspects: it decreases output, it increases inequality, and it induces welfare improvement of the population. We briefly discuss the driving forces behind these results:
Summary of quantitative effects of migration
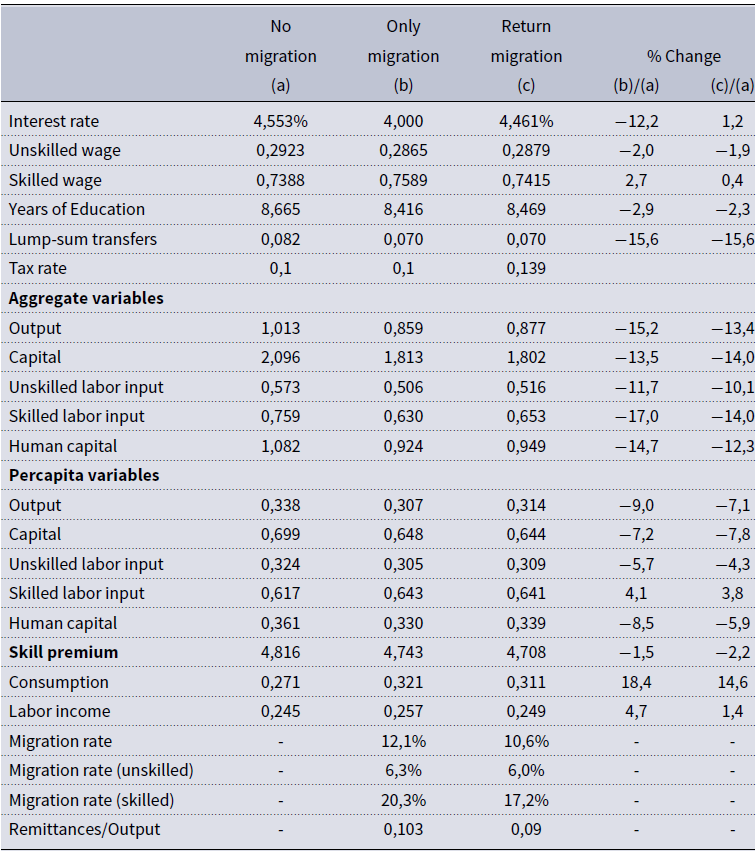
Note: Results correspond to the case when households are borrowing-constrained ( $\underline{a} = 0$
). Labor of each worker is measured in efficiency units, and it is equal to the product of his human capital and productivity shock. Human capital of each worker is defined in terms of individual and aggregated years of education (Section 3.1).
$\underline{a} = 0$
). Labor of each worker is measured in efficiency units, and it is equal to the product of his human capital and productivity shock. Human capital of each worker is defined in terms of individual and aggregated years of education (Section 3.1).
Output: The decrease in output by $13,4\%$
due to migration is primarily influenced by two key factors: the reduction in physical capital and the decline in aggregate efficiency units of labor. Specifically, the reduction in skilled labor force has a more pronounced effect compared to the decreases in both the unskilled labor force and capital stock. Consequently, this leads to a reduction in the interest rate. Notice that the scarcity of skilled workers in relative terms, due to brain drain, is the driving force behind the skilled wage increase and the unskilled wage decrease.
$13,4\%$
due to migration is primarily influenced by two key factors: the reduction in physical capital and the decline in aggregate efficiency units of labor. Specifically, the reduction in skilled labor force has a more pronounced effect compared to the decreases in both the unskilled labor force and capital stock. Consequently, this leads to a reduction in the interest rate. Notice that the scarcity of skilled workers in relative terms, due to brain drain, is the driving force behind the skilled wage increase and the unskilled wage decrease.
Inequality: The increase in income inequality, reflected by an 8% rise in the Gini coefficient of consumption due to migration and remittances, is driven by a combination of factors that both decrease and increase inequality. Initially, the departure of skilled workers through migration and brain drain may lead to a reduction in income inequality. This is attributed to the decrease in the number of workers in the upper tail of the income distribution, resulting from the outflow of skilled individuals. However, the effects of migration on wages contribute to an increase in income inequality. The decrease in wages for unskilled workers, coupled with the simultaneous increase in wages for skilled workers, exacerbates income disparities. As the skilled labor market experiences greater demand relative to supply due to migration-induced scarcity, skilled workers command higher wages, further widening the gap between skilled and unskilled earners. Remittances can also influence income inequality, since skilled workers are more likely to migrate, remittances tend to flow disproportionately to households with higher-income potential, thereby contributing to income inequality. Overall, while skilled migration initially reduces income inequality through its demographic effects, subsequent changes in wages and remittances exacerbate inequality by disproportionately benefiting skilled workers and their households.
Brain drain: The endogenous brain drain generated by our model, which leads to a 5,9% decrease in average human capital per worker, can be attributed to two key features: migration cost and migration probability. Migration costs are significant and are paid by the household from its total income. This implies that only families with sufficient financial resources can afford to migrate. Consequently, migration becomes a viable option primarily for wealthier households that can absorb the financial burden associated with migration costs. In contrast, poorer households, often constrained by borrowing limits, may find it financially prohibitive to undertake migration. The migration probability varies across household types, reflecting disparities in their socioeconomic characteristics. Wealthier households are more likely to have members migrate, given their ability to paid the migration costs. Consequently, the migration process tends to selectively draw skilled individuals, exacerbating the brain drain effect.
The migration decision by skill type is a complex problem in which several competing forces act. Some of them are a direct assumption like the frequency of offers. This parameter is needed since in the model the migration cost is not enough to generate a reasonable endogenous migration rate by skill type. Also, brain drain is driven by the higher probability offers of skilled workers and by the fact that skilled workers are more likely to migrate because they can afford it in contrast to less educated workers. As we show in the sensitivity analysis section as well as in the policy evaluation section of the paper both the migration cost and the probability to migrate are important drivers of the migration decision, also, in the model both variables are exogenous from the emigrant perspective.
The insurance component of migration: We provide evidence that supports the view that migration is used as a household insurance strategy to cope against the effects of labor market risks. The consumption standard error decreases $0,8\%$
due to migration, which is consistent with the idea that households use migration in order to smooth consumption.
$0,8\%$
due to migration, which is consistent with the idea that households use migration in order to smooth consumption.
The model’s prediction regarding the transition from a closed economy without migration to an economy where migration is allowed aligns with historical trends observed in Guatemala. Fig. A5 illustrates that this transition primarily occurs over a period of approximately 30 years following the opening of the economy to migration. This gradual transition mirrors the historical evolution of the migration rate in Guatemala over the past five decades, as depicted in Fig. A6. Historical migration data from Guatemala indicates a steady increase in the migration rate over time, starting from near-zero levels in the 1960s and reaching approximately 10% by 2010. The model’s competitive transition captures a similar dynamic, with the migration rate gradually rising over the simulated period. After five decades, the migration rate in the model approaches 9,5%, closely mirroring the observed migration rate of around 11%. This suggests that the model captures a substantial portion of the dynamics of the migration rate, accounting for up to 86% of the observed trend. Overall, the model’s depiction of the transition from a closed economy to one with migration aligns well with historical migration patterns in Guatemala, providing valuable insights into the dynamics of migration and its long-term effects on the economy.
One feature of the model is that the transition from the no-migration equilibrium to the equilibrium with migration is slow. The slow transition is a feature that reflects the slow persistency of the productivity shocks, the lack of persistency of the migration offers, and the smooth change in prices. Recall that in the model the migration probability follows an i.i.d. process. The migration transition path is characterized by a smooth increase in the migration rate once the economy is open to migration. During the transition the variables that identify the migration shock (migration offer, migration cost, remittances, and return migration) are constant. On the other hand, we allow for changes in the GE variables that comprises aggregated education, taxes and transfers, wages, and interest rate. During the transition the GE evolves such that prices are competitive, we have consistency at the micro and macro level in terms of education, and the government budget holds. Based on the simulations we mention that the drivers of the migration rate along the transition path are the skilled biased migration probability (with low persistency) and the change in prices and transfers. Since migration probability is skilled biased, the human capital composition along the transition captures the evolution of brain drain, in this case while the stock of skilled migrants increases the stock of human capital in the source economy decreases (brain drain).
6.1.1 Welfare analysis
The Consumption Equivalence Variation (CEV) approach provides a framework for evaluating the welfare effects of policy changes in models with heterogeneous agents (Flodén (Reference Flodén2001), Heathcote (Reference Heathcote2005)). The CEV measures the proportional change in consumption required to make households indifferent between two stationary equilibria: the baseline equilibrium and the equilibrium following the introduction of the policy under consideration. $\left \{ c_{t}(.)\right \} _{t=0}^{\infty }$
denote the equilibrium choices in the baseline equilibrium and
$\left \{ c_{t}(.)\right \} _{t=0}^{\infty }$
denote the equilibrium choices in the baseline equilibrium and $\left \{ \hat{c}_{t}(.)\right \} _{t=0}^{\infty }$
the corresponding equilibrium choices along the transition path after the introduction of the policy under consideration; then the CEV for each state is denoted by
$\left \{ \hat{c}_{t}(.)\right \} _{t=0}^{\infty }$
the corresponding equilibrium choices along the transition path after the introduction of the policy under consideration; then the CEV for each state is denoted by $\psi (.)$
and it is determined by solving the following expression:
$\psi (.)$
and it is determined by solving the following expression:
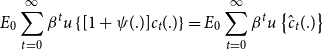 \begin{equation*} E_{0}\sum _{t=0}^{\infty }\beta ^{t}u\left \{ [1+\psi (.)]c_{t}(.)\right \} =E_{0}\sum _{t=0}^{\infty }\beta ^{t}u\left \{ \hat {c}_{t}(.)\right \} \end{equation*}
The average CEV is computed integrating the individual consumption equivalent variation across the stationary distribution of the baseline equilibrium.
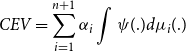 \begin{equation*} CEV=\sum \limits _{i=1}^{n+1}\alpha _{i}\int \psi (.)d\mu _{i}(.) \end{equation*}
In our particular case, to evaluate the welfare effects of migration we consider as a baseline equilibrium the model without migration, while the equilibrium of the model after allowing for migration stands for the second economy. Fig. A5 shows the model-predicted transition path of the migration rate by skill type (the transition path’s of the other variables are presented in Fig. A6).
After computing the transition path between these two solutions, we found that, on average, migration improves the welfare of the population. On average, a household gains $1,39\%$
of its lifetime consumption if it goes through the transition path compared with the scenario in which it stays in the source economy forever (see Table 5).
$1,39\%$
of its lifetime consumption if it goes through the transition path compared with the scenario in which it stays in the source economy forever (see Table 5).
CEV by household type (% change)
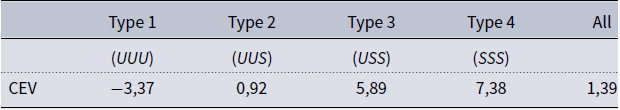
Even though migration seems to be a generally beneficial policy, the welfare effects of migration appear to be heterogeneous. Fig. 2 presents the CEV by household wealth for each type of household. Two interesting features arise from this figure: First, since the CEV is increasing in wealth, rich households may benefit more from migration compared to poor households. Two effects drive this result; first, poor households will be adversely affected due to the indirect effects of migration; most of these agents are borrowing-constrained and cannot support the migration cost. Second, wealthy families can support the migration cost and may receive most of the direct and indirect benefits of migration.
There is significant heterogeneity in the welfare effects of migration. Unskilled households (Type 1) may experience negative CEV (–3,37%), mainly due to the indirect effects of migration such as a decrease in unskilled wages and interest rates. Skilled households (Type 4) may gain more from migration in terms of CEV, benefiting directly from remittances and indirectly from increased wages. Type 2 and Type 3 households report a positive CEV.
In summary, there are winners and losers due to migration. Skilled workers tend to benefit, while unskilled workers may suffer losses. On average, migration may produce positive welfare effects; however, since unskilled workers represent more than 50% of the population, a policy that allows migration may not be supported by a majority rule election.
CEV by household wealth (% change).

The model provides insights into the effects of migration on the public tax system. When migration is allowed, the income tax rate remains fixed at 10%, while lump-sum transfers adjust to maintain equilibrium, resulting in a relaxation of the government budget due to brain drain. Specifically, government revenue decreases by 15,6%, reflecting the reduction in the population caused by skilled migration. While this may help ease the government budget, it can have adverse effects on non-migrant households as transfers decrease due to migration. Additionally, the model can evaluate the aggregated cost of return migration policies. If such a policy were implemented, it would require an increase in the income tax rate from 10% to 13%, indicating a high cost. This policy change may have heterogeneous welfare effects on both migrant and non-migrant households, further illustrating the complexity of migration policy decisions.
6.1.2 General equilibrium effects of migration
We have shown that migration has significant long-run effects. Also, the model captures effects of the migration shock over several outcomes of the economy both at the micro and macro levels. The migration shock comprises migration, remittances and return migration and we have shown that migration has significant long-run effects both in terms of price changes as well as other outcomes changes, we call this the total effects of migration. In this section we decompose these effects into two components: the general equilibrium and the partial equilibrium effects. We relate the effects of price changes (wages and interest rate) as the general equilibrium effect of migration, these effects are second order effect that allows the markets clear and guarantee a general equilibrium solution, notice that the model solution with constant prices is a partial equilibrium solution since some market-clearing conditions may not hold.
In this section we perform two experiments to uncover the general equilibrium effect of migration. The first experiment consists of solving the migration model by using the prices of the no-migration solution; we call this the constant-price solution (column c in Table 6). A direct comparison between the outcomes of the constant-price solution and the no-migration solution (column a in Table 6) identifies the partial equilibrium effects of migration; meanwhile, the general equilibrium effects of migration can be identified as the residual between the total effects and the previously computed effects. The general equilibrium effect is also equivalent to the difference between the outcomes of the solution with migration (column b in Table 6) and the constant-price solution. Notice that the GE effect captures only the effects of price changes.Footnote 25
Model with constant prices
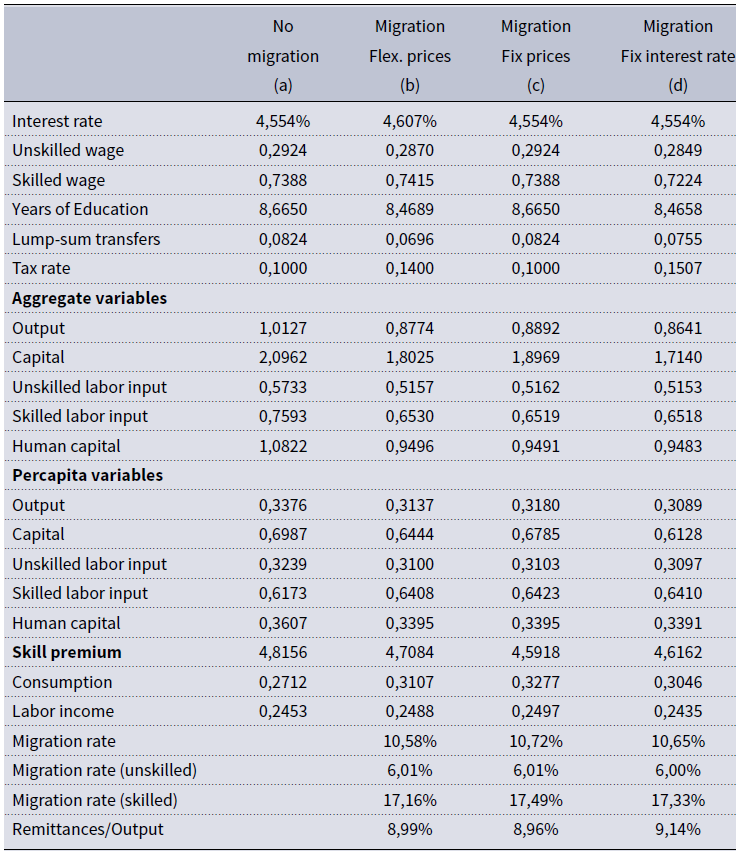
Note: a: Model without migration. b: Model with migration, return migration and flexible prices. c: Model with migration, return migration and fix prices (prices of model a). d: Model with migration, return migration and fix interest rate.
The results of this experiment indicate that approximately $9,9\%$
of the change in output is attributed to changes in prices, highlighting the quantitative importance of general equilibrium effects. This finding underscores the significance of considering the general equilibrium effects when assessing the overall impact of migration on the economy. Table 6 shows the results of this experiment with more detail.
$9,9\%$
of the change in output is attributed to changes in prices, highlighting the quantitative importance of general equilibrium effects. This finding underscores the significance of considering the general equilibrium effects when assessing the overall impact of migration on the economy. Table 6 shows the results of this experiment with more detail.
The second experiment aims to explore the impact of migration and remittances on household welfare in a general equilibrium framework. Initially, three identical households are chosen in period 0. After the initial period, we allow for migration, and we distinguish them according to their migration status: Stayer Household: This household remains in the source country throughout the simulation period. Migrant Household without Remittances: This household sends a member abroad but does not receive any remittances. Migrant Household with Remittances: This household sends a member abroad and receives endogenous remittances from the migrant. All three households are subjected to the same history of productivity shocks along the competitive transition. This ensures that any changes in household welfare can be attributed to the effects of migration, remittances and prices changes rather than differential productivity experiences.
The main result of the exercise is remittances plays a key role in the welfare effects of migration, as Fig. A4 shows that utility of the migrant with remittances is higher than the utility of the stayer household, it is also higher than the household with a migrant but remittances. The difference between the utility of the stayers household and the household with a migrant but remittances is also important according to the Fig. A4, this difference is related with the effects of the general equilibrium objects such as prices change, aggregate schooling change, and transfer change.
6.1.3 The role of flexible interest rate
In the baseline model the interest rate is flexible and after a migration shock the model adjust through interest rate changes as well as capital inflow/outflow, however, the flexible interest rate assumption may not be consistent with a SOE. To better know the role of flexible interest rate we solve the model with fix interest rate. In this case, the remaining general equilibrium objects still adjust to clean markets and to support the solution (wages, taxes, transfer, government budget, aggregate schooling).
The comparison between the model solutions with fixed and flexible interest rates reveals that while the interest rate change does influence migration outcomes, its impact may not be as significant as other factors such as skilled migration and remittances (column d of Table 6). Specifically, the model with a fixed interest rate predicts higher migration rates and a greater proportion of skilled migration (brain drain) compared to the model with a flexible interest rate. However, the difference in migration rates between the two interest rate regimes is relatively small. Moreover, the analysis suggests that the impact of interest rate flexibility on other model outcomes, such as human capital reduction due to skilled migration, is also limited (see Table 6). Both the fixed and flexible interest rate models yield similar outcomes in terms of human capital reduction, indicating that interest rate changes may not exert a strong influence on this aspect of migration dynamics.
6.1.4 The role of borrowing
Allowing households to borrow resources introduces an important element of flexibility into the model, which can significantly affect migration outcomes and their associated effects. In the scenario where borrowing is permitted, households have the ability to finance migration costs through borrowing, up to a maximum amount equivalent to 50% of the migration cost ( $\underline{a} = -0,055$
). In order to compare the results with the no borrowing case we keep the remaining parameters as in the previous case. The model predictions under the borrowing scenario, as summarized in Table A3 (see the Appendix), provide insights into the effects of borrowing on migration outcomes, prices, and other model predictions.
$\underline{a} = -0,055$
). In order to compare the results with the no borrowing case we keep the remaining parameters as in the previous case. The model predictions under the borrowing scenario, as summarized in Table A3 (see the Appendix), provide insights into the effects of borrowing on migration outcomes, prices, and other model predictions.
The results indicate that relaxing the borrowing constraint has a modest positive effect on migration rates, particularly for unskilled households. While the increase in migration rates may seem small in absolute terms, it is consistent with the notion that borrowing-constrained households may utilize financial resources to overcome migration costs. The heterogeneous household setup in the model allows for variations in household incomes and financial capabilities. As such, the impact of relaxing the borrowing constraint may be more pronounced for households with incomes closer to the migration cost threshold, where even a small increase in financial flexibility can facilitate migration decisions.
Overall, while the effect on migration rates may be relatively small, the ability to borrow resources can still play a significant role in enabling migration for certain households, particularly those facing financial constraints. This highlights the importance of considering financial factors in understanding migration dynamics and their economic implications.
6.2 Policy intervention
In this section, we analyze the effects of four policy interventions aimed at influencing migration patterns and brain drain. The results of these simulations are summarized in Table A1. Each policy is designed to address different aspects of migration dynamics and their impact on brain drain. In the following discussion, we provide a brief overview of the results, and additional details of each policy intervention are provided in the appendix.
Migration cost: We consider that the migration cost increases from $0,1$
to
$0,1$
to $0,2$
the latter is equivalent to around
$0,2$
the latter is equivalent to around $\$2000$
in monetary terms. This policy, or the size of it, is reasonable enough to be implemented by a government that attempts to prevent a brain drain; however, it has small aggregate effects and it does not prevent brain drain at all. Given that the most affected are poor agents, this policy is better suited to preventing migration in general (see column a of Table A1).
$\$2000$
in monetary terms. This policy, or the size of it, is reasonable enough to be implemented by a government that attempts to prevent a brain drain; however, it has small aggregate effects and it does not prevent brain drain at all. Given that the most affected are poor agents, this policy is better suited to preventing migration in general (see column a of Table A1).
Remittances: The policy scenario involving a reduction in the probability of sending remittances sheds light on the complex dynamics between migration, remittances, and welfare. The model’s results highlight several key insights: the reduction in the probability of remittances (from 0,3 to 0,15) leads to negative welfare effects overall, despite an increase in output due to capital gains and an expansion of the labor force in efficiency units (see column b of Table A1). This suggests that the loss of remittance income outweighs the benefits from other economic factors. The model elucidates the insurance role of remittances in household consumption and savings behavior, when the probability decreases, households increase savings as a form of insurance against the uncertainty of remittance inflows. Also, the reduction in remittance probability disproportionately affects skilled workers, reflecting the bias of migration towards skilled individuals. Skilled workers are more reliant on remittances, and therefore, they experience greater welfare impacts from a reduction in remittance opportunities.
Migration probability: The policy scenario involving a reduction in offers to migrate sheds light on the potential effects of government intervention to influence migration patterns. A 50% reduction in offers to migrate (to all types of households) leads to significant aggregate effects in terms of output, capital, and labor. This suggests that changes in migration offers can have substantial impacts on the overall economy, affecting key macroeconomic indicators. Interestingly, the model predicts that the reduction in migration offers affects unskilled workers more than skilled workers. This indicates that the policy may unintentionally exacerbate brain drain by deterring unskilled migration more than skilled migration. While the policy intervention has notable aggregate effects, its effectiveness as an anti-brain drain strategy may be limited.
Return migration: This section focuses on assessing the economic effects of return migration through two simulations: The first simulation compares the model outcomes with return migration to those without it. This comparison elucidates the specific economic effects attributed to return migration. In the second simulation, a specific driver of return migration—namely, the human capital gain of return migrants—is shut down. This allows for an examination of how the absence of human capital adjustments among return migrants influences economic outcomes. The model’s predictions regarding return migration effects are modest in average developing economies. Return migration may have some positive effects on the economy, but it is not sufficient to completely offset the negative impacts of skilled migration.
6.3 Robustness analysis
Performing sensitivity analysis by varying five key parameters of the model allows us to understand how changes in these parameters influence the model’s predictions. For each parameter considered— $\chi$
,
$\chi$
, $\eta$
,
$\eta$
, $\delta$
,
$\delta$
, $\rho$
, and the correlation between household members’ productivity shocks
$\rho$
, and the correlation between household members’ productivity shocks $\rho _{v}$
—we explore two additional values: one higher and one lower than the baseline value. The simulations conducted in the sensitivity analysis generally yield results that align with those of the main calibration, particularly regarding skilled migration, return migration, and remittances. Moreover, the policy simulations presented in Section 6.2 demonstrate that migration-related variables in the model are primarily influenced by the cost of migration, the probability of migration, and remittances. Furthermore, the broader economic indicators such as GDP and human capital exhibit only minor changes when considering reasonable adjustments to these parameters. This suggests that while variations in the five parameters can affect specific aspects of the model’s outcomes, the overall economic dynamics and trends remain relatively stable. See appendix for details of the sensitivity analysis.
$\rho _{v}$
—we explore two additional values: one higher and one lower than the baseline value. The simulations conducted in the sensitivity analysis generally yield results that align with those of the main calibration, particularly regarding skilled migration, return migration, and remittances. Moreover, the policy simulations presented in Section 6.2 demonstrate that migration-related variables in the model are primarily influenced by the cost of migration, the probability of migration, and remittances. Furthermore, the broader economic indicators such as GDP and human capital exhibit only minor changes when considering reasonable adjustments to these parameters. This suggests that while variations in the five parameters can affect specific aspects of the model’s outcomes, the overall economic dynamics and trends remain relatively stable. See appendix for details of the sensitivity analysis.
7. Final remarks
We develop a macro-quantitative model that closely reproduces the main economic features of a representative developing economy in which skilled migration, remittances, and return migration are quantitatively important. The model is able to generate endogenous migration, remittances and return migration. We find that migration has significant economic and welfare implications when it is modeled in a general equilibrium framework. Our results suggest that migration is one important driving force behind the economic growth of developing economies in which skilled migration and remittances are quantitatively important. Importantly, our model reveals that while migration generally enhances the welfare of the source country’s population, there are segments, notably impoverished households, that may not experience welfare gains post-migration liberalization.
The theoretical model also suggests that households use migration as an optimal strategy to smooth consumption and cope with the effects of idiosyncratic risks. One interesting prediction of the model also comprises the remittances uncertainty and its insurance component. As remittance probabilities rise—perhaps due to improved economic conditions in the host economy—the model predicts an increase in consumption accompanied by a decrease in savings. This suggests that reduced uncertainty surrounding remittances leads to enhanced welfare for households. In essence, the availability of more predictable remittance inflows allows households to allocate resources more optimally, resulting in improved economic well-being.
Regarding return migration policy, we find that the incentives provided by a reasonable skill-biased transfer policy do not generate strong aggregate effects; in other terms, the joint effects of return migration and remittances are not strong enough to compensate for the negative effects of skilled migration.
Finally, we consider a group of policies that attempt to reduce the effects of skilled migration: migration cost-based policies, return migration policies, and policies affecting remittance patterns. In general terms, the policies under consideration have limited aggregate effects, at least for a reasonable size of these policies. A migration cost-based policy, for example, affects mainly poor households and it mainly prevents migration of unskilled workers. A return migration policy based on skill-biased transfers has small aggregate effects in terms of output and prices. Finally, a shock that reduces the number of migrants who send remittances may also have small aggregate effects.
Acknowledgements
I am grateful to Professors Yongsung Chang and Arpad Abraham for their valuable advice and support. I thank Mark Bils, Mark Aguiar, Jay Hong, Josh Kinsler, William Hawkins, Ronni Pavan, David Card, Michal Kuklik, and the participants at the Rochester Macro/Applied Student Workshop for their helpful comments. All remaining errors are my own.
A. Appendix
A.1 Computing the Optimal Solution
We describe our procedure to compute the optimal solution of the problem of a household with a migrant abroad who sends remittances. The problem of a stayer household, or the first-period migrant, can be characterized following a similar procedure. Denote by $\lambda$
the Lagrange multiplier of the budget constraint, then the Lagrangian can be expressed by the following expression,
$\lambda$
the Lagrange multiplier of the budget constraint, then the Lagrangian can be expressed by the following expression,
 \begin{equation} L=\left \{ \begin{array}{c} (n-1)\frac{c^{1-\sigma }}{1-\sigma }+\frac{\widetilde{c}^{1-\sigma }}{1-\sigma }+\beta E[V^{m}(a^{\prime },\Theta _{-k}^{\prime },Z_{-k}^{\prime },R^{\prime };\,i)]+ \\ \lambda \lbrack (1-\tau )\sum _{j\neq k}^{n}w_{ij}h_{ij}z_{ij}+(1+(1-\tau )r)a+\Lambda _{1}-\widetilde{c}+\overline{w}_{ik}-(n-1)c-a^{\prime }]\end{array}\right \} \end{equation}
The first-order conditions of this problem are: $c\,:\,(n-1)c^{-\sigma }-(n-1)\lambda =0$ $\widetilde{c}\,:\,\widetilde{c}^{-\sigma }-\lambda =0$ $a^{\prime }\,:\,\beta EV_{a^{\prime }}^{m}(a^{\prime },\Theta _{-k}^{\prime },Z_{-k}^{\prime },R^{\prime };\,i)=\lambda$
Using FOC we analytically characterize $\widetilde{c}$
and
$\widetilde{c}$
and $Re.$
$Re.$ $\widetilde{c}=c$ $\textrm{Re}=\overline{w}_{ik}-c$
Measuring the effects of policies against brain drain (% change respect to the model with migration)
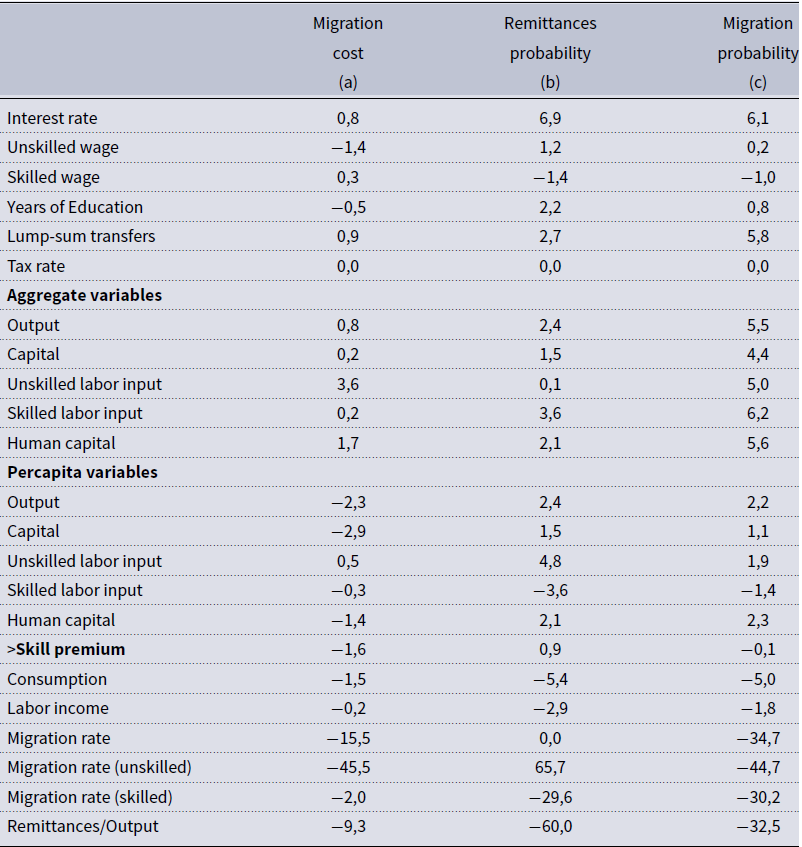
Note: a: 50% increase of migration cost. b: 50% reduction of remittances probability. c: 50% reduction of migration probability.
Competitive transition dynamic: main indicators

Quantitative effects of migration when household can borrow
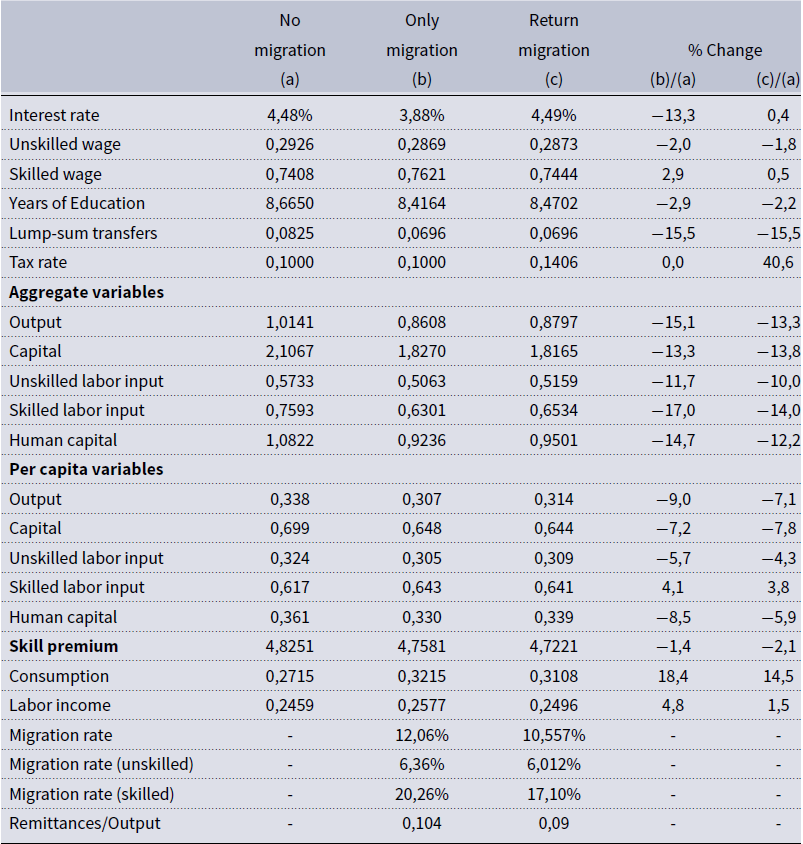
Note: Results correspond to the case when households can borrow ( $\underline{a} = -0.055$
). This case is comparable with Table 4 when borrowing is not allowed.
$\underline{a} = -0.055$
). This case is comparable with Table 4 when borrowing is not allowed.
A.1.1 Steps to compute solution
We apply the standard value function iteration method to find the optimal household policies. The following steps describe our procedure.
-
Place a grid on the asset space: $a$
: a
$\in A$
$a$
: a
$\in A$
-
Place an initial guess for the value functions
-
Given
$a$
and for each potential value of
$a^{\prime }$
in the asset space calculate consumption by using the budget constraint
$\widehat{c}(a,a^{\prime }).$
-
Plug
$\widehat{c}()$
in the Bellman equation and find optimal policies for consumption and the optimal value function too. The migration decision rule is also computed in this step for the stayer households’ problem; for this case we follow the two-step comparative advantage mechanism. -
Use the calculated value functions as a new initial guess and repeat the procedure until convergence.


A.1.2 Computing the general equilibrium solution
We solve for prices (wages and interest rate), lump-sum transfer, and the average years of education that support the general equilibrium solution. The following steps allow us to find the competitive equilibrium during each iteration of the Nelder-Mead algorithm (Table A2).
-
Guess initial values for interest rate, wages, years of education and the lump-sum transfer.
-
Solve the model for each set of parameters and the initial guesses. Compute the stationary distribution. Compute the marginal productivities delivered by the model. Compute the average years of education and the aggregate tax revenues delivered by the model.
-
Compare the marginal productivities, tax revenues and years of education delivered by the model with the corresponding initial guesses. Stop if they are close enough.
-
If there are differences, update the initial guess by using the average between the current guess and the values delivered by the model.
-
Repeat the procedure with the new guesses until convergence.
A.1.3 Computing the stationary distribution
We compute the stationary distribution by using the transition matrix method. The following steps describe our procedure for a particular household type:
-
Place a finer grid on the asset feasible set.
-
Interpolate the saving policy function
$(a^{\prime })$
and the value function for the new grid points. -
Compute the transition matrix. This is the matrix that defines the next period state given the current state. Denote this matrix by
$Q_{i}$
. Each row represents the next period state given the current state. -
Initialize the probability distribution
$\mu _{i}^{(0)}$
. -
Update the probability distribution by using the initial guess and the transition matrix.
$\mu _{i}^{(1)}$
$=Q_{i}\times \mu _{i}{}^{(0)}$
. -
Use
$\mu _{i}^{(1)}$
as the new initial guess
$(\mu _{i}^{(0)}=\mu _{i}^{(1)})$
and continue the iteration procedure until convergence:
$\left \vert \mu _{i}^{(0)}-\mu _{i}^{(1)}\right \vert \lt \varepsilon$
. -
Repeat the procedure for each household type.


A.2 Computing the Competitive Transition
We use a backward induction procedure to find the transition dynamic between steady states. Our procedure is described in the following steps:
-
Compute the initial steady-state equilibrium with no migration. Compute the final steady state when migration is allowed. Set the length of the transition,
$T=200$
. -
Guess an initial path for the interest rate, wages, lump-sum transfer, and years of education, call them
$r^{old}$
,
$w_{S}^{old}$
,
$w_{U}^{old}$
,
$\Lambda _{1}^{old}$
,
$s^{old}$
. -
We solve for the whole sequence of value functions and policy rules along the transition path by backward induction.
-
At
$t=0$
, the stationary distribution corresponds to the stationary distribution of the equilibrium with no migration. The period
$t$
distribution is calculated from the period
$t-1$
distribution by using the corresponding transition matrix. -
Calculate the model-delivered marginal productivities, lump-sum transfer and years of education; call them:
$r^{new}$
,
$w_{S}^{new}$
,
$w_{U}^{new}$
,
$\Lambda _{1}^{new}$
,
$s^{new}.$
-
Verify convergence criterion; stop if
$max\left \vert r^{old}-r^{new}\right \vert,\left \vert w_{S}^{old}-w_{S}^{new}\right \vert,\left \vert w_{U}^{old}-w_{U}^{new}\right \vert, \left \vert s^{old}-s^{new}\right \vert,\left \vert \Lambda _{1}^{old}-\Lambda _{1}^{new}\right \vert$
is small enough. -
Iterate until convergence; update the initial guess by using the average between the old and new values.


Migration by destination and by educational attainment (in percentage).
Source: Elaborated based on Docquier and Marfouk (Reference Docquier and Marfouk2005) data.
Note. Each point correspond to a country in 2000. Skilled workers are those with tertiary education (13 years of education and above). The total migration rate includes the total population.

Remittances by country as percentage of GDP.
Source: World Bank.

The insurance component of remittances worldwide (Developing economies from 1980 to 2009).
Source: World Bank.
Note: i denotes countries and t denotes years. The fixed effect regression delivers a significant elasticity remittances-GDP of –0,32 when the host economy is USA. Also, the main result is similar when the host economy is USA + EU (the elasticity is –0,30 when we include EU as the host economy).
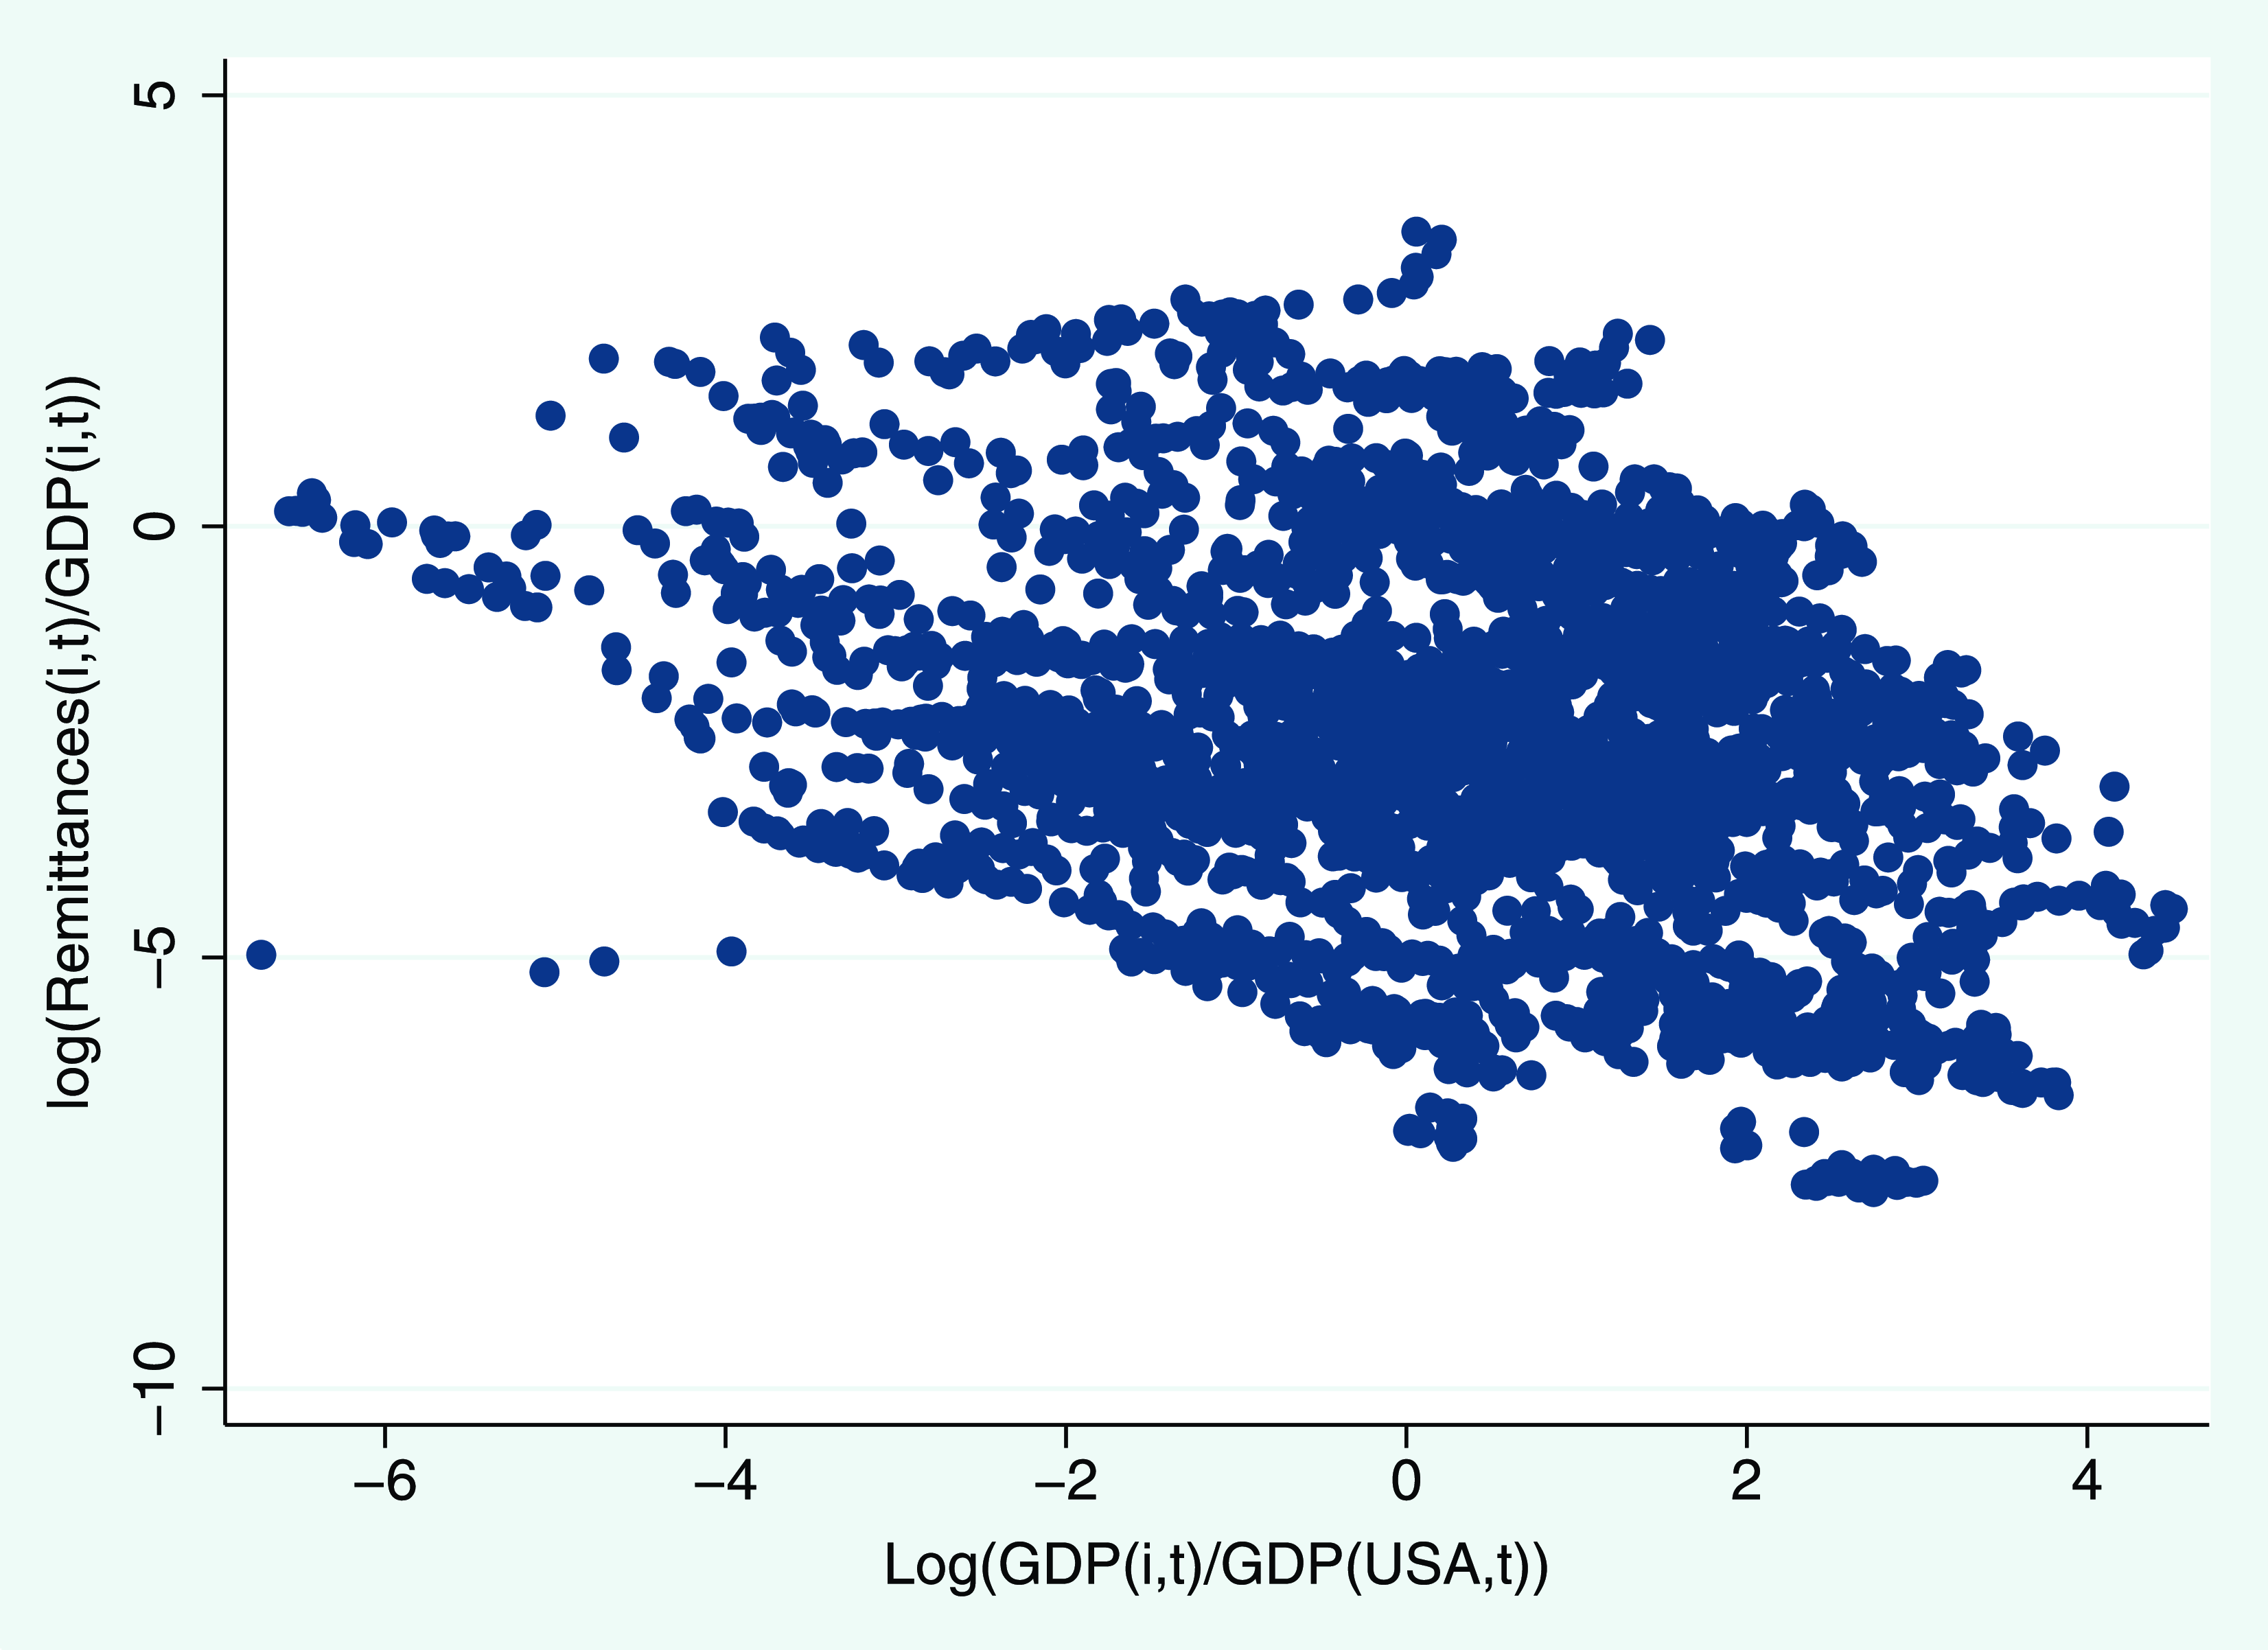
Utility according to migration status.
Note:Utility along the competitive transition. Simulation considers that migration happens in the second period.
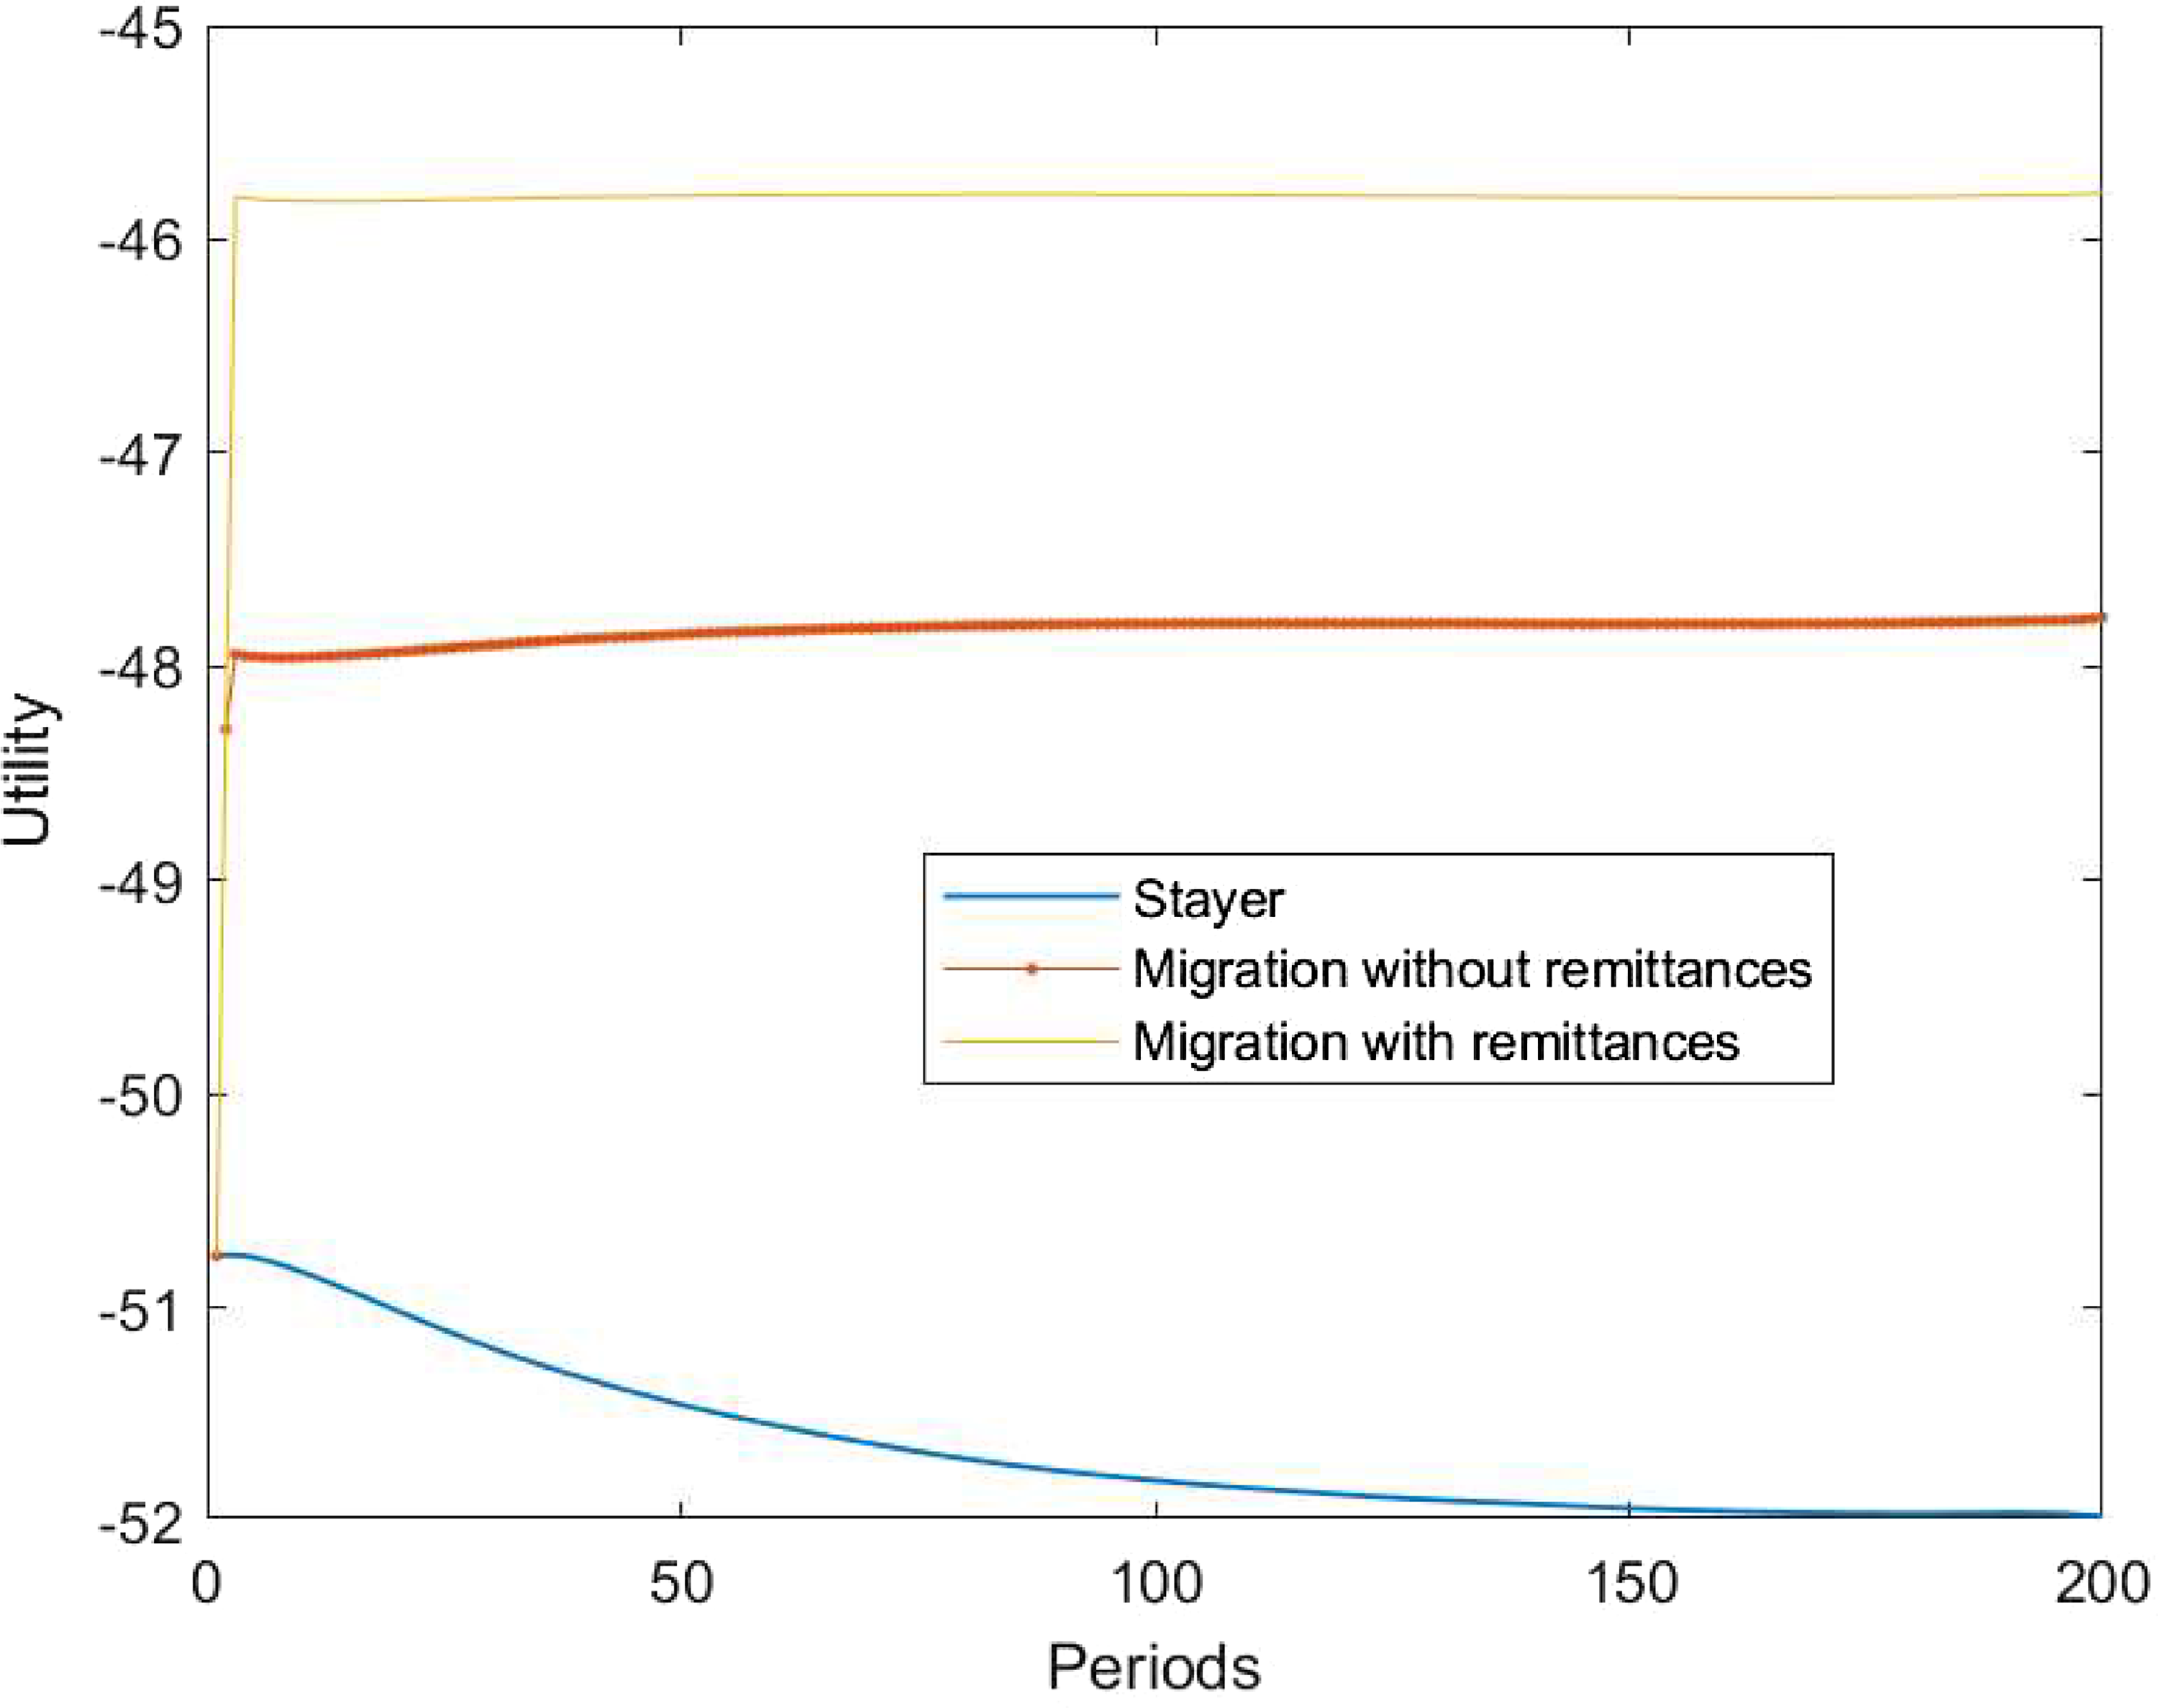
Transition path of migration rate by skill type.
Note:The transition is computed over 200 periods.
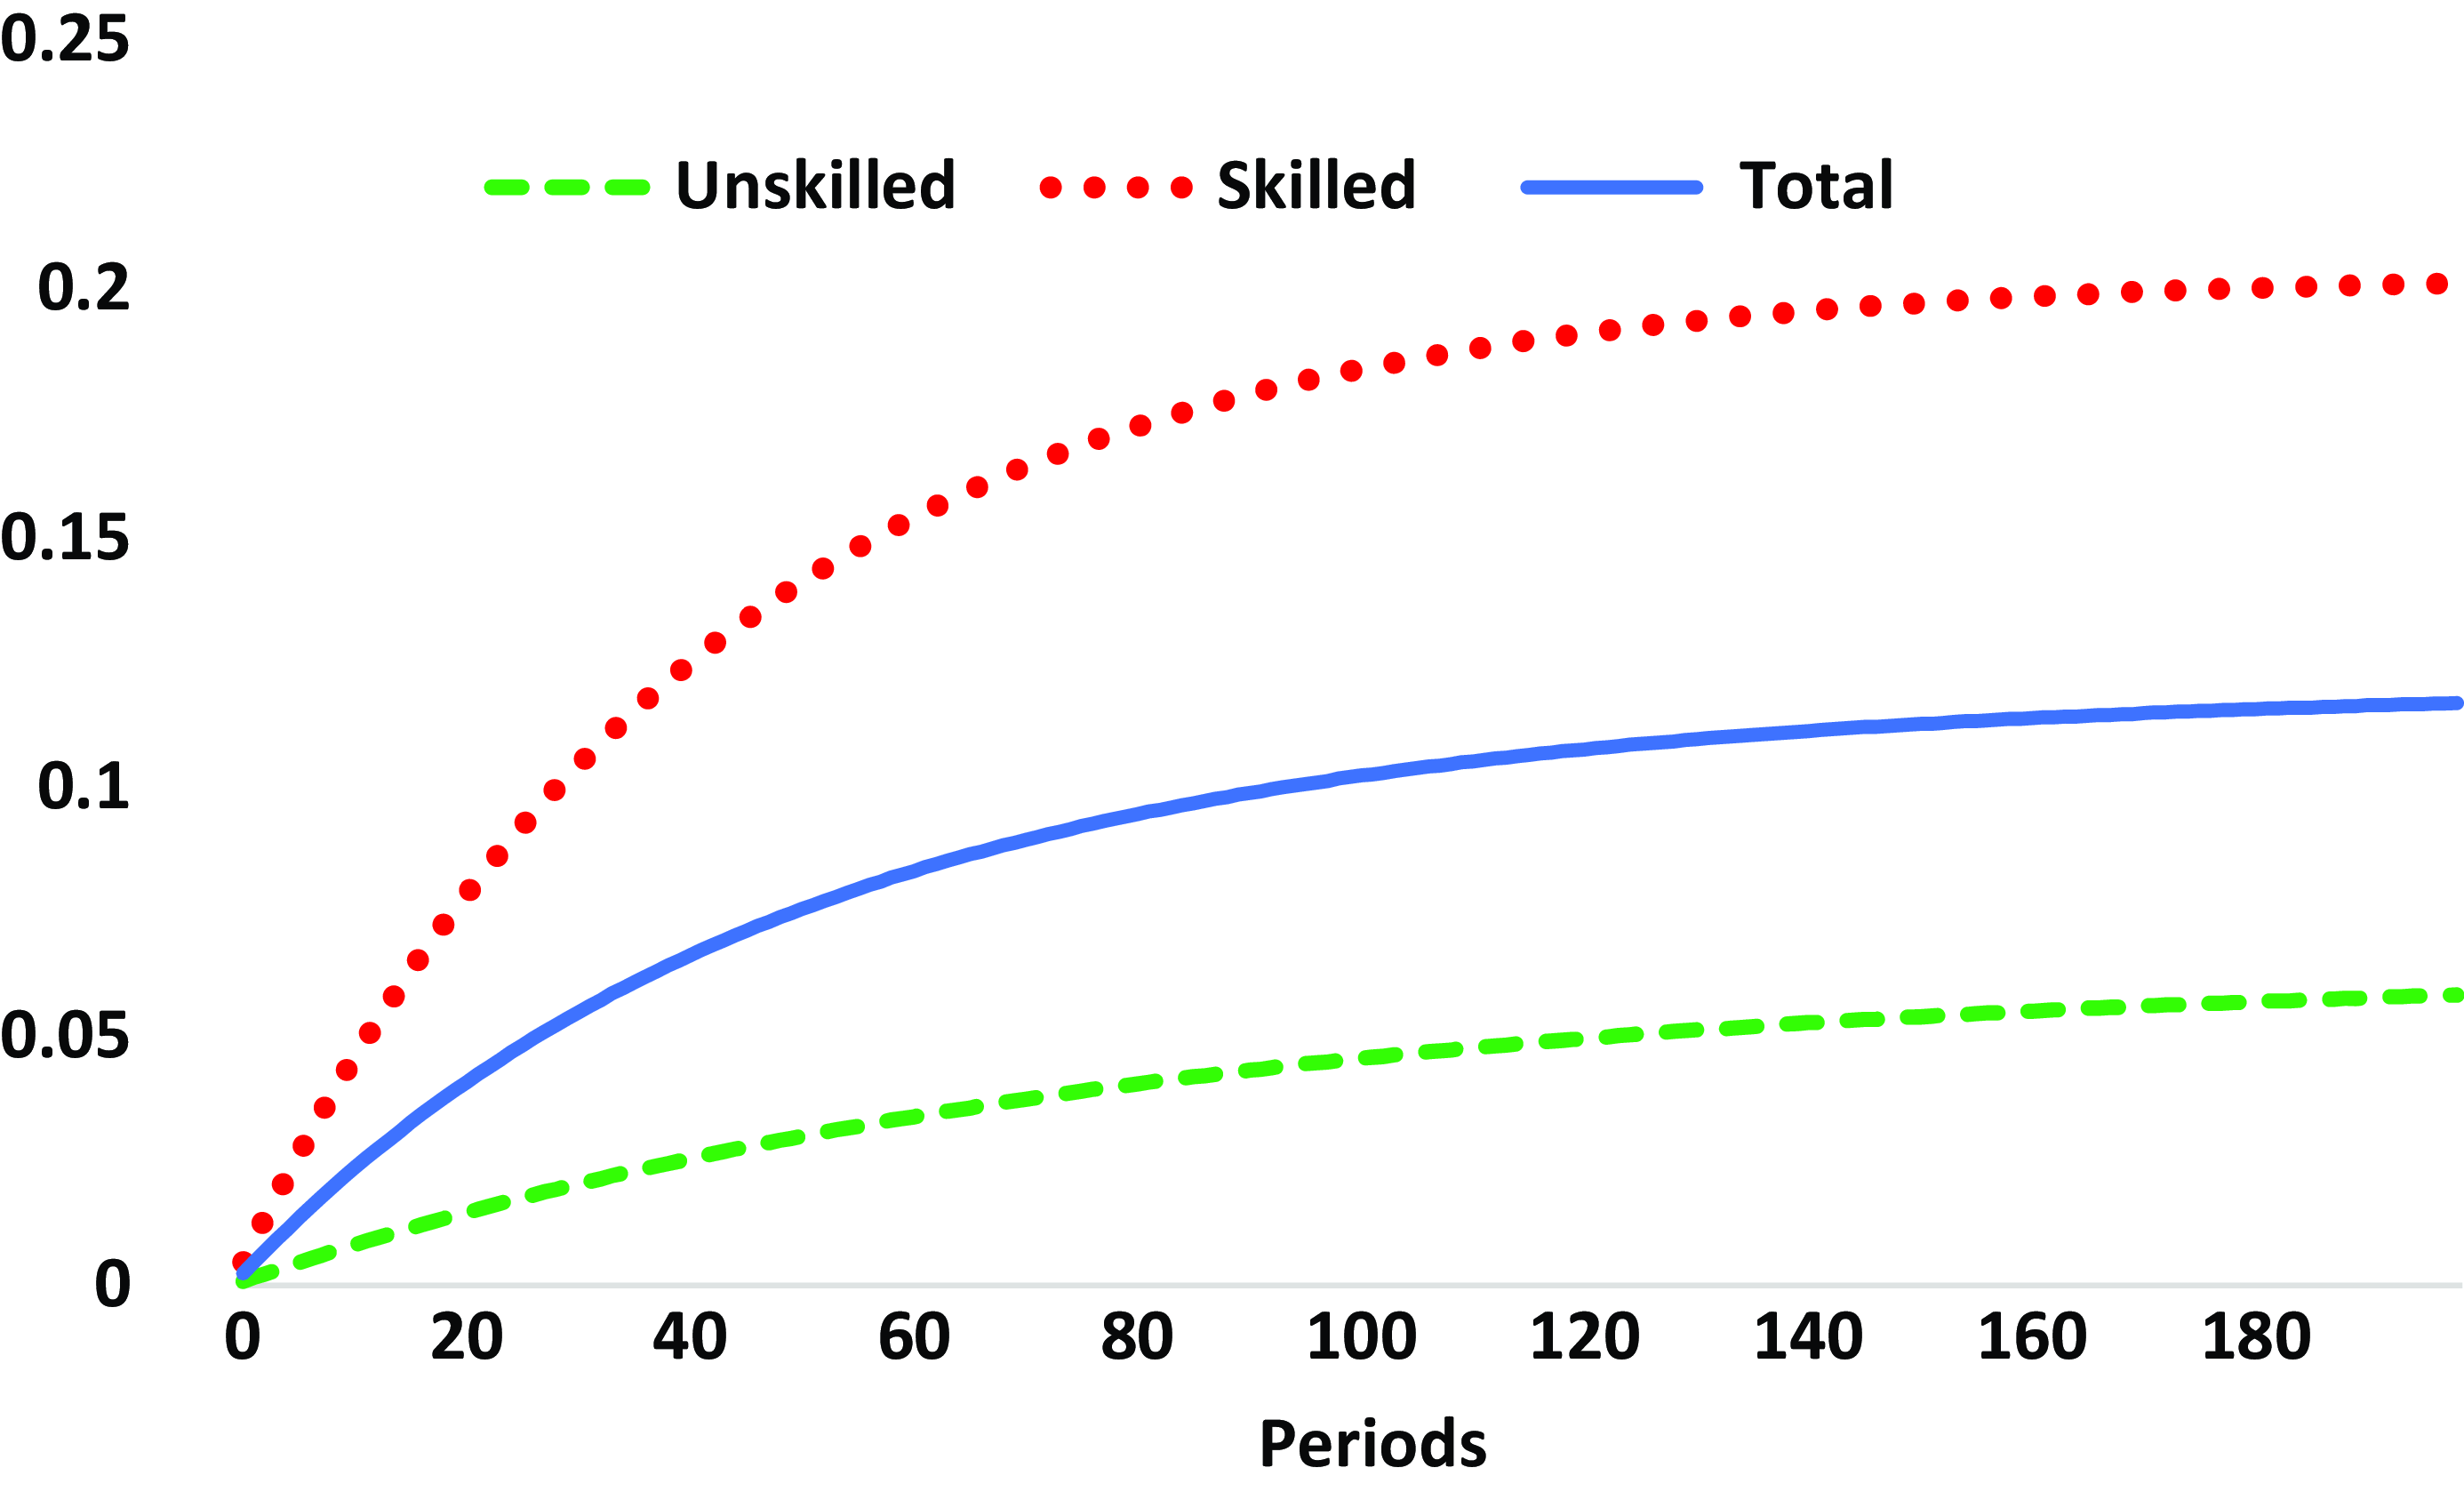
Migration rate in Guatemala (%).

A.3 Policy Intervention
A.3.1 Migration cost
In this section we measure the potential economic effects of a policy intervention based on the migration cost. We assume that the government is able to affect the migration cost directly, it may be through the increase in migration costs, for example. Notice that this policy affects mainly the new migrants since now they have to spend more resources in order to support the new cost.
We consider that the migration cost increases from $0,1$
to
$0,1$
to $0,2$
. The main result of this exercise is that the policy under consideration has small economic effects, as is shown in column a of Table A1. Output decreases marginally and the main effect is on the unskilled migration rate (
$0,2$
. The main result of this exercise is that the policy under consideration has small economic effects, as is shown in column a of Table A1. Output decreases marginally and the main effect is on the unskilled migration rate ( $35\%$
reduction). The reason behind this result is that this policy affects mainly middle-income households which may find that migration is not optimal anymore after the increase of the migration cost.
$35\%$
reduction). The reason behind this result is that this policy affects mainly middle-income households which may find that migration is not optimal anymore after the increase of the migration cost.
This policy, has small aggregate effects and it does not prevent brain drain at all. Given that the most affected are poor agents, this policy is better suited to preventing migration in general. When the migration cost increases to $1,0$
, for example, there are few new migrants, most of them are skilled and the aggregate outcomes are similar to those in the model without migration. Additionally, the model is suited to include heterogeneity in the migration policy. Along these lines, an interesting policy analysis would be to allow for skill-specific costs so that the receiving country could conduct immigration policy that affects the costs of one type of workers, but not the other. For instance, the receiving country could lower the skilled migrant entry cost in order to encourage skilled migration. In fact, this type of policy are endogenized in political economy models (Ortega (Reference Ortega2005)).
$1,0$
, for example, there are few new migrants, most of them are skilled and the aggregate outcomes are similar to those in the model without migration. Additionally, the model is suited to include heterogeneity in the migration policy. Along these lines, an interesting policy analysis would be to allow for skill-specific costs so that the receiving country could conduct immigration policy that affects the costs of one type of workers, but not the other. For instance, the receiving country could lower the skilled migrant entry cost in order to encourage skilled migration. In fact, this type of policy are endogenized in political economy models (Ortega (Reference Ortega2005)).
A.3.2 Remittances
We use the model to evaluate the quantitative effects of a shock on remittances. Recall that our model delivers endogenously the monetary value of remittances; however, we assume that the opportunity to send remittances is driven by the economic conditions of the host economy and, from our small economy perspective, this variable cannot be affected directly by the source country’s police maker. We can rationalize our experiment by assuming that the reduction in the probability of remittances is driven by a deep recession in the host economy that forces a reduction in the number of migrants that used to send remittances. While the shock itself may be exogenous to the source country’s policymakers, understanding its effects can inform policy responses. Policymakers may consider implementing measures to diversify the economy, reduce reliance on remittances, or provide support to households vulnerable to fluctuations in remittance inflows. Column b of Table A1 shows the competitive solution delivered by the model when the probability of sending remittances $\pi _{re}$
decreases from
$\pi _{re}$
decreases from $0,30$
to
$0,30$
to $0,15$
, a
$0,15$
, a $50\%$
reduction.
$50\%$
reduction.
In general terms, a reduction in the probability of remittances has negative welfare effects; however, output increases due to aggregate capital gain and the increase in the labor force in efficiency units. The intuition of this result is related with the insurance component of remittances. When remittances probability is one then remittance is a sure event and most of remittances goes to consume and saving decreases. On the other hand, when remittances probability is close to zero households need to insure against this event, increasing savings and consuming less, as the model predicts. In terms of welfare, a reduction in the probability of remittances affects mainly the skilled worker, which is related to the fact that migration is biased toward skilled agents and they are more sensitive to a reduction in the opportunities for remittances.
The observation that the migration opportunity parameter does not significantly affect the average migration rate but does influence the composition of migration towards skilled workers suggests an important policy implication (see column b of Table A1). Specifically, policies that affect the ease or opportunity to send remittances can indirectly influence the composition of migration flows by shaping the incentives for skilled workers to migrate. When the opportunity to send remittances is higher, skilled workers may be more inclined to migrate, as they anticipate being able to send remittances back to their home countries to support their families. Conversely, if barriers to remittance sending increase, skilled migration may be discouraged, as migrants may perceive reduced ability to financially support their households back home. From a policy perspective, this finding suggests that measures aimed at facilitating remittance transfers, such as improving financial infrastructure, reducing transaction costs, or streamlining remittance channels, could indirectly encourage skilled migration.
A.3.3 Migration probability
We compute the quantitative effects of a shock on offers to migrate. The underlying assumption is that the government can influence the migration offer in order to prevent a brain drain. We can also justify the change in migration probability as a policy implemented in the host economy in order to prevent migration; it may be due to a change in migration quotas, for example.
A $50\%$
reduction in offers to migrate generates significant aggregate effects in terms of output, capital and labor, as we show in the column c of Table A1. However, our model predicts that this kind of intervention may not be a good anti-brain drain policy since the migration rate decreases more for unskilled workers than for skilled workers.
$50\%$
reduction in offers to migrate generates significant aggregate effects in terms of output, capital and labor, as we show in the column c of Table A1. However, our model predicts that this kind of intervention may not be a good anti-brain drain policy since the migration rate decreases more for unskilled workers than for skilled workers.
The result that a 50% reduction in migration probability leads to a 35% reduction in the migration rate underscores the pivotal role of migration probability as a primary determinant of migration flows. This finding suggests that factors influencing individuals’ likelihood of receiving migration offers or opportunities play a substantial role in shaping migration decisions. In comparison, the impact of changes in migration cost on migration rates is also notable, albeit with somewhat smaller effects compared to changes in migration probability. A 100% increase in migration cost leads to a 15,5% reduction in the migration rate, with a greater impact on unskilled migration. This finding suggests that while migration cost is an important consideration for individuals contemplating migration, its influence on migration decisions may be somewhat less pronounced compared to factors related to migration probability. Furthermore, the differences in brain drain effects resulting from changes in migration probability versus migration cost underscore the importance of understanding the implications of different policy interventions.
Despite the potential economic impact, implementing policies to directly influence migration offers may face practical challenges. In particular, the source country government may have limited ability to control migration offers, as they are often driven by factors and events in the host economy. This limitation underscores the complexities involved in formulating and implementing effective anti-brain drain policies.
A.3.4 Return migration
We perform two simulations to identify the effects of return migration.
In the first simulation, we compare the model outcomes between two scenarios: one with return migration and another without it. By comparing the outcomes of these two scenarios, we can discern the economic effects specifically attributable to return migration.
The results of this simulation highlight that while return migration may have some positive effects on the economy, it is not sufficient to completely offset the negative impacts of skilled migration. Specifically, the scenario incorporating return migration yields an output level that is 3.0% higher compared to the model without return migration. However, despite this increase, the output remains below the level observed in the non-migration model. Furthermore, the effects of return migration on wages align with expectations: the policy leads to a decrease in the wage of skilled workers while increasing the wage of unskilled workers. This outcome is consistent with the dynamics of return migration and its influence on the labor market structure (the column (b) of Table 4 shows the solution without return migration and the column (c) shows the solution with return migration).
In the second simulation, we examine the impact of return migration brain gain by computing the return migration solution without considering the human capital gain of return migrants ( $\zeta = 0$
). In this case, return migrants receive only return migration transfers without any adjustment to their human capital or skills. The results of the simulation reveal that when the brain gain of return migrants is negligible (i.e.
$\zeta = 0$
). In this case, return migrants receive only return migration transfers without any adjustment to their human capital or skills. The results of the simulation reveal that when the brain gain of return migrants is negligible (i.e. $\zeta = 0$
), the return migration rate decreases substantially to around 1,5%, compared to the 15% observed in the baseline scenario. This indicates that without the prospect of gaining human capital upon return, the incentive for migrants to return diminishes significantly. Furthermore, this result underscores the potential significance of our assumption regarding the exogenous and costless nature of human capital accumulation in the host economy. This assumption may play a crucial role in shaping the model’s predictions regarding return migration dynamics and its associated economic effects.
$\zeta = 0$
), the return migration rate decreases substantially to around 1,5%, compared to the 15% observed in the baseline scenario. This indicates that without the prospect of gaining human capital upon return, the incentive for migrants to return diminishes significantly. Furthermore, this result underscores the potential significance of our assumption regarding the exogenous and costless nature of human capital accumulation in the host economy. This assumption may play a crucial role in shaping the model’s predictions regarding return migration dynamics and its associated economic effects.
Indeed, while the model’s predictions regarding return migration effects may be modest in average developing economies, their significance can vary depending on specific contextual factors. In economies with a limited initial stock of human capital, the impacts of return migration could be amplified. Returning migrants may reintegrate into the workforce with valuable skills and experiences acquired abroad, thereby bolstering the country’s human capital. Moreover, if return migration policies offer attractive incentives, such as opportunities for career advancement, access to resources, or favorable living conditions, they may effectively encourage a greater number of skilled individuals to return to their home country. In such contexts, the combined effects of remittances and return migration could indeed offset the adverse impacts of skilled migration, contributing to overall welfare improvements and sustainable economic advancement. By strategically leveraging the human capital brought back by returning migrants, return migration may contribute to the overall development and growth of the economy.
A.4 Robustness Analysis
We perform sensitivity analysis over 5 parameters. For each parameter considered— $\chi$
,
$\chi$
, $\eta$
,
$\eta$
, $\delta$
,
$\delta$
, $\rho$
, and the correlation between household members’ productivity shocks
$\rho$
, and the correlation between household members’ productivity shocks $\rho _{v}$
—we explore two additional values: one higher and one lower than the baseline value.
$\rho _{v}$
—we explore two additional values: one higher and one lower than the baseline value.
The parameters of the production function are key drivers of the capital-skill complementarity and the income inequality in the source economy. Four parameters characterize the production function ( $\eta, \delta, \gamma$
, and
$\eta, \delta, \gamma$
, and $\rho$
) and according to the simulations they have strong effect on prices (the interest rate, and skilled and unskilled wages) as well as in the income inequality. However, since the model economy is populated by heterogeneous households, the parameters have a key role in aggregated variables but small effects in terms of the population with incomes around the migration cost. Thus, a reasonable change in parameters has small effects in terms of migration and brain drain as Tables A4 and A5 shows.
$\rho$
) and according to the simulations they have strong effect on prices (the interest rate, and skilled and unskilled wages) as well as in the income inequality. However, since the model economy is populated by heterogeneous households, the parameters have a key role in aggregated variables but small effects in terms of the population with incomes around the migration cost. Thus, a reasonable change in parameters has small effects in terms of migration and brain drain as Tables A4 and A5 shows.
Robustness analysis: Solution of the model with return migration for different values of production function parameters

Note: The baseline is the solution of the model with return migration. $\chi$
and
$\chi$
and $\eta$
are share parameters.
$\eta$
are share parameters.
Robustness analysis: Solution of the model with return migration for different values of production function parameters
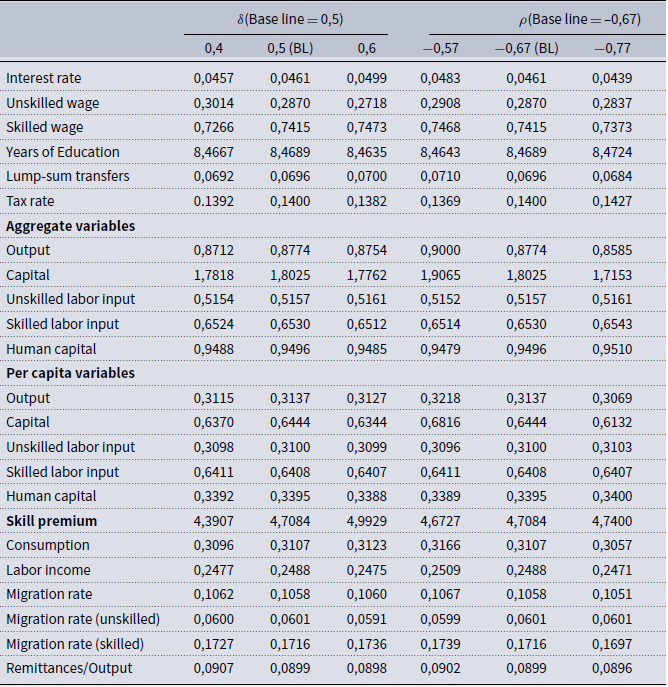
Note: The baseline is the solution of the model with return migration. $\delta$
and
$\delta$
and $\rho$
are related with substitution elasticities.
$\rho$
are related with substitution elasticities. $\chi$
takes three values in the sensitivity analysis: 0,75, 0,80, and 0,86. The strongest effect of changing this share parameter is over the income inequality since it affects the marginal productivity of skilled and unskilled workers. A high
$\chi$
takes three values in the sensitivity analysis: 0,75, 0,80, and 0,86. The strongest effect of changing this share parameter is over the income inequality since it affects the marginal productivity of skilled and unskilled workers. A high $\chi$
increases skilled wages and reduces unskilled wages and given the high inequality the average wage (labor income) decreases as well as the migration rates. However, as Table A4 shows, the migration rate change due to
$\chi$
increases skilled wages and reduces unskilled wages and given the high inequality the average wage (labor income) decreases as well as the migration rates. However, as Table A4 shows, the migration rate change due to $\chi$
changes is small (-0,8%) for a significant increase of
$\chi$
changes is small (-0,8%) for a significant increase of $\chi$
(from 0,75 to 0,86). Another key share parameter is
$\chi$
(from 0,75 to 0,86). Another key share parameter is $\eta$
, and according to the production function it plays an important role in the interest rate. In this case an increase in
$\eta$
, and according to the production function it plays an important role in the interest rate. In this case an increase in $\eta$
(from 0,4 to 0,6) increases the interest rate and changes the relative prices at the aggregate level, however, the migration rate change due to eta changes is small (–1,0%) as Table A4 show.
$\eta$
(from 0,4 to 0,6) increases the interest rate and changes the relative prices at the aggregate level, however, the migration rate change due to eta changes is small (–1,0%) as Table A4 show.
The sensitivity analysis conducted on the parameters governing capital-skill complementarity ( $\delta$
and
$\delta$
and $\rho$
) reveals that changes in these parameters lead to expected effects, albeit with relatively small impacts on brain drain. When the correlation coefficient
$\rho$
) reveals that changes in these parameters lead to expected effects, albeit with relatively small impacts on brain drain. When the correlation coefficient $\rho$
is increased, indicating a higher degree of complementarity between capital and skilled labor, the elasticity of substitution between these factors rises as well, resulting in an increased skill premium. Similarly, reducing the parameter
$\rho$
is increased, indicating a higher degree of complementarity between capital and skilled labor, the elasticity of substitution between these factors rises as well, resulting in an increased skill premium. Similarly, reducing the parameter $\delta$
yields similar outcomes, enhancing the skill premium. However, despite these changes in the economic landscape, the effects on migration rates and skilled migration remain relatively minor, as illustrated in Table A5. This suggests that while capital-skill complementarity does influence certain aspects of the model’s outcomes, its impact on brain drain is not as substantial as other factors.
$\delta$
yields similar outcomes, enhancing the skill premium. However, despite these changes in the economic landscape, the effects on migration rates and skilled migration remain relatively minor, as illustrated in Table A5. This suggests that while capital-skill complementarity does influence certain aspects of the model’s outcomes, its impact on brain drain is not as substantial as other factors.
The sensitivity analysis reveals that the correlation of productivity shocks between household members has a relatively small impact on migration and brain drain, which consequently translates into minor effects on human capital, GDP, and other economic indicators (see Table A6). Without the correlation of productivity shocks between household members, the average household income in the country of origin decreases slightly, from 0,249 in the baseline calibration to 0,240 in the model without correlation of intrafamily shocks. This reduction in household income leads to a slightly higher migration rate, increasing from 10,6% to 11,1%. The positive effect of productivity correlation between household members on household income is attributed to the fact that favorable productivity shocks to one household member tend to induce similar shocks to other household members. Consequently, higher correlation of shocks between household members generally results in higher income and lower migration, as the cost of migration is relatively small on average. While the correlation of shocks between household members may not be a primary determinant of migration and brain drain, its inclusion in the model helps capture the observed correlation of income between household members in empirical data.
Solution of the model with changes in the correlation between household member’s productivity shock $\rho _{v}$

Note: We compare the return migration model with the model with no migration for different values of the correlation $\rho _{v}$
.
$\rho _{v}$
.


 Open access