

1. Introduction and background
Rare diseases, or orphan diseases, collectively affect millions of individuals worldwide. There currently exists an estimated 6000–8000 rare diseases, 75% of which affect children. An estimated 30 million people in the United States and 30 million in the European Union are diagnosed with a rare disease. A total of 30% of affected individuals die before 5 years of age. In the United States, rare disease is defined as a condition that affects fewer than 200,000 people. Historically, the low incidence and prevalence of these diseases have presented major challenges to the development of diagnostics and treatments (http://rarediseases.info.nih.gov/).
The increasingly widespread use of NGS technologies has revolutionized the study of rare diseases, of which 80% have genetic etiologies (Yaneva–Deliverska, Reference Yaneva–Deliverska2011). For Mendelian disorders, sequencing enables researchers to understand specific diseases in great detail and informs the development of new treatments. Between 2007 and 2014, the number of disease phenotypes with characterized genetic causes has more than doubled (Koboldt et al., Reference Koboldt, Steinberg, Larson, Wilson and Mardis2013). Whole-exome sequencing (WES) and whole-genome sequencing (WGS) strategies allow researchers to study a wide range of diseases through a common work flow.
With NGS in place as an effective tool for the study of rare diseases, coordinated research efforts play a significant role in advancing research (Griggs et al., Reference Griggs, Batshaw, Dunkle, Gopal-Srivastava, Kaye, Krischer, Nguyen, Paulus and Merkel2009). The first systematic effort to address rare disease in the United States began with the Orphan Drug Act of 1983 (Orphan Drug Act, 2049 vols, United States of America, 1983). This legislation, administered by the FDA Office of Orphan Products Development (OOPD), created incentives for the development of drugs that specifically targeted rare diseases. Additionally, the Orphan Drug Act allowed for the repurposing of available drugs originally indicated for other conditions. Since this legislation was enacted, more than 300 drugs have been developed to treat rare diseases (Griggs et al., Reference Griggs, Batshaw, Dunkle, Gopal-Srivastava, Kaye, Krischer, Nguyen, Paulus and Merkel2009). Many more organizations now exist for the purpose of advancing rare disease research, including the Undiagnosed Disease Program (NIH) and the International Rare Disease Research Consortium (Danielsson et al., Reference Danielsson, Mun, Lordemann, Mao and Lin2014). Moving forward, the study of rare diseases will require the coordination of technological advances, institutional collaboration and financial resources.
The development of rare disease research can be described as a “long-tailed” problem. Originally developed to understand the rise of internet retailers, long-tail concepts broadly describe the challenges of organizing and accessing disparate collections of items. We believe these economic concepts are helpful for understanding the recent advances and challenges of rare disease research. In this article, we will first provide a discussion of the long tail and its applicability to this field. We will then review the impact of the latest advances in NGS technology and research infrastructure.
2. Rare disease as a long-tailed problem
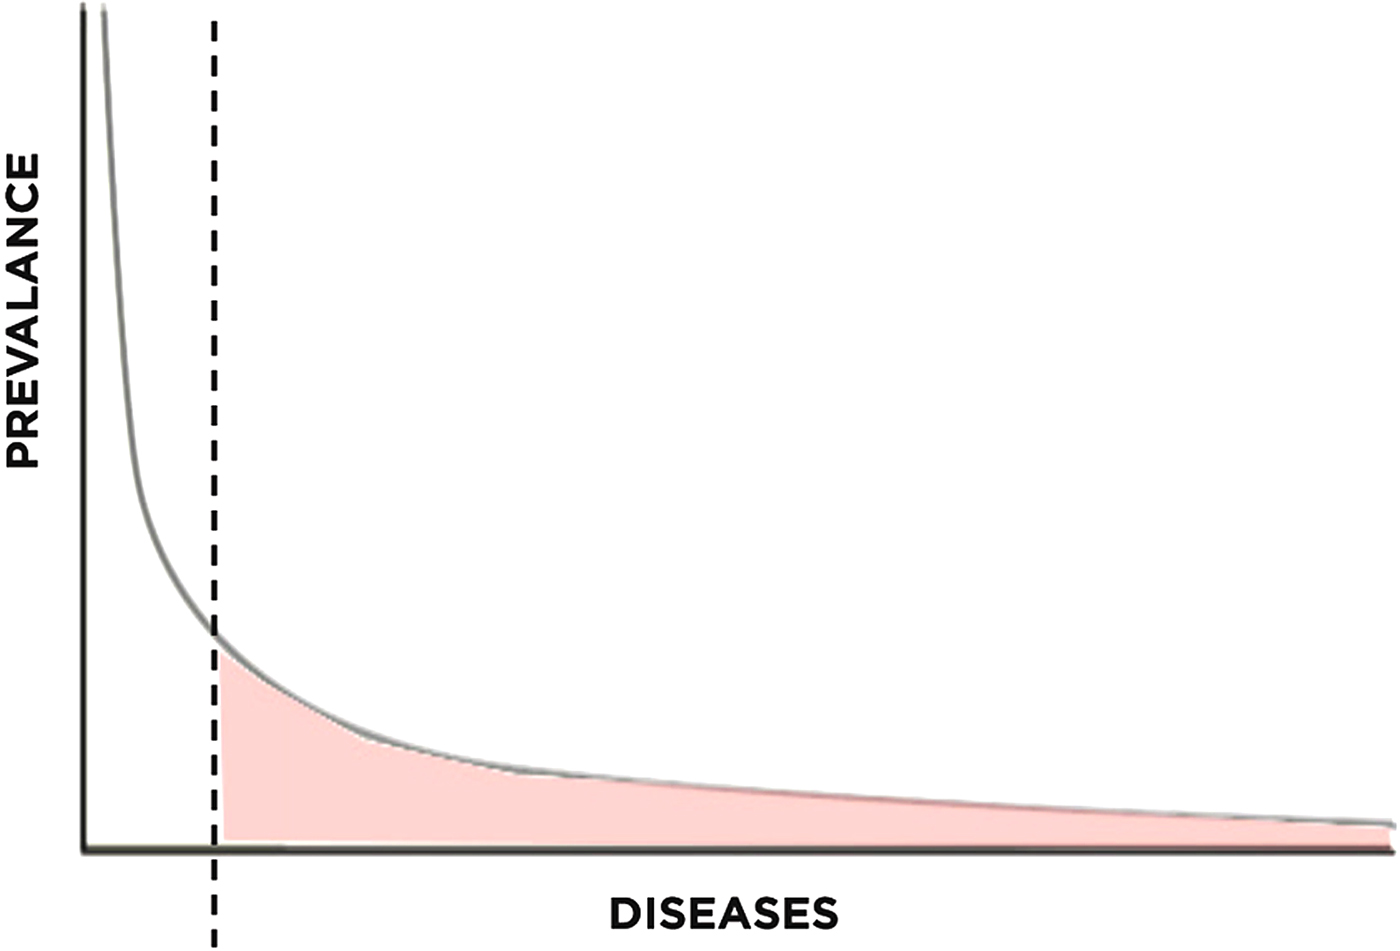
To understand the relevance of long-tail economics in the context of rare disease research, we must first examine its emergence. The long-tail concept has recently gained attention for its usefulness in understanding the recent success of internet-based retailers. In business, the Pareto model (or 80-20 rule) describes how roughly 20% of products typically account for 80% of income, serving as a reasonable estimate of the relationship between products and revenue (Pareto & Busino, Reference Pareto and Busino1964; Arnold, Reference Arnold2004; Anderson, Reference Anderson2006) (Fig. 1). For example, out of all the films produced by the entertainment industry, only a handful of blockbusters account for the majority of revenue generated. The lesser known films, though greatly outnumbering the blockbusters, generate far less revenue per film. This principle is generalizable to numerous other industries as well.
Pareto distribution with long tail highlighted.
The success of these companies may be understood within the framework of supply and demand. On the supply side, centralized warehouses or servers significantly decrease the cost of maintaining a large library of niche products. While brick-and-mortar stores need to carefully stock items based on their popularity, centralized supply chain management allows for economically justifiable stocking of niche products. On the demand side, improved search and prediction algorithms not only allow businesses to tap into existing demand for niche products, but also generates new demand based on the individual consumer's tastes. In addition, increased efficiency from electronic payment systems decrease the transactional costs of selling niche items to economically feasible levels (Bakos, Reference Bakos1998). Taken together, these forces “open up” the long tail for business, connecting consumers to a previously inaccessible body of products.
For the purposes of this article, we derive two themes from the technologies outlined above: increased access and reduced cost. Increased access refers to the ability of search algorithms to guide the consumer through a sea of products in the long tail and find what they are looking for. Reduced cost refers to the facilitation of online transactions or reduction in overhead costs by centralizing resources.
In the context of rare Mendelian disease research, access and cost summarize two of the greatest challenges facing the field today – challenges that are being overcome by NGS technologies. The principles derived from long-tail economics shape our understanding of the recent development of this field and offer insight towards needed improvements. Traditional research has focused on the 20% of genetic conditions that account for 80% of disease, neglecting the remaining 80% of genetic conditions that account for a nontrivial 20% of disease. Long-tail concepts illustrate that the demand for this 20% of disease is significant; opening up this long tail will require integrated technological, organizational and financial solutions.
3. The impact of next-generation sequencing
(i) Participant selection
NGS for rare diseases begins with selecting the participants who will be sequenced. From a macroscopic perspective, changes in participant selection occur on two axes: group/individual and research/clinical (Fig. 2). Here, we overview the shifts in participant selection and propose that the field needs to move towards an individually-initiated and clinically-oriented mode of determining candidates for sequencing.
Participant selection for genome sequencing. The x-axis describes decision-making for participant selection. The y-axis describes the purpose of sequencing the participant in question.

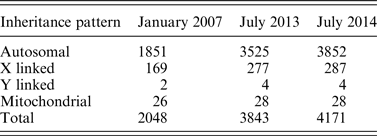
Before NGS, researchers relied on methods such as chromosomal linkage association within families to identify Mendelian diseases (Ku et al., Reference Ku, Naidoo and Pawitan2011). This type of study would be placed in the lower left quadrant of Fig. 2 as a research focused endeavor with data restricted to the investigators. Early genomic studies such as micro-array-based genome-wide association studies (GWAS) also fall into the same quadrant, with notable examples such as the Wellcome Trust Consortium study that examined 14 000 cases of common diseases (Wellcome Trust Case Control Consortium, 2007). These studies are often large-scale projects involving one or more research centers. Participant selection depended upon the research aims of the project, allowing only suitable candidates to undergo genome sequencing. For rare diseases, the prevalence may be too low for large studies. De novo mutations may also occur in unrelated individuals. Thus, the decision of who can be sequenced needs to shift from research groups to individual patients in order to better focus research efforts on a broader number of rare diseases (Fig. 2). This movement requires new research criteria that can accommodate low sample sizes, unrelated patients and the opportunity to provide more patients with genomic sequencing.NGS has enabled investigators to identify a large number of disease-causing genes. Table 1 shows the number of entries in the Online Mendelian Inheritance in Man (OMIM) database for which the molecular basis of a particular phenotype is known. Between 2007 and 2014, the number of entries more than doubled, with 428 new entries added between 2013 and 2014. The investigators sequenced the exomes of four patients to identify DHODH as a candidate gene and later confirmed this finding in three other families by Sanger sequencing. Because NGS enables researchers to discover disease-causing genes from such small sample sizes, the threshold for offering sequencing for affected patients has decreased dramatically. However, these studies still depend on research initiatives and are limited by the logistical challenge of connecting patients to studies.
The number of OMIM phenotypes for which the molecular basis is known since 2007 (Koboldt et al., Reference Koboldt, Steinberg, Larson, Wilson and Mardis2013; Online Mendelian Inheritance in Man).
In addition to the shift from group to individual decisions, participant selection for rare disease research must also shift from being research focused to clinically focused. This movement will eventually lead to readily available established clinical tests for rare diseases based on NGS (Boyd, Reference Boyd2013). Currently, NGS is not regularly used as a primary diagnostic tool. However, as the number of discovered gene–phenotype associations increase, clinicians will be more likely to diagnose patients based on their sequencing data, blurring the line between research and clinical genetic testing (Boycott et al., Reference Boycott, Vanstone, Bulman and MacKenzie2013; Delanty & Goldstein, Reference Delanty and Goldstein2013). Already, clinicians have used NGS as a supplementary diagnostic tool in limited contexts. Exome sequencing has been used to diagnose congenital chloride diarrhea in a cohort of patients suspected to have Bartter syndrome (Choi et al., Reference Choi, Scholl, Ji, Liu, Tikhonova, Zumbo, Nayir, Bakkaloğlu, Ozen, Sanjad, Nelson-Williams, Farhi, Mane and Lifton2009). In this particular case, all six patients were found to have a deletion in SLC26A3, a chloride anion exchanger, leading to the first ever diagnosis based on exome sequencing (Rizzo & Buck, Reference Rizzo and Buck2012). Exome sequencing has also been used to diagnose a child presenting with inflammatory bowel disease with a mutation in X-linked inhibitor of apoptosis protein (XIAP) (Worthey et al., Reference Worthey, Mayer, Syverson, Helbling, Bonacci, Decker, Serpe, Dasu, Tschannen, Veith, Basehore, Broeckel, Tomita-Mitchell, Arca, Casper, Margolis, Bick, Hessner, Routes, Verbsky, Jacob and Dimmock2011). In this particular case, finding this mutation led clinicians to perform a haematopoetic progenitor cell transplant because mutations in XIAP increase risk of death due to haemophagocytic lymphohistiocytosis. The decision to perform this invasive yet ultimately effective procedure would not have been made without NGS.
We have focused our attention thus far on rare Mendelian diseases. However, we must remember that there remain many other diseases for which NGS does not drive a similar degree of change. Figure 3 highlights the segment of diseases particularly suited for NGS-based research. For the patients in the starred area, NGS is driving a trend towards clinically-oriented testing initiated by the patient.
Overview of disease qualities. The starred region represents diseases most likely to benefit from genomic sequencing.

Genetic testing has a long history prior to the development of NGS. First generation Sanger sequencing, still considered the gold standard for accuracy, has long been used for single-gene studies. Examples include BRCA1 and BRCA2 testing for women with family histories of breast cancer (Wooster et al., Reference Wooster, Bignell, Lancaster, Swift, Seal, Mangion, Collins, Gregory, Gumbs and Micklem1995; Nelson et al., Reference Nelson, Huffman, Fu and Harris2005). Gene panels build upon the single-gene study by testing for multiple candidate genes at once. The ability to efficiently sequence for hundreds of candidate genes produced a large number of GWAS studies. Clinically, more and more institutions and companies offer gene panels for cancer patients in order to generate a more precise genetic profile. For rare diseases, the GWAS study approach is severely limited because there must be a known candidate gene to target. Additionally, most GWAS studies followed a case-control study design in which conclusions were based on genetic differences between the case and control groups. An association between a mutation and a disease could only be made with large enough sample sizes. This type of classical epidemiological study design is unfeasible with rare disease research due to an inherent lack of available research subjects. NGS-based research instead relies on a number of bioinformatic strategies to correctly identify rare variants within a small sample size (Boyd, Reference Boyd2013). Examples of these statistical methods include the burden test and variance-component test, which are reviewed in greater depth by Lee et al. (Reference Lee, Abecasis, Boehnke and Lin2014).
WES has dominated rare disease research in recent years. Compared to WGS, exome sequencing covers only the 1% (~30Mb) of the genome that is translated into protein (Bamshad et al., Reference Bamshad, Ng, Bigham, Tabor, Emond, Nickerson and Shendure2011). Compared to WGS, WES offers a significantly more cost-effective and time-effective method of collecting and analyzing genomic data. Ng et al. first sequenced the exomes of 12 individuals with Freeman-Sheldon syndrome (OMIM 193700) in order to demonstrate the feasibility of exome sequencing as a method, identifying rare and common variants in both related and unrelated individuals (Ng et al., Reference Ng, Turner, Robertson, Flygare, Bigham, Lee, Shaffer, Wong, Bhattacharjee, Eichler, Bamshad, Nickerson and Shendure2009). The same investigators later used this method to identify DHODH as the causative gene for Miller syndrome (OMIM 263750) and MLL2 for Kabuki syndrome (OMIM 147920) (Ng et al., Reference Ng, Bigham, Buckingham, Hannibal, McMillin, Gildersleeve, Beck, Tabor, Cooper, Mefford, Lee, Turner, Smith, Rieder, Yoshiura, Matsumoto, Ohta, Niikawa, Nickerson, Bamshad and Shendure2010 a ; Ng et al., Reference Ng, Buckingham, Lee, Bigham, Tabor, Dent, Huff, Shannon, Jabs, Nickerson, Shendure and Bamshad2010 b ). Interestingly, the initial analysis for the Kabuki syndrome study did not reveal any candidate genes. Due to the phenotypic heterogeneity of Kabuki syndrome, the investigators accounted for phenotypic severity by assigning a qualitative score to each patient based on physical features of the disease. After factoring this score into the analysis, MLL2 emerged as the sole candidate gene (Ng et al., Reference Ng, Bigham, Buckingham, Hannibal, McMillin, Gildersleeve, Beck, Tabor, Cooper, Mefford, Lee, Turner, Smith, Rieder, Yoshiura, Matsumoto, Ohta, Niikawa, Nickerson, Bamshad and Shendure2010 a ). These classic examples look for shared mutations between unrelated individuals. Other examples of this strategy include the identification of SETB1 for Schinzel-Giedion syndrome (OMIM 269150) and ASXL1 for Bohring-Opitz syndrome (OMIM 605039) (Hoischen et al., Reference Hoischen, van Bon, Gilissen, Arts, van Lier, Steehouwer, de Vries, de Reuver, Wieskamp, Mortier, Devriendt, Amorim, Revencu, Kidd, Barbosa, Turner, Smith, Oley, Henderson, Hayes, Thompson, Brunner, de Vries and Veltman2010; Hoischen et al., Reference Hoischen, van Bon, Rodríguez-Santiago, Gilissen, Vissers, de Vries, Janssen, van Lier, Hastings, Smithson, Newbury-Ecob, Kjaergaard, Goodship, McGowan, Bartholdi, Rauch, Peippo, Cobben, Wieczorek, Gillessen-Kaesbach, Veltman, Brunner and de Vries2011). Investigators have also successfully used other strategies of interpreting exome sequencing data to identify disease-causing genes. A summary of these other strategies are reviewed by Boyd (Reference Boyd2013) and Koboldt et al. (Reference Koboldt, Steinberg, Larson, Wilson and Mardis2013).
Though exome sequencing has proven to be a productive study method, these studies do not cover the remaining 99% of the genome which is non-coding. The NIH-curated catalog of GWAS studies shows that the majority of GWAS loci lie in non-coding regions (Hindorff et al., Reference Hindorff, Sethupathy, Junkins, Ramos, Mehta, Collins and Manolio2009; Lee et al., Reference Lee, Abecasis, Boehnke and Lin2014). In addition, initiatives such as the ENCODE Project are beginning to elucidate the functions of introns (ENCODE Project Consortium, 2012). Thus, WGS holds great potential for discovering disease-causing mutants in regions outside of the exon. The primary barrier to this study method has been its prohibitive cost, though the continuous decreasing cost of NGS has enabled investigators to use WGS to identify disease-causing genes. In 2013, Wang et al. used a combination of WGS and WES to identify mutations in RBCK1 as the cause for a novel Mendelian disease with cardiac and neuromuscular involvement (Wang et al., Reference Wang, Kim, Bradfield, Guo, Toskala, Otieno, Hou, Thomas, Cardinale, Lyon, Golhar and Hakonarson2013). While exome sequencing may be particularly suited to solving known Mendelian diseases for which the genetic aetiology is unknown, the authors claim that the data generated from WGS is more suited to the task of discovering the genetic basis of yet unknown diseases. Another group also used a combination of WGS and WES to identify a frameshift mutation in HMGB3 as the cause for X-linked colobomatous microphthalmia (OMIM 309800) (Scott et al., Reference Scott, Mohr, Kasch, Barton, Pittiglio, Ingersoll, Craig, Marosy, Doheny, Bromley, Roderick, Chassaing, Calvas, Prabhu and Jabs2014). The authors write that the increased coverage generated from multiple orthogonal sequencing methods improved their ability to identify variants over a single-technique approach (Scott et al., Reference Scott, Mohr, Kasch, Barton, Pittiglio, Ingersoll, Craig, Marosy, Doheny, Bromley, Roderick, Chassaing, Calvas, Prabhu and Jabs2014). Enns et al. also used a combination of WGS and WES to identify NGLY-1 deficiency as the cause of a glycosylation disorder found in eight patients in 2014 (Enns et al., Reference Enns, Shashi, Bainbridge, Gambello, Zahir, Bast, Crimian, Schoch, Platt, Cox, Bernstein, Scavina, Walter, Bibb, Jones, Hegde, Graham, Need, Oviedo, Schaaf, Boyle, Butte, Chen, Clark, Haraksingh, Cowan, He, Langlois, Zoghbi, Snyder, Gibbs, Freeze and Goldstein2014). As a side note, this particular study gained significant attention in mainstream media, bringing NGS into the spotlight (Might & Wilsey, Reference Might and Wilsey2014; Mnookin, Reference Mnookin2014). While these studies demonstrate the promise of WGS as a study method, there remain some challenges to routine implementation. An exploratory study to assess the clinical significance of WGS findings revealed that coverage for up to 19% of inherited disease genes were not up to accepted standards (Dewey et al., Reference Dewey, Grove, Pan, Goldstein, Bernstein, Chaib, Merker, Goldfeder, Enns, David, Pakdaman, Ormond, Caleshu, Kingham, Klein, Whirl-Carrillo, Sakamoto, Wheeler, Butte, Ford, Boxer, Ioannidis, Yeung, Altman, Assimes, Snyder, Ashley and Quertermous2014). An assessment of exome sequencing performance revealed that WES could actually capture small variants missed by WGS (Clark et al., Reference Clark, Chen, Lam, Karczewski, Chen, Euskirchen, Butte and Snyder2011).
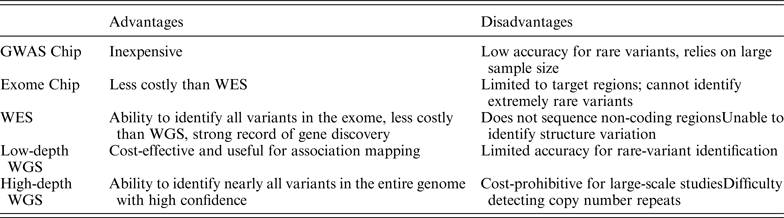
As NGS technologies develop, there will be greater diversity in research methodology. Table 2 provides an overview of various strategies currently in use. There is a general tradeoff between breadth and depth of coverage. The ideal method, high-depth WGS, would cover the entire genome with sufficient depth, but this method is currently cost-prohibitive. The field of rare disease research has generally equilibrated around WES as the most practical balance of breadth, depth and cost. Table 3 summarizes selected studies from 2013–2014 that have identified disease-causing genes for Mendelian disorders using NGS.
Summary of advantages and disadvantages of NGS study methods, adapted from Lee et al. (Reference Lee, Abecasis, Boehnke and Lin2014).
Summary of disease-causing genes identified using NGS, 2013–2014.

(ii) Sample preparation and enrichment
Until WGS becomes a routine genetic test in the laboratory and clinic, there will be a need to selectively enrich target areas of the genome (Mamanova et al., Reference Mamanova, Coffey, Scott, Kozarewa, Turner, Kumar, Howard, Shendure and Turner2010). Enrichment techniques generally fall into two categories: amplification and hybridization-capture. Amplification techniques rely on PCR. Because PCR-based enrichment requires primers, this technique is able to enrich targeted sequences with high specificity. However, this technique does not scale up efficiently as the number of target regions increases. The commercially available RDT1000 (RainDance Technologies) addresses this limitation with a multiplex droplet system. Each microdroplet houses distinct PCR reactions, facilitating parallel enrichment of thousands of target sequences (Tewhey et al., Reference Tewhey, Warner, Nakano, Libby, Medkova, David, Kotsopoulos, Samuels, Hutchison, Larson, Topol, Weiner, Harismendy, Olson, Link and Frazer2009). Amplification techniques are useful for studies in which there are fewer sequencing targets and has been used by clinical laboratories for diagnosis (Valencia et al., Reference Valencia, Pervaiz, Husami, Qian and Zhang2013).
Hybrid-capture methods are the preferred method today for the efficient enrichment of the exome. Genomic DNA is first sheared and the library prepared with appropriate adaptors. Specialized probes then hybridize with target regions. The DNA-probe hybrids may be purified using a solid-phase (microarray) or solution-based method. Today, solution-based systems are the preferred method of exome capture because the procedure can be accomplished using common laboratory equipment. There are three main solution-based systems commercially available today: SeqCap EZ® (Roche NimbleGen), SureSelect® (Agilent Technologies) and TruSeq® (Illumina). Several investigators have analysed the technical performances of each of these systems (Asan et al., Reference Asan, Xu, Jiang, Tyler-Smith, Xue, Jiang, Wang, Wu, Liu, Tian, Wang, Wang, Yang and Zhang2011; Clark et al., Reference Clark, Chen, Lam, Karczewski, Chen, Euskirchen, Butte and Snyder2011; Parla et al., Reference Parla, Iossifov, Grabill, Spector, Kramer and McCombie2011). These kits generally use the same workflow, differing mostly on probe design. The NimbleGen system covers fewer genomic regions, but requires the least amount of coverage to sensitively detect SNPs and small indels. Thus, the NimbleGen system is well suited to research within defined genomic regions. The Agilent and Illumina systems cover more variants than NimbleGen with additional sequencing. Notably, only the Illumina platform is able to enrich untranlated regions (Clark et al., Reference Clark, Chen, Lam, Karczewski, Chen, Euskirchen, Butte and Snyder2011). The platforms available today represent an equilibrium between cost and coverage. As the cost of sequencing continues to decrease, future enrichment systems are likely to focus on wide and high-quality capture of target DNA.
(iii) Sequencing technology
First generation DNA sequencing platforms relied on the Sanger dideoxy method. In the age of NGS, this method retains significant purpose in sequencing predetermined genes with high accuracy. Most NGS studies use Sanger sequencing to confirm the validity of the newly identified candidate gene. The main shortcoming of automated Sanger sequencing is the limited number of fragments that may be sequenced simultaneously.
A number of technologies overcame this challenge to achieve massively parallel sequencing. In general, NGS platforms begin with the preparation of a library of DNA fragments, which are then clonally amplified. Different strategies are then used to determine the sequence of each fragment, which are performed in parallel. The details of NGS platforms are reviewed extensively elsewhere (Shendure & Ji, Reference Shendure and Ji2008; Metzker, Reference Metzker2010; Liu et al., Reference Liu, Li, Li, Hu, He, Pong, Lin, Lu and Law2012; Mardis, Reference Mardis2013). The following section will provide a basic overview of several systems in use today, as well as “third-generation” systems in development.
The Illumina HiSeq and Genome Analyzer platforms use a sequencing-by-synthesis (SBS) strategy. Library fragments are first clonally amplified in oil droplets. The amplified fragments then undergo step-wise elongation using modified fluorescent dNTPs. The dNTPs function as “reversible terminators,” which allow elongation to pause and continue following the addition of a single nucleotide (Bentley et al., Reference Bentley, Balasubramanian, Swerdlow, Smith, Milton, Brown, Hall, Evers, Barnes, Bignell, Boutell, Bryant, Carter, Keira Cheetham, Cox, Ellis, Flatbush, Gormley, Humphray, Irving, Karbelashvili, Kirk, Li, Liu, Maisinger, Murray, Obradovic, Ost, Parkinson, Pratt, Rasolonjatovo, Reed, Rigatti, Rodighiero, Ross, Sabot, Sankar, Scally, Schroth, Smith, Smith, Spiridou, Torrance, Tzonev, Vermaas, Walter, Wu, Zhang, Alam, Anastasi, Aniebo, Bailey, Bancarz, Banerjee, Barbour, Baybayan, Benoit, Benson, Bevis, Black, Boodhun, Brennan, Bridgham, Brown, Brown, Buermann, Bundu, Burrows, Carter, Castillo, Chiara, Catenazzi, Chang, Neil Cooley, Crake, Dada, Diakoumakos, Dominguez-Fernandez, Earnshaw, Egbujor, Elmore, Etchin, Ewan, Fedurco, Fraser, Fuentes Fajardo, Scott Furey, George, Gietzen, Goddard, Golda, Granieri, Green, Gustafson, Hansen, Harnish, Haudenschild, Heyer, Hims, Ho, Horgan, Hoschler, Hurwitz, Ivanov, Johnson, James, Huw Jones, Kang, Kerelska, Kersey, Khrebtukova, Kindwall, Kingsbury, Kokko-Gonzales, Kumar, Laurent, Lawley, Lee, Lee, Liao, Loch, Lok, Luo, Mammen, Martin, McCauley, McNitt, Mehta, Moon, Mullens, Newington, Ning, Ling Ng, Novo, O'Neill, Osborne, Osnowski, Ostadan, Paraschos, Pickering, Pike, Pike, Chris Pinkard, Pliskin, Podhasky, Quijano, Raczy, Rae, Rawlings, Chiva Rodriguez, Roe, Rogers, Rogert Bacigalupo, Romanov, Romieu, Roth, Rourke, Ruediger, Rusman, Sanches-Kuiper, Schenker, Seoane, Shaw, Shiver, Short, Sizto, Sluis, Smith, Ernest Sohna Sohna, Spence, Stevens, Sutton, Szajkowski, Tregidgo, Turcatti, Vandevondele, Verhovsky, Virk, Wakelin, Walcott, Wang, Worsley, Yan, Yau, Zuerlein, Rogers, Mullikin, Hurles, McCooke, West, Oaks, Lundberg, Klenerman, Durbin and Smith2008). As Each dNTP is cycled through, a high-resolution image sensor records fluorescent signals from millions of amplicons simultaneously. This cycle is repeated to generate a sequence for every amplified DNA fragment. The Illumina HiSeq platform has dominated NGS research in recent years.
The Roche/454 platform relies on the detection of pyrophosphate released during nucleotide incorporation. Using a SBS strategy, library fragments are clonally amplified and then elongated one nucleotide at a time. A system of luciferase, luciferin, ATP sulfurylase and adenosine-5-phosphosulfate respond to pyrophosphate release by emitting photons, which are detected by a camera (Liu et al., Reference Liu, Li, Li, Hu, He, Pong, Lin, Lu and Law2012; Valencia et al., Reference Valencia, Pervaiz, Husami, Qian and Zhang2013). Similar to the Illumina platform, each dNTP is cycled through with imaging following each dNTP addition. The pattern of photon emission can then be used to produce sequences for all the amplicons in parallel. The use of this platform has been declining, as Roche announced in 2013 that the 454 sequencing division would be discontinued.
Ion Torrent (Life Technologies) also uses a SBS strategy. Instead of fluorescence or pyrophosphate, the platform uses a pH-sensitive semiconductor to detect proton release following nucleotide incorporation. Library fragments are first amplified on beads and deposited onto a pH sensitive chip. As each dNTP cycles through, the pH sensor detects which amplicons underwent nucleotide incorporation. This technology notably avoids the imaging step used in Illumina HiSeq or Roche/454, enabling significantly shorter run times (Valencia et al., Reference Valencia, Pervaiz, Husami, Qian and Zhang2013).
The ABI/SOLiD platform relies on ligation between DNA library fragments and specially-designed DNA probes. Amplified samples are incubated with single-stranded target DNA which are ligated to fluorescent probes. The system determines sequence based on changes in fluorescence, which are dependent on the ligation pattern of the sample to target DNA (Shendure & Ji, Reference Shendure and Ji2008).
New third-generation sequencing platforms improve upon current NGS technologies in several ways. First, third-generation technologies avoid amplification of library fragments by sequencing single molecules. This reduces biased reading of regions of the genome that were preferentially amplified and also allows for the detection of DNA modifications. Second, third-generation technologies produce significantly longer read lengths (Chin et al., Reference Chin, Alexander, Marks, Klammer, Drake, Heiner, Clum, Copeland, Huddleston, Eichler, Turner and Korlach2013; Mardis, Reference Mardis2013). This decreases our reliance on alignment to a reference genome and enables sequencing of highly repetitive intronic regions. Finally, third-generation technologies have decreased run times, increasing the efficiency of genomic research.
Single-molecule real-time sequencing (SMRT, Pacific Biosciences) uses a system of fluorescent probes to detect nucleotide incorporation by DNA polymerase. The platform produces read lengths in the range of ~5000–6000 bp (English et al., Reference English, Richards, Han, Wang, Vee, Qu, Qin, Muzny, Reid, Worley and Gibbs2012; Chin et al., Reference Chin, Alexander, Marks, Klammer, Drake, Heiner, Clum, Copeland, Huddleston, Eichler, Turner and Korlach2013). Nanopore sequencing (Oxford Nanopore) exhibits similar features, though the technology is currently not widely available. The nanopore platform detects voltage changes across a lipid bilayer as a DNA strand is elongated through an α-haemolysin nanopore (Eid et al., Reference Eid, Fehr, Gray, Luong, Lyle, Otto, Peluso, Rank, Baybayan, Bettman, Bibillo, Bjornson, Chaudhuri, Christians, Cicero, Clark, Dalal, Dewinter, Dixon, Foquet, Gaertner, Hardenbol, Heiner, Hester, Holden, Kearns, Kong, Kuse, Lacroix, Lin, Lundquist, Ma, Marks, Maxham, Murphy, Park, Pham, Phillips, Roy, Sebra, Shen, Sorenson, Tomaney, Travers, Trulson, Vieceli, Wegener, Wu, Yang, Zaccarin, Zhao, Zhong, Korlach and Turner2009). Read lengths fall around 4500 bp (Branton et al., Reference Branton, Deamer, Marziali, Bayley, Benner, Butler, Di Ventra, Garaj, Hibbs, Huang, Jovanovich, Krstic, Lindsay, Ling, Mastrangelo, Meller, Oliver, Pershin, Ramsey, Riehn, Soni, Tabard-Cossa, Wanunu, Wiggin and Schloss2008; Laszlo et al., Reference Laszlo, Derrington, Ross, Brinkerhoff, Adey, Nova, Craig, Langford, Samson, Daza, Doering, Shendure and Gundlach2014).
(iv) Bioinformatics
Bioinformatics refers to the computational processing and analysis of raw sequencing data. Detailed reviews of the NGS bioinformatics pipeline may be found elsewhere (Dolled-Filhart et al., Reference Dolled-Filhart, Lee, Ou-Yang, Haraksingh and Lin2013; Hong et al., Reference Hong, Zhang, Shen, Su, Ning, Han, Perkins, Shi and Tong2013). In this section, we will briefly outline three general steps of bioinformatics analysis: alignment, variant calling and filtering/annotation. We will also discuss the development of cloud-based computational architectures as a strategy to increase efficiency and reduce cost.
The sequencing reads produced by NGS must first be mapped to a reference genome. To accomplish this, algorithms are designed to match fragment sequences with a reference while accounting for variations and errors (Rizzo & Buck, Reference Rizzo and Buck2012; Shang et al., Reference Shang, Zhu, Vongsangnak, Tang, Zhang and Shen2014). This process is computationally intensive. There are two general types of alignment algorithms: hash-table and Burrows-Wheeler Transform (BWT). Examples of hash-table aligners include SeqMap, PASS, MAQ, GASSST, RMAP, PErM, GenomeMapper, BOAT and mrsFAST (Shang et al., Reference Shang, Zhu, Vongsangnak, Tang, Zhang and Shen2014).
Variant calling refers to the process of detecting differences, or variants, between the sample and reference sequences. Variant calling programs must distinguish between sequencing errors and true variants. Single-nucleotide polymorphisms, insertions and deletions are types of variation that may be detected in the sample DNA, each with different computational approaches. Popular programs used to detect SNPs include the Genome Analysis Toolkit (GATK), SOAPsnp and VarScan (Dolled-Filhart et al., Reference Dolled-Filhart, Lee, Ou-Yang, Haraksingh and Lin2013; Hong et al., Reference Hong, Zhang, Shen, Su, Ning, Han, Perkins, Shi and Tong2013). Pindel, dindel and GATK are programs used to detect insertions and deletions (Dolled-Filhart et al., Reference Dolled-Filhart, Lee, Ou-Yang, Haraksingh and Lin2013).
Following the generation of a list of variants, investigators need to identify the variants with a higher likelihood of contributing to disease. Filtering refers to the process of eliminating variants that may be explained by a specific genetic model. This can be accomplished by evaluating the subject's pedigree or comparing the sample sequencing to a normal control. Annotation refers to the process of identifying variants for which the biological function is known. Effective annotation requires the curation of a database of known variants. A list of programs for filtering and annotation may be found in a review by Dolled-Filhart et al. (Reference Dolled-Filhart, Lee, Ou-Yang, Haraksingh and Lin2013).
The rate at which NGS throughput increases far outpaces the increase in computational performance (Schatz et al., Reference Schatz, Langmead and Salzberg2010). In order to handle the increasing volume of data generated by NGS, many investigators have turned to cloud computing architectures. Cloud computing enables efficient distribution of computational resources and allows for parallel work flows. To demonstrate the effectiveness of parallelized programming and cloud computing, Maji et al. modified an aligner to use parallel computations in place of serial ones to decrease execution time by 41% (Maji et al., Reference Maji, Sarkar, Khatua, Dasgupta and Ghosh2014). Investigators at Baylor University and the University of Minnesota have implemented cloud-based bioinformatics workflows, demonstrating increased efficiency and scalability (Onsongo et al., Reference Onsongo, Erdmann, Spears, Chilton, Beckman, Hauge, Yohe, Schomaker, Bower, Silverstein and Thyagarajan2014; Reid et al., Reference Reid, Carroll, Veeraraghavan, Dahdouli, Sundquist, English, Bainbridge, White, Salerno, Buhay, Yu, Muzny, Daly, Duyk, Gibbs and Boerwinkle2014).
(v) Reporting results
The rise in genomic data has produced a need for efficient platforms for data curation and sharing (No authors listed, 2014). While individual journals may have systems for managing published data, there is no central organization managing data between peer-reviewed journals (Tenopir et al., Reference Tenopir, Allard, Douglass, Aydinoglu, Wu, Read, Manoff and Frame2011). There are over 600 subject-specific databases available, indicating probable redundancy between different databases (No authors listed, 2014). As computational methods continue to mature, a consistent system for genomic data will greatly facilitate data sharing. For the study of rare disease, OMIM is one of the most important databases keeping track of discovered genetic causes of Mendelian disorders . The 1000 Genomes Project organizes whole-genome data gathered internationally to serve as a reference for future genomic research (Siva, Reference Siva2008). The NIH manages Gene Expression Omnibus (GEO) and RefSeq as repositories for sequencing data.
The increase in genomic data introduces ethical and legal questions regarding the “ownership” of data. Current regulations prevent investigators from sharing results with research subjects. Gholson Lyon reported being unable to share the results from an NGS study of Ogden syndrome with a participating family, a situation that is detrimental to both the patient and investigator (Lyon, Reference Lyon2012). At least three challenges need to be addressed to improve communication between scientists and patients: logistical feasibility, data quality standards and availability of interventions (Lee & Lin, Reference Lee and Lin2013).
First, reporting results to all participants may be logistically unfeasible for large studies. Researchers and patients need to develop reliable, private and secure means of communication. One way of addressing these challenges would be to develop sophisticated databases that can be accessed only by researchers. While database development may facilitate collaboration between investigators, there remains the issue of patient access to their own research data. Another strategy, patient-centric initiatives, addresses these challenges by allowing patients to determine access to their own research data. This approach depends on the development of specialized information technologies and has shown potential. While this approach shows promise, there needs to be a significant cultural shift in research and clinical practice in order for this concept to become widespread (Kaye et al., Reference Kaye, Curren, Anderson, Edwards, Fullerton, Kanellopoulou, Lund, MacArthur, Mascalzoni, Shepherd, Taylor, Terry and Winter2012).
Second, the results of genomic research need to be held to a standard before they can be communicated to the patient. In the United States, the Clinical Laboratory Improvement Amendments (CLIA) regulates the quality and reliability of laboratory results. Given the rapidly changing nature of sequencing technologies and volume of new discoveries, a new standard is needed to certify actionable data in the context of genomics. In July 2014, the United States Food and Drug Administration (United States Food and Drug Administration, 2014) announced that they would increase their involvement in regulating diagnostic tests. Though some reacted to the announcement with trepidation, it remains to be seen what the impact of increased FDA regulation will be on ensuring the reliability of diagnostic sequencing data (Pollack, Reference Pollack2014).
Because many rare Mendelian disorders do not have interventions available, the availability of treatments must be considered when reporting results to a patient. A survey of patients indicated that 90% would prefer to know all individual results, including those that are unactionable (Kohane & Taylor, Reference Kohane and Taylor2010). A total of 75% reported reduced willingness to participate in studies that do not report all results (Kohane & Taylor, Reference Kohane and Taylor2010). Though no formal guidelines exist for the communication of unactionable test results, informed consent to all tests is crucial (Hunter et al., Reference Hunter, Hopfer, Terry and Coors2012; Lee & Lin, Reference Lee and Lin2013).
Genome sequencing also carries potential for incidental or secondary findings. Unlike unactionable findings, secondary findings may have implications for patient care. In 2013, the American College of Medical Genetics and Genomics (ACMG) published a group of genetic findings that should be reported if found secondarily (Green et al., Reference Green, Berg, Grody, Kalia, Korf, Martin, McGuire, Nussbaum, O'Daniel, Ormond, Rehm, Watson, Williams and Biesecker2013). However, the ACMG acknowledged that this working list is imperfect and likely to change with new data (Green et al., Reference Green, Berg, Grody, Kalia, Korf, Martin, McGuire, Nussbaum, O'Daniel, Ormond, Rehm, Watson, Williams and Biesecker2013). Prior to genetic testing, the patient should be counselled regarding likelihood of secondary findings and the type of results that will be disclosed (ACMG Board of Directors, 2012). In a survey of 200 patients who underwent diagnostic exome sequencing, 93·5% chose to receive secondary results (Shahmirzadi et al., Reference Shahmirzadi, Chao, Palmaer, Parra, Tang and Gonzalez2014). Moving forward, patient preference and better clinical data will continue to guidelines for disclosure of secondary findings.
(vi) Reimbursement
The dramatic decrease in the cost of sequencing has led to changes in the economics of rare disease research. Due to the small number of individuals affected by any particular rare disease, the cost of research has traditionally been a challenge in the field. For-profit organizations in particular face the difficulty of justifying the cost of research given the small return on investment. Government-funded research, though not motivated by profit, must also perform a cost-benefit analysis when awarding grants. Here, we frame the effects of NGS from two perspectives: top-down costs and bottom-up funding. We define top-down costs as the overall cost of research, while bottom-up funding refers to new initiatives to fund the increasing number of potential research projects made possible by NGS.
While the effect of decreasing sequencing costs on the amount of rare disease research is undeniable, there remains some debate on the true cost of sequencing. In 2009, the estimated cost for sequencing a human genome was $100 000. By 2014, Illumina has claimed to reach the $1000 genome threshold (Sboner et al., Reference Sboner, Mu, Greenbaum, Auerbach and Gerstein2011). During this time, thousands of genes underlying Mendelian diseases were discovered, marking an accelerated period of discovery (Table 1). In addition to decreased cost, we see the development of a common workflow for many exome- or genome-sequencing studies. Table 3 shows the recent dominance of the Illumina HiSeq system with Agilent and Roche Nimblegen as popular enrichment platforms. Aided by the availability of commercial kits at each step of the research process, rare disease research can benefit from economies of scale. While the expansion of rare disease research in the nascent years of genomic research is clear, researchers debate how to measure the true cost of sequencing. As sequencing becomes more widespread, new costs such as data management or computationally-intensive analysis will continue to emerge (Sboner et al., Reference Sboner, Mu, Greenbaum, Auerbach and Gerstein2011). Two literature reviews reveal a lack of high-quality economic data and thus the inability to form any conclusions with regard to the cost of expanding genomic research (Frank et al., Reference Frank, Prenzler, Eils and Graf von der Schulenburg2013; Gordon et al., Reference Gordon, Leiman, Deland and Pardes2014).
As a long-tailed problem, continued discovery of rare diseases requires a funding infrastructure that can sustainably support the work needed to identify the great number of rare diseases. Government funding agencies face certain limitations due to its centralized bureaucratic organization. As such, the traditional funding model may not be ideal for rare disease research. The research requirements for a particular patient with a rare disease may not fit well into an existing grant. In these cases, crowdfunding, a model that leverages contributions from interested individuals, offers key advantages. Especially as research funding in the United States decreases, there is an increasing need for alternative funding sources. Just as internet retailers “opened up” the long tail by making niche products available to interested consumers, crowdfunding platforms connect highly-invested individuals to a particular research project. Dragojlovic and Lynd followed five crowdfunding campaigns in 2013, reporting that five out of six met or exceeded their goal (Dragojlovic & Lynd, Reference Dragojlovic and Lynd2014). The Rare Genomics Institute also uses crowdfunding as a key source of financial support for research projects.
4. Concluding remarks
In this article, we reviewed the impact of NGS on the study of rare Mendelian disorders. We identified two trends from long-tail concepts that are useful for describing NGS and rare disease research: increased access and reduced cost. Genome sequencing provides a relatively uniform workflow capable of studying a wide range of genetic diseases. This has led to an expansion of sequencing centers world-wide, providing more patients with access to genome sequencing. Data from these studies are stored and curated on publically accessible databases. The expanding body of identified genes for Mendelian disorders will lead to better diagnostics and will form the basis of new therapies. The cost of sequencing has reduced dramatically since the introduction of NGS. Additionally, the value of a sequenced genome continues to increase as more disease-causing genetic variants are identified. Taken together, it is clear that NGS has revolutionized the study of rare diseases and will continue to do so moving forward.
Declaration of Interest
None.


