


Introduction
In 2020, the EU began debating stricter regulations on cars’ tailpipe emissions as part of new “Euro 7” standards. In response, Volkswagen (VW)—Europe’s largest car manufacturer and a company famous for its history of actively undermining emission rulesFootnote 1—stepped up its lobbying. But instead of lobbying directly, it did so through the European Automobile Manufacturers’ Association (ACEA) and the German Association of Automobile Manufactures (VDA). The company itself made no public statements opposing (or supporting) the proposed legislation. Yet, not all giants of the German car industry refrained from lobbying by themselves. Germany’s largest car parts manufacturer—Robert Bosch GmbH—not only submitted individual responses in public consultations, it also arranged meetings with European policymakers.
What explains VW’s decision to lobby collectively while Bosch lobbied individually? The existing literature on lobbying suggests that both individual and association lobbying have advantages and disadvantages. Association lobbying allows actors to pool resources and can signal a broad coalition in favor of a policy.Footnote 2 At the same time, association lobbying gives companies less control over the exact lobbying position that is taken. As such, companies may prefer to lobby individually to influence the details of a policy in a way that is individually profitableFootnote 3 or when within-industry disagreement on a policy is too high.Footnote 4
Yet, these explanations do not help us understand the example of VW’s and Bosch’s lobbying strategies on air pollution regulations. Both companies have a very high capacity to lobby alone. If anything, in 2020, Volkswagen had a higher capacity to lobby alone than Robert Bosch GmbH, employing more than twice as many lobbyists in its Brussels offices.Footnote 5 In line with this high capacity, Volkswagen does frequently lobby alone. It did so, for example, during the EU’s consultations on a phase-out of internal combustion engines (ICEs) one year later. Industry disagreement also cannot help us understand the choices of Volkswagen and Bosch, as there was no significant disagreement between car manufacturers or car parts manufacturers on Euro 7 regulations. In fact, the European Car Parts Manufacturers Association (CLEPA) lobbied alongside Bosch and took substantively similar positions. Lastly, both car manufacturers and Bosch complained about the costs of adjusting to stricter emission standards in their lobbying.Footnote 6 Thus, differences in positions also cannot account for the difference in strategies. In what follows, I suggest a new explanation for firms’ lobbying strategies, one that has, so far, been largely overlooked in the corporate lobbying literature: reputation.
Maintaining corporate reputation is crucial for many businesses because across the globe, companies’ stakeholders, including investors, workers and consumers, increasingly care about companies’ non-economic conduct, including their lobbying. Firms that want to influence salient policies face the risk of consumer boycotts, recruitment issues, divestment campaigns, and hostile shareholder motions in reaction to unpopular lobbying. I theorize that firms that are vulnerable to such pressures anticipate potential reactions by stakeholders. They do so by adjusting the attributability of their lobbying strategies.
By shifting lobbying that is not aligned with stakeholders’ preferences into collective lobbying by business associations, firms decrease the attributability of their positions and thus its potential reputational costs. Lobbying through associations distributes the blame for lobbying across all association members, thus reducing or eliminating any potential repercussions that would target individual companies. In addition, associations tend to be black boxes for outside observers, making it difficult to attribute an association’s lobbying position to an individual firm. Without a clear attribution of blame, stakeholders are more reluctant to punish individual firms for their positions.
This helps explain Volkwagen’s choice in the opening example. Volkswagen is a publicly listed company and sells to retail consumers. It is, therefore, potentially vulnerable to backlash from these stakeholders. VW opposed stricter Euro 7 regulations as it did not want to invest in new technology to reduce emissions from internal combustion engines. Yet, openly trying to water down regulations aimed at improving air quality would have likely worsened the car maker’s reputation, especially given its previous tailpipe emission scandal. Thus, channeling opposition through business associations was attractive. In contrast, Robert Bosch GmbH is not publicly listed—it is owned by a foundation and the Bosch family—and its car parts arm does not sell directly to retail consumers. Thus, the company does not have to be as worried about stakeholder reactions when formulating lobbying strategies and can lobby individually even when taking an “unpopular” position.
One year later, in 2021, the EU’s consultations on phasing out internal combustion engines (ICEs) highlighted the strategic logic of lobbying while taking a “popular” position. Here, Volkswagen could take a greener position in favor of strict CO2 targets, as the company had set ambitious internal targets for electric vehicles. While the logic presented above makes lobbying through associations a potent tool for obfuscation, it also makes association lobbying a poor strategy for those who want to claim credit for and advertise their popular positions. Therefore, firms with more popular policy preferences will find it in their interest to take lobbying positions individually, as Volkswagen did in the case of the ICE ban.
To test this explanation for the choice between association and firm lobbying, this paper focuses on potential backlash from consumers in the context of climate policy lobbying. I first present evidence from climate-friendliness scores of business and association lobbying across the globe. The theory of this paper suggests that companies vulnerable to consumer pressure strategically choose when to lobby alone or let their association take the lead. If there is disagreement within a consumer-facing industry, the firms with the greener than average position will be more likely to lobby alone, since this may be beneficial to their reputation, while firms with less green than average positions will rely more heavily on their associations. Thus, individual firm lobbying by consumer-facing firms should be greener, on average, than association lobbying. If there is little disagreement within a consumer-facing industry, then firms are more likely to remain silent and just let their association take the lead if the shared policy position is relatively unpopular. Therefore, consumer-facing firms should be more likely to remain silent while associations take less green positions. I confirm both of these predictions drawing on climate lobbying scores provided by the NGO InfluenceMap.
I then test the theory’s underlying assumptions about stakeholders’ reactions to lobbying by drawing on experimental evidence from four countries in the European Union. Using a survey experiment that varies the information on lobbying European consumers receive, I show that the stated willingness to purchase from companies increases in reaction to information that a company lobbied in favor of mitigation policies. In contrast, consumers reduce their stated willingness to purchase from companies that lobbied against mitigation policies. The treatment effects are much smaller if industry associations are described as conducting anti-mitigation lobbying. In such cases, respondents cannot distinguish between individual firms based on the information provided, and therefore cannot switch between companies that provide the same service. Furthermore, respondents do not react to association lobbying by switching to imperfect alternatives outside the sector. The experiment draws on the example of lobbying by airline companies. It demonstrates that respondents do not react to lobbying by an airline association by switching to the imperfect alternative of taking a train instead of flying. Thus, there is little cost to letting the association take the lead on less popular lobbying positions—consumers don’t take the costly action of boycotting an entire product category after learning about association lobbying.
This paper contributes to several key literatures. First, it showcases a hitherto overlooked factor that companies may consider when deciding whether to lobby individually or collectively. Scholars have long argued that public opinion and interest group lobbying interact through so-called “outside lobbying,” where interest groups, including firms, attempt to change public opinion on a policy issue.Footnote 7 I demonstrate that lobbying also changes the public’s perception of companies themselves.
Relatedly, the paper contributes to the collective action literature by highlighting an important function of associations. The foundational literature on collective action disagrees on whether associations need to provide side-payments other than lobbying to retain members,Footnote 8 or whether large members can remain in associations purely for their political function.Footnote 9 The debate hinges on the public-good nature of lobbying. This paper demonstrates that by providing a veil of anonymity, lobbying through an association itself can bring important individual benefits for its members.
Further, the argument presented here provides new insights for the growing literature on climate change in comparative and international political economy. While the existing literature has focused on the direction of firms’ policy positions,Footnote 10 I instead highlight firms’ choice of how to lobby. So far, most studies have focused exclusively either on firms,Footnote 11 or on trade associations.Footnote 12 This approach would only capture the full range of corporate positions if we assume that the preferences of trade associations and firms within a sector are aligned. This paper questions that assumption and calls for an approach that incorporates the systematic, strategic differences between individual and collective lobbying.
Lastly, the evidence on consumers’ reactions to lobbying ties into the literature that examines how political preferences shape citizens’ consumption choices. Prior studies have demonstrated that donations to political partiesFootnote 13 and fair trade practicesFootnote 14 can change consumption patterns. This paper shows that corporate lobbying is another form of companies’ non-economic conduct that can shape consumer decisions.
Previous literature on individual and association lobbying
Business associations are membership organizations, usually funded by member companies’ contributions. One of their core functions is to represent business interests vis-à-vis policymakers. Broadly speaking, there are two competing conceptions of such associations in the collective action literature: First, the by-product theory, as introduced by Olson,Footnote 15 posits that interest groups have to incentivize individuals (or firms) to join with the help of side-payments. Side payments are necessary because the provision of a public good, such as policy change, invites free-riding. However, this problem is less severe in groups with one or a few very large members.
Competing accounts posit instead that interest groups have to pay attention to the demands of their members. MoeFootnote 16 relaxes Olson’s assumptions and allows for members that believe their contribution makes a difference to policy. Individuals or firms might thus join groups for purely political reasons.Footnote 17 Members who joined the group for political reasons must be well-represented in group leaders’ lobbying to secure their continued membership. While lobbyists don’t always accurately represent the position of their interest group,Footnote 18 most accounts of trade associations suggest that they are responsive to their members.Footnote 19
Ultimately, free-riding and politically motivated firms will likely co-exist within business associations. National associations often offer services, such as insurance and consulting, to their members.Footnote 20 Smaller firms benefit disproportionately from these services and often trust associations to represent their political interests. Larger firms, instead, are likely to join for political reasons and actively participate in intra-association policy discussions.
Since large firms tend to have the capacity to lobby alone but can also influence associations’ policy positions, their choice of whether to lobby alone or influence an association from within is non-trivial. Existing work on international trade suggests that firms should prefer to lobby individually if their interests are too diverse,Footnote 21 and when product differentiation means lobbying for a specific tariff or tariff concession is essentially a private good.Footnote 22 The finding that companies lobby individually for private goods is replicated in the literature on other regulation, where a number of studies find that companies that have superior technology or access to relevant capital might lobby for stricter regulations individually.Footnote 23 However, it is not always the case that only the winners of a policy lobby on policy details for private rents. In the EU, for example, proposed policies tend to pass in some form, and most lobbying, including associations’ lobbying, attempts to shape the policy details. Further, private rent can also accrue to the losers of stricter regulation. For example, in climate policy, laggards might individually gain from carbon-price carve-outs or free carbon permits in emissions trading systems.
The literature also presents good reasons why even large firms with diverging interests might prefer to lobby through an association. First, associations may be able to pursue private goods on behalf of their members.Footnote 24 Second, prior evidence suggests that associations can be more successful at influencing policymakers. Bombardini and TrebbiFootnote 25 find that groups that lobby as a trade association obtain higher levels of protection. GründigerFootnote 26 posits that Germany’s entrenched association structure led to less ambitious reduction goals in the EU ETS. BouwenFootnote 27 suggests that in the EU context, European associations can credibly represent the “encompassing European interest,” which makes them powerful actors, especially in the European Parliament.
The coalition literature also identifies numerous benefits to lobbying together. Associations, just like coalitions, allow members to pool resourcesFootnote 28 and to aggregate political intelligence.Footnote 29 Settling disagreements before approaching policymakers will enable groups to signal that they represent a broad set of societal interests.Footnote 30
While each of these theories is helpful in understanding the general calculus of lobbying alone or in groups, they are not sufficient to explain large companies’ strategic choices, especially when these choices differ in similar policy contexts. In the next section, I introduce an as-of-yet unexplored feature of collective lobbying, which can help shed light on this choice: The role of anonymity and distribution of blame in the management of corporate reputations.
A theory of “collective irresponsibility”
Lobbying strategies and public image concerns
The fact that lobbying can mobilize public opinion has long been recognized by the literature on so-called “outside lobbying” or interest groups’ attempts to influence public opinion on a policy issue. In the words of Kollman,Footnote 31 outside lobbying seeks to “mobilize citizens outside the policymaking community to contact or pressure public officials inside the policymaking community.” This tactic is used by businesses and civil society groups alike when it is expected to increase the chances of policy success.Footnote 32
Less studied is how lobbying—be it public outside lobbying or lobbying that is directly targeted at policymakers—affects the public’s opinion of the interest groups themselves. Most interest groups need to be careful about maintaining their own public image. Public-interest groups financed through donations, such as many NGOs, clearly depend on public approval for their existence. Indeed, previous literature shows that public interest groups often choose lobbying strategies that are most likely to improve their public profile.Footnote 33 However, corporate lobbyists also need to pay attention: Companies’ economic success often depends on their reputation with consumers and investors.
This is especially true as stakeholders have become increasingly interested in so-called “corporate social responsibility” (CSR) and environmental, social and governance (ESG) practices. Prior research has shown that high performance in CSR rankings improves companies’ reputation with the public.Footnote 34 Recent public opinion research on retail investors, defined as non-professional individual investors, has confirmed the preference for high ESG performance. In a recent survey, eight in ten retail investors globally stated that they are interested in investing in more environmentally and socially responsible companies. 39% claimed to have already invested with ESG in mind. This percentage has grown from 24% in 2004.Footnote 35 Consumers also seem to care about the social and environmental performance of firms. Hainmueller et al.Footnote 36 show that a subsection of consumers cares enough about social issues to pay more for fairly traded products. Similarly, a 2021 survey on climate change found that 33% of Americans claimed to have rewarded green companies by purchasing more of their goods, while 28% of respondents stated that they had punished brown companies by not purchasing their products.Footnote 37
Lobbying on salient issues, even if directly aimed at policymakers, carries crucial information about companies’ social and environmental credentials to interested stakeholders. First, inside lobbying observed by the public reveals the political preferences of interest groups, including companies. Members of the public who care about an issue will want companies they purchase from to take positions in line with their preferences. For example, prior work suggests that consumers adjust their purchasing decisions based on the alignment of political donations with their own political orientation.Footnote 38
Second, lobbying contains information on a company’s preparedness to adjust to policy changes. Lobbying against regulation signals to outside stakeholders that a company’s operations are far from meeting new regulatory targets. If consumers want companies to meet stricter regulatory standards, the company’s overall public image will be negatively affected. For example, if stakeholders prefer companies emitting less carbon dioxide, lobbying against carbon mitigation regulations sends a negative signal. Conversely, lobbying in favor of popular regulatory policies, even when primarily aimed at policymakers, signals to interested stakeholders that a company is relatively well-prepared for the new policies. In the example of climate change, lobbying in favor of mitigation policies signals that a company may be more environmentally friendly in its own operations and thus prepared to meet new targets.
Of course, most small individual stakeholders, such as retail consumers and retail investors, are unlikely to follow companies’ lobbying efforts in detail. However, NGOs and the news media do frequently report on such lobbying. As such, stakeholders may react to the information provided to them by such intermediary actors. The media reports not only on businesses’ publicly available positions but also on their more obscure inside lobbying. Even inside lobbying that takes place behind closed doors can eventually find its way into the public eye through leaked documents and freedom of information requests. Thus, information on climate lobbying, even in the more obscure forms, can reach small stakeholders, such as individual consumers and retail investors, through the news media.Footnote 39 Lobbying, therefore, has to be a component of companies’ public relations strategies. Visible forms of lobbying that are in line with the majority preference of core stakeholders can positively impact a company’s public reputation, while lobbying that is misaligned with the majority preference of core stakeholders, in contrast, can negatively impact a company’s public reputation.
Association lobbying, on the other hand, has fewer reputational consequences—both negative and positive. This is for two reasons. First, since associations do not always perfectly reflect the views of all of their members,Footnote 40 associations’ lobbying sends a much more muddied signal to outside stakeholders. It is not always clearly possible to infer individual companies’ positions from information on association lobbying.
Second, even if outsiders assign the same amount of blame to all companies within a sector in reaction to association lobbying as they would to a specific firm in reaction to its individual lobbying, this blame is unlikely to have the same potential financial implications for companies. Information on association lobbying preserves companies’ relative reputation compared to competitors from the same sector. For the example of consumers this means that instead of simply switching consumption to a greener firm within the sector, consumers would have to switch consumption to and from entire sectors to punish and reward associations’ climate lobbying.
Finally, why would associations themselves not be susceptible to the same pressures and care about their reputation with the public? The core difference between associations and firms is that they are economically accountable to different groups. Firms’ economic success depends directly on their ability to sell their products to consumers, raise funds from investors, and recruit a large number of qualified workers. Associations, on the other hand, tend to derive most or all of their income from membership fees. Thus, for them, member firms are the main stakeholder they need to satisfy with their lobbying performance. If the theory presented here is correct, then a sizeable portion of firm members should appreciate an association’s ability to take on less publicly popular policy positions. Thus, for an association, the most important type of reputation to uphold is the reputation that they can serve as forceful voices when their firm members would rather remain anonymous.
Strategic implications for firms’ lobbying
The potential reputational repercussions of individual and collective lobbying have important implications for companies’ lobbying strategies. When deciding whether and how to approach decision-makers, companies need to balance the cost of lobbying, the chance of policy success, and their reputation with stakeholders. Reputations are most likely to be affected by lobbying when information on lobbying positions is publicly available. For many forms of lobbying, this is the case. Within the European Union, for example, one common form of lobbying is the provision of commentary on policy drafts to the European Commission. These comments are made public and often find their way into NGO and press reports. Similarly, freedom of information requests can unearth meeting notes with officials.
In both examples—meetings with policymakers and commentary on draft legislation—associations can be a suitable substitute for individual company lobbying. This is especially true when we conceptualize lobbying as the transmission of information and legislative subsidies, as a lot of prior work on lobbying does.Footnote 41 Similar to large firms, associations often have substantial technical and legislative expertise, which they can use to provide information and legislative subsidies to policymakers.Footnote 42
For any given policy, companies thus have the choice between four options: not lobby, lobby for their preferred policy outcome individually, try to influence an association to do the lobbying, or lobby individually and through an association. Based on background interviews with association representatives, I conceptualize associations as strategic aggregators of member firms’ preferences: In most cases, they will represent the weighted average of members’ policy preferences, where the weights are based on the amount of time and effort each member invests in influencing the association’s position internally. Influencing an association from within should thus lead to the association taking a position closer to the preferred policy position of the firm.
As few, if any, firms are large enough to fully dictate the position of an association, we need to distinguish between two possible cases: One of within-industry unity and one of within-industry disagreement on a policy. The first case is the simpler one. Here, associations will represent the consensus position among their members. The core decision a firm then faces is whether to add to the association’s lobbying by lobbying individually alongside it. This can have added benefits in terms of policy outcomes if more lobbying increases the chances of policy influence. However, it can also have reputational consequences. If the within-industry consensus is relatively less popular, e.g., less climate-friendly, then firms that are susceptible to pressure from their stakeholders should be more likely to stand back and not lobby alongside their association, as Volkswagen did in the opening example. In contrast, if the within-industry consensus is more publicly popular, then firms that are more susceptible to stakeholder pressure should be more likely to also lobby individually, alongside their associations.
The second case of disagreement between firms from the same industry, and thus within the same associations, is more complicated. Here, companies need to expend more political capital within an association if they want to pull the association toward their policy position. A firm that has relatively popular policy preferences and the economic capacity to lobby alone will find it in their interest to lobby individually when faced with stakeholder pressure.
They may, simultaneously, try to influence the association from within to pull its lobbying toward their preferred policy position. From a reputational standpoint, trying to influence the association from within presents few benefits. There is no way for outside actors to verify what occurs inside an association. Thus, companies will not be able to claim credit for any effort to move the association’s position in a more popular direction. However, there are potential benefits to trying to pull the association to one’s side, or at least weakening its ability to lobby in a different direction. Whether this is in a firm’s strategic interest will depend on the cost of trying to influence the association, the chance of influencing the association’s position, given other firms’ size and preferences, and the importance of association lobbying for policy success. As these factors will differ across firms, associations, and policy areas, we will likely see some instances in which firms with relatively popular preferences try to influence their associations, in addition to individual lobbying, while in other cases, they might forego engaging with associations altogether and just lobby by themselves.
What we can say is that in cases of within-industry disagreement the member firms with relatively less popular policy preferences should be more reliant on associations if they are susceptible to stakeholder pressure. In such cases, firms will be more reluctant to lobby individually due to the reputational cost and will thus be more dependent on an association taking their position. As such, firm members with less popular positions will likely expend more political capital to pull the association to their side.
As a result, in cases of within-industry disagreement, there are two plausible outcomes at the association level: An association may be unable to take a strong policy position if firm members from both sides try to exert influence. In such cases, reputational concerns should still lead firms to lobby more individually if they hold popular positions and less individually if they hold less popular lobbying positions. Alternatively, if firm members with more popular policy preferences do not see it in their interest to spend much political capital on influencing the association from within, then the association will side with the less popular position of its remaining members.
Overall, associations will be more likely to represent the business community’s more unpopular policy preferences and serve as tools for “collective irresponsibility.” This tendency for associations to take less popular policy positions should be visible both across policies, but, in cases of within-industry disagreements, also within policies. Indeed, there are cases of clear disagreement between associations and firm members in their lobbying on the same policy. For example, there was strong within-industry disagreement between carmakers regarding the potential 2035 ban of internal combustion engines (ICEs) by the EU. Carmakers that were more ready to switch to all electric vehicles at the time—Volkswagen, Ford and Volvo—lobbied in favor of the ICE ban, while powerful automotive associations lobbied against the ban. Similarly, in 2024, the European aviation association Airlines 4 Europe advocated for a weakening of non-CO2 emission monitoring and reporting in the EU, while two of its member firms—Ryanair and Easyjet—strongly advocated in favor of comprehensive monitoring and reporting.
There are a number of important scope conditions for this theory. First, how important a company’s reputation is, and thus how much it weighs in the strategic calculations outlined above, will differ by company and sector. Two factors should shape companies’ need to uphold their reputation: their vulnerability to stakeholders’ opinions and stakeholders’ cost of switching to competitors. For example, when it comes to the stakeholder group of consumers, companies that sell to retail customers should be more vulnerable to consumer backlash due to unpopular lobbying. Companies that are embedded in supply chains and do not sell directly to retail customers should be less concerned. For example, Volkswagen, which sells cars to retail customers, likely has to be more careful about maintaining its public image than car- parts manufacturer Robert Bosch GmbH. In addition, the magnitude of stakeholders’ reaction to lobbying is sensitive to the ease of switching between companies, as determined by the cost, convenience, and availability of alternatives. At the very extreme, companies that face no competition, such as utility providers with a local monopoly on electricity and water, should be insulated from any consumer backlash. In the next section, I use this variation in the importance of corporate reputation to test the plausibility of the strategic logic outlined above.
Second, the theory only applies to large firms for a number of reasons. For the strategic choices outlined above to be meaningful, firms have to be large enough to lobby individually and to lobby within associations. Both are potentially costly activities, as both require sufficient personnel, expertise, and financial resources to exert influence. Small firms are unlikely to lobby by themselves, but these small firms are also more likely to simply free-ride on the association’s lobbying. This is not only because influencing an association from within is costly, but also because the chances of a very small member influencing the association are slim. Finally, small firms are also less likely to be featured in civil society and media reports that highlight lobby action, or to be targets of consumer boycotts and shareholder action. In the empirical tests below, I therefore focus only on very large companies.
Firm-association divergence by consumer exposure
In this section, I draw on climate lobbying scores from the NGO InfluenceMap to test the plausibility that companies choose their lobbying strategies to preserve their reputations with stakeholders. InfluenceMap is an organization that assigns scores to the climate lobbying of more than 450 of the world’s most climate-relevant companies and their most influential associations. Scores are assigned based on publicly observed forms of lobbying, as well as freedom of information requests. They range from 0 (not at all aligned) to 100 (fully aligned with the goals of the Paris Agreement). For each company, InfluenceMap provides a score for a company’s individual lobbying and an aggregate score for the lobbying of associations the company is a member of. To calculate association scores, InfluenceMap traces whether a company is a member of specific associations, using publicly available membership data and company disclosures. The NGO then takes a weighted average across association lobbying, where the weights reflect a (rough) estimation of how strong the link between an association and the firm is. For example, firms that are part of an association’s leadership board are coded as having a stronger relationship than firms that are merely associate members.Footnote 43 The scores are regularly updated to reflect new lobbying actions. In February 2025, the lowest individual lobbying score was 15 (individual lobbying by Australian Energy Provider Sunset Power International), while the highest score was 89 (individual lobbying by Adobe).
While the scores InfluenceMap assigns do not capture all forms of lobbying, and may therefore not reliably describe all lobby positions, using these data has several advantages. First, association scores for companies allow for a direct comparison between companies and the associations they are actually members of. Second, InfluenceMap is widely known among networks of climate-conscious stakeholders, and its analyses and lobbying scores are frequently reported in the popular media. Thus, climate-friendliness scores by this organization are the type of assessments that companies which are worried about their reputation should be conscious of. Indeed, in background interviews with lobbyists, a number of corporate lobbyists confirmed that they were aware of InfluenceMap’s work. Therefore, strategic reputation management will likely occur in the forms of lobbying that InfluenceMap observes. Lastly, while the selection of around 450 companies is, of course, not representative of the global corporate landscape, InfluenceMap targets the so-called CA100+ companies, which, due to their large carbon footprints, have been the focus of stakeholder activism. These large firms are most likely to be targeted, and should thus be most likely to adjust their lobbying strategies in anticipation. Due to their size, such companies are also most capable of both lobbying by themselves and influencing associations from within.
To probe the plausibility of strategic lobbying adjustment to safeguard reputation with consumers, I code a binary variable that takes the value of 1 if a company sells goods to retail consumers in a competitive market and 0 otherwise. Note that the underlying assumption here is that, on average, retail consumers will like lobbying in favor of climate policy and dislike lobbying against. Survey results presented below show that this assumption is reasonable, at least in the countries I survey.Footnote 44 In order for consumer pressure to bite, consumers must have the option to switch the company they purchase from or to stop their consumption of the product altogether in reaction to lobbying. Therefore, for a company to be coded as consumer-facing, it has to meet a number of criteria. First, it must produce an end-product that customers can purchase in retail stores or online. Second, the consumer must be able to tell which company they are purchasing from. Therefore, producers of intermediate goods or packaging for consumer-end products are not counted as consumer-facing. Third, firms are not coded as consumer-facing if they hold a monopoly on essential goods, such as utilities or prescription drugs. In such cases, while retail consumers know who they are purchasing the goods from, they are unable to adjust their consumption in reaction to lobbying. More details on how vulnerability to retail consumer boycotts is coded, as well as robustness checks using alternative coding decisions for edge cases, are presented in the supplementary information. In total, around 38% of companies in the sample are coded as vulnerable to retail consumer boycotts. After creating this measure of vulnerability to consumers, I regress the difference between a company’s individual and its association score on this binary measure of potential pressure from retail consumers. The theory would predict that the difference should be largest for those firms who are vulnerable to pressure from their consumers, as such firms would both strategically stay silent when they hold less climate-friendly positions, and strategically lobby individually in a way that is greener than their average association when they hold more climate-friendly positions.
Table 1 presents the results. Model 1 shows the simple binary regression, while model 2 adds region fixed-effects to account for the continent where a company is headquartered, and model 3 adds fixed-effects for the sector, as classified by InfluenceMap.Footnote 45 All standard errors are robust and clustered by sector. Despite the relatively small sample size and the coarse measure of exposure to consumer pressure, the retail consumer variable is positive and statistically significant at $p \lt 0.01$
across all models. As model 1 shows, the average difference between company and association lobbying scores across all regions and sectors is more than 7, which is sizeable, given that the overall standard-deviation of the lobbying scores in the data is around 13. It is also important to note that the coefficient on consumer exposure remains positive and significant even once we control for the sector. The estimated within-sector difference by consumer exposure is around 5 points. The magnitude here is smaller, because some sectors have no variation in consumer exposure, meaning that their variation is no longer estimated by the coefficient once sector fixed-effects are included. For example, the sector “Retailing,” by definition, only contains firms that sell to retail consumers. Similarly, there is no company in the “Metals and Mining” sector that sells directly to retail consumers. Yet, other sectors have variation in terms of consumer exposure, which makes estimation with sector fixed-effects feasible. For example, the sector classified by InfluenceMap as automotive includes car brands, such as Volkswagen or Mercedes, which clearly sell to retail consumers. However, it also contains car parts manufacturers and producers that exclusively sell large long-haul trucks. These are classified as not selling to retail consumers. Similarly, in the Information Technology sector, some companies (e.g., Apple) clearly sell to retail consumers, while others (e.g., SAP) focus on providing IT services to business clients and are thus coded as not retail consumer facing. The supplementary information shows that these results are robust to a number of alternative specifications, including alternative coding decisions for the consumer measure, exclusion of the financial sector, which is scored along slightly different questions, and subsetting to only companies whose individual engagement on climate policy is relatively intense.
$p \lt 0.01$
across all models. As model 1 shows, the average difference between company and association lobbying scores across all regions and sectors is more than 7, which is sizeable, given that the overall standard-deviation of the lobbying scores in the data is around 13. It is also important to note that the coefficient on consumer exposure remains positive and significant even once we control for the sector. The estimated within-sector difference by consumer exposure is around 5 points. The magnitude here is smaller, because some sectors have no variation in consumer exposure, meaning that their variation is no longer estimated by the coefficient once sector fixed-effects are included. For example, the sector “Retailing,” by definition, only contains firms that sell to retail consumers. Similarly, there is no company in the “Metals and Mining” sector that sells directly to retail consumers. Yet, other sectors have variation in terms of consumer exposure, which makes estimation with sector fixed-effects feasible. For example, the sector classified by InfluenceMap as automotive includes car brands, such as Volkswagen or Mercedes, which clearly sell to retail consumers. However, it also contains car parts manufacturers and producers that exclusively sell large long-haul trucks. These are classified as not selling to retail consumers. Similarly, in the Information Technology sector, some companies (e.g., Apple) clearly sell to retail consumers, while others (e.g., SAP) focus on providing IT services to business clients and are thus coded as not retail consumer facing. The supplementary information shows that these results are robust to a number of alternative specifications, including alternative coding decisions for the consumer measure, exclusion of the financial sector, which is scored along slightly different questions, and subsetting to only companies whose individual engagement on climate policy is relatively intense.
Regression of difference in climate-friendliness scores between individual and association lobbying

+ p $ \lt $
0.1, * p
$ \lt $
0.1, * p $ \lt $
0.05, ** p
$ \lt $
0.05, ** p $ \lt $
0.01, *** p
$ \lt $
0.01, *** p $ \lt $
0.001.
$ \lt $
0.001.
The overall difference in climate-friendliness scores can derive from two sources. InfluenceMap bases its scoring on observations of publicly-taken positions along eleven climate-policy topics, such as support for carbon taxation and support for renewable energy.Footnote 46 On each topic, a company or association gets scored for policy positions taken in various observable fora, such as company websites, CEO interviews, consultations with governments, or lobbying revealed in media reports. They can receive scores from –2 (very clearly opposed) to 2 (very clearly in favor). As most actors do not take positions on all types of climate policy, many tables contain empty rows. The overall scores are based on the climate-friendliness of only positions that were observed. The supplementary information shows an example table from InfluenceMap. This scoring system means that lobby scores can diverge for two reasons: First, companies and associations can receive different scores when lobbying on the same topic. Second, companies and associations may vary in the topics they lobby on. If, for example, an association takes a negative position on carbon taxes, while its member firm does not take any publicly observable position on carbon taxes, this will negatively affect the overall association score, but not the overall firm score.
Figure 1 plots the source of the differences in overall climate-friendliness scores estimated in Table 1. To arrive at these estimations, I trace all association memberships that feed into InfluenceMaps’ association scores. For each company-policy combination, I then estimate how a company’s position, if taken, differs from the average score of association positions across all associations the firm is linked to, according to InfluenceMap. The resulting binary outcome variable takes a value of 1 if the firm’s position was greener than the average position of its association, and 0 if the firm’s position was as or less green. I further compare instances in which firms remained silent, while associations lobbied.Footnote 47 Here, the outcome variable takes a value of 1 if at least one of the firm’s associations lobbied on a policy while the firm remained silent, and 0 if both lobbied. The resulting estimated probabilities are based on linear probability models with cluster-robust standard errors, clustered at the company-level. The underlying regression tables, and alternative specifications using logistic regressions, are shown in the supplementary material. Before discussing the results, it is important to note that the data does not allow me to code the exact policy on which each actor lobbied. For example, even if both an association and a firm took a position on carbon taxes, this might have been in the context of different policies planned in different countries. Therefore, the data likely underestimates instances of strategic silence by firms.
Factors driving divergence in climate-friendliness ratings.
Note: Figure depicts the two drivers of the divergence in climate-friendliness scores: Differences in positions and strategic silence. All estimated probabilities are based on OLS regressions. 95% confidence intervals are cluster-boostrapped with clustering by company.

Nonetheless, we can see systematic patterns in the data. First, when both, firms and their associations, take positions on the same climate policy, firms are generally more likely to take a position that is rated as more climate-friendly than that of their associations. Even firms that do not sell to retail consumers are estimated to lobby more green than their associations in 63% of cases in which both lobby. This is unsurprising, as firms face other potentially climate-interested stakeholders beyond retail consumers, such as their shareholders and workers. Still, firms that sell to retail consumers are significantly more likely to take greener positions during simultaneous lobbying: Consumer-facing firms take greener positions than their associations in an estimated 72% of cases.
We also see systematic differences in firm silence while associations lobby. Here, the likelihood of silence should depend on the climate-friendliness of the position. Firms that are vulnerable to consumer pressure should be more likely to remain silent and let the association take the lead in lobbying if they have a relatively less climate-friendly position. Thus, we should see more cases of strategic firm silence when association positions are less climate-friendly. This is in line with the opening example, where Volkswagen would not take an unpopular position against emission standards, but let its associations do the lobbying. Meanwhile, there will be cases where an industry as a whole has relatively green policy preferences. In those cases, we should see climate-friendly association lobbying, but individual firms, especially if they sell to retail consumers, should lobby alongside their associations to green their image. Thus, remaining silent while an association is taking a relatively green position should be a rarer strategy, especially for companies that sell to retail consumers. This is indeed what I find, as shown in the right-side panel of Figure 1. In general, firms are more likely to remain silent while associations conduct less climate-friendly lobbying. This holds for all types of firms, but the slope is significantly steeper for firms that sell to retail consumers. When associations are taking a climate-unfriendly position scored at –1.5 by InfluenceMap, firms that sell to retail consumers are estimated to remain silent in around 33.5% of cases, while firms that do not sell to retail consumers are estimated to remain silent in 26% of cases. In contrast, when the association takes a climate-friendly position scored at 1.5 by InfluenceMap, consumer-facing firms only remain silent in around 4% of cases, while those that don’t sell to retail consumers remain silent in 10.5% of cases. Both of these patterns—within-policy disagreement and strategic silence—are robust to the inclusion of region and sector fixed-effects, as shown in the supplementary information.
Taken together, these results suggest strategic lobbying choices in line with the theory. We see both a divergence in association and firm positions and differences in the choice to remain silent in line with what the idea of “collective irresponsibility” would suggest. Thus, while the evidence presented in this section cannot be interpreted causally, it does confirm the plausibility of firms adjusting when they lobby collectively to manage their reputations with climate-conscious consumers. The next section provides experimental evidence of the possible reputational repercussions when consumers are confronted with information on lobbying to test the core assumptions underlying the theory of “collective irresponsibility.”
Research design consumer survey
Corporate reputation management through strategic lobbying choices only makes sense if consumers react differently to information on individual and association lobbying. To test if the theory’s underlying assumptions about consumer behavior are correct, I conducted survey experiments with representative samples of the populations of Germany (992 respondents), the Netherlands (895 respondents), France (882 respondents), and Italy (869 respondents). The four countries in which surveys were fielded represent four of the five largest consumer markets within the European Union. They also vary in the level of citizens’ climate concern, with Italian citizens being much less concerned than the EU average and Dutch citizens being much more concerned, according to data from Eurobarometer surveys.Footnote 48 France and Germany fall close to the European average. To ensure that the samples were representative of the respective countries’ populations, survey responses were collected using quotas for gender, age, region, and income.
Surveys contained a pre-registered vignette experiment, which provided participants with varying levels of information on three potential actors: A “Brown” Firm, a “Green” Firm, and an Association. For each, the information treatments varied whether they provided information on their lobbying. In information treatments that outlined the association’s lobbying, the association was described as having lobbied against strong climate policy. This reflects the overall trend that associations tend to take less climate-friendly positions than individual firms. In addition, it allows me to explore the potential efficacy of moving less climate-friendly lobbying into associations. In information treatments that mentioned the brown firm’s individual lobbying, the brown firm was described as having lobbied against climate policies. The green firm, in contrast, was described as having lobbied in favor of climate policies. The resulting 2×2×2 design has eight possible treatments, summarized in Figure 2. As the control and association treatment (T4) groups serve as the most important comparison groups, the surveys randomly assigned twice as many participants to these two treatment groups.
Experimental treatment groups.

Vignette texts and outcome questions centered around the aviation sector. Aviation is one of the sectors which frequently lobby on climate policy. Informational treatments described real-world policies and real-world variation in airlines’ lobbying positions. While airline travel as a whole is very difficult to decarbonize, some airlines are “greener” than others. Airlines vary in their climate lobbying positions because they vary in the age and emission intensity of their fleets, their willingness to use sustainable aviation fuel, and their readiness to use train journeys instead of short feeder flights to their hubs. Aviation also represents a consumer-facing sector for which there are viable, albeit often less convenient, alternatives. Thus, the focus on the aviation sector allows me to test consumers’ willingness to move consumption away from an entire product category rather than just an individual firm.
To isolate the effect of information on lobbying, all respondents read a text about air travel emissions and climate policies at the beginning of the vignette experiment. This text outlined that the airline industry is CO2 intensive and that governments are debating policies designed to limit emissions from air travel. Thus, individuals in the control group received all relevant information except information on lobbying activities by the airline industry. The other treatment groups then read additional sentences that detailed lobbying activity by one or more of the three actors, as depicted in Figure 2. Company names were anonymized, using “Airline A” and “Airline B.” For each participant, the survey randomized which of the two airlines was “brown” and which was “green.” An English translation of the control text and all treatment texts can be found in the supporting information.
Outcome measures in consumer survey
To measure consumers’ reaction to the information, the survey asked them to imagine that they were booking a holiday in another European country. Participants then engaged in six binary choice exercises between travel options. Each binary choice asked three outcome questions. First, the survey asked which travel option the respondent would prefer for their trip. Second, it asked respondents to rank how attractive they find each travel option on a scale from 0 to 10, mimicking outcome questions from Hainmueller et al.Footnote 49
The order in which participants saw the choice tasks was randomized. For one of the tasks, the survey asked individuals to choose between a flight by Airline A and a flight by Airline B, which were the same across other salient dimensions (duration, number of stops, price) that impact travel choices. This choice tests whether individuals switch airlines based on lobbying behavior if no other characteristics differ. It is the most-likely case for a consumer reaction.
Three further choice tasks presented respondents with a binary choice between Airline A and Airline B flights, which differed in cost. Choices presented the brown airline as cheaper (by €4, €8, or €30) than the green airline.Footnote 50 These choices are a more demanding test for consumer reactions to lobbying: Are individuals willing to book a more expensive option to punish/reward climate lobbying?
Lastly, I test individuals’ willingness to switch away from the airline sector entirely by asking consumers to choose between flights from the two airlines and taking the train. In order to reflect realistic travel options, the train journey takes longer and includes one change of trains. The price for these comparisons was the same across air and train travel.Footnote 51 Table 2 summarizes all six binary choices shown to consumers for whom the survey assigned airline A to be the “green” airline.
Six consumer choice exercises summarized

In addition to these comparison choices, the survey also asked consumers to give their overall impression of how climate-friendly the two airlines are to measure companies’ overall reputation on climate change. Lastly, consumers were asked whether they would be willing to reduce the amount they fly in the future for climate reasons to capture willingness to reduce overall consumption in response to lobbying.
The majority of the European public is concerned about climate change and favors mitigation policies. I, therefore, expect that information about individual firms’ lobbying leads to a significant shift away from the brown airline toward the greener airline. Consumers are unlikely to assume that the association always represents all airlines. I, therefore, expect the green firm to distinguish itself from its competitors and attract more consumption by lobbying, even if the association lobbies against climate policy at the same time.
-
H1a: Consumers switch their consumption away from the “brown” airline in response to information on the company lobbying against climate policy.
-
H1b: Consumers switch their consumption to the “green” airline in response to information on the company lobbying in favor of climate policy, even if the association lobbies against climate policy at the same time.
Further, since consumers cannot discern whose positions an association represents without further information, I expect that consumers do not switch consumption between airlines when they only learn about association lobbying. If consumers are willing to switch between sectors in response to lobbying, I expect them to switch to the train or reduce their willingness to fly in response to anti-mitigation lobbying by any of the actors. However, as this is a much more costly choice than simply choosing a different airline, I expect the willingness to divert consumption away from the entire sector to be much smaller than the willingness to switch between airlines.
-
H2: Consumers do not switch between airlines based on information of association lobbying alone.
-
H3: Consumers are less willing to switch between sectors than to switch between individual airlines in response to lobbying.
Lastly, the theory is based on the assumption that stakeholders’ reaction to lobbying is driven by positions’ misalignment with their preferences. Thus, I expect that all of the hypothesized effects outlined above will be moderated by individuals’ preferences. The effects should be largest among participants who are more concerned about climate change and who support the policies mentioned in the vignette texts:
-
H4: All effects of lobbying information are larger among consumers with higher climate concern and support for climate policies.
Results consumer survey
Figure 3 summarizes the experiments’ main results, based on regressions shown in Supporting Information Table 9. As expected, lobbying treatments that mentioned individual companies’ lobbying had large and statistically significant effects on consumers’ stated choice between two airlines’ comparable products, as shown in the top-left panel. The results are pooled across all four choice exercises that compared the two airlines. Regressions use choice-task fixed-effects and cluster standard errors at the respondent level. As hypothesized in H1a and H1b, consumers switched from the brown airline to the green airline in response to pro- and anti-mitigation lobbying. Compared to the control group, individuals in treatment condition one who read about the brown airline’s lobbying were 28 percentage points more likely to choose the green over the brown airline’s flight. This effect is highly statistically significant ( $p \lt .001$
).
$p \lt .001$
).
Vignette treatment effects on consumer choice between the two airlines.
Note: Vignette treatment effects on choice between two airlines with 95% confidence intervals. Upper left panel: Dependent variable is binary indicator of choosing green airline’s flight. Regression pools choices across all four comparisons between two airlines’ flights, with choice-task fixed-effects and standard errors clustered by respondent. Upper right panel: Vignette treatment effects on choice between brown airline’s flight and train, with 95% confidence interval. Dependent variable is a binary measure of choosing brown airline’s flight. Lower left panel: Vignette treatment effects on choice between green airline’s flight and train, with 95% confidence intervals. Dependent variable is binary measure of choosing green airline’s flight. Lower right panel: Vignette treatment effects on stated willingness to reduce flying in the future due to climate change with 95% confidence intervals. Outcome variable measured on three-point scale (Not Willing (–1), Maybe Willing (0), Willing (1)).

Similarly, compared to the control group, consumers in treatment condition two, who read about a green firm’s lobbying, were also 28 percentage points more likely to choose the green over the brown airline’s flight ( $p \lt .001$
). The effect of treatment three, where consumers read about both the green and brown airlines lobbying was even stronger. Participants who read about both firms’ lobbying were more than 38 percentage points more likely to choose the green over the brown airline’s flight (
$p \lt .001$
). The effect of treatment three, where consumers read about both the green and brown airlines lobbying was even stronger. Participants who read about both firms’ lobbying were more than 38 percentage points more likely to choose the green over the brown airline’s flight ( $p \lt .001$
).
$p \lt .001$
).
As hypothesized in H2, information on just association lobbying did not affect the choice between the green and the brown airlines, as respondents in this treatment condition lack information on individual airlines. In addition, the green airline is rewarded for its green lobbying even when the business association is lobbying against climate policy. Treatment conditions six (Association and Green Firm) and seven (Association, Green Firm, and Brown Firm) increase the likelihood that participants choose the green airline’s flights over the brown airline by 30 and 36 percentage points, respectively ( $p \lt 0.001$
).
$p \lt 0.001$
).
The comparisons between treatment conditions illustrates that an association’s lobbying distributes the blame for anti-climate lobbying across companies. First, for cases in which there is within-industry agreement on the less climate-friendly policy position (treatments 1, 4 and 5), we see that lobbying by only the association is by far the least costly, while association lobbying alongside the brown firm is still less costly than just lobbying by the brown airline alone without association support (the difference is around 7 percentage points and is significant at $p \lt 0.01$
). This significant difference likely arises from respondents assuming, in the absence of further information, that the green airline was part of the association and shared its policy position.Footnote 52 Second, comparing cases of within-industry disagreement and thus individual lobbying by the green company, we see that the magnitude of switching when only the association takes the brown policy position is smaller than the magnitude of switching when the brown firm and the green firm lobby (difference = 8.5 percentage points,
$p \lt 0.01$
). This significant difference likely arises from respondents assuming, in the absence of further information, that the green airline was part of the association and shared its policy position.Footnote 52 Second, comparing cases of within-industry disagreement and thus individual lobbying by the green company, we see that the magnitude of switching when only the association takes the brown policy position is smaller than the magnitude of switching when the brown firm and the green firm lobby (difference = 8.5 percentage points, $p \lt 0.01$
) and when all three actors lobby (difference = 6 percentage points,
$p \lt 0.01$
) and when all three actors lobby (difference = 6 percentage points, $p \lt 0.05$
). Thus, from the brown airline’s perspective, the reputational cost of taking an individual lobbying position is the same or larger than the cost of lobbying through an association across cases of industry unity and industry disagreement.
$p \lt 0.05$
). Thus, from the brown airline’s perspective, the reputational cost of taking an individual lobbying position is the same or larger than the cost of lobbying through an association across cases of industry unity and industry disagreement.
These significant average findings for the entire sample are unsurprising given the average level of climate concern and mitigation policy support in the participant population. As shown in Supporting Information Figures 7 and 8, most survey participants are worried about climate change and support the mitigation policies described in the vignette texts. Thus, lobbying against mitigation policies is misaligned with participants’ average policy preference.
In contrast to the significant findings on choices between the two airlines, consumers were much more reluctant to change between sectors in response to lobbying information, in line with hypothesis 3. As the top right and bottom left panels of Figure 3 show, the informational treatments had a small or nonexistent effect on the choice between trains and airlines. For the brown airline, some of the informational treatments render respondents between 3 and 9 percentage points less likely to choose the brown airline over the train. Surprisingly, respondents are also slightly less likely to choose the green airline over the train after reading information about green lobbying in treatment group T2. This may indicate that some respondents misread the information or were confused about the identity of the airline. Crucially, however, the results show that respondents do not switch away from the entire airline sector in response to association lobbying. The association lobbying treatment (T4) has no significant effect on any of the outcome variables that measure respondents’ willingness to switch sectors.
The finding that participants did not react strongly to association lobbying information by switching away from the airline sector as a whole is replicated in the outcome question that asked individuals if they would be willing to reduce flying in the future. Responses were coded as 0 (no), 1 (maybe) or 2 (yes). The bottom right panel in Figure 3 presents the effects of the treatments on the willingness to reduce flying. None of the informational treatments, including the treatments that provided information on association lobbying, had a significant effect on this outcome variable. Association lobbying against climate policies thus did not increase participants’ willingness to switch away from the airline sector.
As shown in the Supporting Information, these results are robust to modifications in the regression analysis. They hold when the sample is disaggregated by country, when demographic control variables are included and when using demographic weights to fine-tune the demographic balance between treatment groups. Results are also robust to limiting the sample to only those participants who correctly answered questions about the lobbying activity described in their respective vignette treatment. The direction of effects is also consistent across all individual choice tasks with different cost differentials, as shown in Figure 9 and Table 10 in the Supporting Information. Even at higher prices, consumers still react to individual lobbying by adjusting their stated willingness to consume from the airlines.
The additional outcome variable of overall post-treatment “climate-friendliness” ratings by participants offers a reason why consumers are changing some of their stated consumption patterns in response to lobbying information. Figure 4 presents the effect treatments had on participants’ overall impression of airlines’ climate-friendliness, also shown in columns three and four of Supporting Information Table 15. As the figure shows, the informational treatments had a small, but statistically significant negative effect on consumers’ estimation of the brown airline’s climate-friendliness. On a scale of 0–10, treatments that mention the brown firm’s lobbying led to a drop in climate-friendliness scores by 0.37 to 0.58 points. In contrast, information on individual firms’ lobbying also significantly increased individuals’ perception of the green airline’s overall climate-friendliness by between 0.69 and 1.2 points. The treatment that only informed respondents about association lobbying (T4) had no significant effect on either airline’s climate-friendliness rating. This may be the case because individuals’ prior was already that airlines are not particularly climate-friendly. Indeed, the control group’s estimate of climate-friendliness for both airlines was 4.9/10.
Change in climate-friendliness rating of the two airlines.
Note: Figure shows vignette treatment effects and 95% confidence intervals for consumers’ rating of how green the two airlines are. Ratings are measured on a scale of 0 (not climate-friendly at all) to 10 (very climate-friendly).

Lastly, the effects on attractiveness ratings shown in Supporting Information Figure 11 mirror the results of binary choices between airlines. While the absolute attractiveness rating of the green airline did not significantly increase in response to its green lobbying, the absolute attractiveness rating of the brown airline’s flight decreased significantly in response to all informational treatments that mentioned individual companies’ lobbying. Thus, the green airline’s flight did become more attractive relative to its brown competitor. Additionally, the attractiveness rating of both airlines decreased significantly ( $p \lt 0.001$
) under both the fourth treatment condition (Association) and the fifth treatment condition (Association and Brown Firm). These results indicate that individuals blamed all airlines for lobbying by the airline association in the absence of information on within-sector disagreements. However, as the results on consumption choices show, this blame was not sufficient to increase consumers’ willingness to switch consumption away from the airline sector.
$p \lt 0.001$
) under both the fourth treatment condition (Association) and the fifth treatment condition (Association and Brown Firm). These results indicate that individuals blamed all airlines for lobbying by the airline association in the absence of information on within-sector disagreements. However, as the results on consumption choices show, this blame was not sufficient to increase consumers’ willingness to switch consumption away from the airline sector.
Heterogeneity by climate preferences
Figure 5 shows the treatment effects on the outcome variable of consumer choice between the two airlines, using interaction terms between the treatment conditions and climate change concern and policy support, respectively. The interaction terms were coded based on responses to pre-treatment questions. The climate concern question asked participants how worried they were about climate change on a scale from 0 to 10. Respondents were then coded as having a low level of worry if they indicated five or lower. Before the informational treatment on lobbying, the survey also asked participants whether they support the two air travel-related climate measures mentioned in the introduction text—a tax on jet fuel and a stricter ETS for airlines, on a scale from 0 to 10. Respondents were then coded as showing low support if their answers to the two policy questions add up to 10 or less out of a maximum of 20.
Vignette treatment effects on consumer choices, by climate concern.
Note: The two panels present the coefficients and 95% confidence intervals for respondents’ choice between the two airlines. Underlying regressions pool the four choices that compare the two airlines and include choice-task fixed-effects. Coefficients are calculated using interaction terms between the experimental treatments and a binary measure of climate concern/support for climate policy. Standard errors are clustered by respondent.

The findings strongly support hypothesis H4. The average treatment effect of lobby information on respondents’ choice between the two airlines is much larger for those who are more worried about climate change and more supportive of climate policies. However, as Supporting Information Tables 16 and 17 show, even among participants with high levels of concern over climate change and high support for climate policy, the treatment that provided information on associations did not induce respondents to switch away from the airline industry as a whole. Thus, I find no evidence that association lobbying can be costly in terms of consumer choices, even among the more sensitive groups of consumers.
Overall, the consumer survey results illustrate that consumers, especially those who are worried about climate change and support mitigation policies, change their within-sector consumption in response to individual firms’ lobbying on climate policy. They prefer to consume from companies that lobby in favor of climate policy and reduce consumption from companies that conduct lobbying against climate policy. In contrast, consumers are not willing to switch to a different sector or reduce consumption altogether in response to association lobbying.
The experiment tested the most-likely case of consumer reaction, where consumers make hypothetical, low-cost decisions directly after receiving information on lobbying. In real-world settings, the consumer reactions are likely smaller than the very large treatment effects presented above. Nonetheless, professionals who work to preserve the public image of a company have reason to be worried. A supplementary media analysis, presented in the Supporting Information, shows that the media reports on businesses’ climate lobbying frequently, so that information on lobby action can reach consumers. Lobbyists and corporate representatives interviewed for this paper confirmed that they were very worried about the potential public backlash against their lobbying. One association representative even described their member companies as “terrified” of consumers’ and investors’ reactions to lobbying. One possible reason for this is that in the rare cases where information on lobbying does become salient, it can have large potential reputational effects, as shown in the experiments, and those who are in charge of lobbying decisions and preserving the company’s public image would be accountable for these repercussions.
Conclusion
This paper has presented a new theory on corporate lobbying, which complements and adds to our understanding of when firms lobby as a group and when they lobby individually. The idea of “collective irresponsibility” suggests that companies shift lobbying that is less popular with their stakeholders into associations, while taking more popular positions individually. This is effective because associations’ inner workings are a black box and their lobbying distributes blame across all members. Given the difficulty of switching between entire sectors, association lobbying thus decreases the likelihood that stakeholders, such as consumers, will take action in response to unpopular lobbying.
The theory was tested in two steps. First, the paper presented evidence to show that for companies that are more exposed to potential stakeholder pressure, the misalignment between individual and association lobbying is greatest. In addition, companies that face more potential pressure from their stakeholders are more likely to remain silent while their association conduct less climate-friendly lobbying. This suggests a strategic selection of lobbying strategies based on the popularity of lobbying positions. Second, experimental evidence showed that consumers react to lobbying information on climate policy as the theory would expect. Individual companies’ lobbying was shown to change consumers’ impression of companies’ overall climate-friendliness, and their willingness to consume from an individual company. In contrast, association lobbying had little effect on consumer choices. Consumers were unable to distinguish between individual firms when provided with information on association lobbying, and were unwilling to reduce their consumption from the entire sector in reaction to the association’s lobbying. This is remarkable, as the hypothetical nature of the experiment should have been conducive to “cheap-talk.” If consumers show no reaction to association lobbying in this setting, they are unlikely to react in real-world consumer choices.
Both the theory and experimental results further show the moderating effect of industry unity. Association lobbying as a tool to avoid reputational backlash by stakeholders is strongest when within-industry unity is high, so that no individual firms actively lobby against the association’s position. Still, even in cases of within-industry disagreements, firms with less popular preferences have an incentive to lobby more through their associations and less individually for three reasons. First, the experiments showed that even in cases of within-industry disagreements and green lobbying by competitors, the magnitude of switching between firms is smaller when the association conducts the brown lobbying. Second, a brown firm might be uncertain about the likely lobbying activity of its peers. If there is any uncertainty around whether there is a green firm that will lobby, it is safer for the brown firm to lobby through its association. Finally, in a real-world setting, there tends to be more choice between competitors. Experimental complexity prohibited the inclusion of more firms, but it would be reasonable to assume that if there were more firms to choose from and we included variation in strategic silence and lobbying we would also see a more nuanced response by consumers. In more complex cases with more firms, where we might see some individual brown lobbying, some individual green lobbying and silence from some firms, consumers might punish those firms that lobby individually against a popular policy more than those who remain silent.
The experimental part of this study focused on the airline industry, and there is reason to believe that findings would be similar for other climate-relevant sectors. Participants will likely make the same assumptions about other high-emitting industries, such as car manufacturers or chemical producers. Thus, the reactions shown in the survey experiment likely carry over to most high-emission sectors that will need to adjust to decarbonize economic production. In addition, while climate change is currently the most salient part of environmental policy, consumers would likely react similarly to lobbying on other topics they care about, such as labor rights or data protection. Future research should investigate consumer reactions on other salient policy topics.
Empirically, this study tested the role of consumers in reacting to information on lobbying and thus shaping companies’ strategic considerations around lobbying tactics. Yet, theoretically, other stakeholders, such as retail and institutional investors, workers and actors along a company’s supply chain could exert similar pressure and thus lead to a similar strategic calculus among firms. Future work could thus investigate whether and how pressure from other types of stakeholders influences companies’ lobbying.
With the rise of so-called “corporate social responsibility,” the insights of this paper have important implications for the how we study lobbying in general. Often, studies focus only on associations’ or only on companies’ positions when studying corporate policy interests. This is convenient, because it is difficult to empirically combine both forms of lobbying. However, on salient policies of public interest, we cannot make such a simplifying assumption. Instead, we should expect a systematic bias, where companies choose to lobby individually if they hold policy positions that are more popular with their stakeholders. For studies on lobbying around issues such as climate policy, environmental regulation or labor rights, this suggests that scholars need to focus on both associations and individual companies to get a full picture of corporate interests.
Further, a common assumption in the literature on lobbying is that associations tend to represent smaller companies that need to pool resources, while the very largest companies can lobby by themselves.Footnote 53 However, this paper has added a potentially important reason why even the largest companies can have strong incentives to lobby collectively: shielding their reputation. This also speaks to the long-standing debate on whether lobby organizations need to provide private side-payments to retain membership. As the paper has shown, association lobbying itself can have important private benefits of reputation management. Such anonymity may be all the side-payment associations need to provide to their large members.
Supplementary material
The supplementary material for this article can be found at https://doi.org/10.1017/bap.2025.14
Acknowledgements
I thank Michael Tomz, Kenneth Scheve, Judith Goldstein, Rebecca Perlman, Robb Willer and members of the Stanford Philanthropy and Civil Society Seminar, APSA 2022, EPSA 2023, EPG 2023 and the Max Planck Workshop for Women in Political Economy 2023 for their feedback on the research design and earlier drafts of this paper. I further thank the Stanford University Graduate Student Opportunity Fund and the Leiden University Institute of Political Science for generously funding the survey work presented in this paper.
Competing interests
The author declares that they have no known competing financial interests or personal relationships that could have appeared to influence the work reported in this paper.
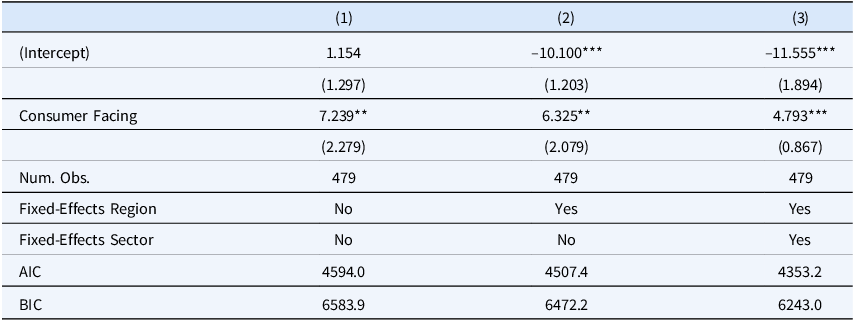
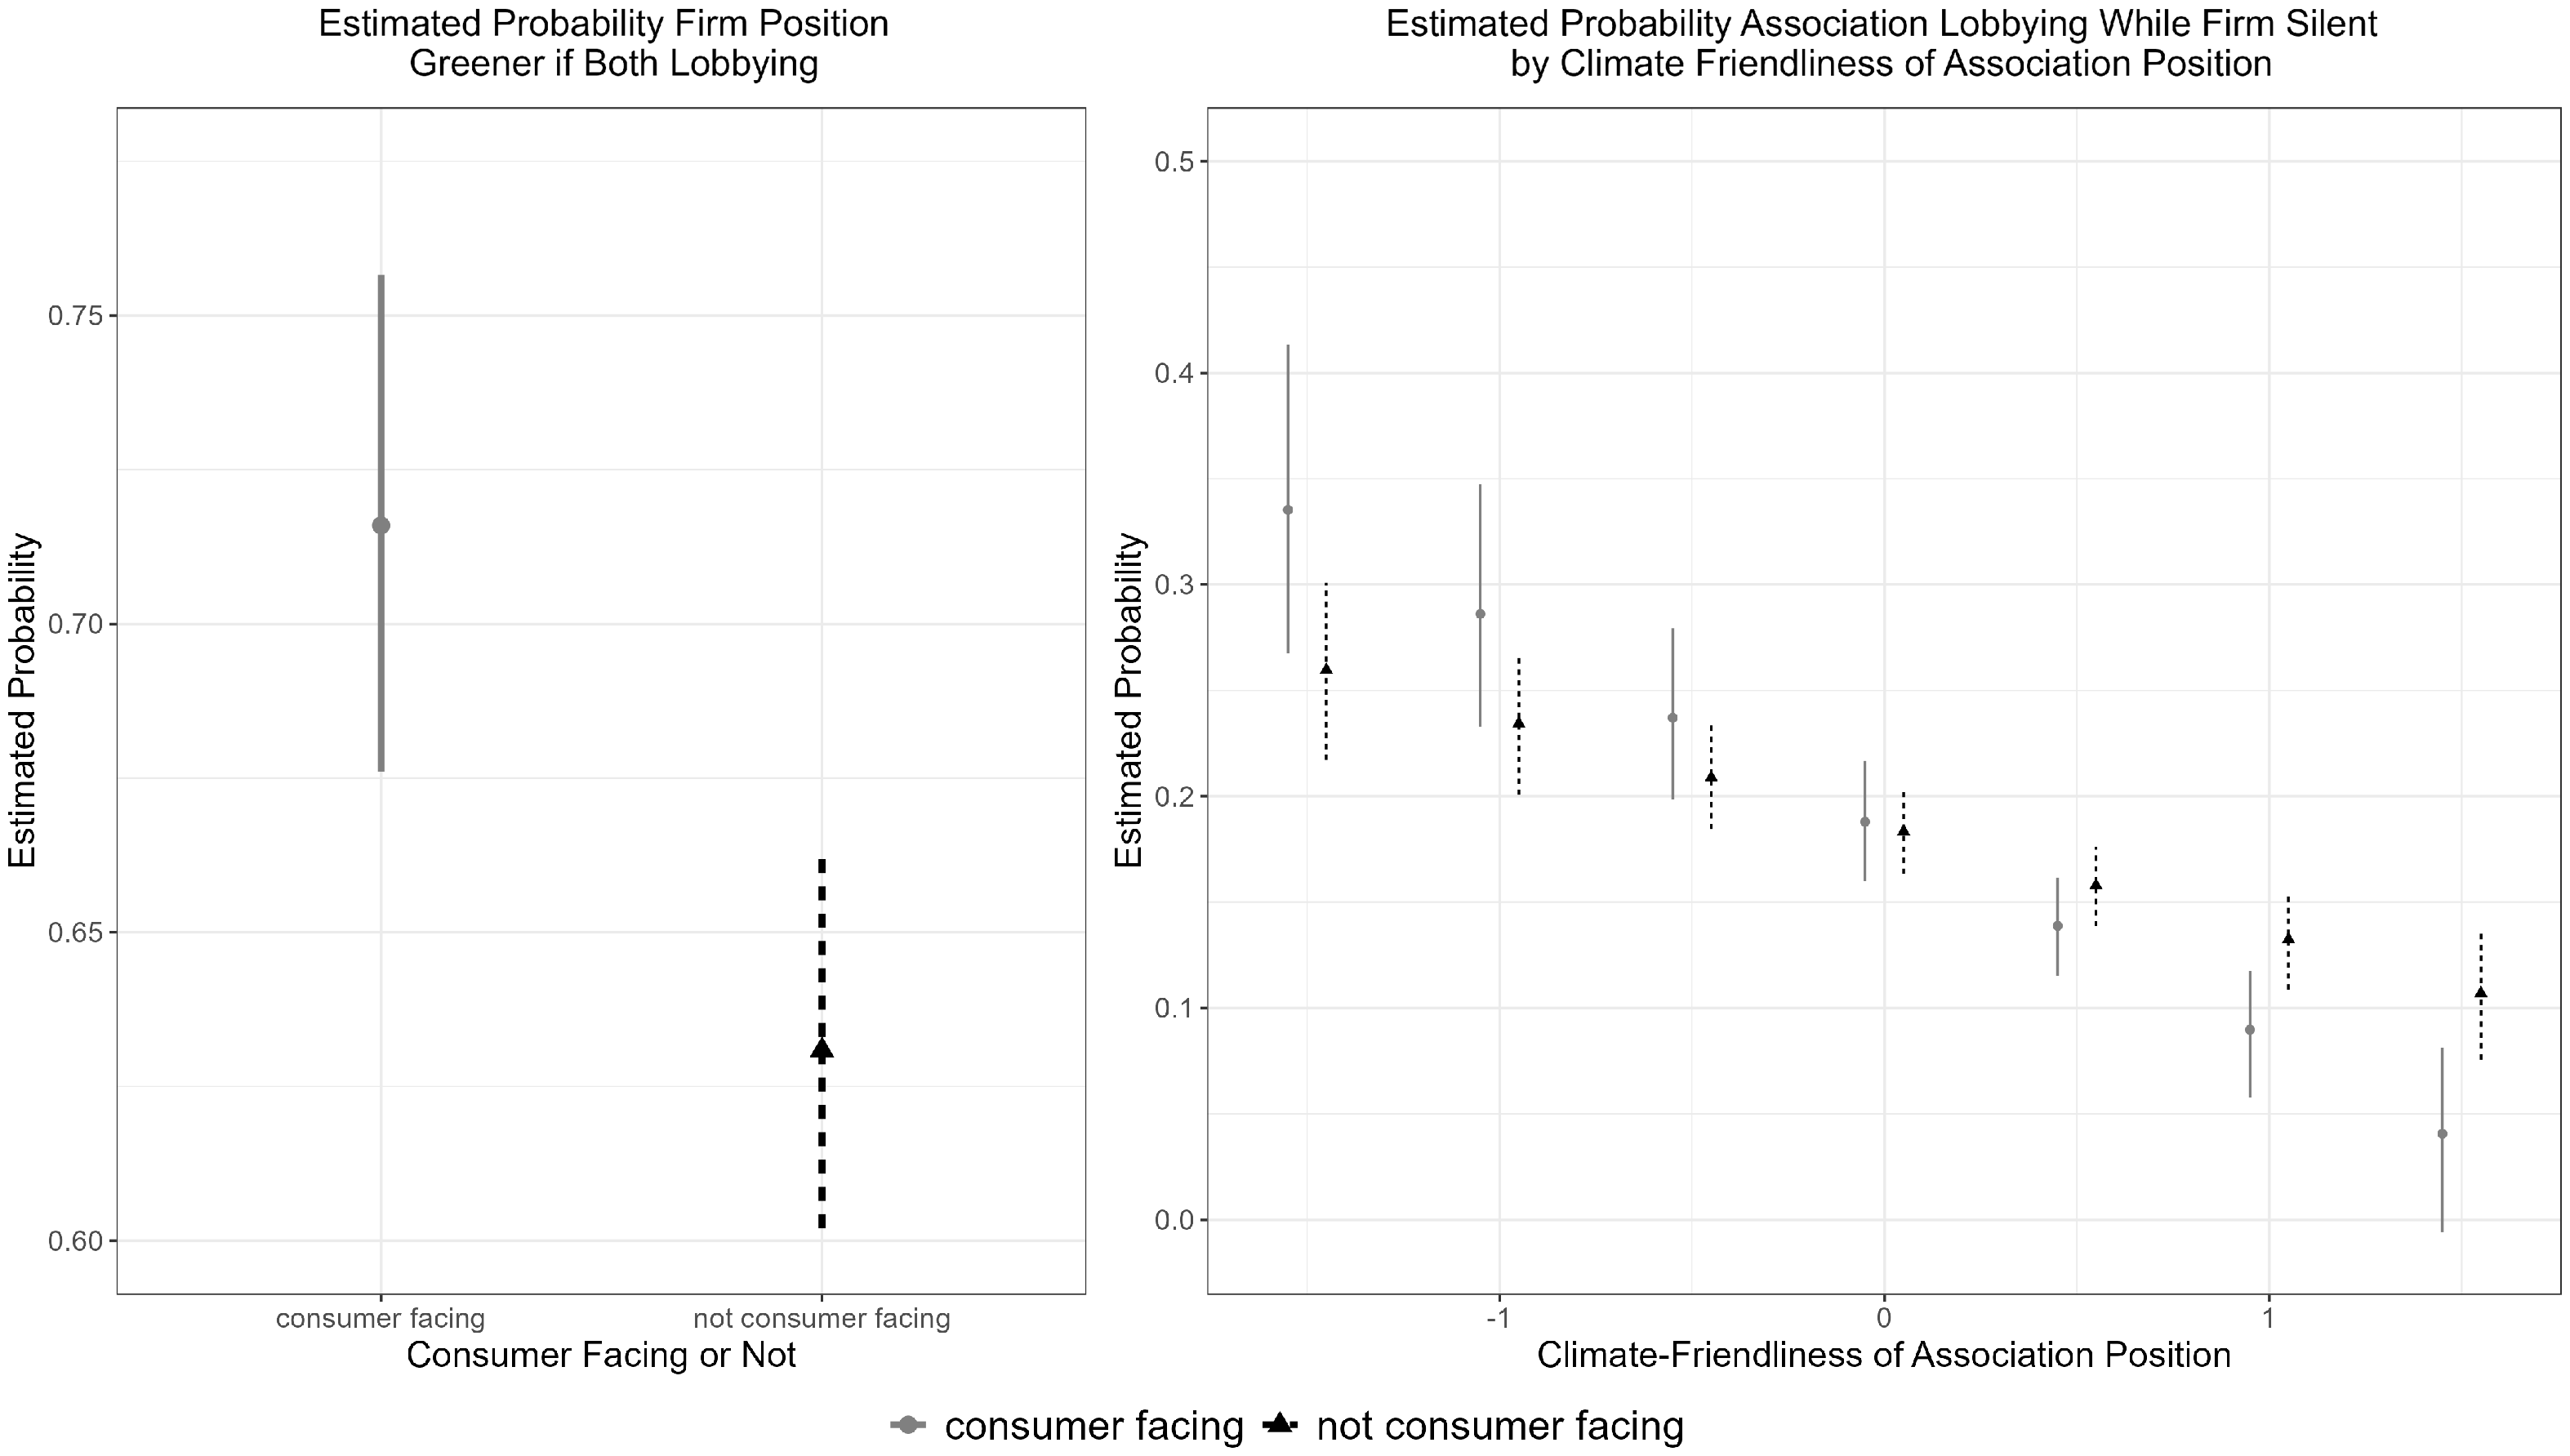
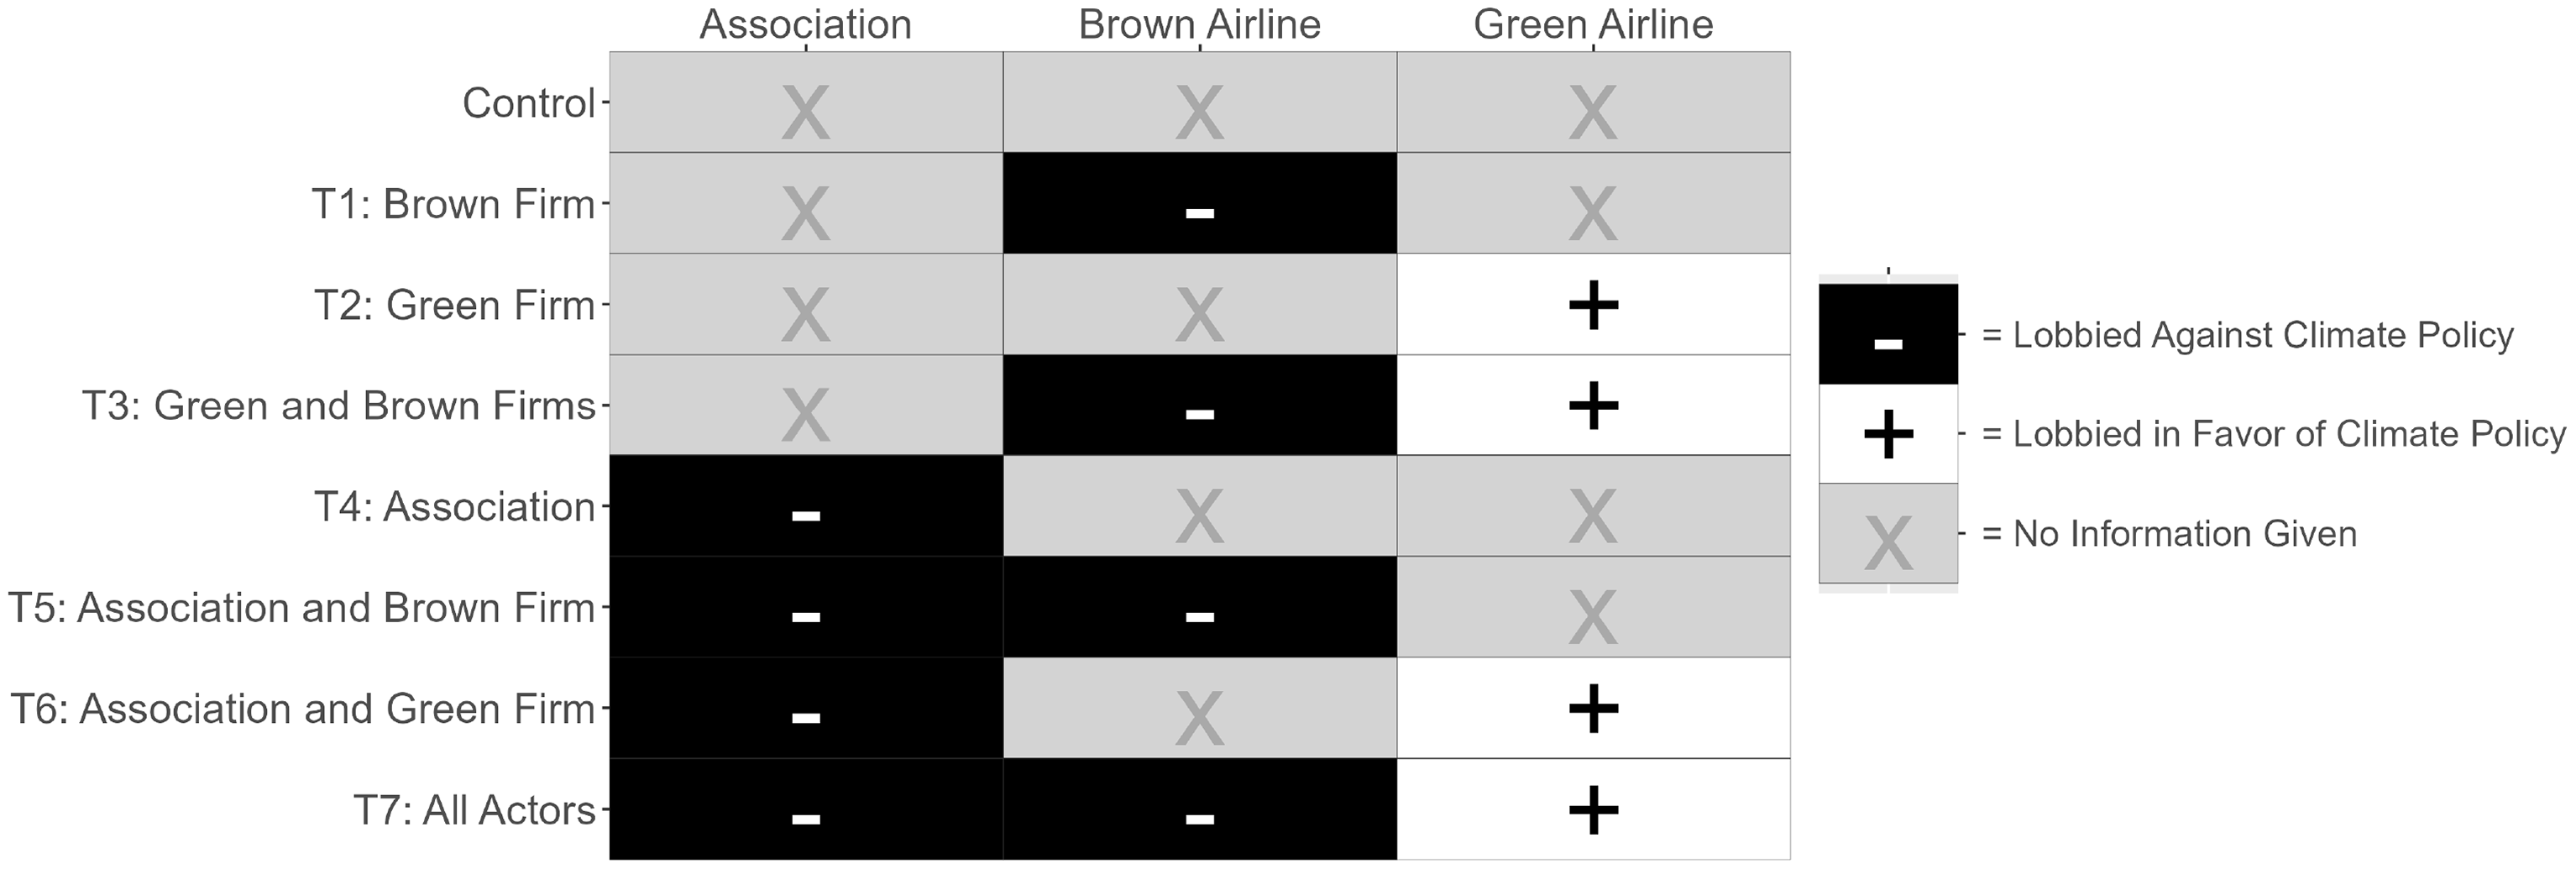
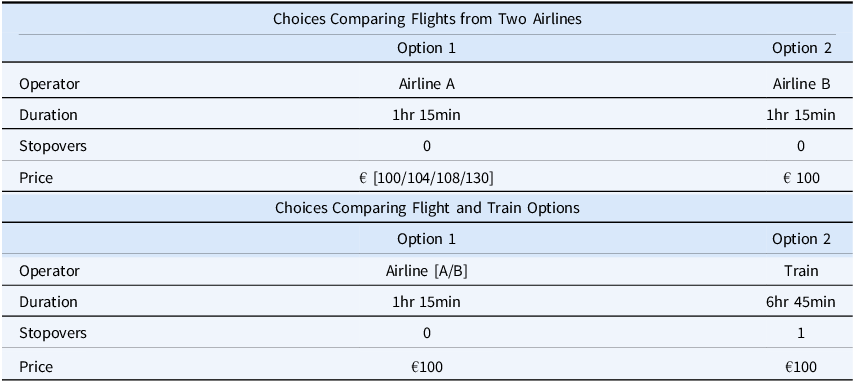


 Open access