


1. Introduction
Engineer-To-Order (ETO) companies often evolve around accumulated know-how and local practices. As they scale, the need to standardise product definition intensifies; engineering, manufacturing, procurement, and service all depend on an accurate Bill Of Materials (BOM) to say what the product is (Reference Wang, Liu, Bai and XiaoWang et al., 2023). The literature mentions many BOM setups, like multiple BOMs across the lifecycle [e.g. Engineering BOM (EBOM), Manufacturing BOM (MBOM), Service BOM, Assembly BOM], single integrated BOMs exposed via role-based views, dynamic order-specific BOMs, and hybrids (Reference He, Ni, Ming, Li and LiHe et al., 2014; Reference Jung, KIm, Choi, Choi, Marjanovic, Storga, Pavkovic and BojceticJung et al., 2014; Reference Lee, Kim and LeeLee et al., 2012; Reference StoltStolt, 2023), these can be organized into two practical classes for selection: (i) a single-source/enterprise BOM with enforceable views, and (ii) a traditional separated EBOM–MBOM setup with explicit transformation and synchronization.
ETO characteristics make the BOM setup choice highly consequential: high interface variety, late design freeze, frequent engineering changes, stringent compliance and traceability requirements (Reference StekolschikStekolschik, 2017; Reference Zhao, Wei, Ren, Cai and ZhangZhao et al., 2024). Poor fit of BOM setup manifests; as unclear items, wrong quantities/levels, shop-floor rework, traceability gaps, and heavy Product Lifecycle Management (PLM) - Enterprise Resource Planning (ERP) reconciliation effort (Reference Hu, Barwasser, Werner, Schuseil, Lentes, Hertwig and ZimmermannHu et al., 2023). While the literature describes BOM types, their intended use, new innovative BOM structures and ways to visualize them (Reference Zhu, Cheng, Xue and ZhangZhu et al., 2007), it offers limited guidance on how to decide which setup fits a given ETO context. Companies often inherit historical patterns in the way of working and then compensate with manual coordination (Reference Wang and YuanWang & Yuan, 2010). Decision frameworks exist for selecting the right product platforms/configurators setup (Reference Zhao and HvamZhao & Hvam, 2024), but they do not operationalize BOM setup selection across portfolio contexts and governance constraints (Reference Chatras, Giard and SaliChatras et al., 2016).
This paper addresses this gap by proposing a Focus Identification Model (FIM), a lightweight, tool-agnostic method that turns an open-ended debate into a structured selection process. The model consists of four steps (i) Clarify the relevant option set for the portfolio, (ii) Profile context drivers like variant breadth, non-standard share, multi-site, localization intensity, supplier multiplicity and alternates, traceability, compliance depth, BOM transition error surface, lifecycle volatility (rate of change), data governance, and IT capability, (iii) Apply a weighted decision-question bank that makes trade-offs explicit and (iv) Converge on a go-to setup paired with operating rules.
The use of the FIM creates a set of artefacts, a driver heatmap, a decision matrix, and a governance card.
This paper has three contributions. First, by providing a common language and a repeatable identification process for selecting a BOM setup in ETO context, explicitly linking context drivers to a recommendation and governance. Secondly, by calibrating the model with two contrasting industrial contexts (a capital goods manufacturer with site adaptations and a custom laser manufacturer with configurable modules), showing how different driver profiles lead to different go-to setups without changing enterprise systems priorities. Thirdly, by treating the BOM setup as a governance choice, helping mixed portfolios adopt the right setup with less friction.
The paper is structured as follows. Section 2 presents the literature study and identifies the gap. Section 3 outlines the method and the two industrial contexts used to calibrate the model. Section 4 details the FIM and its artefacts. Section 5 applies the model to the business cases. Section 6 discusses and concludes the paper.
2. Literature review
2.1. BOM fundamentals and ETO context
The BOM is the central product definition artefact linking engineering, manufacturing, procurement, and service domains (Reference Wang, Liu, Bai and XiaoWang et al., 2023). ETO environments are characterized by late design freeze, high product variety, and project-centric delivery, BOMs evolve dynamically over the lifecycle (Reference Lee, Kim and LeeLee et al., 2012; Reference Zhao, Wei, Ren, Cai and ZhangZhao et al., 2024). Unlike in Configure-To-Order (CTO) industries, where BOMs are often stable and modular, BOMs in ETO environments must accommodate frequent engineering changes, compliance-driven requirements, and site-specific adaptations (Reference McKendry, Whitfield and DuffyMcKendry et al., 2022).
ETO’s late customer order decoupling point (Reference Hvam, Mortensen and RiisHvam et al., 2008; Reference Rudberg and WiknerRudberg & Wikner, 2004) means that engineering and manufacturing structures cannot be fully frozen before order intake. This creates governance challenges such as ownership, efficiency, and handover (Reference Gann and SalterGann & Salter, 2000) that directly influence which BOM setup is most appropriate.
2.2. BOM variants and structural models
The literature describes a wide range of BOM structures addressing different lifecycle and integration needs. This papers is focusing on the following BOM types, including separated EBOM-MBOM approaches used in PLM-ERP integrations (Reference He, Ni, Ming, Li and LiHe et al., 2014; Reference Hu, Barwasser, Werner, Schuseil, Lentes, Hertwig and ZimmermannHu et al., 2023), integrated or enterprise BOMs that rely on role-based views (Reference Lee, Kim and LeeLee et al., 2012; Reference StoltStolt, 2023), configurable (Reference Hegge and WortmannHegge & Wortmann, 1991; Reference Jianxin, Tseng, Ma and ZouJianxin et al., 2000) and composite BOMs (Reference Zhou, Liu, Xue, Bo and LiZhou et al., 2018) for managing high product variety, lifecycle-wide master BOMs (Reference StoltStolt, 2023), and more recent graph-based models proposed to improve flexibility and cross-domain integration (Reference Hu, Barwasser, Werner, Schuseil, Lentes, Hertwig and ZimmermannHu et al., 2023). Innovations such as dynamic BOMs (Reference Zhu, Cheng, Xue and ZhangZhu et al., 2007) and attribute-driven BOM generation (Reference Matías, García, García and IdoipeMatías et al., 2008) further expand the design space. All these structures can be grouped into two practical classes for selection and governance:
-
• Class A - Single-source BOM with views. One enterprise BOM is the single source of product data; different stakeholders (engineering, manufacturing, service) access role-based views without physically splitting structures. The promise is “one truth with filtered perspectives.”
-
• Class B - Multiple separated BOMs, such as EBOM-MBOM. Engineering maintains an EBOM expressing design intent, manufacturing maintains an MBOM expressing how the product is built (sequence, plant/local content, consumables, alternates), and synchronisation rules keep them aligned. Separation adds governance clarity where processes diverge.
However, most studies focus on defining and managing a single chosen structure rather than on how to select between these two classes.
2.3. Governance, synchronization, and change management
Across BOM setups, factors like governance, ownership, effectiveness policy, and synchronisation, are as critical as BOM structure. Poor alignment between EBOM and MBOM can lead to not clear items, rework, and heavy reconciliation effort (Reference Hu, Barwasser, Werner, Schuseil, Lentes, Hertwig and ZimmermannHu et al., 2023; Reference Huang, Yee and MakHuang et al., 2003).
Prior research addresses governance challenges through EBOM–MBOM transformation methods (Reference Hanchuan, Xiaofei and DechenHanchuan et al., 2008; Reference He, Ni, Ming, Li and LiHe et al., 2014; Reference Wang, Liu, Bai and XiaoWang et al., 2023), lifecycle-wide integration across multiple BOM types (Reference Wang and YuanWang & Yuan, 2010), change propagation mechanisms (Reference He, Ni, Ming, Li and LiHe et al., 2014; Reference Wang and YuanWang & Yuan, 2010), and PLM–ERP synchronization approaches aimed at reducing BOM errors and reconciliation effort (Reference Lee, Leem and HwangLee et al., 2011; Reference Ming, Yan, Wang, Li, Lu, Peng and MaMing et al., 2008). ETO-specific governance issues are amplified by long lead times, compliance traceability, and frequent design changes (Reference Koskinen, Mustonen, Harkonen and HaapasaloKoskinen et al., 2020; Reference SrinivasanSrinivasan, 2011).
2.4. ETO-specific BOM challenges
ETO/CTO companies face some general pain points. Some of those are presented below:
-
• Evolutionary nature of BOMs: Structures and content change across design phases, requiring versioning and effectivity management (Reference Lee, Kim and LeeLee et al., 2012).
-
• Multiple stakeholders: Engineering, manufacturing, supply chain, and service have differing needs and BOM views (Reference Hicks and McGovernHicks & McGovern, 2009; Reference Wang and YuanWang & Yuan, 2010).
-
• Data ownership and handover: Misaligned responsibilities cause delays and inconsistencies (Reference Hu, Barwasser, Werner, Schuseil, Lentes, Hertwig and ZimmermannHu et al., 2023).
-
• Mixed Customization Setup: Companies might have a combined ETO, CTO product setup, which complicates the product standardisation (Reference Zhao and HvamZhao & Hvam, 2024).
Some decision-support frameworks exist for product platform/configurator scope (Reference Zhao and HvamZhao & Hvam, 2024), but they do not address the choice of product structure/BOM setup and its impact on governance and IT constraints.
2.5. Gaps in BOM setup selection guidance
The reviewed literature documents a wide range of BOM structural innovations, EBOM–MBOM transformation and integration mechanisms, and ETO-specific adaptations, but largely assumes that the BOM setup itself is given rather than a decision variable. However, what is missing is a context-driven selection process: a way to match organisational drivers, such as product complexity, compliance, customer order decoupling point, supplier integration, and IT capability, to a fit-for-purpose BOM setup and or optimised within a single paradigm, leaving ETO companies to rely on historical patterns and ad-hoc debate (Reference StarkStark, 2020; Reference Sudarsan, Fenves, Sriram and WangSudarsan et al., 2005).
3. Method
3.1. Research approach and industrial context
This study follows a constructive, design-oriented research approach. The goal is to build a practical decision-support tool, the FIM, that helps ETO companies choose between two BOM setup classes (single-source with views vs. separated EBOM-MBOM with explicit transformation and synchronisation).
Rather than testing a pre-defined hypothesis, (i) the decision problem and requirements were framed, (ii) the model was constructed (drivers, question bank, scoring logic and artefacts), and (iii) the evaluation happened from the material of two industrial contexts. The tool is a method, not a software tool, so the evaluation focuses on decision usefulness, transparency, and governance fit, rather than algorithmic performance. The FIM is applied to a defined decision scope, rather than as a universal corporate mandate. The scope may be defined at (i) enterprise or portfolio level, (ii) per plant or value stream, or (iii) per product family or module. The resulting recommendation should be interpreted as valid for the defined scope only. If manufacturing plants differ structurally (e.g., different kits, routings, or branch logic), the model must be applied at plant level, or the level of plant heterogeneity must be reflected explicitly in the driver assessment.
To ensure relevance under differing conditions, by using two contrasting company contexts as calibration touchpoints and data sources but not test beds:
-
• A capital-goods manufacturer combining standardised platforms with site-dependent adaptations.
-
• A custom laser manufacturer, delivering configurable modules with compliance-critical items (e.g., labels/firmware).
These contexts were used to assess the importance of drivers, refine questions, and determine whether the resulting recommendations and governance rules are credible given the documented constraints.
3.2. Data collection and analysis procedure
The data were collected and synthesised from the three following sources:
-
1. Literature synthesis on BOM structures, governance/effectivity, and PLM-ERP synchronization to derive a candidate option set, driver list, and initial decision-question bank.
-
2. Document review from both companies (item/BOM policies, release workflows, PLM-ERP interface notes, compliance procedures, exemplar BOMs).
-
3. Targeted stakeholder conversations (clarifications with engineering, manufacturing, procurement, PLM) to validate terminology and pain points.
Using this data, the following steps were developed to produce the FIM and are outlined below:
-
1. Driver extraction and consolidation. Guided by the thirteen lifecycle-spanning BOM management requirements identified by Reference MortensenMortensen (2026), the initial list was reduced from thirteen factors to seven drivers explaining when each BOM setup class fits ETO/CTO contexts. The remaining six factors were deemed noncritical to BOM setup selection.
-
2. Question bank construction. For each driver, two closed diagnostic questions were formulated to surface the key trade-offs. Items were iteratively refined using literature anchors and company documents to ensure answers are observable and unambiguous.
-
3. Mapping to BOM setup classes. A two-tier mapping was derived from answers to the two BOM setup classes: (i) guardrails (hard rules) that can force or exclude a class (e.g., plant- or sequence-specific structural content, regulated late entries), and (ii) preference scoring (weighted per-class desirability) that ranks the two setup classes; ties are broken by the governance readiness (ownership clarity, PLM-ERP capability).
-
4. Artefact packaging. The model outputs have three artefacts: a driver heatmap, a decision matrix (questions, answers, weights, per-class desirability and two class totals) and a governance card summarising the selected setup and the associated “how it will work” rules.
-
5. Evaluation (author-led). An evaluation was conducted using real company materials to assess the clarity of terms and questions, convergence toward a concrete setup recommendation, basic sensitivity to driver weight changes, and perceived decision usefulness.
4. Focus identification model
4.1. Deriving the drivers
The driver set was grounded in two inputs:
-
1. The lifecycle-spanning BOM management requirements identified by Reference MortensenMortensen (2026) for complex CTO/ETO environments.
-
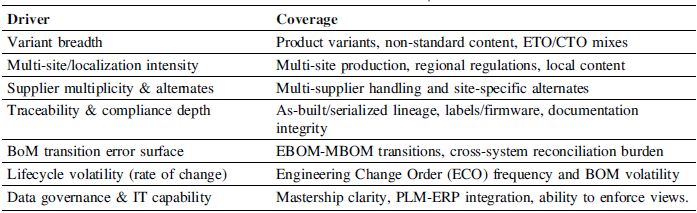
2. A synthesis of relevant BOM literature combined with company documents and example structures. Overlapping or closely related requirements were consolidated into seven drivers that can be assessed in a workshop and that directly support selection between the two BOM setup classes (single-source with views vs. Separated EBOM-MBOM).
Table 1 summarizes how each driver traces back to the underlying requirements.
Drivers traces to the requirements

4.2. Boundary conditions and extensions
The model is intentionally focused on selecting between the two BOM setup classes and does not attempt to model all lifecycle domains exhaustively. Software and firmware are treated as configuration domains; where releases require effectiveness or serialised traceability at delivery, they are captured under the Traceability & compliance depth driver. Component obsolescence is addressed indirectly via Supplier multiplicity & alternates and Data governance & IT capability drivers, particularly where supersession chains and effective governance are required. Service BOMs and “as-maintained” structures were not primary inputs to the industrial contexts used in this study and therefore represent a limitation. However, service requirements typically increase the importance of traceability and governance drivers and can be incorporated without changing the model’s core logic.
4.3. Question set design
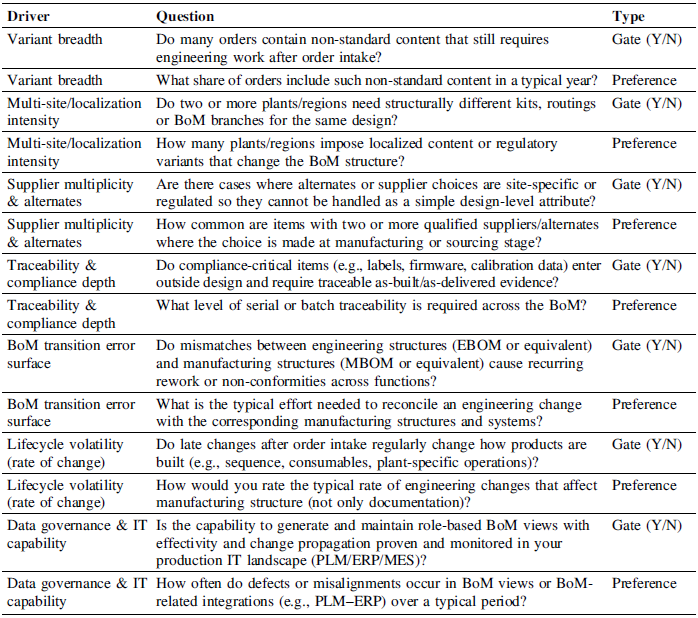
A two-layer question set was used per driver to keep the method auditable and fast to run: closed gate questions (hard constraints) and preference questions (weighted score). Here are the principles for drafting questions:
-
• Questions must be specific and observable: each question targets one fact that can be evidenced by policies, logs, or exemplars (e.g., ECO metrics, site kits).
-
• Questions must be grounded in literature and applicable to the company: questions are drafted using canonical terms from the literature (e.g., EBOM-MBOM, effectivity, alternates) and then lightly reworded to match the vocabulary and document labels of the company piloting the method.
Question bank

4.4. From questions to BOM setup recommendation
The question set is not intended as a survey but as a structured, reproducible decision aid. The connection between answers and the two BOM setup classes is defined as a priori through a fixed mapping from observed conditions to per-class desirability. This mapping is grounded in lifecycle BOM requirements reported by Reference MortensenMortensen (2026) and in documented ETO/CTO governance patterns and is not adjusted during application. For each driver, gate and preference questions are combined into per-class scores using a consistent scoring logic described below:
-
• Gate questions as guardrails: For each driver, the gate question captures conditions under which operating one BOM setup class would be structurally unsafe or infeasible (e.g., plant- specific structural content, regulated late entries, or missing view-generation capability). Gate answers act as hard constraints: if a gate excludes a setup class, that class is marked infeasible and removed from further consideration, regardless of its preference score.
-
• Preference questions as per-class desirability: Preference questions express the degree to which a driver is present (e.g., low to high change frequency, rare to common alternates).
Each preference answer is mapped to an ordinal level (e.g., 1–5). For each driver, a desirability vector
 $${D_q} = \left( {{d_A}\left( q \right),{d_B}\left( q \right)} \right)$$
is defined on a small integer scale (e.g., –2 to +2), where
 $${d_A}$$
and
$${d_A}$$
and
 $${d_B}$$
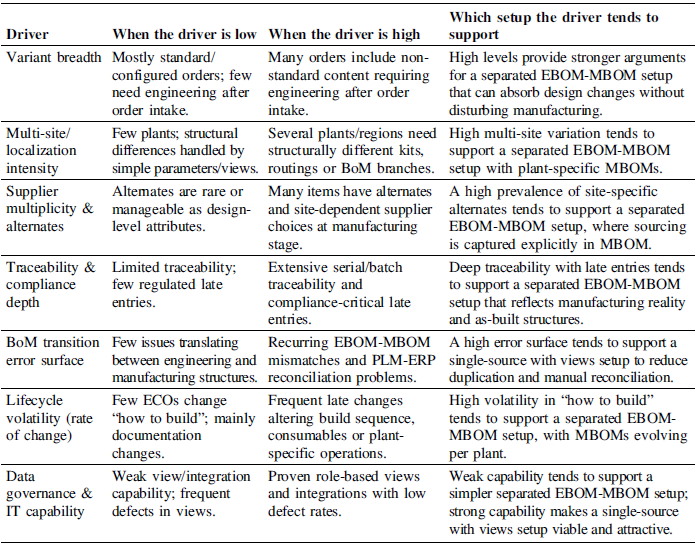
represent how strongly the given answer level supports the single-source with views setup (Class A) and the separated EBOM-MBOM setup (Class B), respectively. The sign and magnitude follow the orientation in Table 3.
$${d_B}$$
represent how strongly the given answer level supports the single-source with views setup (Class A) and the separated EBOM-MBOM setup (Class B), respectively. The sign and magnitude follow the orientation in Table 3.
Weighted aggregation to class scores: Two driver-level scores are computed, one per BOM setup class, by aggregating the desirability contributions of its preference questions weighted within the driver:
 $$S_d^A = \mathop \sum \nolimits_{q \in d} {w_{d,q}}\,{d_A}\left( q \right),{\rm{\;\;}}S_d^B = \mathop \sum \nolimits_{q \in d} {w_{d,q}}\,{d_B}\left( q \right)$$
where
 $${w_{d,q}}$$
is the within-driver weight of question
$${w_{d,q}}$$
is the within-driver weight of question
 $$q$$
. Using the driver weights
$$q$$
. Using the driver weights
 $${W_d}$$
, an aggregation happened across drivers to obtain one total score for each class:
$${W_d}$$
, an aggregation happened across drivers to obtain one total score for each class:
 $${\rm{Scor}}{{\rm{e}}^A} = \mathop \sum \nolimits_d {W_d}\,S_d^A,\;\;{\rm{Scor}}{{\rm{e}}^B} = \mathop \sum \nolimits_d {W_d}\,S_d^B$$
Decision logic. The decision process follows a fixed sequence:
-
1. For each driver, evaluate gate questions and mark infeasible BOM setup classes.
-
2. For all feasible classes, compute weighted preference scores using the predefined desirability vectors.
-
3. Aggregate scores across drivers to obtain one total score per class.
-
4. If both classes remain feasible and scores are equal or near-equal, ties should be broken using the Data governance & IT capability driver.
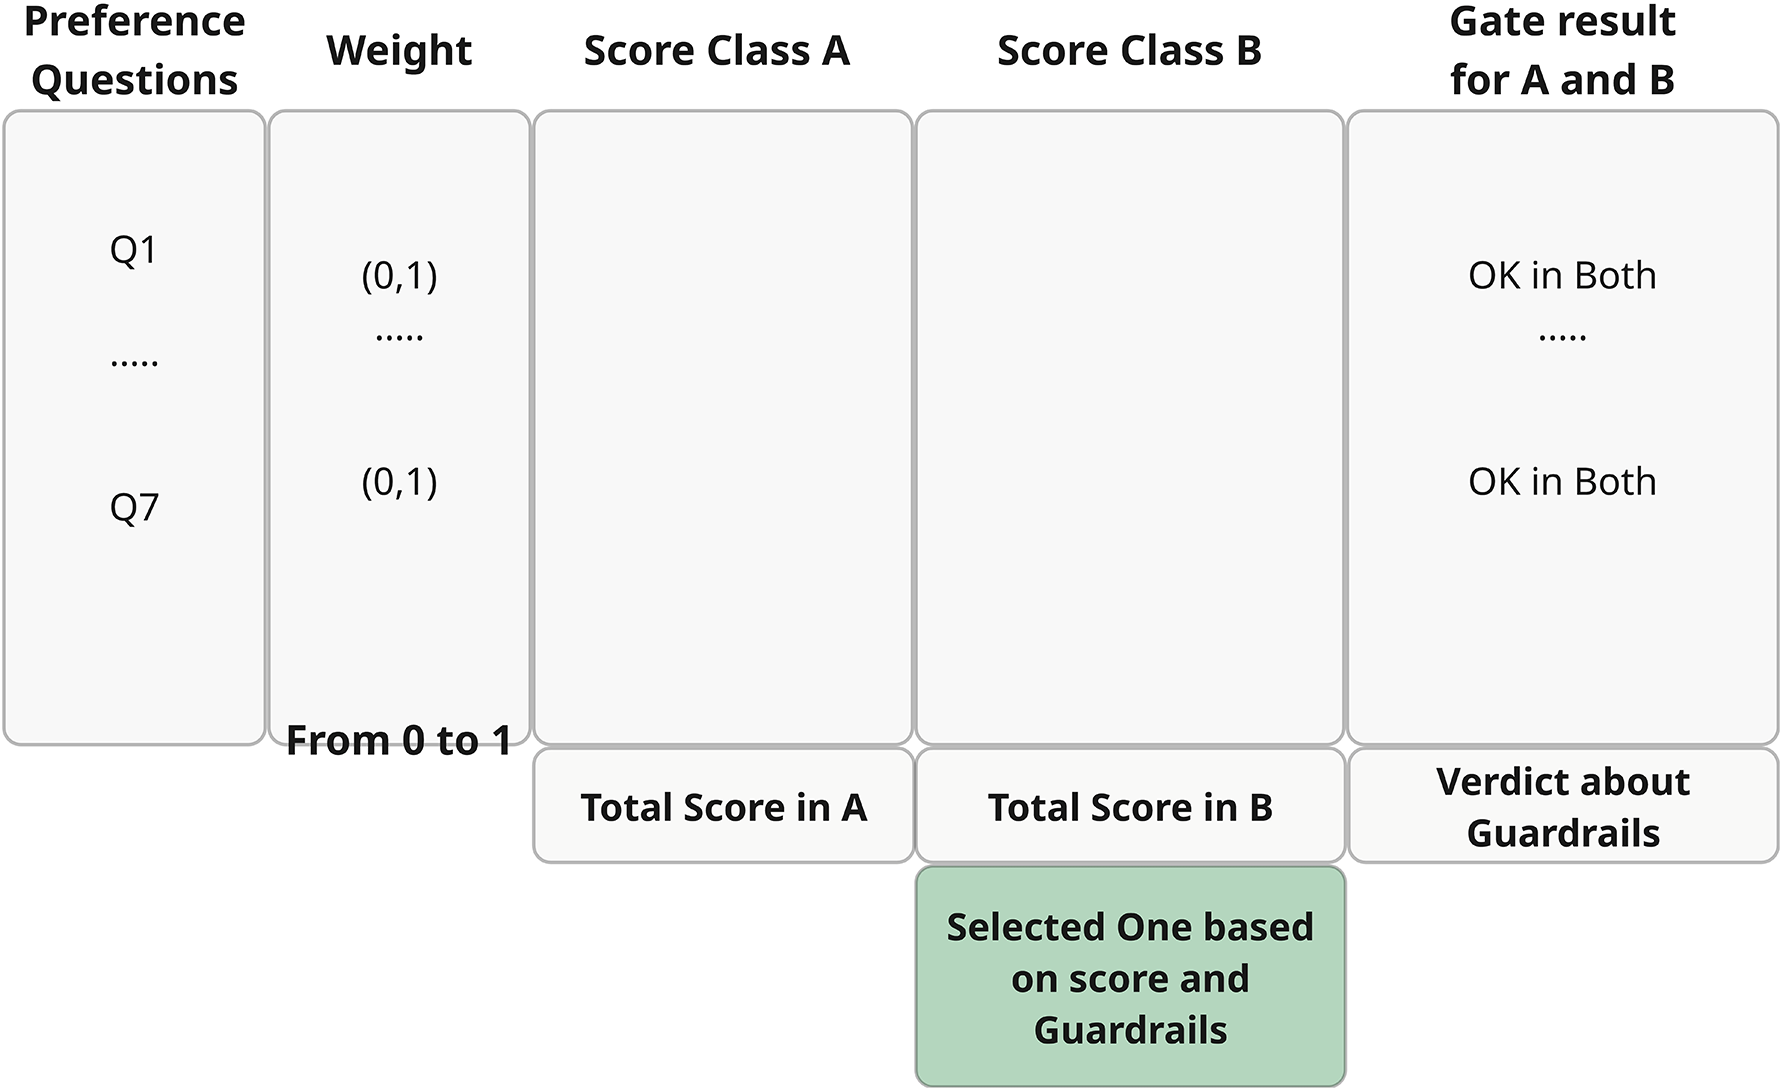
The recommended BOM setup is the feasible class with the higher total score. Figure 1 illustrates the logic of how to go from driver questions to a BOM setup recommendation The dominant drivers and applied guardrails are documented in the decision matrix and summarized in the governance card.
From driver questions to BoM setup recommendation

Table 3 summarises how low and high levels of each driver tend to support either setup.
Driver orientation towards the two BOM setup classes

4.5. Artefacts
The FIM is implemented through three artefacts created in a short cross-functional workshop: a driver heatmap, a decision matrix, and a governance card. Together, they make the reasoning behind the BOM setup recommendation transparent, document the link between the question set, weights and per-class scores, and translate the recommendation into governance rules. The artefacts are not tied to any specific software tool and can be implemented as simple spreadsheets or slide templates.
Figure 2 shows the driver heatmap. Rows correspond to the seven drivers and columns to qualitative levels (e.g., low, medium, high, very high). The heatmap is populated from the question set and basic indicators (ECO statistics, number of plants, traceability scope), providing a one-page overview of the strongest pressures on the BOM setup.
Driver heatmap for BoM setup selection

Figure 3 presents the decision matrix. For each driver, it lists the gate result, the driver weight, the assessed preference answer, and the per-class desirability scores obtained from the vector mapping described in Section 4.3. The bottom row shows the aggregated scores for the “single-source with views” (class A) and “separated EBOM-MBOM” (class B) setup classes. This artefact makes the link from workshop answers and weighing to the recommended setup transparent and auditable and exposes which drivers drove this.
Decision matrix linking drivers, questions, weights and class votes

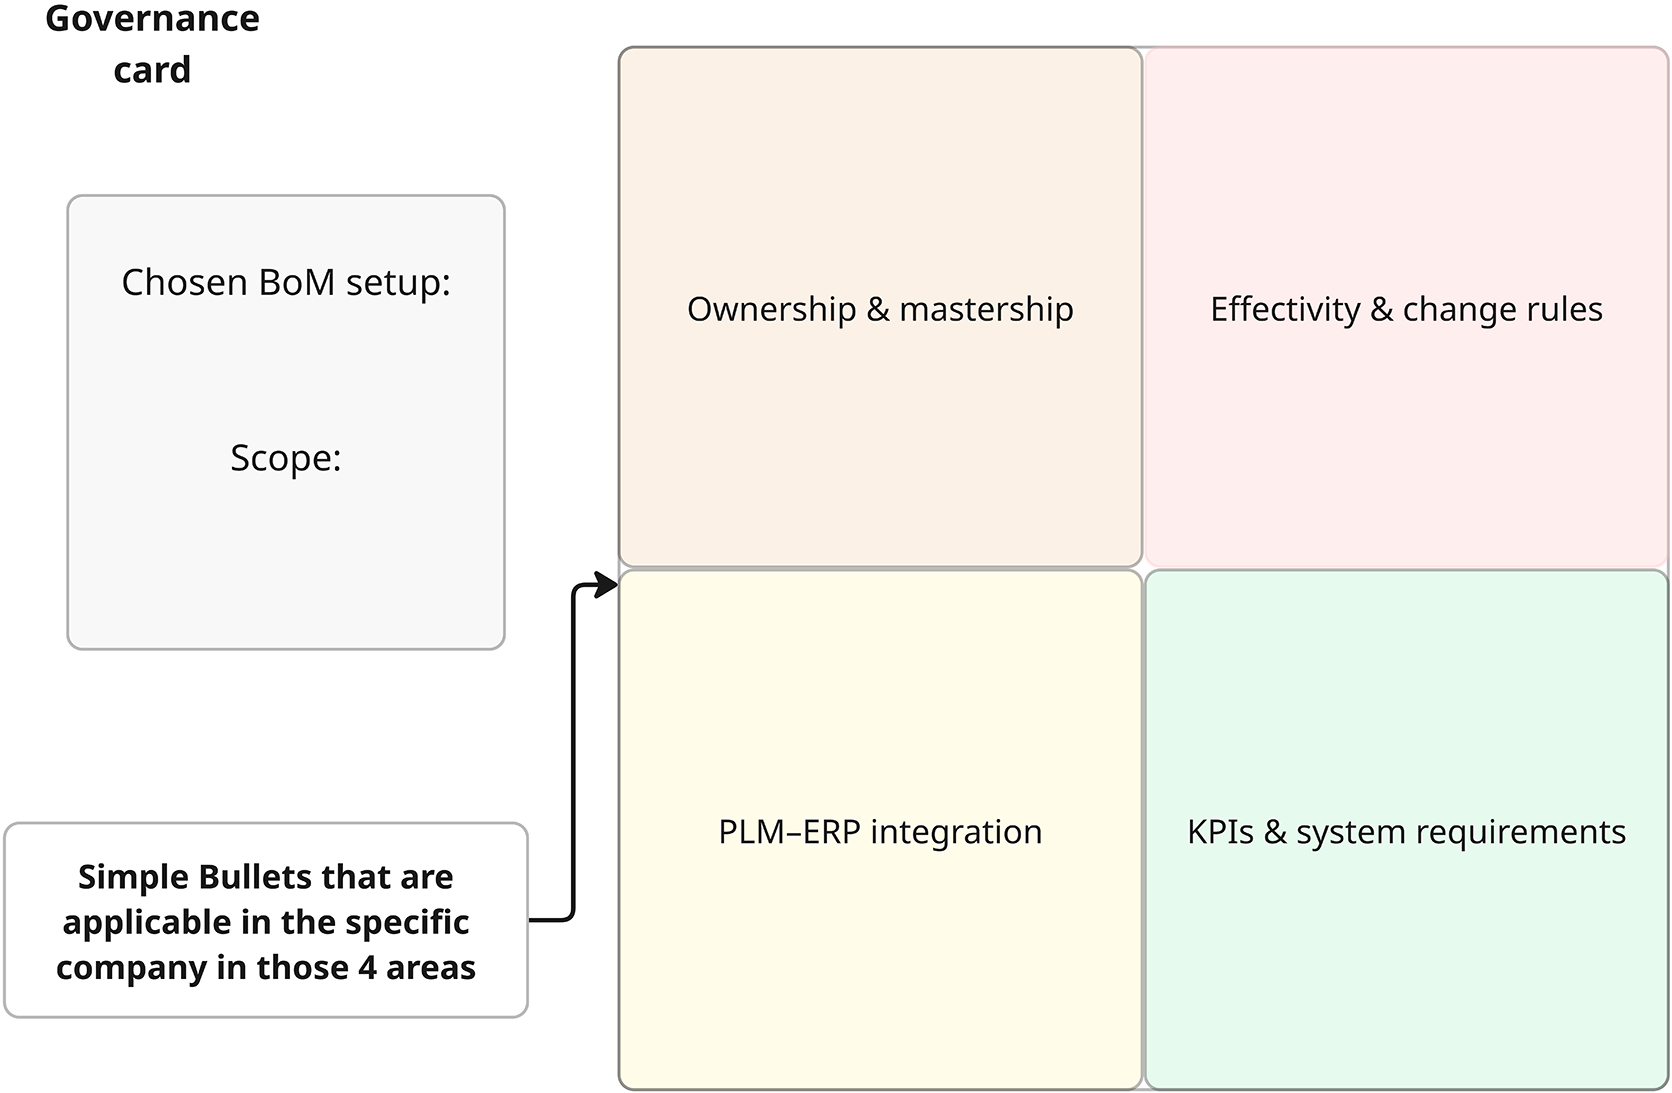
Figure 4 shows the governance card for a chosen BOM setup. It summarises the selected class and scope, ownership, key rules for effectiveness and engineering changes, main PLM–ERP integration decisions, and a small set of Key Performance Indicators (KPIs) and system requirements. The card translates the abstract recommendation into a concise, communicable operating mode.
Governance card for the chosen BOM setup

5. Testing case
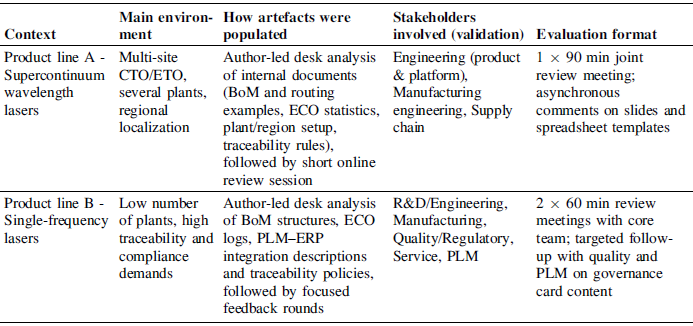
The The FIM was applied for validation in an industrial context. The validation happened in two completely different product lines in the custom laser manufacturing company. In this industrial context, the model was applied through an author-led desk analysis supported by short validation sessions with key stakeholders. The heatmap, decision matrix and governance card were populated using real data (ECO statistics traceability rules) and then reviewed with representatives from engineering, manufacturing, supply chain, quality/compliance PLM. While the detailed results cannot be shown for confidentiality reasons, Table 4 summarises how the artefacts were created (data sources, workshop format, and artefacts produced) and which roles were involved in each company.
Across both product lines, the resulting recommendations were judged as credible and aligned with ongoing internal discussions about BOM setup. In the first product line, the model pointed to a separate EBOM-MBOM setup with plant-specific MBOMs, consistent with the existing multi-site complexity and localisation needs. In the second product line, the model favored a more integrated single-source BOM setup with specific views, reflecting relatively fewer plants but an provided a structured way to challenge or confirm the current direction without forcing a binary “right/wrong” verdict. The scoring logic and desirability mappings were defined prior to application and were not adjusted to fit the observed outcomes.
Testing procedure and stakeholder involvement in the two industrial contexts

6. Conclusion
This paper introduced a FIM to support ETO/CTO companies in selecting between two fundamentally different BOM setups: a single-source BOM with role-based views and a separated EBOM-MBOM structure with explicit transformation and synchronisation. Grounded in lifecycle-spanning BOM requirements and consolidated into seven practical drivers, the model operationalises the decision through a small question set and three artefacts: a driver heatmap, a decision matrix and a governance card. Application in an industrial context comparing two completely different product lines shows that the approach can be implemented with modest effort, yields recommendations practitioners perceive as credible, and helps make assumptions about BOM use, governance and IT capability explicit. Rather than prescribing a universal “best” BOM structure, the model offers a transparent way to explain why a given setup is appropriate for a particular context and what governance implications follow. The work is limited by the small number and the qualitative evaluation; future studies should apply the model to additional companies, refine the scoring scheme, and investigate how setup choices affect BOM quality, change handling, and downstream engineering and manufacturing performance over time.



 Open access

