

INTRODUCTION
The study of the Neolithic transition around the Mediterranean has given rise to a long-standing debate about the key drivers of change, involving explanations largely rooted in cultural diffusion theory and differentially emphasizing demic and/or indigenous components. Building on the pioneer work of Anmerman and Cavalli Sforza (Reference Ammerman and Cavalli-Sforza1984), current literature presents research on the Neolithic spread at both pan-Mediterranean and regional scales, assessed against various compilations (filtered or unfiltered) of available radiocarbon datasets (Zilhao Reference Zilhão2001, Reference Zilhão2011; Manen and Sabatier Reference Manen and Sabatier2003; Fort Reference Fort2012; Bernabeu and Martí Reference Bernabeu Aubán and Martí2014; Isern et al. Reference Isern, Fort, Carvalho, Gibaja and Ibañez2014).
The great increase in the number of radiocarbon (14C) dates in recent years, together with the more accurate selection of samples—thanks to advances in accelerator mass spectrometry (AMS) techniques and the introduction of filters to control the quality of the samples—is providing a more robust chronological framework to support this work. This is the case in Iberia, where a notable growth of 14C dates supplies the basis for exploring alternative hypotheses proposed to account for the spread of farming using Bayesian models for understanding the timing of the Neolithic transition.
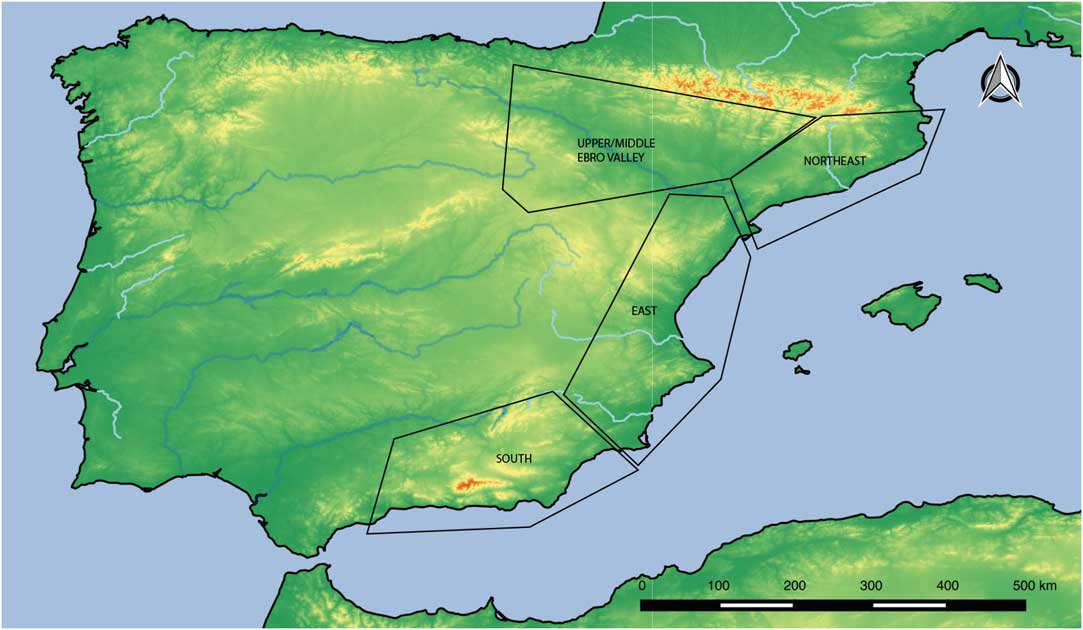
In this paper, we use Bayesian chronology models to evaluate the dual model suggested to explain the appearance of the Neolithic in the Valencia region—the Eastern Mediterranean area of the Iberian Peninsula (Figure 1; Bernabeu Reference Bernabeu Aubán2002; Juan Cabanilles and Martí Reference Juan Cabanilles and Martí2002; Bernabeu and Martí Reference Bernabeu Aubán and Martí2014). The dual model combines demic spread of Neolithic farmers with the possibility of contact between Neolithic settlers and Mesolithic groups in a way similar to what has been proposed in northern Europe (Zvelevil and Rowley Conwy Reference Zvelebil and Rowley Conwy1986). The scenario postulates the coexistence of some pioneer Neolithic settlers with the Final Mesolithic groups in different territories during an indeterminate temporal interval.
Map of Iberia showing the regions discussed.
To test this model, we built a Bayesian framework with accurate 14C dates taken from a carefully assessed archaeological context. We use the Bayesian chronological models that have been created by OxCal developers (Bronk Ramsey Reference Bronk Ramsey2000, Bronk Ramsey Reference Bronk Ramsey2009). As a complementary approach, we have used summed 14C probability distributions (SCDPD) to observe fluctuations in population dynamics following assumptions well explained in several key contributions (Shennan and Edinborough Reference Shennan and Edinborough2007; Shennan et al. Reference Shennan, Downey, Timpson, Edinborough, Colledge, Kerig, Manning and Thomas2013). We filtered the 14C dataset in order to produce a more accurate chronology that allows us to distinguish economic patterns (foragers or producers) within a well-defined chrono-cultural context.
As a first step, we compiled all the available 14C data, and then selected only single fragment samples from short-life plant and animal taxa to include in the analysis. Within the general area of Mediterranean Spain, we examine the evidence from several sub-regions in order to compare chronological models at different geographical scales.
Archaeological Background
Mediterranean Iberia is a wide region with a varied terrain of littoral planes and mountainous regions, transected by two main natural corridors for human travel: the Mediterranean coast (N/S) and the Ebro valley (E/W) (Figure 1). With generally temperate weather conditions (though varying by latitude and altitude) charcoal and pollen analyses reveal the progressive increase of forest cover since the beginning of the Holocene period, reflected by the expansion of oak and the upward migration of Pinus sp and Juniperus sp (Carrión et al. Reference Carrión, Fernández, González Sampériz, Gil Romera, Badal, Carrión Marco, López-Merino, López Sáez, Fierro and Burjachs2010). Holocene sea-level rise was a major factor in modifying the littoral landscape. Early Mesolithic settlements are well known, although the evidence is not uniformly distributed, concentrated in some areas and absent from others. The Early Mesolithic lithic industry is based on flakes, with notches and denticulates, and extends over a long period (ca. 8100–6800 cal BC) in the territory between Catalonia, the Ebro valley, and the Valencian region (Alday 2006). Evidence from the Andalusian region is not currently included in this techno-typological complex.
Mesolithic subsistence included a wide spectrum of medium and small mammals, wild plants, and terrestrial and marine mollusks. Although cave and rock-shelter sites are common, an increasing number of open-air sites are being identified, sometimes including necropoli such as El Collado (Aparicio Reference Aparicio2008; Gibaja et al. Reference Gibaja, Subirà, Terradas, Santos, Agulló, Gómez Martínez, Allièse and Fernández-López de Pablo2015). Coincident with the arrival of the Atlantic Period, from the middle of the 7th millennium cal BC, an abrupt change in lithic industries can be observed. They include standardized bladelets employed to make geometric microliths using the microburin technique. Regionally, this is termed the Late/Final Mesolithic or Geometric Mesolithic. Within this tradition, geographic variation is observed, such as the absence of Geometric Mesolithic assemblages in Catalonia (Vaquero and García Argüelles Reference Vaquero Rodríguez and García-Argüelles i Andreu2009) and the scarcity of evidence in Andalusia (Aura et al. Reference Aura Tortosa, Jordá Pardo, García Borja, García Puchol, Badal García, Pérez Ripoll, Pérez Jordá, Pascual Benito, Carrión Marco and Morales Pérez2013). On the other hand, the Ebro valley and the central (Valencian) portion of Mediterranean Spain show an increased number of sites in caves and rock shelters, and open air sites, although not all have been studied nor are all well preserved. Coastal-interior seasonal movement seems to characterize the subsistence strategy in the Valencian region (Martí et al. Reference Martí, JE, Juan-Cabanilles, García Puchol and Fernández2009), while Mediterranean links are evident in the presence of marine shells (Columbella rustica) at several sites located in the upper Ebro valley.
Two main phases can be recognized with some distinctive regional features. In the first phase (second half of the 7th millennium cal BC) trapeze forms predominate among geometrics, whereas triangular forms (Cocina type triangles) are more common in the second phase (first half of the 6th millennium cal BC). Around 5650 cal BC some archaeological deposits first show evidence of domesticates, together with some new cultural material such as pottery, within the Mediterranean Impressed Ware tradition (see Bernabeu and Martí Reference Bernabeu Aubán and Martí2014). Recently, new discoveries indicate the possibility of at least two independent trajectories of Neolithic colonization or influence to the Mediterranean Iberian Peninsula (Bernabeu and Martí Reference Bernabeu Aubán and Martí2014). This new information may also reveal different temporal rhythms in Neolithic expansion, as well as possible different routes (Manen et al. Reference Guilaine and Manen2007, García Borja et al. Reference García Borja, Aura Tortosa, Jordá Pardo and Salazar García2014). As we show below, several chronological patterns can be observed in relation to the transition to farming throughout this large area, and we explore their possibilities by applying SCDPD and Bayesian chronological models.
MATERIAL AND METHODS
Assessment of 14C Dataset
As stated above, we compiled all available 14C data for Iberia between 7650 and 6000 uncalibrated BP (ca. 6600/5000 cal BC). This time span covers the Late/Final Mesolithic and Early Neolithic periods in Mediterranean Iberia. The resulting database was designed to also collect relevant information regarding the spatial and cultural context of each published 14C date. For constructing Bayesian chronological models, we work only with dates taken from short-lived, single-fragment samples, with SD <100, in order to establish a more accurate approximation of the chronology of archaeological deposits (Table 1). Several studies have pointed out the potentially problematic effects of using 14C dates from all contexts for estimating the timing of the Neolithic expansion in the Western Mediterranean (Zilhao Reference Zilhão2001; Bernabeu Reference Bernabeu Aubán, Molina, Díez Castillo and Orozco Köhler2006), particularly the old-wood effect that can produce anomalously older dates. In addition, problems related to the absence of an accurate sample selection protocol have been observed in multi-component sites (Bernabeu et al. Reference Bernabeu Aubán, Barton and Perez Ripoll2001; Bernabeu Reference Bernabeu Aubán, Molina, Díez Castillo and Orozco Köhler2006). We also discarded samples of marine origin because the reservoir effect can be problematic, and fluctuates in relation to space and time (e.g., Ascough et al. Reference Ascough, Cook and Dugmore2005). Given these considerations, we use only short-lived, single-fragment samples (animal bones, human bones, seeds and fruits, bone artifacts, and charcoal identified as coming from short-lived plants), to help control for the possibility of post-depositional disturbance to archaeological deposits. The presence/absence of domestic species at a site constitutes the premise for determining Neolithic or Mesolithic status.
Radiocarbon dates (short-life, singular samples) used to build the chronological models. A: area, PH: phase, GM: Geometric Mesolithic; EN: Early Neolithic.

Table 1 shows the detail of the total number of dates (2016) used here. The start of the Final Mesolithic is taken from the most ancient published date clearly associated with human activity (Cueva de la Cocina Beta-267440, 7610±40 uncalibrated BP: wild goat bone with processing marks). Several dates relating to the end of Mesolithic occupations and the first Neolithic evidence merit special consideration:
Mendandia Ua-34366 (7265±60 BP), level III sup., is from a sample identified originally as aurochs, in a level with pottery but without other domestic elements. Although recent mtDNA analysis of this bone suggests the possibility that it is domestic (Alday 2012), we remain cautious due the absence of any other domesticates at the site. We group this with Mesolithic sites.
Forcas II Beta-247404 (6750±40 BP) and Beta-247405 (6740±40 BP) are from two levels with pottery but without domestic elements, and are therefore also considered as Mesolithic.
Carigüela Col-1565 (6749±39 BP), level XVI—a sample identified as domestic cattle—provides the most ancient Neolithic date in Iberia. This date is part of a series of dates from Neolithic levels recovered from older excavations at this site, which is located in the southern region of Iberia (Mevdev 2013). This series also produced an even older radiocarbon date Coll-1563 (6950, 40) identified as a sheep/goat, but located in a typologically Middle Neolithic level. OxA-1131 (7010±40 BP) is another anomalous date from Carigüela taken from a single sample of a wild horse, from level XV of the older excavations (Carrasco et al. Reference Carrasco, Gámiz, Pachón and Martínez-Sevilla2010). These two earlier dates do not agree with the general chronology of Neolithic expansion elsewhere in the Western Mediterranean. On the other hand, no Mesolithic elements have been identified at the site so far. This suggests a need for a thorough reanalysis of the stratigraphic and archaeological context of the early excavations at the site. For these reasons, we only include Col-1565 in our models.
Peña Larga Beta-242783 (6720±40 BP) comes from a bone identified as domestic sheep/goat from a typologically Neolithic level (together with other domestic animals and pottery) of a site located in the Upper Ebro Valley (Fernández Eraso Reference Fernández Eraso2011). The result is surprising if we consider the oldest expected distribution of early radiocarbon dates from the Mediterranean coast.
Botiqueria GrA-13268 (6040±50 BP) level 6 and GrA-13270 (6240±50 BP) level 8, is associated with two stratigraphical units with impressed pottery separated from a Final Mesolithic level GrA-13267 (6830±50 BP) by a sterile layer (Barandiarán and Cava Reference Barandiarán and Cava2002). No domestic taxa have been recognized, but the assemblage is of small size and poor quality. The presence of triangles and segments with bifacial retouches in units 6 and 8 also suggest late age, in the second half of the 6th millennium cal BC.
A similar case is observed for Abrigo de Ángel 2, Beta-254048 (6390±40 BP) where only two fragments of pottery have been recovered (Domingo et al. 2010), in a similar context with segments and triangles with bifacial retouches characteristic of Neolithic sites. No faunal remains have been found except a few unidentifiable fragments of animal bones.
Valmayor II Beta-341168 (6570±30 BP) and III Beta-341167 (6090±30 BP) date two levels with a significant number of Early Neolithic sherds, and lithic remains similar to those in Botiqueria and Angel 2 (Rojo et al. 2015). But in this case, the faunal remains have been identified as wild species. No domestic seeds have been recovered, despite a well-controlled excavation. Consequently, the authors consider this site as evidence for the acculturation of Mesolithic groups in the area (Rojo et al. 2015).
Botiqueria GrA-13268, GrA-13270, Ángel 2 Beta-254048 and Valmayor Beta-341168, Beta-341167 have been tested alternatively as Mesolithic or Neolithic in the models.
In this paper, we consider the Late/Final Mesolithic as a unit, although archaeological research distinguishes between an early phase where trapezes predominate and a final phase characterised by triangular armatures (Cocina type, similar to Muge type). The same consideration is applied to the Early Neolithic.
We present a dual scale of analysis: macro-regional and regional levels. The macro-regional level comprises a wide coastal region between the Pyrenees and Andalusia, encompassing Catalonia, Valencia, Murcia, and eastern Andalusia; along with the upper and middle Ebro Valley, including the southern Basque Country, Navarra, and Aragon (Figure 1). For the regional level analysis, we have used the major natural corridors mentioned above (Ebro River and the border of the coastal littoral) to divide the region into four main sub-areas. We have designated the areas as northeast (north of the Ebro River in Catalonia), upper Ebro Valley (north of the Aragon Ebro valley, Navarra region, and South Basque country), east (Catalonia south of the Ebro, lower Aragon, and the Valencian Autonomous region), and south/southeast (Murcia and Eastern Andalusia).
Calibration and Phase Modeling
In our analysis, we use Bayesian models as they have been implemented in Oxcal 4.2.4 (Bronk Ramsey Reference Bronk Ramsey2009) to identify the beginning and end of two independent but overlapping phases within the neolithization process: Late/Final Mesolithic and Early Neolithic. The Boundary command identifies an event that has not been directly dated and estimates a probability distribution for its occurrence based on the known dates included in the phases preceeding and following the event (Bronk Ramsey Reference Bronk Ramsey2009). The 14C dates are not ordered stratigraphically, because they derive from different sites. The resulting start and end dates for each phase are presented with 1σ and 2σ ranges similar to calibrated 14C dates. An agreement of 60.0 or higher is considered an acceptable result. We tested two models, using alternative interpretations of the recent 14C dates from Botiquería levels 6 (GrA-13268) and 8 (GrA-13270), Abrigo de Ángel 2 (Beta-254048), Valmayor II and III (Beta-341168 and Beta-341167): as Neolithic (model A) or Mesolithic (model B).
We also examined regional variability in the modeled Mesolithic/Neolithic boundary for the upper/middle Ebro Valley and eastern region. Below, we discuss the chronological distinctions between the two phases (Mesolithic and Early Neolithic) and some problems linked with the differences detected in the regional archaeological contexts (i.e., information gaps).
Building Summed Probabilities Distributions of 14C dates and Sites
With the idea of comparing trends in settlement patterns during the neolithization process, we use a method similar to common summed probabilities that includes a correction for the impact of different numbers of dates for different sites and levels. Alternative proposals for mitigate the impact of sites with multiple radiocarbon dating have been used in other works (Edinborough Reference Edinborough2005; Shennan and Edinborough Reference Shennan and Edinborough2007; Edinborough Reference Edinborough2008; see also Shennan et al. Reference Shennan, Downey, Timpson, Edinborough, Colledge, Kerig, Manning and Thomas2013 for a more refined method). Although an increasing number of archaeological studies use summed radiocarbon probability distributions (SCDPD) as a proxy for studying long-term prehistoric demography (Gamble et al. Reference Gamble, Davies, Pettitt, Hazelwood and Richards2005; Collard et al. Reference Collard, Edinborough, Shennan and Thomas2010; Shennan et al. Reference Shennan, Downey, Timpson, Edinborough, Colledge, Kerig, Manning and Thomas2013), indiscriminate use can present several problems (Bamforth and Grund Reference Bamforth and Grund2012; Williams Reference Williams2012; Combre and Robinson 2014). Nevertheless, some authors have developed robust protocols that allow supporting the use of SCDPD as an indicator for fluctuations in human population levels (Shennan et al. Reference Shennan, Downey, Timpson, Edinborough, Colledge, Kerig, Manning and Thomas2013; Timpson et al. Reference Timpson, Colledge, Crema, Edinborough, Kering, Manning, Thomas and Shennan2014). The assumption of SCDPD analysis is that multiple small, unsystematic samples from a large sample of sites constitute a quasi-random sample of regional occupation trends. In this paper, we consider 14C dates from short-lived and long-lived samples with a standard deviation of less than or equal to 100. We do not demand the same level of reliability as for the chronological model, because to observe trends we assume that an increased number of dates provides more robust results over a wider perspective. We include 14C dates from the beginning of the Holocene until 6000 uncalibrated BP. In all we use a total of 402 dates. We calibrated all the dates using Oxcal Program 4.2.4 and IntCal13 curve for the Northern Hemisphere (Reimer et al. Reference Robb2013) with 1σ (68.2). Then we distributed all dates within intervals of 200 yr. Finally, we selected and summed only one date per site per interval. In the discussion that follows, this is a salient point to add to the explanation over the chronological models constructed.
RESULTS
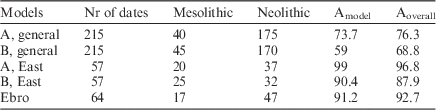
To quote Box (Reference Box1979): “All models are wrong but some are useful.” With that in mind, we try to interpret the results obtained, and to point out several aspects relevant to socioecological dynamics which can be explored through these Bayesian analyses (Whittle et al. Reference Whittle, Healy and Bayliss2011). We test the dual model building different scenarios in several scales of analysis (see Riede and Edinborough Reference Riede and Edinborough2012; Burley et al. Reference Burley, Edinborough, Weisler and Zhao2015). At the macro scale of the analysis, Model A has an acceptable agreement index of 73.7, while Model B has an agreement index of 59 (Table 2, and supplementary material) and consequently it cannot be considered acceptable. Model A considers Botiquería level 6 (GrA-13268) and 8 (GrA-13270), Abrigo de Ángel 2 (Beta-254048) and Valmayor II and III Beta-341168 and Beta-341167 as Neolithic samples. Therefore, in this model we do not consider the absence of domestic elements as a definitive indicator of a Mesolithic occupation.
Bayesian sequence modeled dates from Oxcal 4.2.3 (Bronk Ramsey Reference Cámalich Massieu and Martín Socas2009). Calibration conducted using IntCal13 curve: Northern Hemisphere (Reimer et al. Reference Robb2013).
If this seems to contradict our prior assumptions regarding Neolithic and Mesolithic status (mentioned above), in reality it serves to highlight the temporal distance between the latest Mesolithic 14C date in Botiqueria (GrA-13267, 6830±50) and the first Neolithic dates (GrA13270, 6240±50), and reflects a possible gap in human occupation indicated by the excavators (Barandiarán and Cava Reference Barandiarán and Cava2001). In our opinion these arguments reinforce the results of Model A versus model B. On the other hand, both models present problems with the agreement index for the following dates: Col-1565 (6749±39) and Beta-242783 (6720±40) with an index of 6.2 and 27.4 for model A, and 7 and 30.4 for model B. Treating the date Beta-341167 and Botiquería date GrA-13268 (6040±50) as Mesolithic also fails, with an index of 51.6 and 33.4. Both, Col-1565 (6749±39) and Beta-242783 (6720±40) 14C dates, then, are probably best considered the most ancient dates for Neolithic contexts in Iberia. Col-l565 corresponds to a cattle bone located at the bottom of the Neolithic levels in Carigüela, of the southern region (Mevdev 2013). Unfortunately, no detailed publication is yet available for this interesting cave, which presents one of the most complete assemblage series of impressed pottery in southern Iberia (Navarrete Reference Navarrete Enciso1976; Mevdev 2013). Currently, it is not possible to evaluate the evidence from this site. Recent 14C analyses suggest caution in interpreting certain 14C dates, such as Col-1563 (6950±40) and OxA-1131 (7010±40), due to problems linked with the sample identification (sheep/goat) and/or with the cultural associations of the samples (Mevdev 2013). Alternatively, some problems linked with bone dating protocols could be considered (Wood 2015). While this sample could be associated with pre-Neolithic occupations, we have not yet discarded Col-1565 (6749±39), because it is close in age to other early Neolithic contexts in Iberia.
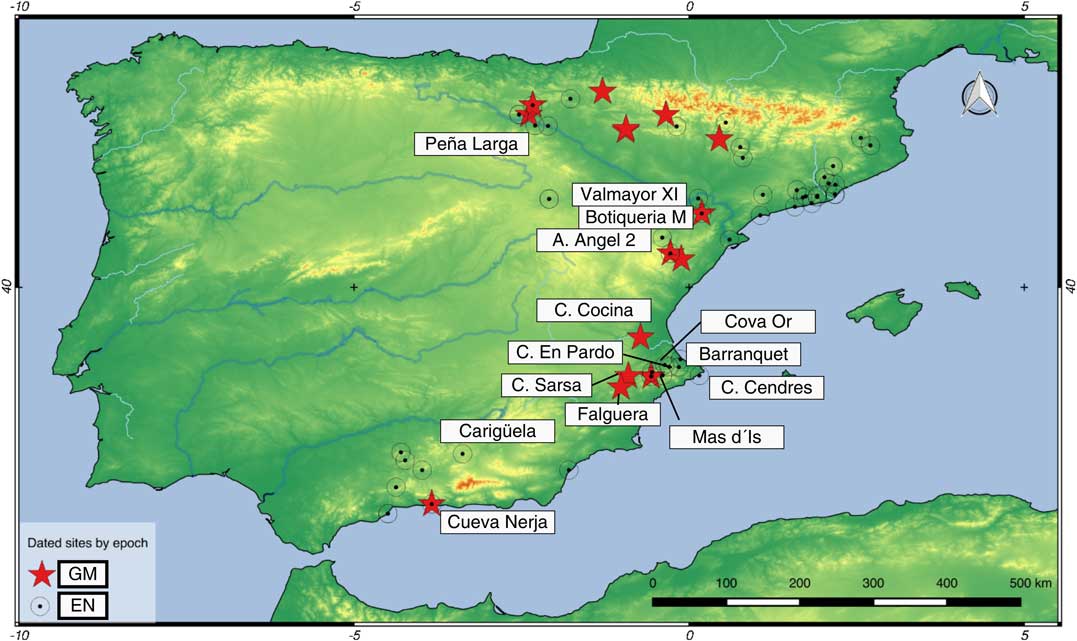
Beta-242783 (6720±40) corresponds to a sheep/goat sample date found at the Peña Larga rock shelter in the upper Ebro valley (Figure 2). This merits a special mention due to its location in an inland area distant from the Mediterranean Sea and along a main corridor for Neolithic expansion. Accepting this date implies a rapid neolithization process via different inland routes and not only along the Mediterranean coast as suggested by Zilhao (Reference Zilhão2001, Reference Zilhão2011). Alternatively, a combination of taphonomic and/or technical problems affecting the 14C sample could be responsible for this result. For the time being, we consider the date valid, while awaiting further clarifying information, as there are no immediately apparent problems with the calibration curve.
Mesolithic and Neolithic sites in Mediterranean Iberia region used for chronological modeling.
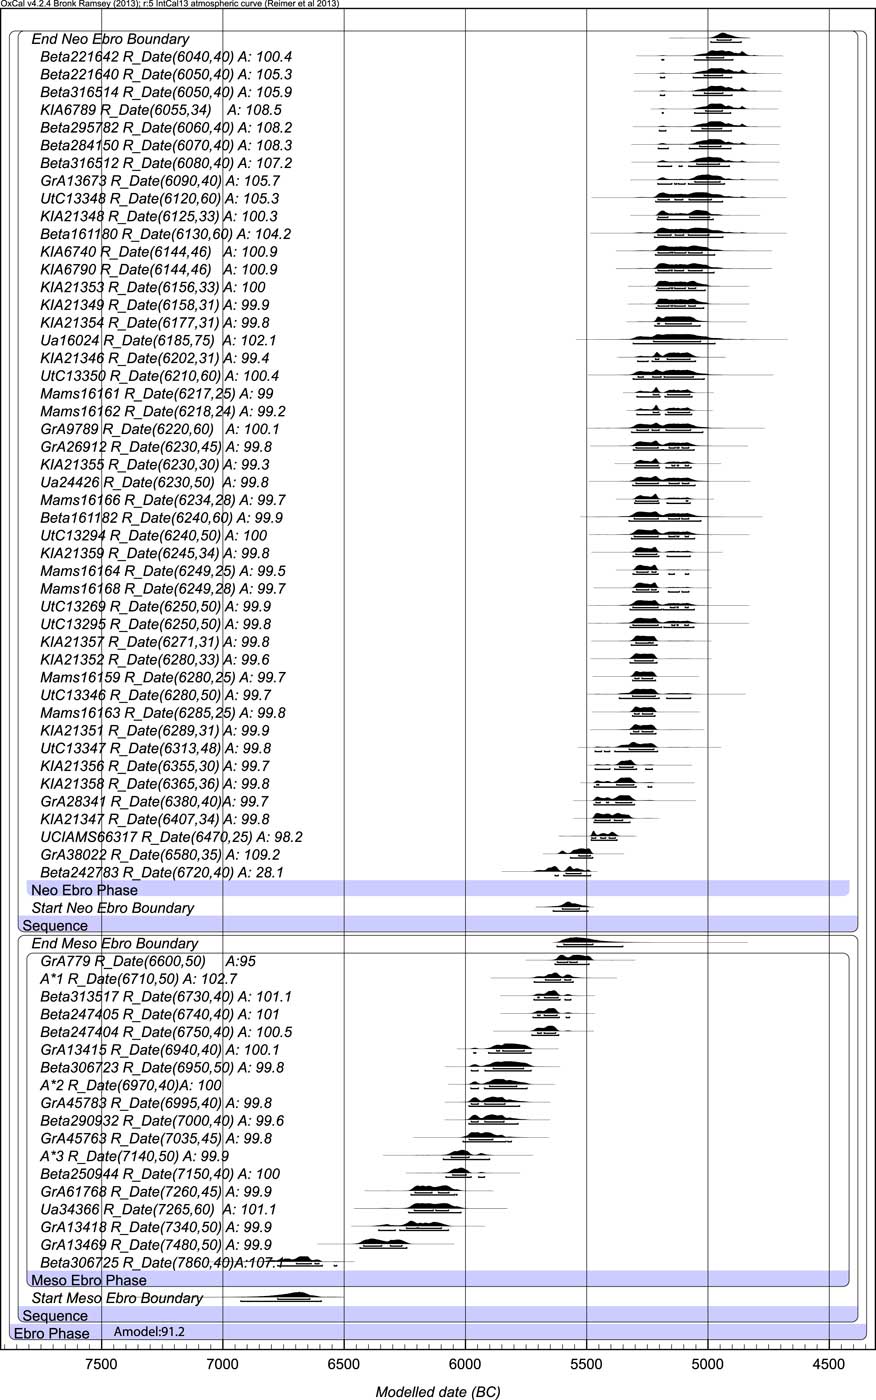
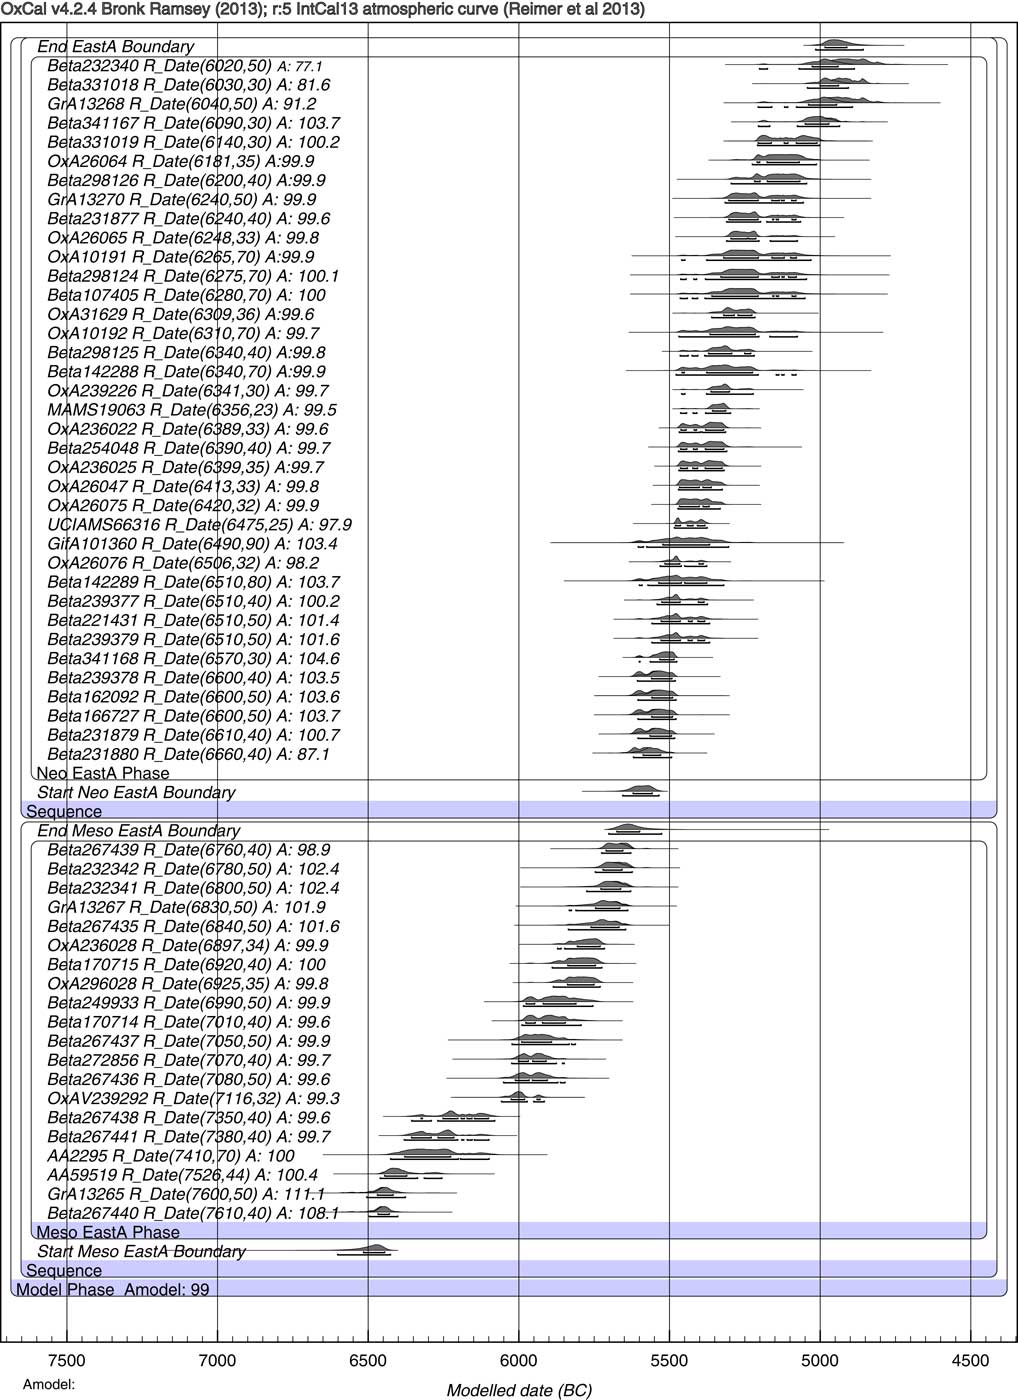
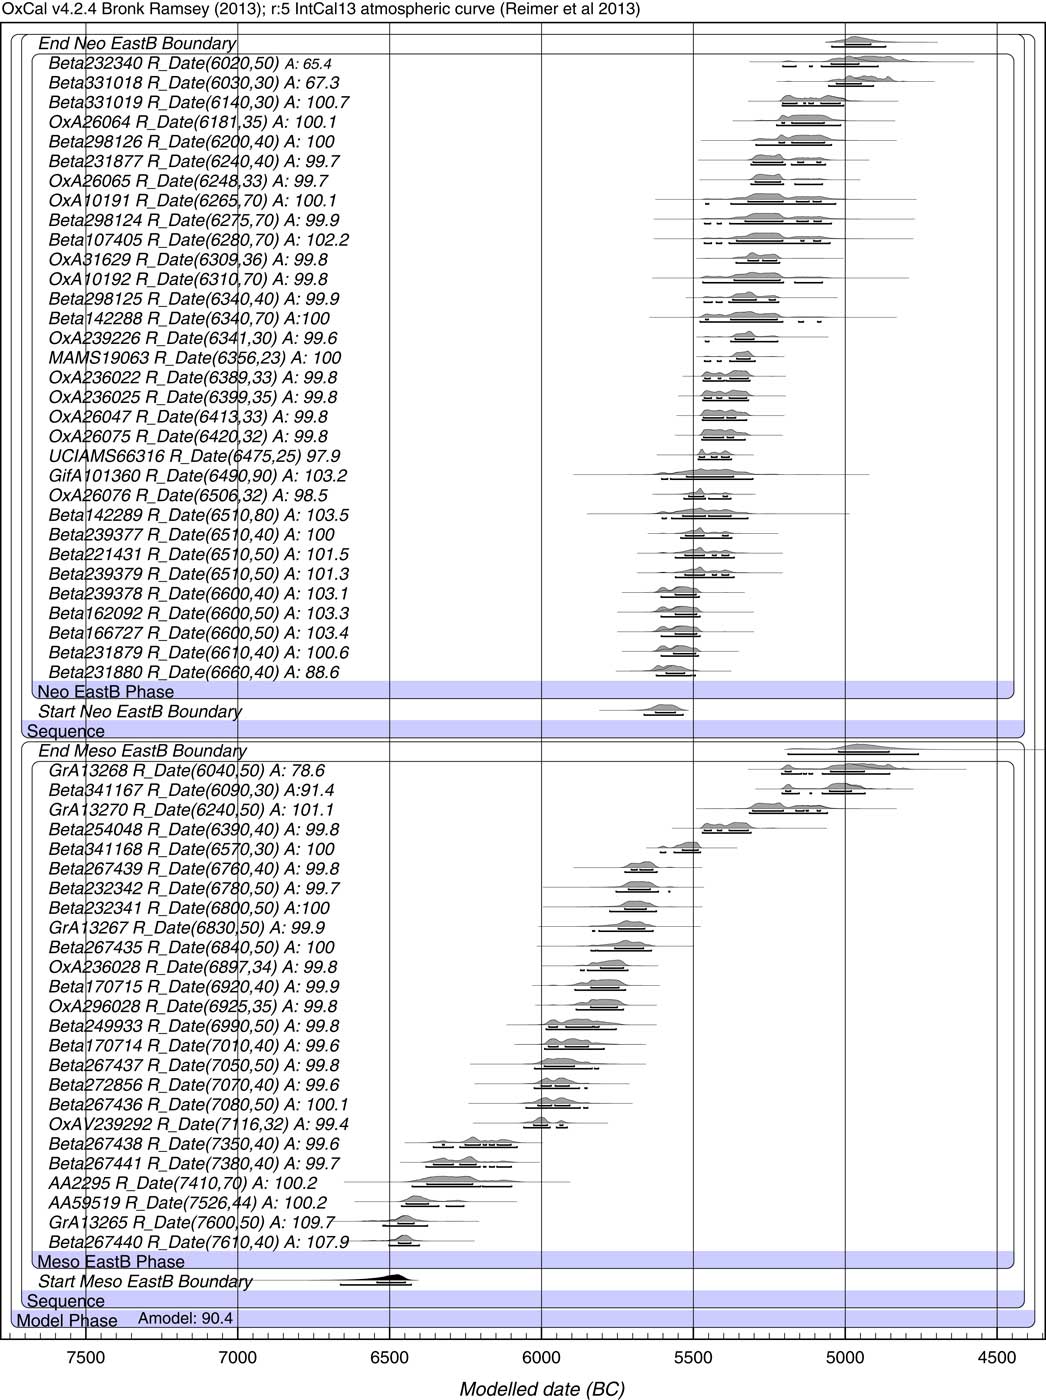
We applied the overlapping model in two regional sub-areas: the upper-middle Ebro valley and the eastern coast of Iberia. Regional models have only been constructed for these two sub-areas, due to the absence of late Mesolithic deposits in the northern (Catalonia) sub-region and the Murcia/eastern Andalusia sub-region. The overlapping model in the upper-middle Ebro valley has an overall agreement index of 91.2, which constitutes a good result and indicates the consistency of the model (Figure 3). The date of Peña Larga (Beta-242783, 6720±40) shows a low agreement (28.1), which again highlights its distinct context discussed above. As we did for the entire area, we consider two hypotheses (A and B) for the Eastern region. In this case Model A considers Botiquería levels 6 (GrA-13268) and 8 (GrA-13270), Abrigo de Ángel 2 (Beta-254048) and Valmayor II and III (Beta-341168 and Beta-341167) as Neolithic, while Model B considers the same dates as Mesolithic dates. Model A in the Eastern region generates the larger agreement index value (Amodel 99), although both present acceptable index values (Figure 4). The most ancient Neolithic date in this region is En Pardo (Beta-231880, 6660±40) (Soler et al. Reference Soler Diaz, García Atienzar, Duque Espino, Ferrer García, Gómez Pérez, Guillem Calatayud, Iborra Eres, Martínez Valle, Pérez Jordà, Roca de Togores Muñoz and Ximénez de Embún Sánchez2013). Model B has an agreement index of 90.4 (Figure 5).
Phase modeling results showing the probability distributions of radiocarbon dates for Mesolithic and Neolithic overlapping phases in the Ebro valley region.
Phase modeling results showing the probability distributions of radiocarbon dates for Mesolithic and Neolithic overlapping phases in the Eastern area (model A).
Phase modeling results showing the probability distributions of radiocarbon dates for Mesolithic and Neolithic overlapping phases in the Eastern area (model B).
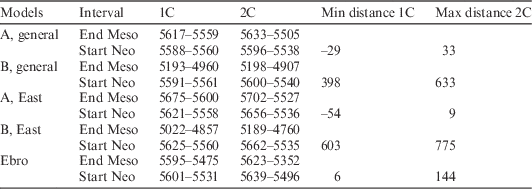
Overall, the general models that reflect the validity of hypothesis A (Botiquería, Ángel 2 and Valmayor as Neolithic occupations) are more robust than those of hypothesis B (Table 2 and Figure 6). Accepting hypothesis A implies the coexistence of Mesolithic and Neolithic societies. But thereafter (Table 3 and Figure 6) it is not possible to follow their immediate evolution from the current archaeological record. Model B reflects an even longer time span of coexistence, although the resolution of the stratigraphic context remains a challenge. On a regional level, the models offer more robust results. The Ebro model presents a consistent model where the coexistence between Mesolithic and Neolithic groups is more visible from 14C (DistMin/Max=6/144) (Table 3 and Figure 6). In the Eastern area, the possibility of recognizing an acculturation process through 14C dates is not well reflected by Model A (more robust Amodel: 99).
Phase modeling results showing the end of the Mesolithic and the beginning of the Neolithic according with the different models proposed (general A model, and regional models: Eastern A and B models, and Ebro model).

Bayesian sequence modeled dates from Oxcal 4.2.3 (Bronk Ramsey Reference Bronk Ramsey2009). Interval span and distance between the end of the Mesolithic and the start of the Neolithic. Calibration conducted using IntCal13 curve: Northern Hemisphere (Reimer et al. Reference Reimer, Bard, Bayliss, Beck, Blackwell, Bronk Ramsey, Buck, Cheng, Edwards, Friedrich, Grootes, Guilderson, Haflidason, Hajdas, Hatté, Heaton, Hoffmann, Hogg, Hughen, Kaiser, Kromer, Manning, Niu, Reimer, Richards, Scott, Southon, Staff, Turney and van der Plicht2013).
Consequently, we feel this suggests that coexistence of Mesolithic hunter/gatherers and Neolithic farmers is possible even though not well reflected in the archaeological record. The regional variability reinforces this conclusion, and highlights regional differences between the Mediterranean corridor (a quick Neolithic expansion) and the Ebro valley (where acculturation processes had a greater opportunity).
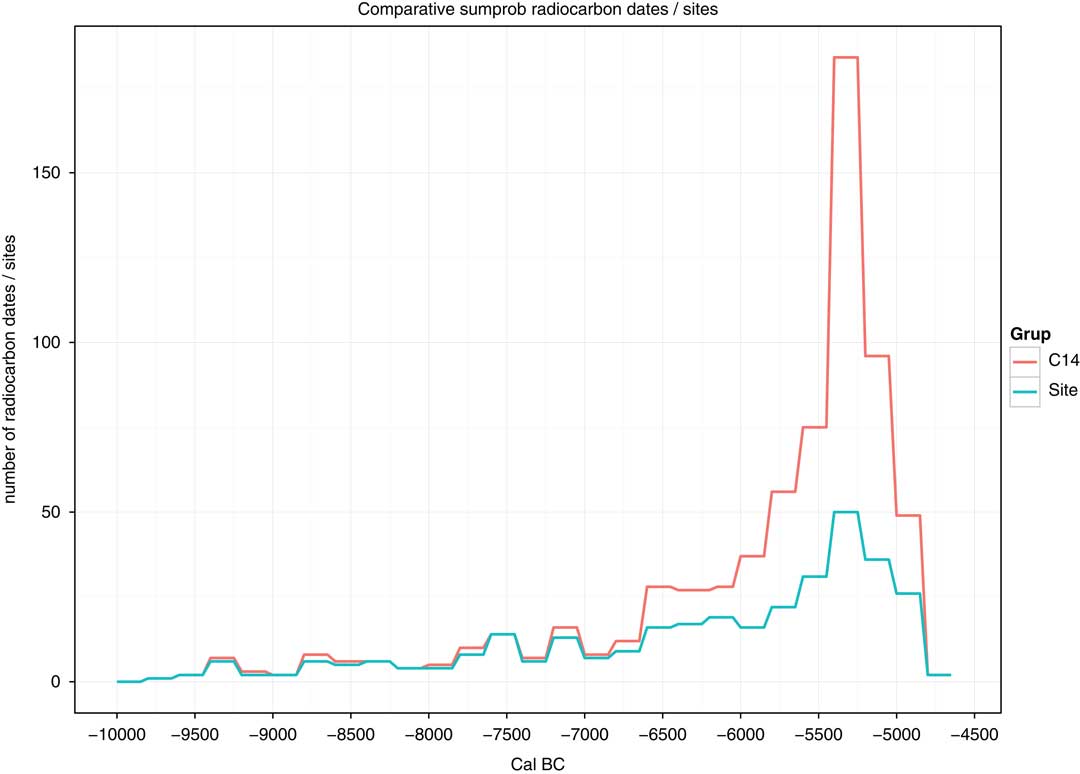
As a complementary analysis to better understand trends in socioecological dynamics among the last hunter gatherers and first farmers in Mediterranean Iberia, we combined all filtered radiocarbon dates (single fragments, short-lived taxa, SC<100) for the Mediterranean region into a SCDPD curve (Figure 7). We compare this curve with a curve of the number of distinct occupations dated to each 200-yr interval throughout the same region. Although there are relatively fewer sites than dates for the later Neolithic, both datasets display similar patterns. An interesting consideration is the increase of dates coincident with the beginning of the Late Mesolithic (Figure 7) associated with the appearance of standardized blade technology and trapezes (Martí et al. Reference Martí, JE, Juan-Cabanilles, García Puchol and Fernández2009; Binder et al. Reference Binder, Collina, Guilbert, Perrin and García Puchol2012). The peaks in both curves show when the Neolithic is well in evidence over much of the Iberian Peninsula (ca. 5300 cal BC) (Bernabeu and Martí Reference Bernabeu Aubán and Martí2014; Bernabeu et al. 2014). The 14C curve begins a steep climb around 5700 cal BC, with the arrival of the Neolithic to the region. That is, a substantial change in 14C densities is coincident with the introduction and expansion of agricultural practices associated with the initial appearance of the Neolithic.
Comparative sumprob radiocarbon dates/sites distributed within intervals of 200 years. We calibrated all the dates using Oxcal Program 4.2 and IntCal13 curve for the Northern Hemisphere (Reimer et al. Reference Reimer, Bard, Bayliss, Beck, Blackwell, Bronk Ramsey, Buck, Cheng, Edwards, Friedrich, Grootes, Guilderson, Haflidason, Hajdas, Hatté, Heaton, Hoffmann, Hogg, Hughen, Kaiser, Kromer, Manning, Niu, Reimer, Richards, Scott, Southon, Staff, Turney and van der Plicht2013) with 1σ (68.2).
DISCUSSION
As pointed out by Bocquet-Appel (Reference Bocquet-Appel2008), indicators of demographic transition have been detected around the world at the beginning of the Neolithic, linking the increase of population to the new modes of subsistence and residential patterns. A growing number of researchers have used the density curves of large series of radiocarbon data as a viable proxy for these signals (Gamble et al. Reference Gamble, Davies, Pettitt, Hazelwood and Richards2005; Shennan and Edinborough Reference Shennan and Edinborough2007; Shennan et al. Reference Shennan, Downey, Timpson, Edinborough, Colledge, Kerig, Manning and Thomas2013).
Recent studies use this information as demographic proxies at different geographical levels in Europe (Shennan and Ediborough Reference Shennan and Edinborough2007) as well as to show trends of settlement densities (Bernabeu et al. 2014; Bernabeu et al. Reference Bernabeu Aubán, García Puchol, Barton, McClure and Pardo Gordó2015b). The results presented here indicate the clarity of this signal for the Mediterranean Iberian region, where the arrival of agriculture and husbandry coincides with a rapid increase in radiocarbon densities—a pattern that is also observed in other European regions (Shennan et al. Reference Shennan, Downey, Timpson, Edinborough, Colledge, Kerig, Manning and Thomas2013; Timpson et al. Reference Timpson, Colledge, Crema, Edinborough, Kering, Manning, Thomas and Shennan2014).
The general debate in Europe about the social processes responsible for the Neolithic transition centers on the importance of demic expansion (see Ammerman and Cavalli Sforza Reference Ammerman and Cavalli-Sforza1984; Perles Reference Perlès2001; Zilhao Reference Zilhão2001; Guilaine Reference Guilaine2001; Ammerman and Biagi Reference Ammerman and Biagi2003; Forenbaher and Miracle Reference Forenbaher and Miracle2006; Guilaine and Manen et al. Reference Guilaine and Manen2007; Robb Reference Robb2007; Bernabeu et al. Reference Bernabeu Aubán, Molina, Esquembe, Ramón and Boronat2009; Colledge et al. Reference Colledge, Connolly, Dobney, Manning and Shennan2013; Ozdogan Reference Özdoğan2011; Rowley-Conwy Reference Rowley-Conwy2011; Juan-Cabanilles and Garcia Puchol Reference Juan-Cabanilles and García Puchol2013; McClure Reference McClure2013; McClure and Podrug Reference McClure and Podrug2016) and the pace of Neolithic expansion (Bocquet-Appel et al. Reference Bocquet-Appel, Naji, Vander Linden and Kozlowski2012, Fort Reference Fort2012). Despite the discussion about the interpretation of particular sites and dates (see Zilhao Reference Zilhão2011; Alday 2012), or the respective impact of demic diffusion versus indigenous components (Bernabeu Reference Bernabeu Aubán2002; Zilhao Reference Zilhão2003; García Puchol et al. Reference García Puchol, Molina, Aura and Bernabeu Aubán2009; Diaz del Río Reference Diaz del Rio2011; Cruz Berrocal Reference Cruz Berrocal2012; Bernabeu and Martí Reference Bernabeu Aubán and Martí2014; Isern et al. Reference Isern, Fort, Carvalho, Gibaja and Ibañez2014; Bernabeu et al. Reference Bernabeu Aubán, Barton, Pardo Gordó and Bergin2015a, Reference Bernabeu Aubán, García Puchol, Barton, McClure and Pardo Gordó2015b), general agreement exists among researchers in the Iberian Peninsula on the existence of an initial impact of foreign components and the hypothesis of dual drivers of demic expansion and acculturation. In accordance with the dual model proposal we assume that an initial foreign expansion constituted the driving force of the subsequent spread in Iberia.
Chronological analysis using a Bayesian approach allows the exploration of alternative hypotheses about dual demic/acculturation models. In this respect, several points are worth noting. One concerns the latest Mesolithic context considered. We tested two possibilities for the cultural affiliations of several ambiguous dates from sites in the eastern region: Botiqueria, Angel 2, Valmayor II and III. The Bayesian models indicate a more probable Neolithic affiliation for these dated contexts. The existence of a chronological gap between Mesolithic and Neolithic levels in Botiqueria reinforce this interpretation. This would make Aizpea GrA-779 (6600, 50) (Cava 1997) the last authenticated Mesolithic date currently known. Other dates position the initial Neolithic expansion in Iberia at around 5650 cal BC (Col-1565, 6749±39: 5725–5575 cal BC; Beta-242783, 6720±40: 5715–5561 cal BC; OxA-26068, 6655±45: 5644–5491 cal BC, 2σ range; Beta-131577, 6590±40: 5616–5481), all based on bones of possibly domestic animals, although some problems can be highlighted about their domestic status only confirmed for Beta-131577 (Cueva de Nerja, in southern Iberia) (Martins et al. Reference Martins, Oms, Pereira, Pike, Rowsell and Zilhão2015). The oldest domestic seed corresponds to Mas d’Is (Beta-162092, 6600±40, 5617–5485 cal BC), an open-air site located in Eastern Iberia region (Bernabeu et al. 2014). Their wide distribution around the region fuels debate about the existence of different entry routes of Neolithic farmers coming from the north and from the south along the Iberian coast (García Borja et al. Reference García Borja, Aura Tortosa, Jordá Pardo and Salazar García2014).
CONCLUSION
We have tested alternative variants of the dual model, a mixed model that proposes the coexistence between migrant farmers and Mesolithic groups during the Neolithic arrival in Mediterranean Iberia. To do that we have used a large and carefully filtered radiocarbon dataset to compare a SCDPD method as a proxy for diachronic fluctuations in population levels of and Bayesian boundary modeling to examing the potential overlap in final Mesolithic and initial Neolithic occupations. We found variable support for Mesolithic acculturation at the scales of sub-regions and over all of Mediterranean Iberia. The most robust models do not support the existence of a lengthy acculturation process across the entire region, nor in the eastern sub-area. In the Ebro area, there is stronger support for a longer period of acculturation between Mesolithic and Neolithic groups. Although we were unable to construct sub-regional models for the northern (Catalonia) sub-region and the Murcia/eastern Andalusia sub-region, current archaeological data supports a model of Neolithic colonization in those areas.
The combined SCDPD curve built for the entire region of Mediterranean Iberia also sheds new light on discussions of neolithization. An initial increase in 14C densities is linked with the appearance of blade technology and trapezes in the Mesolithic sequence in the region; a much more marked peak in the SCDPD curve corresponds with the first appearance of domestic remains. Consequently, we note that agro-pastoral practices significantly increased the densities—and possibly increased populations across the peninsula (see Figure 7). This rapid increase does not seem to reflect the kind of long-term acculturation process in Mediterranean Iberia as a whole observed in the archaeological record of other European regions (Collard et al. Reference Collard, Edinborough, Shennan and Thomas2010; Rowley Conwy Reference Rowley-Conwy2011).
The detection of necropoli from the Early Mesolithic onward in the area, indicates differences in settlement patterns that could reflect more residential stability, an aspect which also coincides with the increase in radiocarbon date densities. At the same time, the rise in the diversity of resources used is noted from the beginning of the Holocene in hunter-gatherer subsistence patterns (Martí et al. Reference Martí, JE, Juan-Cabanilles, García Puchol and Fernández2009), including sites located along coastal and wetland areas. Despite these data, current information does not seem to indicate high population levels. On the other hand, the signal detected in SCDPD at the beginning of the Neolithic could be linked with the hypothesis of a foreign introduction related to farming and herding practices by migrant farmers. The results of Bayesian boundary modeling offer support for some degree of regional variability in farmer-hunter interaction. A rapid assimilation seems to be the case in the east, and a longer coexistence in the Ebro valley. If this were the case, we would expect to find sites and layers with Mesolithic industries and some Neolithic artifacts, such as pottery. However, a more refined chronology is needed if we want to gain further insight into the problems relating to Mesolithic/Neolithic relationships.
Acknowledgments
This research was funded by the Spanish Ministry of Economy, Industry and Competitiveness grants HAR2012-33111 “MesoCocina: Los últimos caza-recolectores y el paradigma de la neolitización en el mediterráneo peninsular” and HAR2015-68962: EVOLPAST: Dinámicas evolutivas y patrones de variabilidad cultural de los últimos caza-recolectores y el primer neolítico en el este peninsular (circa 7000–4500 cal BC). We would like to acknowledge the anonymous reviewers who helped to improve the earlier version of this paper. SPG is supported by University of Valencia (subprograma Atracció de Talent - Contractes Postdoctorals).
SUPPLEMENTARY MATERIAL
To view supplementary material for this article, please visit https://doi.org/10.1017/RDC.2017.61



