

1. Introduction
The open science movement in economics has seen success in recent years with the adoption of transparency initiatives on the production side of research, e.g., pre-analysis plans (Ferguson et al., Reference Ferguson, Littman, Christensen, Paluck, Swanson, Wang, Miguel, Birke and Pezzuto2023). However, little attention has been paid to transparency on the evaluation side, i.e., open peer-review practices. These practices can be divided into (i) those that modify the identifiability of authors, referees, and editors and (ii) those that facilitate the open communication of information between stakeholders. Assuming that journals aim to maximize the quality of the papers they publish, the optimal level of transparency is uncertain without knowing more about the (perceived) costs and benefits of various policies. In this paper, we leverage a survey of experimental/behavioral economists to learn how stakeholders reason about key trade-offs and whether the growing support for open science practices extends to peer review. We complement the survey with a conceptual framework, a literature review, and cross-disciplinary data on journal practices.
The take-up of open peer-review practices has been slow across disciplines (Wolfram et al., Reference Wolfram, Wang, Hembree and Park2020), including economics. Among the top-5 economics and Economic Science Association (ESA) journals (Table 1), some disclose metadata and handling editor identities, but none reveal referee identities or publish referee reports. One notable exception to the pattern of slow take-up comes from the Nature journals. On identifiability, Nature began disclosing reviewer identities in 2016, subject to the consent of the authors and referees (Nature, Reference Nature2019). Around 80% of papers identified at least one referee during the trial period, suggesting some openness to these practices. On open communication, Nature Communications began publishing referee reports in 2016, subject to author consent (Nature Communications, 2015). The opt-in rate rose from 60% in 2016 to 70% in 2021, after which the journal decided to publish all reports without exception (Nature Communications, 2016; Nature Communications, 2022). In 2025, Nature announced a similar full disclosure policy (Nature, Reference Nature2025).
Transparency policies

Notes: For journal abbreviations and further information, please see Online Resource Appendix A.4. The sources for many journal policies are available in Online Resource Table A.6.
a After acceptance, Frontiers publishes the names of referees who have recommended the manuscript for publication.
b Nature allows authors to opt in to double-anonymity, while authors and referees must both agree for referee identities to be publicly shared. All Nature publications must now feature a peer-review file, which includes signed or unsigned reports and author responses, but only some files feature decision letters.
Given the limited evidence from economics, we surveyed economists on their views about open peer-review practices as part of a larger survey on peer review (Charness et al., Reference Charness, Dreber, Evans, Gill and Toussaert2022). In this article, we use this data to examine the main arguments for and against open peer review. We focus on the attitudes of experimental/behavioral economists ( $N=802$), many of whom are ESA members and from whom we recorded a high response rate.
We document three main findings. First, on identifiability, most respondents support preserving anonymity for referees, but views about authors and associate editors are mixed. However, there is clear support for giving authors the option to request, ex-ante, that certain reviewers not be contacted. Second, regarding open communication, most respondents support publishing anonymized referee reports, sharing reports between referees, and opening a channel for authors to appeal editorial decisions. Third, in a latent class analysis (LCA), we find that responses cluster in three groups, which we label as Traditionalists (33% of respondents), Incrementalists (38%), and Reformists (28%). Respondents from the US/Canada, active reviewers, top-5 reviewers, and editors are more likely to be classified as Traditionalists, while female respondents are less likely to be.
These attitudes could serve as inputs into journal decision-making in two ways. First, they signal which policies are ripe for implementation (e.g., sharing reports) and which might provoke backlash (e.g., referee identifiability). Second, they may proxy for beliefs about policy efficacy, which could help journals identify policies in need of further experimentation (e.g., double-blind anonymity).
Our paper complements recent surveys on peer review that have been conducted in cross-disciplinary settings (Publishing Research Consortium, 2016; Ross-Hellauer et al., Reference Ross-Hellauer, Deppe and Schmidt2017) and within economics (Altonji et al., Reference Altonji, Imbens, Lang, Luttmer, Rasul, Stantcheva and Wacziarg2025). Compared to the cross-disciplinary surveys, we cover ground especially relevant to journals in economics and take an economic perspective on issues common across disciplines. This distinction is relevant because findings from other disciplines may not generalize to economics. Economics is a relatively small disciplineFootnote 1 and the effects of identifiability may differ when networks are small. Additionally, peer review in economics features long publication lags (Hadavand et al., Reference Hadavand, Hamermesh and Wilson2024), which incentivizes authors to disseminate their preprints widely, thereby complicating anonymity policies. Finally, economics is a social science, which may entail more subjectivity in how we evaluate research findings and imply a greater need for policies that protect the ability of referees to dissent. As compared to Altonji et al. (Reference Altonji, Imbens, Lang, Luttmer, Rasul, Stantcheva and Wacziarg2025), who survey economists from all fields, we focus on the views of experimental/behavioral economists, whose attitudes may be more relevant to the readership of this journal. Moreover, we investigate several policies that they do not, including referee identifiability and the disclosure of review histories.
Our efforts are divided into six sections. We introduce our survey design and dataset in Section 2. Section 3 features a conceptual framework that formalizes how journals may reason about policy adoption. Next, we explore policies that affect the identifiability of stakeholders (Section 4) and open communication in peer review (Section 5). Section 6 investigates potential heterogeneity and clustering in participant responses. Finally, Section 7 discusses the limitations of our study and possible steps forward.
2. Survey on peer review
We conducted an anonymous survey of economists between July 2020 and January 2021. Researchers could participate if, over the prior two years, they had (i) written at least one referee report and (ii) received reports on at least one journal submission. We inquired about their experiences with the system from their dual perspectives as authors and reviewers, their opinions on its current performance, and their attitudes toward certain proposals for reform.Footnote 2 The full questionnaire is in Online Resource Appendix C and the dataset is on our OSF page (https://doi.org/10.17605/OSF.IO/GJ586).
This paper focuses on respondents’ attitudes about eight proposed policies. For each policy, respondents indicated either how favorable they are or how useful they find it for improving referee reports on a 1–5 Likert scale. The policies include publishing referee reports and author responses (either anonymously or signed), sharing reports between reviewers, de-anonymizing senior referees and associate editors, implementing double-blind review, and allowing authors to oppose the assignment of specific reviewers or to appeal manuscript rejections. When relevant, we also report results from other parts of the survey, including perceptions of referee report quality and conflicts of interest.
Our recruitment strategy (detailed in Online Resource Appendix A.1) leveraged direct emails, advertising through professional networks (e.g., CESifo, CEPR), discussion forum posts (e.g., ESA), and social media. The first wave of emails (July–October 2020) targeted experimental/behavioral economists, yielding 606 responses from 1,802 emails (34%). The second wave (November 2020–January 2021) expanded to other subfields, yielding 269 responses from 3,618 emails (7%). In total, we obtained 1,459 complete responses. Given the interests of this journal’s readership, we restrict our presentation of the data to the experimental/behavioral subsample ( $N=802$, 54% of respondents).
Basic descriptive statistics for this subsample are presented in Online Resource Table A.3. To assess potential selection bias, we compared the characteristics of this subsample to those of 2020 ESA members (Online Resource Table A.4) and those of our full sample to the weighted sample in Andre and Falk (Reference Andre and Falk2021) and the full sample in Altonji et al. (Reference Altonji, Imbens, Lang, Luttmer, Rasul, Stantcheva and Wacziarg2025) (Online Resource Appendix A.3). Relative to these benchmarks, we over-sample researchers in Europe and, in the full sample, we also over-sample experimental/behavioral economists.
3. Conceptual framework
A natural objective for journals is to maximize the expected quality of the papers they publish (Card & DellaVigna, Reference Card and DellaVigna2020). Consider a journal that receives a manuscript submission with unobserved quality 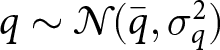 $q \sim \mathcal{N}(\bar{q}, \sigma_q^2)$. The journal cannot observe
  $q$ directly; instead, it assigns the paper to a representative reviewer who receives a private signal
  $s$:
$s$:
 \begin{equation*}s = q + b(r,t) + \varepsilon,\end{equation*}
where  $b(r,t)$ is a bias term dependent on the author’s reputation (
 $r \in \mathbb{R}$) and the reviewer’s taste (
 $t \in \mathbb{R}$).
 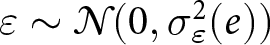 $\varepsilon \sim \mathcal{N}(0, \sigma_\varepsilon^2(e))$ is an error term.
  $\frac{\partial b(r,t)}{\partial r} \gt 0$ implies more favorable reviews for influential authors due to, e.g., status bias (Huber et al., Reference Huber, Inoua, Kerschbamer, König-Kersting, Palan and Smith2022) or expected reciprocity/retaliation. The parameter
  $t$ represents a reviewer’s perception of a manuscript that is related to factors other than
  $r$ or
  $q$, e.g., personal relationships, conflicts of interest, and/or idiosyncratic preferences. The variance of the noise depends on reviewer effort
  $e \geq 0$, with
 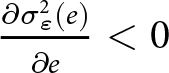 $\frac{\partial \sigma_\varepsilon^2(e)}{\partial e} \lt 0$. Effort also improves the final quality of the published paper via revisions, i.e.:
 \begin{equation*}
q^{\text{published}} = q + \Delta(e), \quad \text{with } \Delta'(e) \gt 0.
\end{equation*}
\begin{equation*}
q^{\text{published}} = q + \Delta(e), \quad \text{with } \Delta'(e) \gt 0.
\end{equation*}Effort is costly, but referees may choose to exert positive effort due to the potential for reputational gain:
 \begin{equation*}
U = -c(e) + \eta e,
\end{equation*}
\begin{equation*}
U = -c(e) + \eta e,
\end{equation*}where  $c(e)$ is increasing and convex and
  $\eta$ captures the salience of reputational gains. Each reviewer has a reservation utility below which they would reject the request; in these cases, the journal will rely on the signal and suggested revisions of an alternative reviewer. Critically,
  $\eta$ may depend on the journal’s policy regime, e.g., referee identifiability. The journal learns about the signal
  $s$ and must form a posterior belief over
  $q$. If the journal is myopic about
  $b(r,t)$, it treats
  $s$ as follows:
 \begin{equation*}s=q+\varepsilon',\quad\text{with }\varepsilon'\sim\mathcal N(0,\sigma_s^2)\;\text{and }\sigma_s^2=\sigma_\varepsilon^2(e)+\sigma_{b(r,t)}^2\end{equation*}
 The journal’s posterior belief about  $q$ is therefore:
 \begin{equation*}\mathbb{E}[q \mid s] = \lambda s + (1 - \lambda) \bar{q}, \quad \text{where } \lambda = \frac{\sigma_q^2}{\sigma_q^2 + \sigma_s^2}.\end{equation*}
 The journal offers an R&R if  $\mathbb{E}[q^{published} \mid s] = \mathbb{E}[q \mid s] + \Delta(e)$ exceeds a publication threshold
  $\tau$ (accounting for space constraints). Both Type I errors (accepted despite
  $q^{\text{published}} \lt \tau$) and Type II errors (rejected despite
  $q^{\text{published}} \gt \tau$) are possible. We use this framework throughout the article to discuss policy adoption.
4. Identifiability
Peer-review systems differ in terms of identifiability. Single-blind review, where authors are blinded to reviewer identities, is the norm in economics (Table 1), but other possibilities include double-blind review (blinding both authors and referees) and open identifiability (COPE Council, Reference COPE Council2017). This section considers various modifications to the timing and conditions of identity revelation.
4.1. Author identifiability
The case for double-blind review
Single-blind review is currently ubiquitous in economics, but this has not always been the case. In fact, the American Economic Review (AER) and the Quarterly Journal of Economics (QJE) only abandoned double anonymity 10–20 years ago (Hengel, Reference Hengel2022). Furthermore, some prominent journals that publish research in economics or psychology continue to use it, including Management Science, Economic Inquiry, and Psychological Bulletin (Online Resource Table A.6).Footnote 3
Double anonymity, if implemented effectively, protects against identity-based discrimination, i.e., reviewers favoring prominent authors due to status bias (Huber et al., Reference Huber, Inoua, Kerschbamer, König-Kersting, Palan and Smith2022), taste-based discrimination, or statistical discrimination (inferring quality  $q$ from author reputation
  $r$). As such, we expect heterogeneous effects: double anonymity should decrease the frequency of Type I errors for low-
 $q$ papers from high-
 $r$ authors and Type II errors for high-
 $q$ papers from low-
 $r$ authors.
Scope for enabling double-blind review
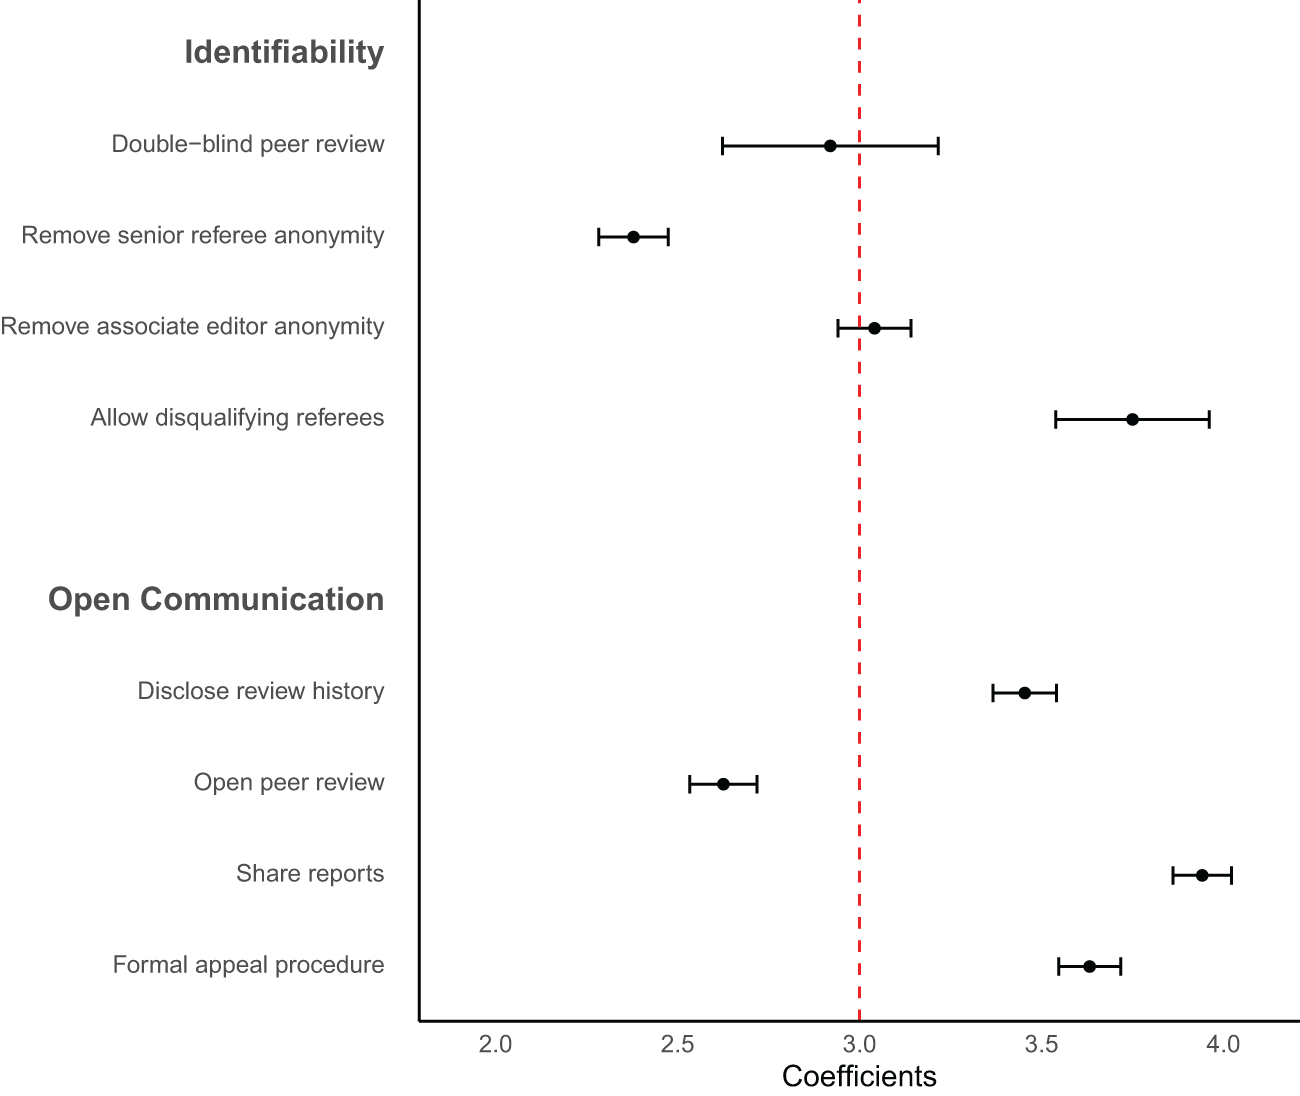
Our respondents’ attitudes toward double-blind review are divided: 39% view it favorably (rating  $\geq 4$) and 46% unfavorably (rating
  $\leq 2$).Footnote 4 The average rating is 2.92 out of 5 (
 $p=0.59$ against 3; see Fig. 1). Qualitative responses reveal concerns about reviewer objectivity, with “double” and “blind” appearing frequently in comments related to transparency (Online Resource Fig. B.6).Footnote 5
Mean response relative to the midpoint value of 3

These mixed views appear in line with existing empirical evidence on double-blind review, with some studies finding bias reduction and others reporting null effects (Blank, Reference Blank1991; Laband & Piette, Reference Laband and Piette1994; Snodgrass, Reference Snodgrass2006; Tomkins et al., Reference Tomkins, Zhang and Heavlin2017; Kolev et al., Reference Kolev, Fuentes-Medel and Murray2019; Ersoy & Pate, Reference Ersoy and Pate2023). This heterogeneity could relate to field- and time-specific factors that affect the feasibility of anonymizing authors. Anonymity is likely difficult to preserve in small disciplines where authors disseminate preprints widely, like economics, especially in the age of search engines (Goldberg, Reference Goldberg2012). Despite these concerns, Altonji et al. (Reference Altonji, Imbens, Lang, Luttmer, Rasul, Stantcheva and Wacziarg2025) recommend that journals attempt to implement double-blind review, since it is fairly costless and ideal in principle. One possible implementation could be an opt-in model similar to Nature (Table 1) and Nature Human Behaviour (Online Resource Table A.6). While authors who opt in may signal low  $r$, thereby undermining potential benefits, the evidence about this policy remains limited and experimentation could be valuable.
4.2. Referee and editor identifiability
The case for open identifiability
Instead of keeping key stakeholders anonymous, one could consider the opposite. In economics, the identities of referees and associate editors are generally concealed to authors and readers, while handling editors are known to the authors and sometimes publicly revealed (Table 1). However, referee identifiability is becoming increasingly common in other fields (Wolfram et al., Reference Wolfram, Wang, Hembree and Park2020),Footnote 6 which could make an examination of this policy worthwhile.
Identifiability is likely to increase the scrutiny faced by referees and editors, as authors can link reports to identities, and the research community may view identified referees and editors as offering “seals of approval” to manuscripts. The implications of this heightened scrutiny are ambiguous. Bias could increase if referees become more vulnerable to retaliation, favor-swapping, and social pressure. If so, this would raise the likelihood of Type I errors for low- $q$ papers from high-
 $r$ authors. At the same time, greater scrutiny could enhance the salience of reputational benefits from reviewing
  $\eta$ and thus increase effort
  $e$. This could improve review quality, yielding more precise signals
  $\sigma^2_{\varepsilon}(e)$, more useful revisions
  $\Delta(e)$, and fewer Type I and Type II errors. Low-quality reports are a common complaint under the status quo (Silbiger & Stubler, Reference Silbiger and Stubler2019).Footnote 7 Publicly identifying referees alongside manuscripts could also help referees earn credit for peer-review contributions in tenure, promotion, and hiring decisions, and allow the community to observe the Type I error rates of editors and referees. However, this visibility might make editors and referees more risk averse, leading them to demand more extensive revisions or to shy away from bold research. Finally, identifiability could trigger selection effects if some referees prefer to decline review requests rather than be named, potentially altering the taste
  $t$ or precision
  $\sigma^2_{\varepsilon}(e)$ of those who opt in.
Scope for increasing identifiability
Respondents are generally skeptical about disclosing the identities of senior referees: only 23% consider it useful, while 60% do not. The average rating is 2.38 ( $p \lt 0.001$ against 3; see Fig. 1). Views on associate editor anonymity are more divided, with roughly equal shares finding disclosure useful (42%) vs. not useful (40%). The average rating is 3.04 (
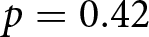 $p=0.42$ against 3). Overall, attitudes toward referee identifiability are more skeptical than those reported in other surveys (Publishing Research Consortium, 2016; Ross-Hellauer et al., Reference Ross-Hellauer, Deppe and Schmidt2017).
The empirical evidence on the effects of identifiability is generally mixed. In terms of bias, McNutt et al. (Reference McNutt, Evans, Fletcher and Fletcher1990), Walsh et al. (Reference Walsh, Rooney, Appleby and Wilkinson2000), and Fox (Reference Fox2021) find that identified or voluntary signers tend to give more favorable recommendations, though van Rooyen et al. (Reference van Rooyen, Godlee, Evans, Black and Smith1999) find no differences. The impact on report quality is similarly inconclusive: Walsh et al. (Reference Walsh, Rooney, Appleby and Wilkinson2000) find that identifiability increases effort (time spent) as well as the politeness and quality of reports, but van Rooyen et al. (Reference van Rooyen, Godlee, Evans, Black and Smith1999) and Vinther et al. (Reference Vinther, Nielsen, Rosenberg, Keiding and Schroeder2012) find no significant effects. Non-experimental evidence from McNutt et al. (Reference McNutt, Evans, Fletcher and Fletcher1990) suggests that voluntarily signed reports are more constructive, courteous, and fair. Finally, van Rooyen et al. (Reference van Rooyen, Godlee, Evans, Black and Smith1999) report that referees are less likely to accept review invitations under open identifiability, and Fox (Reference Fox2021) finds significant (though non-causal) differences in the demographic characteristics of signers versus non-signers.
Alternative or complementary approaches
Given respondents’ negative views on full identifiability, we considered alternative policies. One option is to allow referees to opt in to revealing their identity, as practiced by Nature (Table 1) and Nature Human Behaviour (Online Resource Table A.6). Referees could use this as a commitment device to produce higher-quality reports and it might help shift norms over time, though concerns about favor trading would likely persist.
Another option is for journals to periodically acknowledge the contributions of their referees (Tennant et al., Reference Tennant, Dugan, Graziotin, Jacques, Waldner, Mietchen, Elkhatib, Collister, Pikas, Crick, Masuzzo, Caravaggi, Berg, Niemeyer, Ross-Hellauer, Mannheimer, Rigling, Katz, Tzovaras and Colomb2017), as some economics journals already do (Table 1). This would raise the visibility of refereeing and allow for the assessment of the diversity of referee pools. A variation of this policy, in which referee turnaround times were also published, was tested experimentally by Chetty et al. (Reference Chetty, Saez and Sandor2014). The main effect, relative to a no-visibility group, was to lower the acceptance rate of review requests.
We also consider whether exposing unrecorded conflicts of interest, a purported benefit of identifiability (Benos et al., Reference Benos, Bashari, Chaves, Gaggar, Kapoor, LaFrance, Mans, Mayhew, McGowan, Polter, Qadri, Sarfare, Schultz, Splittgerber, Stephenson, Tower, Walton and Zotov2007), can be achieved without piercing anonymity. Conflicts can create either positive or negative bias, depending on whether they stem from personal relationships, competing papers, or ideological differences. Regarding positive bias, network proximity and social ties are predictive of positive recommendations and decisions (Brogaard et al., Reference Brogaard, Engelberg and Parsons2014; Colussi, Reference Colussi2018; Carrell et al., Reference Carrell, Figlio and Lusher2024). While this may partly reflect other factors, such as lower search costs, fairness concerns remain (Altonji et al., Reference Altonji, Imbens, Lang, Luttmer, Rasul, Stantcheva and Wacziarg2025). Among our respondents, 16% reported rejecting or considering rejecting a referee request due to a conflict over the prior two years. We also asked them about “people refereeing papers by co-authors or friends.” Most answered either “this should never happen” (40%) or “this should happen as little as possible but cannot be avoided sometimes” (44%). The latter answer may reflect a potential trade-off between bias  $b(r,t)$ and variance
  $\sigma^2_{\varepsilon}(e)$: the most knowledgeable referees are often connected to authors working in the same area. Altonji et al. (Reference Altonji, Imbens, Lang, Luttmer, Rasul, Stantcheva and Wacziarg2025) propose several policies to help navigate this trade-off, including requiring reviewers and authors to disclose potential conflicts and offering clearer guidelines about what constitutes a conflict. Nine of the ten journals listed in Table 1 have conflict policies for editors, while six have them for referees.
To minimize negative bias from conflicts, one idea is to give authors the option to proactively oppose the appointment of certain referees. This idea has broad support: 61% of respondents report favorable attitudes, 12% report unfavorable ones, and the average response is 3.75 ( $p \lt 0.001$ against 3, Fig. 1). Attitudes are similarly favorable in Altonji et al. (Reference Altonji, Imbens, Lang, Luttmer, Rasul, Stantcheva and Wacziarg2025). While authors may attempt to use this policy strategically (Moore et al., Reference Moore, Neilson and Siegel2011; Teixeira da Silva & Alkhatib, Reference Teixeira da Silva and Alkhatib2018), the option would be available to everyone. Moreover, editors may find complaints about certain referees more credible when they are communicated before manuscript decisions, rather than ex-post. This option exists at neither the ESA journals nor the top-5 journals (Table 1).
5. Open communication
We now examine two other dimensions of peer review: the publication of peer-review documents and the mediation of interactions between stakeholders (COPE Council, Reference COPE Council2017). COPE identifies three publication policies: keeping reports confidential, publishing unsigned reports, and publishing signed reports. For mediation, they distinguish between editor-mediated interactions, open interaction between reviewers, and open interaction between reviewers and authors. Unpublished reports and editor-mediated interactions are uniformly embraced by the top-5 and ESA journals (Table 1). We consider policies that deviate from these norms.
5.1. Publication of peer-review documents and metadata
The case for publishing peer-review data
Most journals keep referee reports and decision letters confidential by default, as sharing them would likely require the informed consent of authors, referees, and editors (COPE Council, Reference COPE Council2017). Yet, some exceptions outside economics exist, including The BMJ and Nature (Table 1). Journals are also increasingly sharing statistics and metadata, such as average turnaround times.
Publishing peer-review documents is likely to increase the scrutiny faced by reviewers and editors because such materials often contain identifying elements (even if unsigned) and because low-quality reports and letters can harm the reputation of journals. Fully open peer review, i.e., publishing signed reports, would amplify this further by removing any doubts about identities. As discussed previously, the net effect of enhanced scrutiny depends on the relative strength of the effort and bias channels.
Making peer-review documents public (with author responses and prior manuscript versions) could also help readers assess a paper’s intrinsic quality  $q$, the informativeness of referee feedback (reflected in
  $\sigma^2_{\varepsilon}(e)$ and
  $b(r,t)$), and the added value of revisions
  $\Delta(e)$. Beyond individual papers, such documents could shed light on how peer review shapes research by providing stronger evidence on whether
  $\Delta(e)$ varies with the number of revision rounds or the nature of revision requests (Malički et al., Reference Malički, Jerončić, ter Riet, Bouter, Ioannidis, Aalbersberg and Goodman2022). This may be particularly relevant in experimental economics, where requests for additional experiments can be especially costly.
Scope for increasing data sharing
Our respondents are generally supportive of sharing anonymized referee reports and author responses: 55% hold favorable views, 22% unfavorable views, and the average rating is 3.45 ( $p \lt 0.001$ against 3; Fig. 1). However, respondents appear less convinced of the impact of this policy on review quality: only 38% expect it to be useful, while 41% expect otherwise; the average rating is 2.94 (
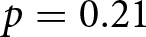 $p=0.21$ against 3). The divergence between favorability and perceived usefulness – moderate at the individual level (correlation
  $\rho=0.59$ between responses) – may reflect the view that publishing these documents is informative but unlikely to change reviewer behavior.
To go one step further, we also measured attitudes toward fully open peer review. Respondents were fairly skeptical, with 50% holding unfavorable attitudes, 27% holding favorable attitudes, and an average response of 2.63 ( $p \lt 0.001$ against 3, Fig. 1). Interestingly, attitudes are less positive than those toward publishing unsigned reports, but more positive than toward referee identifiability with confidential reports.
Our respondents’ views appear more cautious than those expressed in a cross-disciplinary survey on open peer review (Ross-Hellauer et al., Reference Ross-Hellauer, Deppe and Schmidt2017). Cautious attitudes could be expected given the very limited evidence available on the impact of such policies. The two main studies on the topic are Bravo et al. (Reference Bravo, Grimaldo, Lopez-Inesta, Mehmani and Squazzoni2019), who observationally examine how publishing unsigned referee reports affects behavior at five journals, and van Rooyen et al. (Reference van Rooyen, Delamothe and Evans2010), who randomly informed some referees that their signed reviews might be published online. Bravo et al. (Reference Bravo, Grimaldo, Lopez-Inesta, Mehmani and Squazzoni2019) find no overall effect on key outcomes, including willingness to review, time spent, report quality (proxied by objective language), or referee recommendations. However, younger and non-academic referees increased their willingness to review, showed greater objectivity, and gave more positive recommendations, suggesting that less influential referees may be more sensitive to scrutiny. Results differ somewhat in van Rooyen et al. (Reference van Rooyen, Delamothe and Evans2010), where treated referees spent more time on reports and produced higher-quality reviews for accepted papers, though they were no more likely to recommend acceptance. Suggestively, Zong et al. (Reference Zong, Xie and Liang2020) find that papers with voluntarily disclosed review histories are cited more often.
Alternative or complementary approaches
Short of sharing full review histories, journals could publish summaries of how manuscripts changed from submission to publication, as done by F1000Research (Online Resource Table A.6). This would provide standardized, low-burden evidence on the effects of peer review. As proposed by Altonji et al. (Reference Altonji, Imbens, Lang, Luttmer, Rasul, Stantcheva and Wacziarg2025), journals could also standardize how they report metadata, such as turnaround times and acceptance rates, to enable comparisons across journals. More granular information, such as submission dates or the number of revision rounds, could further enhance transparency, promote accountability, and help authors make more informed submission decisions without compromising confidentiality. Finally, Altonji et al. (Reference Altonji, Imbens, Lang, Luttmer, Rasul, Stantcheva and Wacziarg2025) suggest that journals could make author contribution statements mandatory for papers with many authors, as done in other disciplines; this would allow all readers, including those on tenure, hiring, and promotion committees, to understand the distribution of work and the contributions of specific co-authors.
5.2. Open channels of communication
The case for opening communication
Interactions between stakeholders during the review process in economics tend to be limited and asynchronous. In particular, editors interact directly with authors and reviewers in sequential stages and mediate interactions between these stakeholders via referee reports and author responses. As such, under the status quo, the editor is responsible for aggregating the demands of reviewers and giving direction to authors. Such efforts appear essential, as a near majority of respondents (46%) complained about “unrealistic” and/or “inconsistent” demands from reviewers. However, many of our respondents also expressed discontent regarding the extent of editorial direction (Charness et al., Reference Charness, Dreber, Evans, Gill and Toussaert2022) and the word “editor” appeared frequently in their comments, as shown in Online Resource Fig. B.5. In principle, a more directed and dynamic review process could allow stakeholders to discuss and resolve these issues promptly. This could also substantially speed up turnaround times, especially if these discussions replace multi-month revision rounds, an issue that distinguishes economics from other disciplines (Hamermesh, Reference Hamermesh1994; Hadavand et al., Reference Hadavand, Hamermesh and Wilson2024). These benefits must be balanced against communication costs, as a more interactive review process might require more intense effort from editors and referees at specific times. In addition, increasing the volume of interactions makes de-anonymization more likely and could create opportunities for well-connected authors to apply pressure on reviewers.
Scope for increasing communication channels
The most ambitious version of increased communication would allow real-time interactions between authors and referees, as practiced by Frontiers (Table 1). Very few journals currently use this format, and empirical evidence on mediation policies remains limited (Ross-Hellauer et al., Reference Ross-Hellauer, Deppe and Schmidt2017), making it unlikely to be adopted in disciplines with more conservative peer-review practices, such as economics.
Short of a fully interactive system, journals could open new channels between selected stakeholders. One option is to establish an official procedure for authors to respond to editors and referees after receiving a rejection. This would allow authors to plead their case without imposing significant additional work on editors or referees in most cases. Formal appeals are standard in computer science conferences (Shah, Reference Shah2022) but are not always available in economics (Table 1). Anecdotal evidence suggests that informal appeals occur in practice; if such appeals disproportionately favor well-connected authors, a formal procedure could help create a more level playing field. We asked respondents for their views on such a policy: over 60% were favorable, 19% were unfavorable, and the average response was 3.63 ( $p \lt 0.001$ against 3; Fig. 1). Support was similar among editors (
 $-0.01$,
 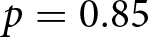 $p=0.85$) but somewhat lower among active reviewers (
 $-0.10$,
  $p \lt 0.001$).
Another option is to ask authors to submit a revision proposal to editors and referees before proceeding with an R&R. This could clarify key issues before costly revisions are undertaken and reduce wasted effort on revising manuscripts that are ultimately rejected. The downside is the additional upfront work required.
Finally, journals could share reports between reviewers more systematically. This policy is popular among respondents: 71% find it useful and 13% do not, with an average response of 3.9 ( $p \lt 0.001$ against 3; Fig. 1). This is typically done ex post but could also occur at an intermediate stage to help referees with their evaluations. Some editors, however, may prefer to preserve signal independence (Lorenz et al., Reference Lorenz, Rauhut, Schweitzer and Helbing2011).
6. Evaluating policies jointly
The previous sections examined support for each policy separately. To identify possible complementarities, we now consider whether support for transparency in one dimension predicts support in others.
Correlations between respondents’ support for different policies are generally weak, with most below 0.30 (Online Resource Fig. B.2). The strongest is between de-anonymizing associate editors and senior referees (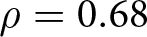 $\rho=0.68$). Moderate correlations also appear between support for fully open peer review and both de-anonymizing senior referees (
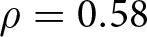 $\rho=0.58$) and disclosing review histories (
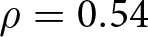 $\rho=0.54$). No other correlation exceeds
  $\rho=0.50$.
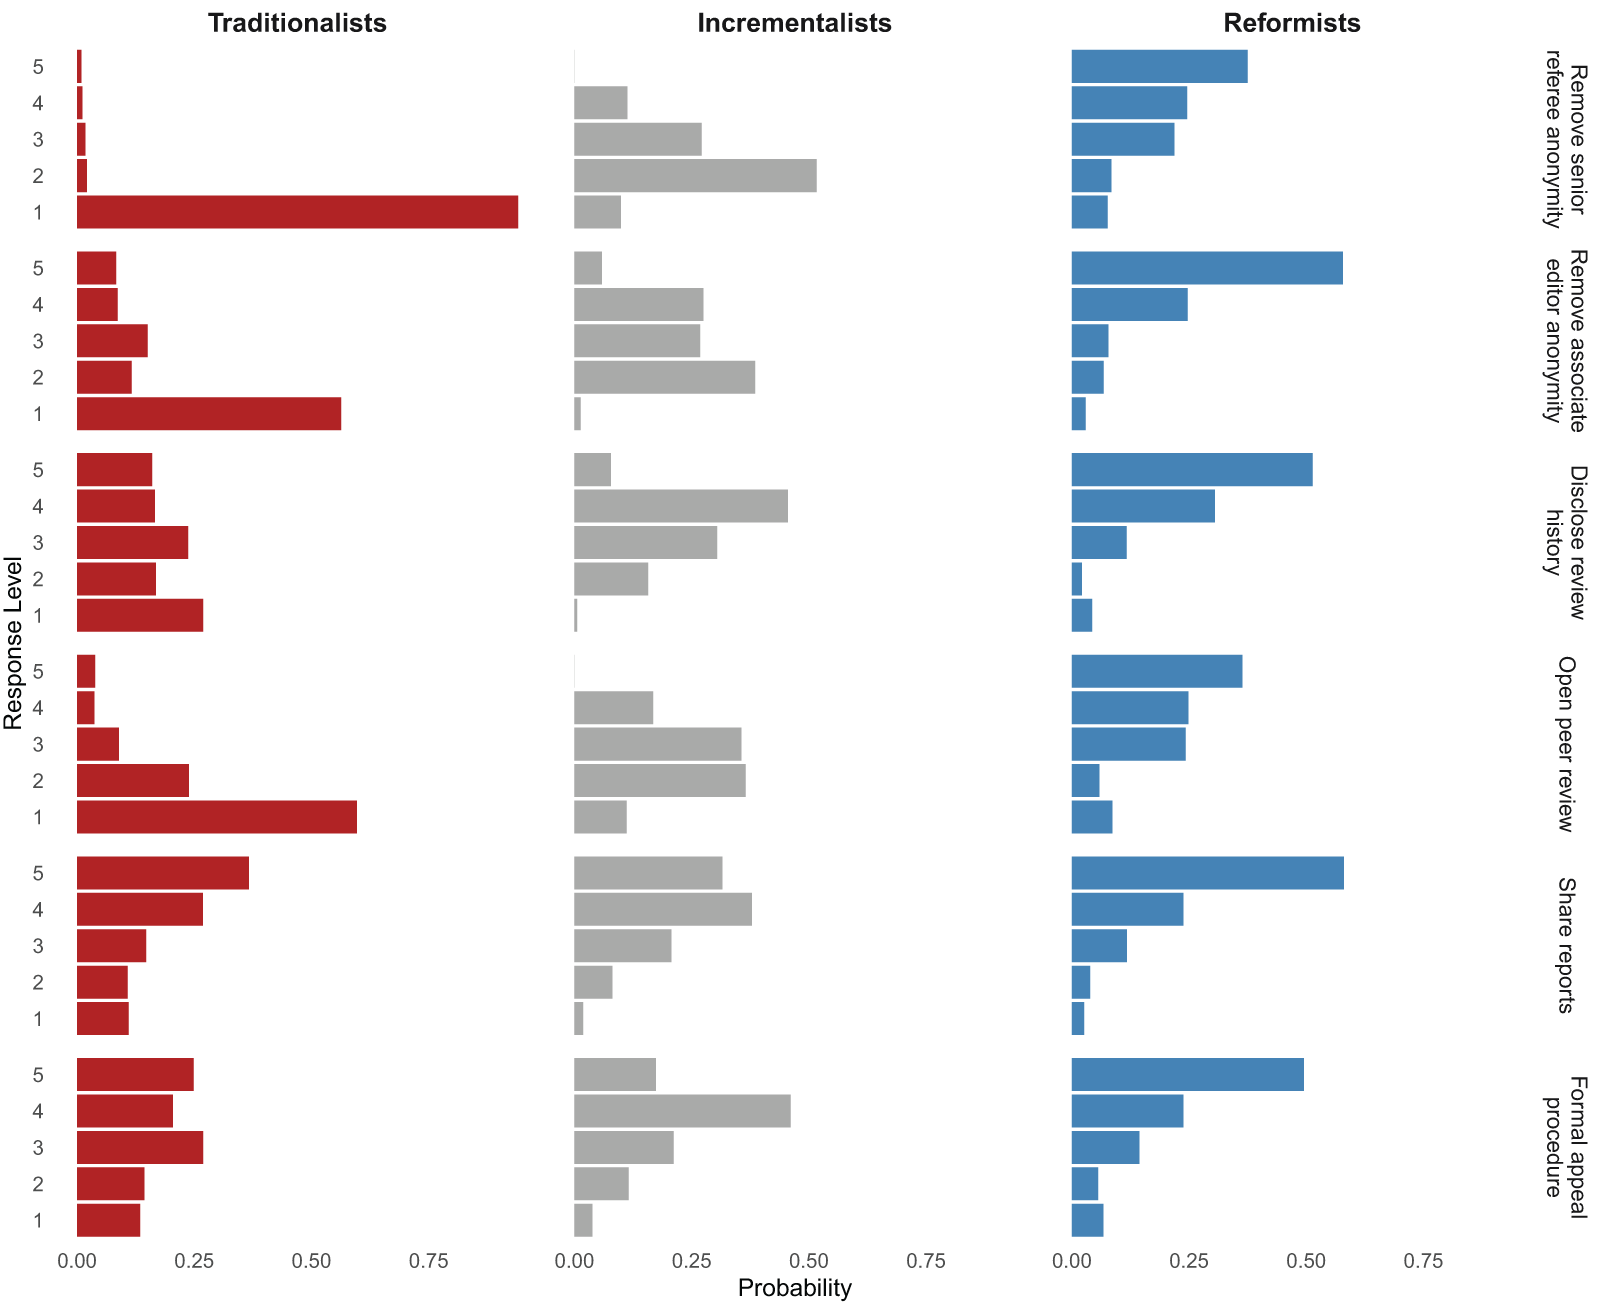
Since correlations only capture linear, pairwise relationships, we also use LCA to identify distinct respondent types with similar attitudes. Using the six questions answered by the full sample, we group respondents based on their rating patterns, selecting the number of classes using the Bayesian Information Criterion. As shown in Fig. 2, the LCA identifies three groups differing in their openness to reform. The first group (red), which we label Traditionalists, generally favors the status quo and holds the most negative views on open peer review. They have the highest likelihood of giving each policy a rating of 1. At the other end, the third group (blue), the Reformists, shows the highest probability of rating each policy as 5. In between, the second group (gray), the Incrementalists, gives responses closer to 3 for each question. No group forms a majority: 38% are Incrementalists, 33% are Traditionalists, and 28% are Reformists (Online Resource Fig. B.3).
LCA classification of responses

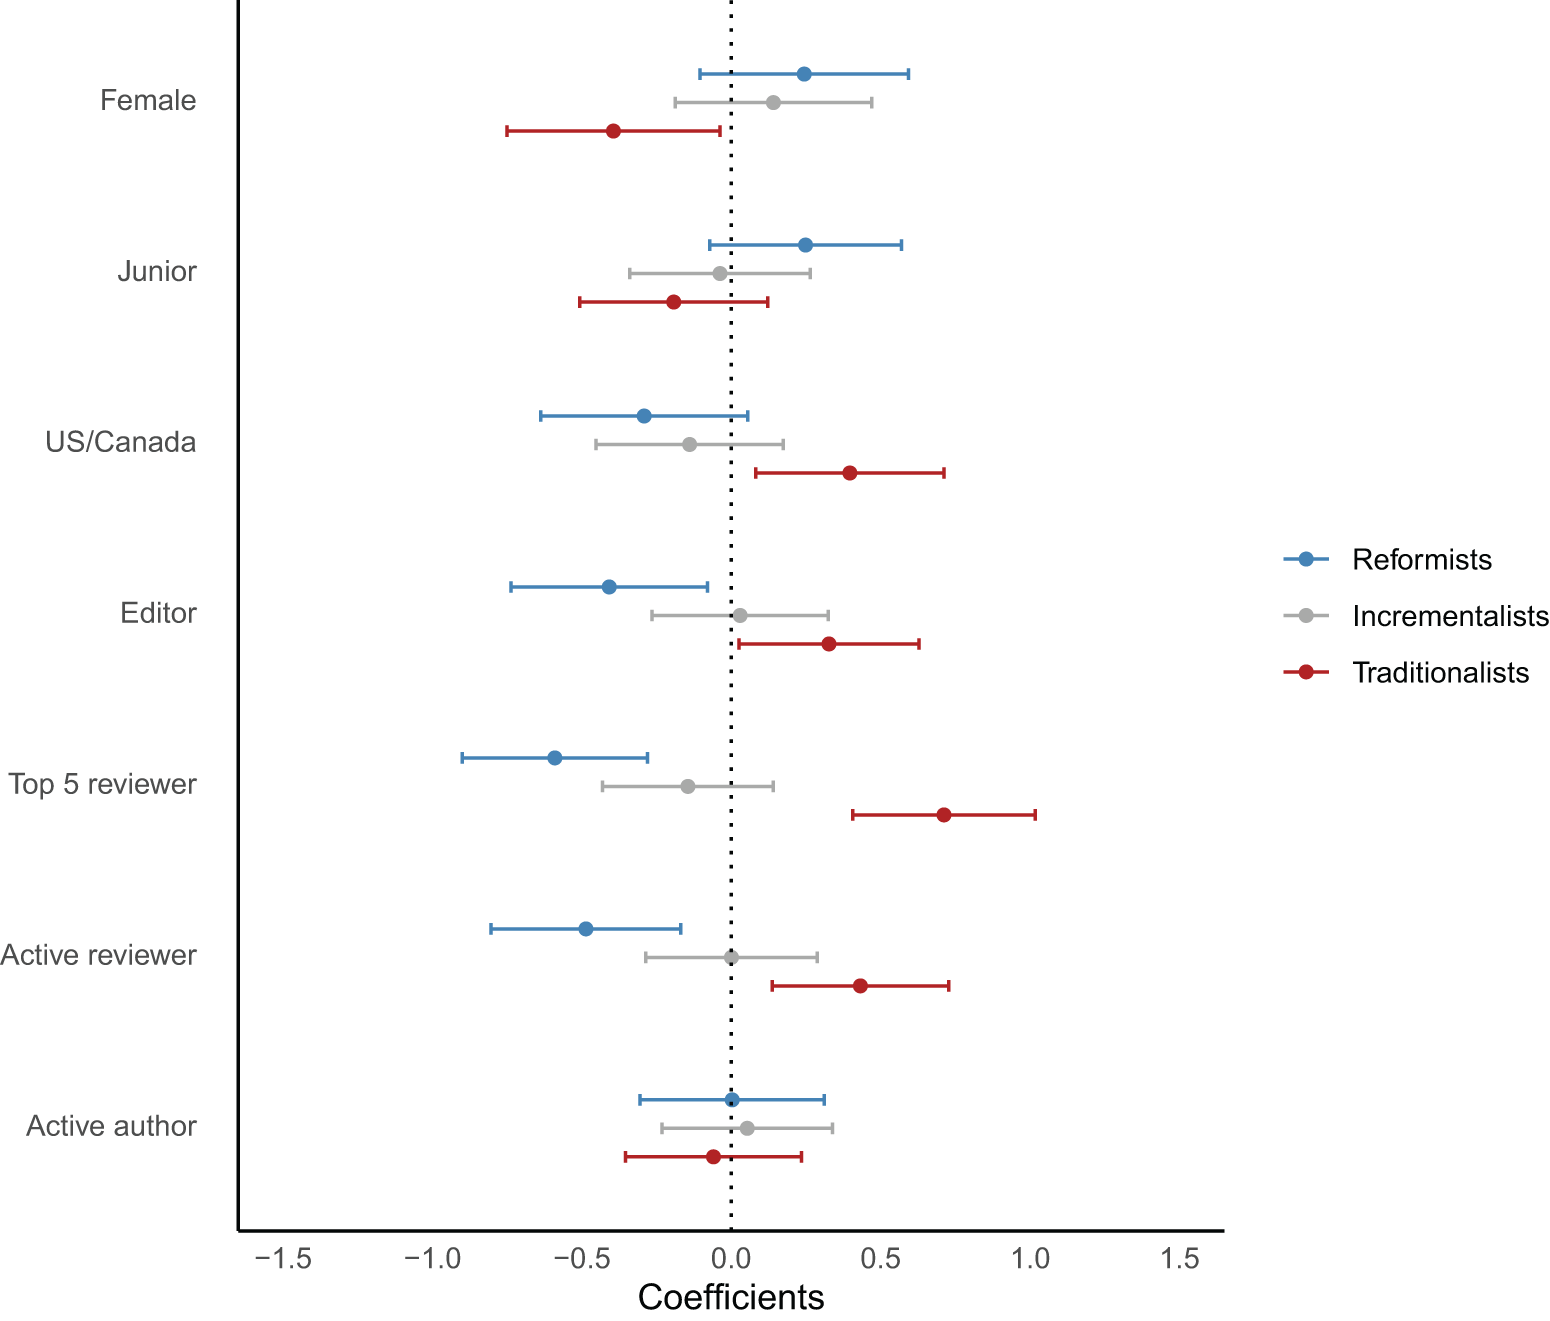
To explore potential heterogeneity, we regressed indicators for class membership on a range of demographic characteristics (Fig. 3).Footnote 8 Respondents from the US/Canada, editors, top-5 reviewers, and active reviewers, possible “gatekeepers” of the system, are more likely to be classified as Traditionalists, while female respondents are less likely. Editors, top-5 reviewers, and active reviewers are less likely to be classified as Reformists. No other significant differences emerge.Footnote 9 This classification exercise reveals that the lack of consensus on many policies may reflect the existence of distinct factions in the transparency debate.
Demographic predictors of LCA classification

Our heterogeneity findings align with recent surveys suggesting that seniority is negatively associated with support for certain open science practices, such as pre-analysis plans (Ross-Hellauer et al., Reference Ross-Hellauer, Deppe and Schmidt2017; Logg & Dorison, Reference Logg and Dorison2021; Spitzer & Mueller, Reference Spitzer and Mueller2023; Imai et al., Reference Imai, Toussaert, Baillon, Ertaç, Johannesson, Neyse and Villeval2025). For example, Imai et al. (Reference Imai, Toussaert, Baillon, Ertaç, Johannesson, Neyse and Villeval2025) find that full professors are less favorable toward pre-analysis plans, policies recommending or mandating their use, registered reports, and results-blind review. By contrast, Ferguson et al. (Reference Ferguson, Littman, Christensen, Paluck, Swanson, Wang, Miguel, Birke and Pezzuto2023) find no difference in support for open science practices between published authors and PhD students.
7. Looking forward
In this article, we investigated our respondents’ attitudes toward transparency reforms in peer review. Overall, we find some degree of openness toward making changes, but views differ based on the exact policy considered and respondent characteristics. Starting with identifiability, there is no clear majority in favor of changing the status quo for senior referees, associate editors, or authors, though opinions about the latter two are more ambivalent. In contrast, there is strong support for allowing authors to oppose the assignment of specific reviewers. On open communication, respondents express broad support for publishing unsigned referee reports and author responses, sharing reports among reviewers, and establishing a formal appeal process, while remaining skeptical of publishing signed reports. Looking across policies, we identify three respondent types: Traditionalists (33%), Incrementalists (38%), and Reformists (28%). Membership in the Traditionalist class is somewhat predicted by seniority (editor status) and network centrality (US/Canada, top-5 reviewer) and negatively predicted by whether a respondent is female.
Our findings come with three key policy implications. First, it is likely that a handful of policies are already possible to implement globally with minimal risk of backlash, including sharing reports between reviewers and allowing author appeals. Second, given possible heterogeneous effects and divided opinions about policies like anonymity for authors, some degree of horizontal differentiation between journals may make sense. For example, Econometrica recently opened an additional channel for manuscript readers to engage in post-publication discussion about papers (Online Resource Table A.6). Policies like these allow stakeholders to sort into journals whose transparency norms are consistent with their preferences and create data that helps other journals make informed decisions about policy adoption. Third, given that respondent views differ substantially based on demographic characteristics, recruiting diverse editorial boards could help ensure that policy adoption decisions are made with input from multiple perspectives.
Our findings also come with caveats. First, even through the lens of the single objective function that we examine, most policies have ambiguous effects on the quality of peer review due to competing forces. Furthermore, different journals likely have different objective functions, with some placing more weight on the experiences of authors (e.g., ensuring fast and fair decisions) and others prioritizing the interests of referees, editors, and readers. These factors may help explain the lack of consensus among our respondents on some policies. Second, while we discuss a broad range of policies, we necessarily do not cover every topic. Certain omitted topics, like the role of large language models in peer review, have received a great deal of attention recently (Altonji et al., Reference Altonji, Imbens, Lang, Luttmer, Rasul, Stantcheva and Wacziarg2025; Rao et al., Reference Rao, Kumar, Lakkaraju and Shah2025). Third, among the policies that we do consider, our survey results focus on measuring attitudes rather than the determinants of these attitudes. Relatedly, our elicitations are unincentivized, subject to measurement error, and might depend on whether respondents answer from their perspective as an author, referee, reader, or editor.Footnote 10 Finally, we acknowledge limitations in how actionable our findings are, given the minimal causal evidence that exists to assist journals with policy adoption. To address this, we encourage journals and other institutions to run their own experiments and surveys in a systematic manner, as outlined by Bendiscioli et al. (Reference Bendiscioli, Firpo, Bravo-Biosca, Czibor, Garfinkel, Stafford, Wilsdon and Buckley Woods2022).
This further research could take many directions. In particular, future surveys could investigate how beliefs about policy impact map into overall policy support, measure support for alternative policies, and track how views evolve over time. Additional experimental studies, particularly within economics, would be useful for filling the current gap in causal evidence. Since real-world trials are difficult to implement, lab or online experiments that simulate peer review could serve as a first step. Studies of opt-in policies could also shed light on take-up rates and help shift norms over time.
Supplementary material
The supplementary material for this article can be found at https://doi.org/10.1017/esa.2026.10030.
Data availability statement
The replication material for the study is available at https://doi.org/10.17605/OSF.IO/GJ586.
Acknowledgements
This article represents an adaptation of the transparency section of our earlier report on peer review in economics. The analyses presented in this paper do not follow a pre-analysis plan and, as such, are exploratory. We would like to thank all of the associations and networks that helped us advertise the survey to their members, including CEPR, CESifo, the ESA, and the EEA. Our appreciation also goes out to the editors at various journals for the statistics provided and to Peter Andre and Fulya Ersoy for the statistics and datasets they shared with us. This project benefited from the wonderful research assistance of Raffaele Blasone, Ingrid Löfman, Jessica Milligan, Rafael Suchy, Alena Wabitsch, and Le Wu.
Funding statement
Anna Dreber acknowledges funding support from the Jan Wallander and Tom Hedelius Foundation (Svenska Handelsbankens Forskningsstiftelser), the Knut and Alice Wallenberg Foundation, the Marianne and Marcus Wallenberg Foundation (in the form of a Wallenberg Scholar grant awarded to AD), and the Austrian Science Fund (FWF, SFB F63). Daniel Evans acknowledges funding support from the Deutsche Forschungsgemeinschaft (DFG, German Research Foundation) under Germany’s Excellence Strategy – EXC 2126/2 – 390838866. Adam Gill acknowledges funding support from the Jan Wallander and Tom Hedelius Foundation (H22-0007). Séverine Toussaert acknowledges funding support from the Economic and Social Research Council (ES/V003461/1).
Ethical standards
The survey received ethics approval from the University of Oxford (Approval # ECONCIA21-21-20).


 Open access