

Section 1. Overview and policy recommendations
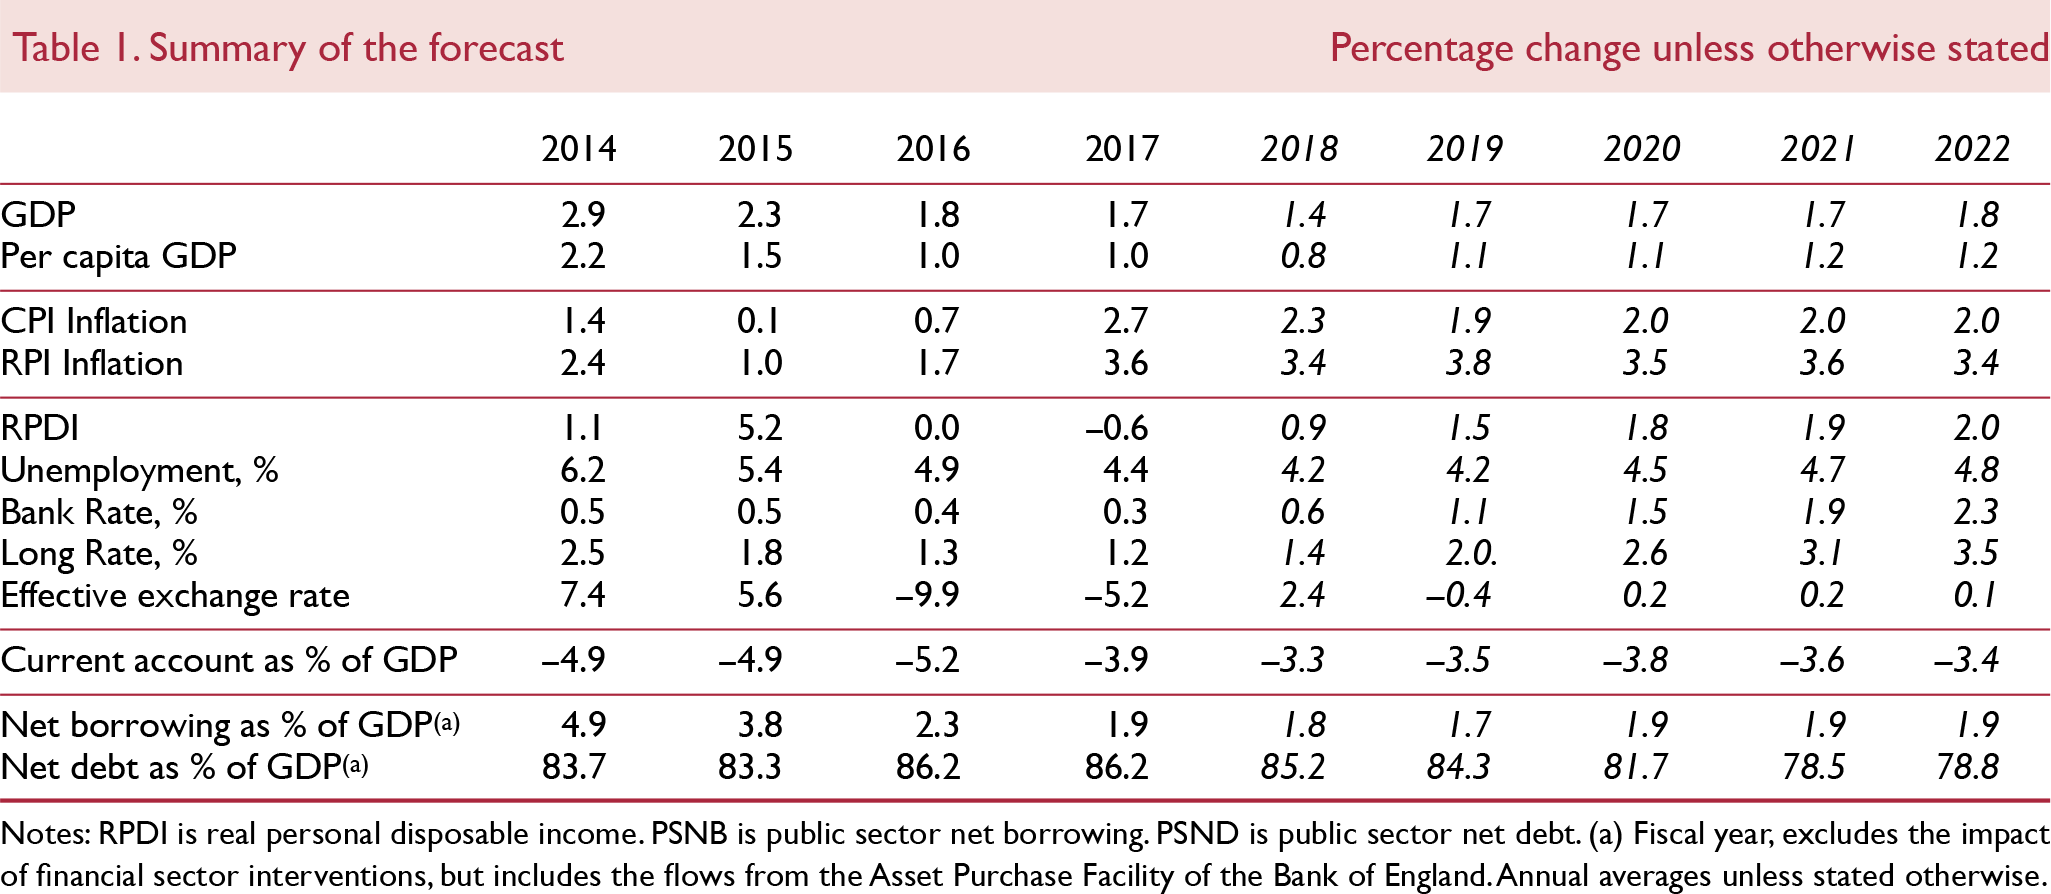
It is particularly difficult to be confident about any forecast of the UK economy at the moment in view of the significant uncertainty around important policy decisions. Despite this the economy is growing in line with potential but it is reaching a crunch point soon.
As before, Brexit remains the most important source of uncertainty facing the United Kingdom (Reference Carreras, Ebell, Kirby, Meaning, Piggott and WarrenCarreras et al., 2016, and Reference PiggottPiggott, 2016) and there is evidence to suggest that the economy has been weakened by elevated uncertainty. The UK is just eight months away from the March 2019 EU exit date and the range of outcomes remains as wide as ever. We are by no means sure that there will be a deal that can be struck by then and even if there is a deal, it is not clear how policymakers, businesses and households will respond to the new arrangement and all along, the chance of a second referendum is rising.
There are other policy driven uncertainties. Among the most significant, at the global level, is the risk of a trade war between the US and other economies. The size of the tariffs imposed so far is relatively contained, but there is a risk that the tariff wars spread to other goods and services and also involve more countries. In Box A of the World Economy chapter we show that the impact on GDP and inflation of the tariffs imposed so far is relatively modest but the impact would be more significant if the US government imposed new tariffs and others responded with tit-for-tat measures. See Reference CarneyCarney (2018) for a further example of a recent NiGEM simulation on the impact of tariffs on global GDP.
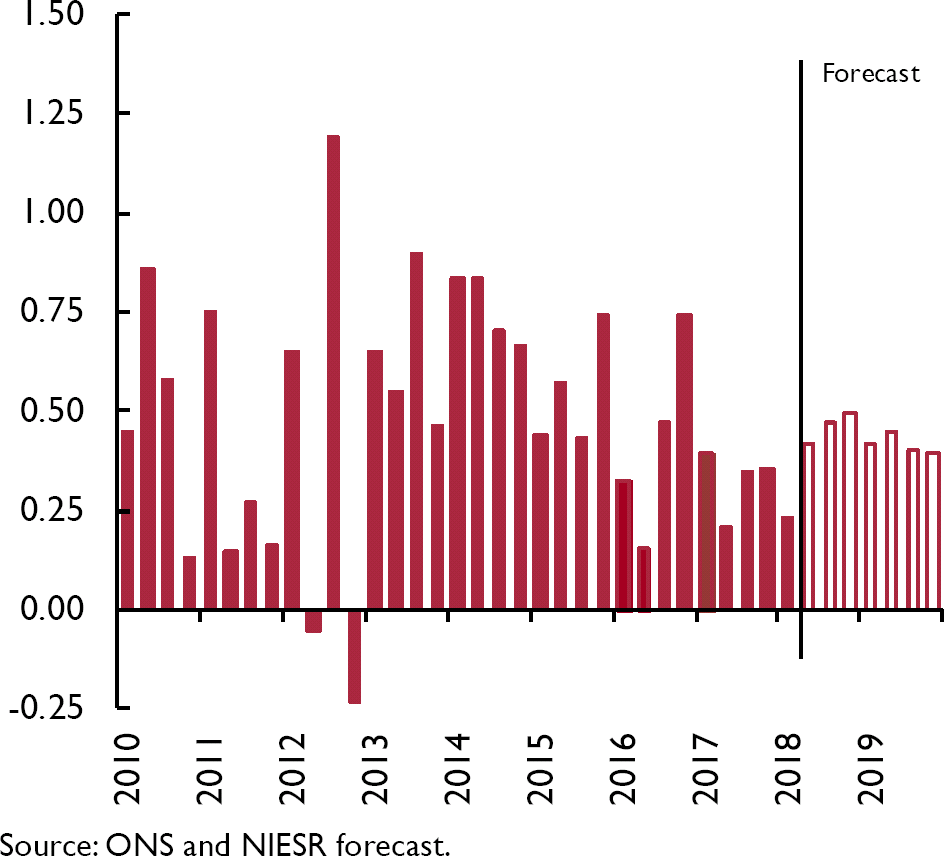
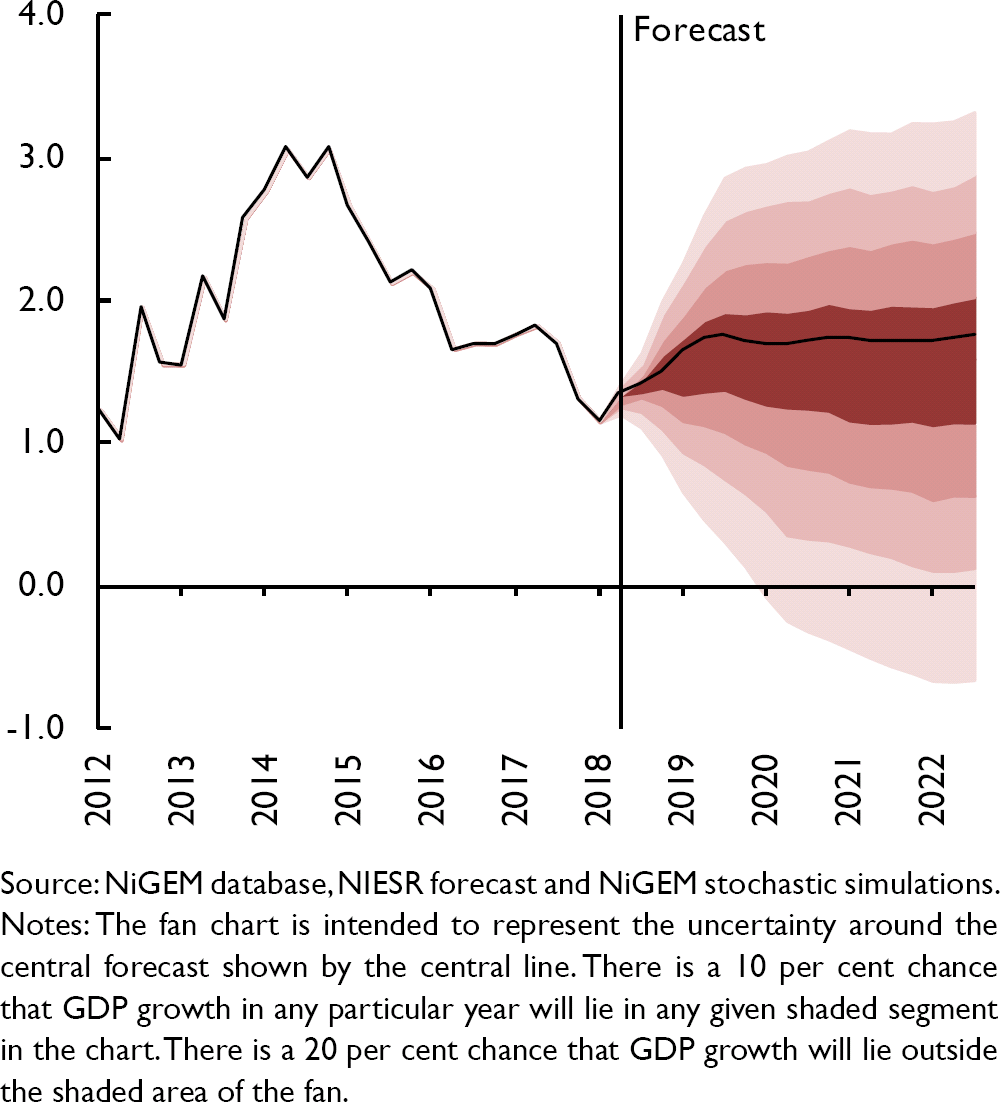
As before, our central case assumes an exit from the EU where the UK maintains a high level of market access for goods and services to the EU and where financial markets are not subject to dislocation, the so-called ‘soft Brexit’. We also assume that the trade dispute between the US and other countries remains contained with negligible implications for global trade and UK GDP growth. Under those circumstances, GDP growth is set to grow at close to its potential at 1.7 per cent next year after growth of 1.4 per cent this year (figure 1), which was affected by severe weather in the first quarter: this path is consistent with the short-term growth forecast from our new monthly GDP Tracker and also broadly similar to our previous forecast. The risks to our GDP growth forecast are tilted to the downside.
Real GDP growth (per cent per quarter)
It is against this backdrop that HM Treasury and the Bank of England Monetary Policy Committee (MPC) will set fiscal and monetary policy. We have argued previously that austerity fatigue has set in and the government's focus must shift away from repairing public finances to repairing public services (Reference Hantzsche and YoungHantszche and Young, 2018). At the least, this requires the government to maintain the current level of spending (as a proportion of GDP) and look to fund that additional spending either through borrowing or tax increases. Should the economy evolve in line with our forecast, there is a case for the MPC to remain on a gentle path of interest rate normalisation and emphasise to the public that there is not a pre-determined path for the policy rate. In particular, we would expect the MPC to communicate its willingness to stand ready to act quickly and aggressively in either direction should alternative circumstances materialise.
Brexit White Paper
In a major development since our last forecast, the UK government published a White Paper on 12 July with an outline of its preferred relationship with the EU after Brexit. Although this is the most detailed plan published by the UK government to date, many questions remain open. Moreover, the White Paper has failed to unite the Cabinet, the governing Conservative Party or Parliament and, as a result, the entire spectrum of possibilities, ranging from a second referendum to a no-deal Brexit, remains as likely as before (Reference HixHix, 2018).
Although a large part of the draft withdrawal agreement has been settled between the two sides, important areas related to the future trading relationship and the status of a customs border in and around Ireland remain outstanding. Both sides are looking to reach an agreement by October 2018 to allow the European Parliament to approve the withdrawal agreement and ensure that a deal is in place ahead of Brexit on 29 March 2019.
In the White Paper the government has prioritised trade in goods over services and aims to limit the free movement of people. The core of the proposal is a free trade area for goods with a ‘common rulebook’ with the EU and a new type of customs arrangement (Facilitated Customs Arrangement) that will replace the single market and the existing customs union and at the same time ensure that there is no hard border between Ireland and Northern Ireland. For services, the government is no longer seeking a mutual recognition arrangement and has instead asked for enhanced equivalence. Mutual recognition offers market access even with regulatory divergence whereas under an equivalence regime both sides need to be satisfied that the regulations achieve the same outcome.
In Box A we compare the White Paper proposals against other EU free trade arrangements and conclude that the trade proposals in the White Paper are similar in scope to the EU-Switzerland arrangement. It is likely, therefore, that if the UK insists on this level of engagement the EU will insist on concessions on the movement of people, the role of the Court of Justice of the European Union and a budgetary contribution.
Assuming that the government's White Paper proposals are adopted in full, we estimate a GDP loss of around 2.5 per cent relative to our soft-Brexit central forecast over the next 10 years, but this does not include the possible impact of a loss in productivity which could be material (Reference Hantzsche and KaraHantzsche and Kara, 2018). In that case inflation will be higher by 1.4 percentage points on impact, mainly because we assume that the currency will depreciate, and in our view any fiscal gains from a lower financial contribution to the EU will be more than offset by a loss to GDP.
Productivity
Alongside policy-related uncertainty, there is also uncertainty about future productivity growth and the overall speed limit of the economy. UK productivity has been particularly weak and disappointing since the financial crisis, so much so that the productivity gap relative to a pre-crisis trend is twice as big in the UK as for the G7 (ex UK) average.
Recently tentative signs of a recovery in labour productivity in the second half of last year were snuffed out in the first quarter (see Supply Conditions). As before, we have treated this putative recovery with caution for this forecast round and held our lower medium-term productivity forecast unchanged, but there are some reasons to be optimistic. Higher minimum wages and the very rapid increase in the living wage, together with lower levels of net migration that create labour scarcity, may well trigger increases in business investment that can help raise labour productivity which, in turn, is likely to help lift real wage growth (see Box B in the May 2018 Review and Reference Riley and Rosazza BondibeneRiley and Rosazza Bondibene, 2017).
Fiscal assumptions
As in our May forecast, we have assumed that the government will struggle to maintain its self-imposed fiscal rule. The government's target to lower the total managed expenditure-to-GDP ratio to a level below its long-run average is unsustainable in our view. As a result, our forecast assumes additional government spending such that the ratio remains constant at its current level (see Public Finance section below). As it happens, some of that additional spending has already been pledged with the decision to spend an additional £20.5 billion per year (around 1 per cent of GDP) by 2023–4 on the National Health Service. In addition, pay increases for public sector workers will add to funding pressures. The pay rises will help narrow, but not eliminate, the wage gap between the private and public sector that started to emerge after the government imposed a pay restraint on public sector wages. Additional pay rises will be necessary, in our view, to further narrow that gap.
UK government Brexit White Paper
The UK government published a White Paper (The future relationship between the United Kingdom and the European Union) on 12 July outlining its preferences for a future relationship with the EU.Footnote 1 In this box we compare the proposals outlined in the White Paper against other EU free trade agreements (FTA) and also estimate the impact on the UK relative to our central forecast which assumes a soft Brexit.
Benchmarking the White Paper proposals
The World Bank database of preferential trade agreements provides a detailed measure of the depth of all the agreements worldwide that were signed after 1957. We update that database with the White Paper proposals, building on earlier work that was published in the February Review (see Box C ‘The Great British trade-off’).
Our results suggest that the trade intensity of the White Paper proposals is comparable to Switzerland or Canada and is less comprehensive than a Norway-style EEA arrangement. The score essentially reflects a comprehensive FTA for goods and the shortfall is explained by the proposals for services.
Non-EU countries that have secured deep and broad trading arrangements with the EU have had to concede ground on the free movement of labour, the jurisdiction of the CJEU and/or make a budgetary contribution to various programmes run by the EU. Figure A1 is a visual representation of the extent of the depth and breadth of EU engagement. We have selected three key dimensions to define the relationship between the EU and non-EU countries and the vertices of the triangle correspond to each of these: full market access, complete freedom of movement of people and size of the financial contribution (as a percentage of Gross National Income). One could add other dimensions to the analysis such as the role of the CJEU, security, defence, fiscal harmonisation, but we have, for the sake of simplicity, restricted our analysis to the what we believe are the three most important areas of negotiation between the UK and the EU.
The EU engagement triangle
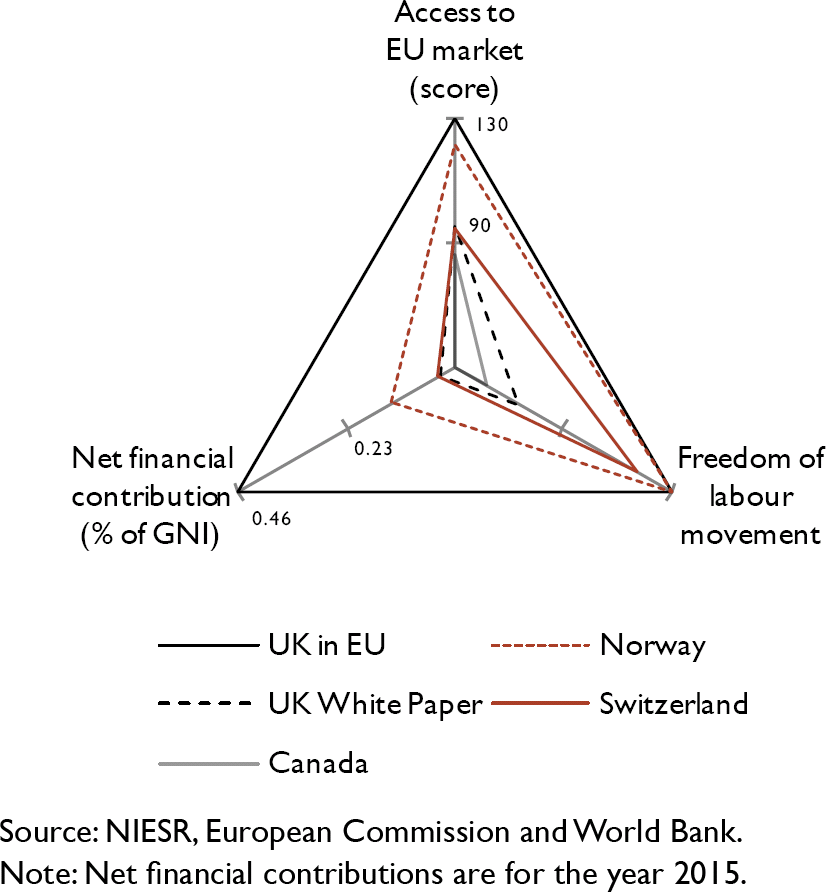
Briefly, the largest triangle represents the UK current level of engagement as a member state of the EU: the UK has full access to the EU market in goods and services, allows EU citizens to move freely in and out of the UK, and contributes about 0.5 per cent of GNI to the EU budget, net of what it receives. Norway opted to join the European Economic Area (EEA) to have close to full access to the single market, both in goods and services. The dashed red triangle shows that, to be accepted as a member of the EEA, Norway had to agree to significant financial contributions (‘Norway Grants’, amounting to 0.14 per cent of GNI) and freedom of movement of persons. Switzerland's bilateral agreements with the EU means that it allows freedom of movement of persons, makes a very small net budgetary contribution, but its market access is significantly reduced in the service sector. Finally, the trade deal with Canada (CETA) is less extensive than Switzerland and is essentially restricted to just goods. Canada does not make a budgetary contribution.
The UK White Paper proposals are represented in the dotted black line. Market access for the White Paper, based on our scoring, stands at 90, which is close to Switzerland (89) and Canada (79) and the movement of labour provisions fall well short of Switzerland and only marginally higher than Canada. We have assumed that the UK budgetary contribution to the EU will be small. Legal technicalities aside, our benchmarking exercise suggests that the EU is likely to insist on more generous provisions for the free movement of labour and is also likely to insist on a budgetary contribution.
Impact on the economy
To simulate the effects of a deal as implied by this White Paper, in contrast to the soft Brexit assumed in our forecast, we have made the following assumptions, which come into effect in the first quarter of 2021, after the transition period ends:
UK exports: In our soft Brexit central case the UK maintains a close but not complete trading relationship with the EU. Immediately after the end of the transition period, some services e.g. financial services that require passporting rights will no longer be exported to the EU. Over time, trade in services between the UK and the EU will continue to decline as businesses develop new trading relationships. In this alternative scenario we assume that trade between the UK and the EU is reduced by about 40% in the long run, based on estimates by Reference EbellEbell (2016).
Business investment: Compared to our soft Brexit scenario, the reduction in trade and increase in uncertainty will likely weigh on investment spending by UK firms and also foreign direct investment. We consider a reduction in FDI of around 12 per cent, which is approximately half the shock implied by HM Treasury (2016) and Reference Dhingra, Machin and OvermanDhingra et al. (2017) in the case of a no-deal WTO variant.
Migration: To account for reduced movement of labour within the EU as well as the UK potentially becoming a less attractive destination for migrants, we consider a reduction in net migration of around 50,000 per year compared to the ONS' principal population projection, which is not based on any Brexit specific assumptions. This figure is half way between the ONS' principal and low migration population projections.
Fiscal: According to the UK government, applying the methodology set out in the Phase 1 agreement implies a financial settlement with the EU of £35–£39 billion. The schedule of payments is yet to be decided although the Phase 1 agreement makes clear that the UK will not be required to make any payments earlier than if the UK had remained a Member State. After the budgetary framework ends in 2020, the UK continues to service its existing commitments and makes a negligible ongoing contribution. Overall, we assume that annual net contributions to the EU reduce by approximately 25 per cent
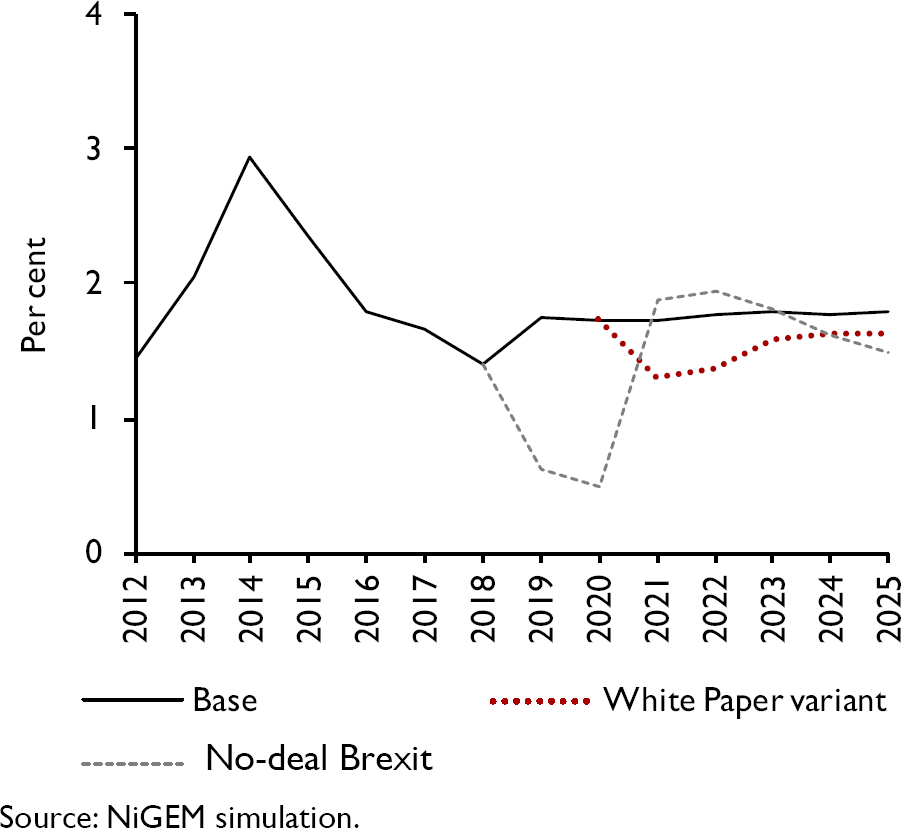
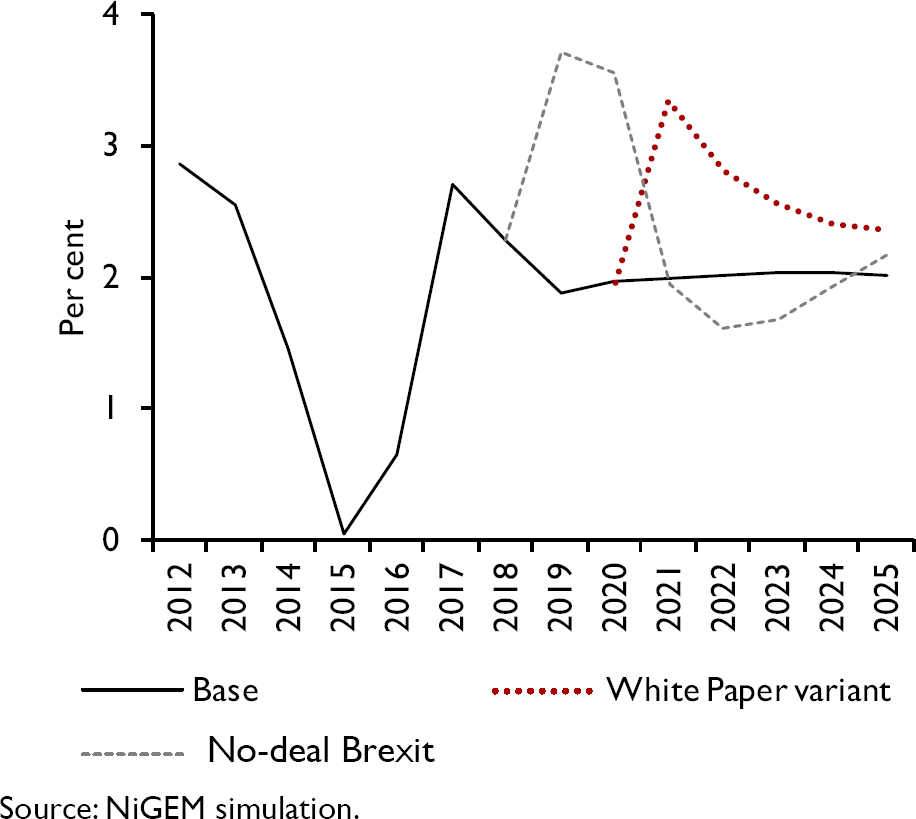
Figure A2 plots the growth rate of real GDP in this scenario, relative to our baseline soft Brexit forecast. We expect output growth to stall due to an immediate reduction in services exports to the EU. This would be moderated somewhat by a depreciation of sterling, which cheapens goods and services exported to the EU and the rest of the world but raises the price of imports. We expect this rise in import prices to feed into consumer prices, adding almost 1.4 percentage points to inflation in 2021 (figure A3), dampening domestic demand. Over time the growth rate of real GDP would settle at a lower rate than assumed in our soft Brexit forecast as net migration falls and productive capacity grows at a slower rate. This accumulates to a loss of around £500 per person per year compared to the soft Brexit scenario and to a loss of around £800 under the counterfactual WTO rules.
Baseline real GDP growth, White Paper variant and no-deal Brexit
Baseline rate of inflation, White Paper variant and no-deal Brexit
Note
1 ‘The future relationship between the United Kingdom and the European Union’ available at: https://assets.publishing.service.gov.uk/government/uploads/system/uploads/attachment_data/file/725288/The_future_relationship_between_the_United_Kingdom_and_the_European_Union.pdf/.
Inflation and GDP forecasts
All in all, we judge the risk to our GDP growth forecast to be skewed to the downside and the risk to the inflation forecast to the upside. Figures 2 and 3 are generated from our structural model, NiGEM, which allows the forecaster to apply an expert judgement and convey a complete narrative. The skew is primarily driven by our judgement on the impact of a no-deal Brexit. See Barrell et al. (2000) and Reference McCarthy and HickmanMcCarthy (1972) for details of how the fan charts are constructed.
GDP growth fan chart (per cent per annum)
Inflation fan chart (per cent per annum)
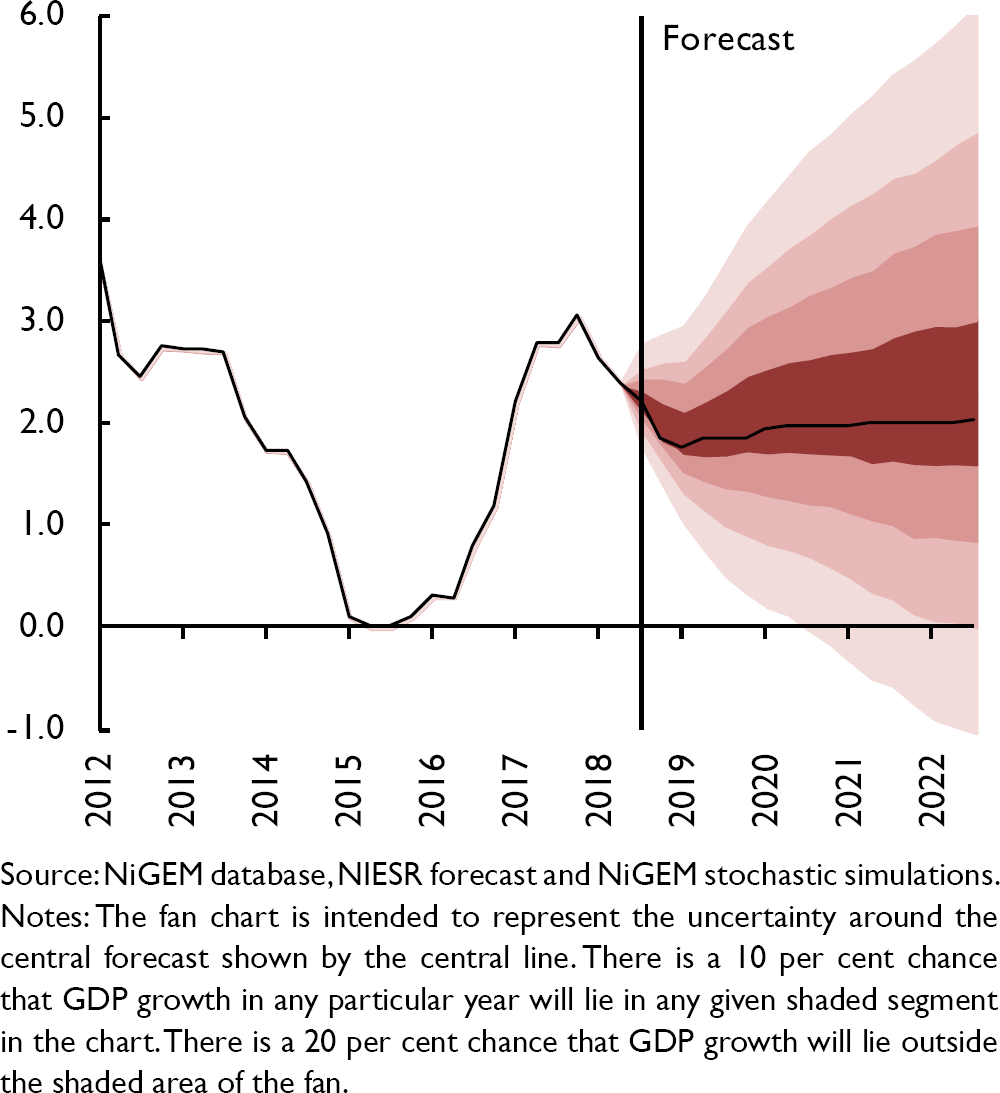
CPI inflation is set to continue falling from an average of 2.7 per cent in 2017 to 2.3 per cent this year, before settling close to the target rate of 2 per cent in 2019 and beyond. This drop is in spite of the recent depreciation of sterling. As discussed above, there are countervailing risks to that central forecast from Brexit and continued weak productivity growth. Taking both together, we judge the overall risk to inflation to be skewed to the upside.
These forecasts can be benchmarked against those we are publishing by the Warwick Business School (WBS) Forecasting System, which combines state-of-the-art statistical models weighted solely by the forecasting performance of each model (Box B). On their forecasts, real GDP growth for the final quarter of 2018 is most likely to be somewhere between 1–2 per cent (NIESR = 1.6 per cent) but their forecast is skewed to the upside, while ours points to a downside risk. The purely statistical models will tend to generate a return to long-run trends and cannot automatically condition on new events such as exit from the European Union, which is something that we can do using other models and judgement to inform the whole density. The WBS growth forecast for the final quarter of 2019 is expected to be between 2–3 per cent compared with the NIESR forecast of 1.7 per cent.
Similarly, the WBSFS model points to CPI inflation between 2–3 per cent as the most likely outcome for both the final quarters of 2018 and 2019.
An alternative benchmark for the central forecast is provided by an analysis of recent trends in the monetary aggregates. As noted in Box C, broad money growth has slowed significantly since 2016 and may be pointing to a somewhat weaker inflation outlook than in our central forecast.
Monetary policy
As before, we maintain our view that the Bank of England Monetary Policy Committee (MPC) should take a further step on the path towards the removal of some monetary policy accommodation with a 25 basis point increase in Bank Rate to 0.75 per cent at its August meeting. Beyond that, and subject to the economy evolving broadly as in our central forecast, we recommend that Bank Rate rises by 25 basis points every six months so that it reaches 2 per cent by early 2021.
The news on the economy is mixed. On one side, economic growth has recovered in the UK and elsewhere after a weak first quarter. According to some metrics there is now little spare capacity in the economy, consistent with the employment rate being at an all-time high and the unemployment rate at a post-1975 low. The current pace of growth is probably in line with potential. It is not easy to gauge spare capacity in an economy as it is, among other factors, also a function of current plans for investment and developments in the labour market but, if anything, we think that the decision to leave the European Union will constrain supply-side capacity in the short and medium run.
Even though growth is close to potential and employment is at record levels, we see very little sign of wage or price pressure. Regular pay rose by just 2.5 per cent in nominal terms in the three months to May and CPI inflation has been trending downwards since December with the most recent outturn for the second quarter surprisingly low.
There are a number of explanations for low wage growth in the UK and elsewhere (see the Supply Side section below). One possibility is that real wage growth is a consequence of low productivity (Reference Dolton, Hantzsche and KaraKara et al., 2018). In itself that would imply a monetary policy stance that is close to neutral because unit labour costs are growing at a rate that is consistent with the inflation target. There is also the possibility that wages are low because we are underestimating the amount of supply capacity in the labour market (Bell and Blanchflower, in this Review). Under that view there is no need to remove monetary accommodation.
Our recommendation for a rate increase places weight on both explanations but, in our view, with the policy rate still at levels that are close to historic lows, a gradual increase will do little more than withdraw some of the stimulus in the economy. Monetary policy will remain accommodative even after the rate increase in our central view of how the economy will develop.
The MPC also has to take account of the uncertainty related to the outcome of the Brexit negotiations when setting policy. Not only is the outcome of the negotiations unknown, the response of the economy to a given outcome is also unclear ex ante. Under a soft Brexit scenario, such as the one that underpins our central forecast, the MPC should raise the policy rate gradually. Under an alternative hard Brexit scenario the policy response may not be as clear. An exchange rate shock together with an adverse supply shock to productivity would drive both short-term and longer-term inflation higher, but the overall impact on inflation will also depend on the response of aggregate demand. The appropriate monetary policy response in that case is not so clear.
Forecasting with a benchmark: the Warwick Business School forecasting system
We provide benchmark forecasts to help understand and contextualise the forecasts presented in this Review. The box presents density forecasts for UK GDP annual growth and inflation, and reports the probabilities of a range of output and inflation events occurring, as calculated using the Warwick Business School Forecasting System (WBSFS).
To reflect the uncertainties inherent in economic forecasting, and following the practice of NIESR and other forecasters such as the Bank of England and OBR, the WBSFS provides probabilistic forecasts. The WBSFS forecasts are produced by explicitly combining density forecasts from a set of twenty four, statistically motivated, univariate and multivariate econometric models commonly used in the academic literature. The use of combination forecasts or model averaging reflects the view, supported by research (e.g., see Reference Bates and GrangerBates and Granger, 1969; Reference WallisWallis, 2011; Reference Geweke and AmisanoGeweke and Amisano, 2012; Reference Rossi, Elliott and TimmermannRossi, 2013), that because any single model may be mis-specified there may be gains from the use of combination forecasts.
Comparison of the Institute's forecasts with the probabilistic forecasts from the WBSFS may be interpreted as providing an approximate indicator of the importance of expert judgement, which may include views on the underlying structure of the macroeconomy. This is because the WBSFS forecasts are computed by exploiting regularities in past data with the aid of automated time-series models; they do not take an explicit, structural or theoretical view about how the macroeconomy works; and they do not rely on (subjective) expert judgement to the same degree as those presented by the Institute. The forecasts from the WBSFS are not altered once produced; they are deemed ‘simply’ to represent the data's view of what will happen to the macroeconomy in the future.
Figure B1 presents WBSFS's latest (as of 11 July 2018) probabilistic forecasts for real GDP growth and inflation – defined as year-on-year growth rates for 2018q4 and 2019q4 – as histograms. The information set used to produce these forecasts includes information on GDP growth up to 2018q1 and data on CPI inflation up to May 2018.
WBSFS forecast probabilities for real GDP growth and inflation, year-on-year
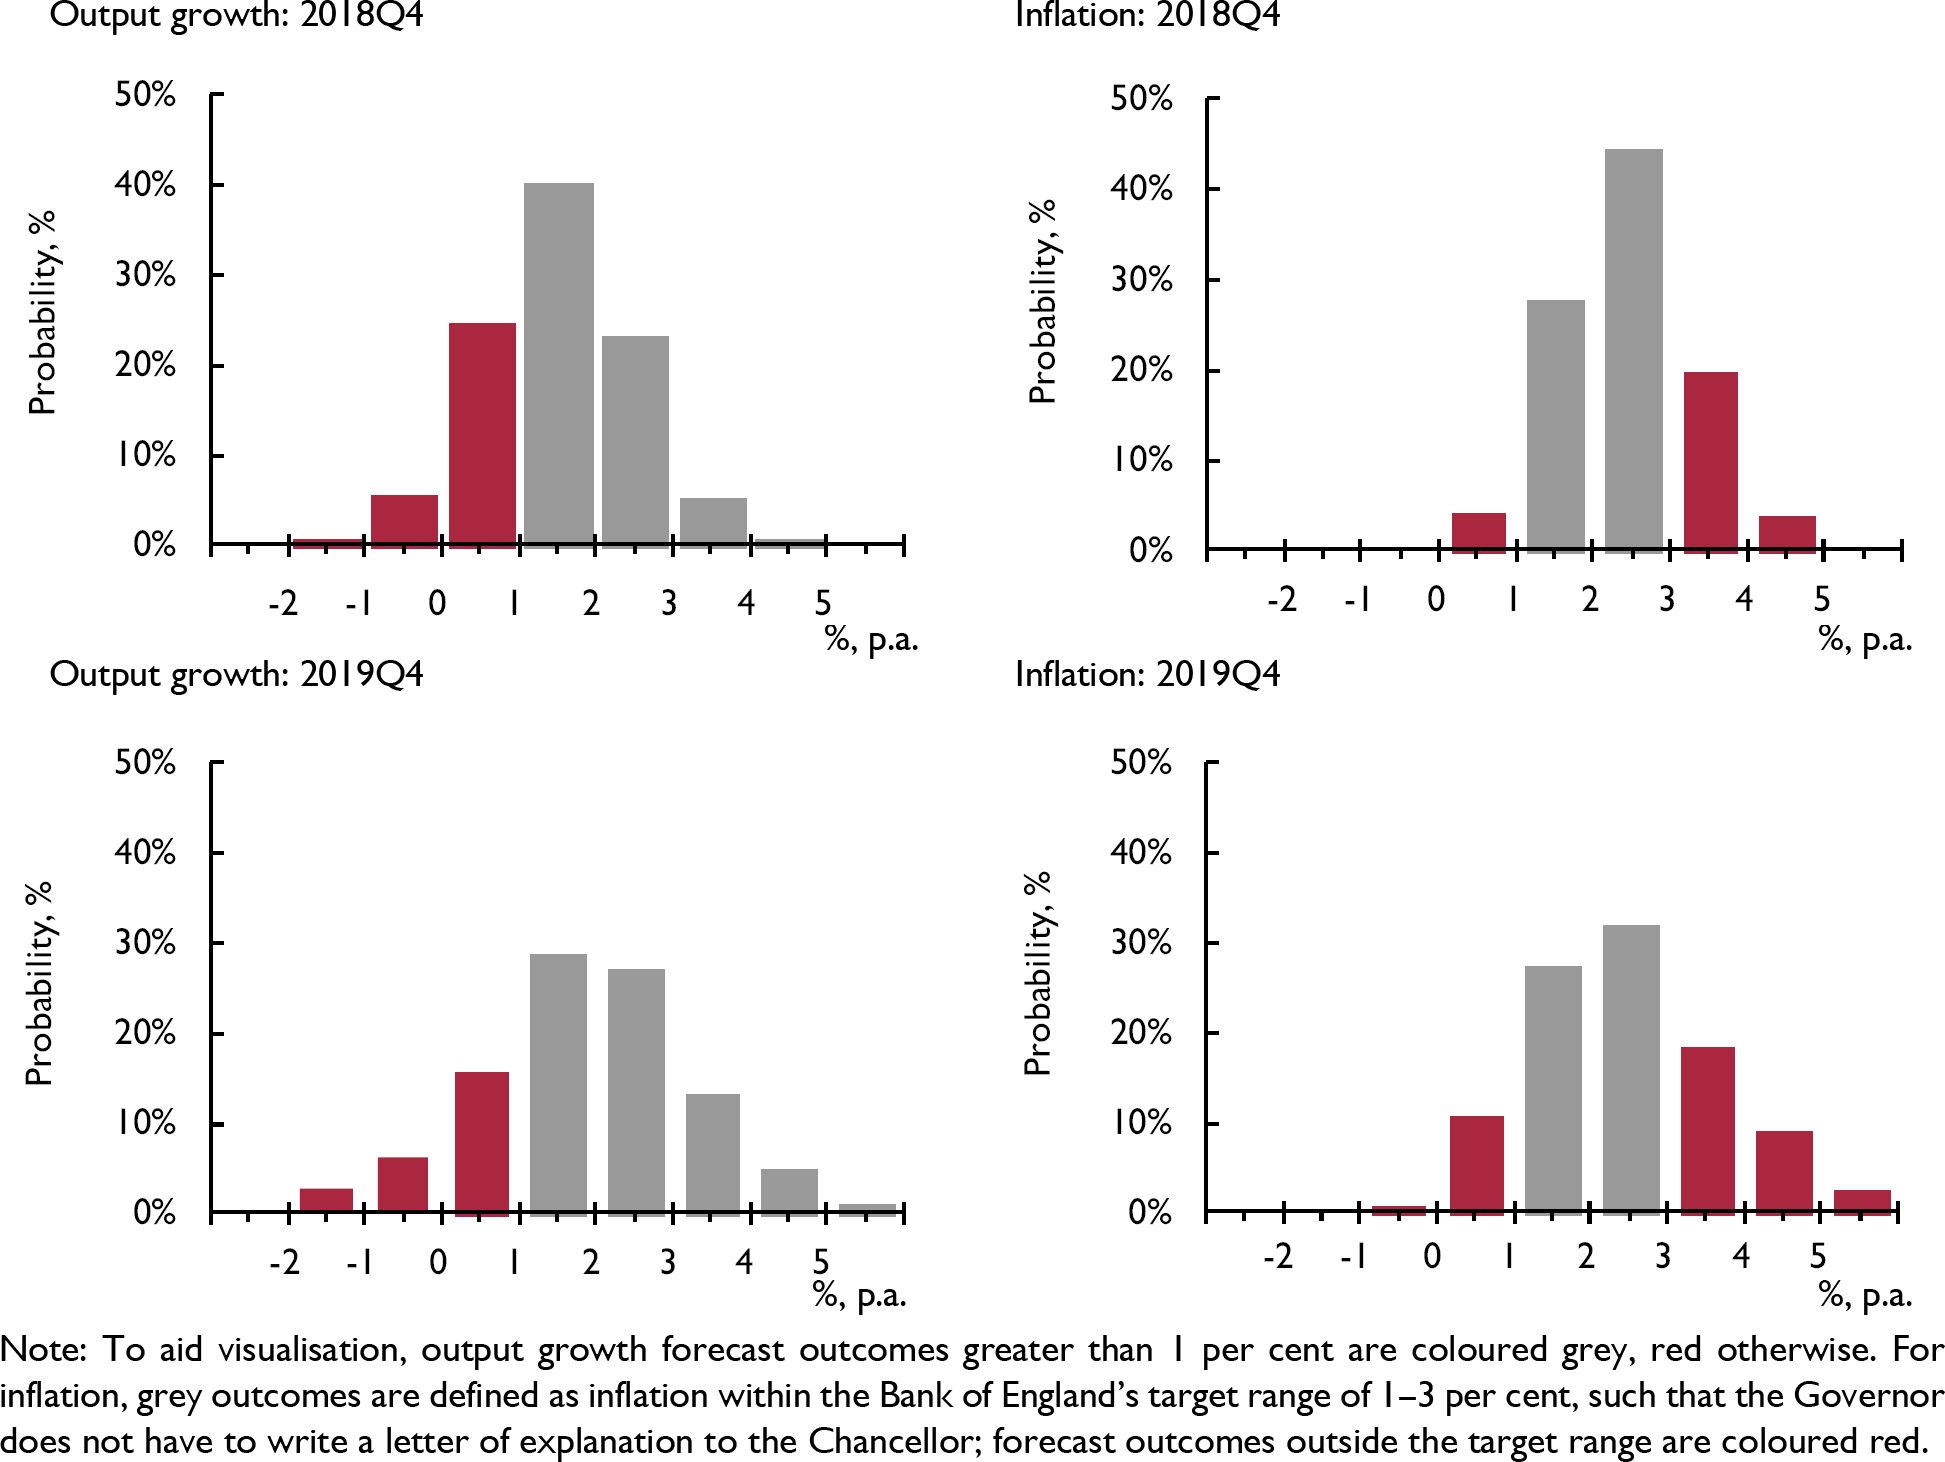
Table B1 extracts from these histogram forecasts the probabilities of specific output growth and inflation events. The events considered are the probability of output growth being less than 0 per cent, 1 per cent and 2 per cent, and of inflation lying outside the 1–3 per cent target range (i.e., the probability of the Bank of England's Governor having to write a letter explaining how and why inflation has breached its target range). Also reported are the individual probabilities of inflation being less than 1 per cent and greater than 3 per cent, to indicate which side of the target range is most likely to be breached.
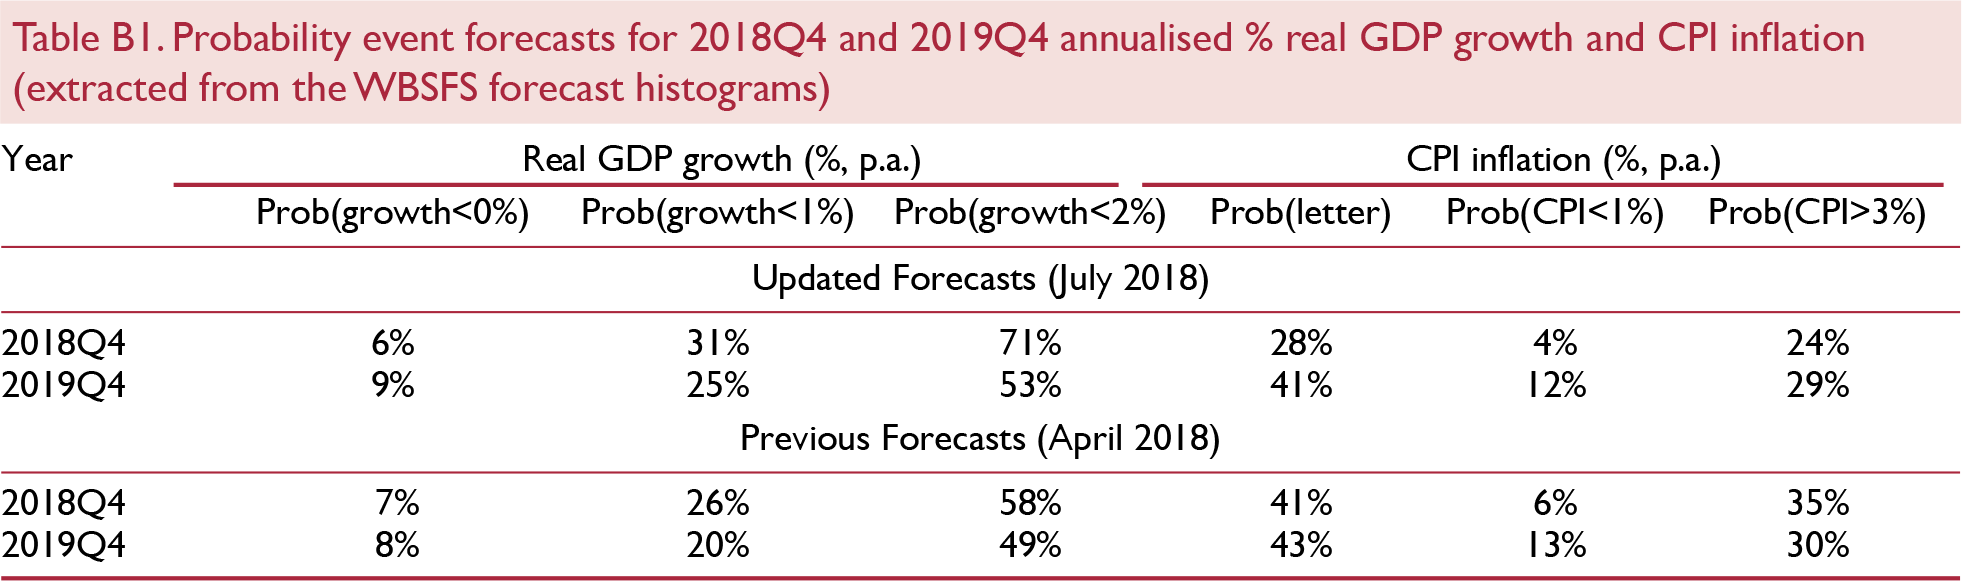
Inspection of the forecasts for output growth for 2018Q4 in table B1 suggests that, compared with our forecasts made one quarter ago, lower output growth is more likely. The most likely range for the forecast remains for economic growth between 1 per cent and 2 per cent in 2018Q4, but the probability of growth less than 2 per cent has increased from 58 per cent in April to 71 per cent in July. Looking out further to 2019Q4, the change in the probability forecast from April to July is less pronounced, with higher growth between 2 and 3 per cent now marginally less likely. As table B1 shows, the difference between the forecasts made in April and July, for 2019q4, is small – with a small upward revision to the risk of ‘low’ growth (growth less than 1 per cent) – the probability of this event has risen from 20 to 25 per cent.
For inflation, our probabilistic forecasts for 2018Q4 have changed between April and July, such that the probability of inflation being outside the 1–3 per cent range, thereby triggering an explanatory letter from the Governor of the Bank of England, has decreased from 41 to 28 per cent. This change is largely attributable to the probability of inflation exceeding 3 per cent falling from 35 per cent to 24 per cent. An inflation rate between 2 and 3 per cent remains the most likely outcome in the year ending 2018Q4, with a 44 per cent probability (up by 6 percentage points from the previous estimate of 38 per cent). But the WBSFS predicts that inflationary pressures for 2019Q4 remain approximately as we forecast in April, with a probability of around 27 per cent of inflation falling in the 1–2 per cent range and 32 per cent in the 2–3 per cent range. In comparison with our previous forecasts, the probability of inflation rising above 3 per cent in 2019Q4 remains essentially the same, having fallen from 30 per cent to 29 per cent.
Notes
WBSFS forecasts for UK output growth and inflation have been released every quarter since November 2014. Details of the releases are available at https://www2.warwick.ac.uk/fac/soc/wbs/subjects/emf/forecasting/ and a description of the models in the system and of the indicators employed is available at https://www2.warwick.ac.uk/fac/soc/wbs/subjects/emf/forecasting/summary_of_wbs_forecastng_system.pdf.
Monetary trends giving cautionary signal
This box provides a different perspective on UK economic prospects based on an assessment of recent developments in the monetary aggregates. UK monetary growth rates have fallen significantly since 2016 and are below post-crisis averages, suggesting weak prospects for economic activity and domestically-generated inflation.
The discussion below focuses on ‘non-financial’ broad (M4) and narrow (M1) monetary aggregates, comprising money holdings of households and private non-financial businesses. The Bank of England's M4ex broad aggregate additionally includes money held by non-bank financial corporations, excluding intermediaries, but such holdings are volatile and appear unrelated to future spending on goods and services.
Figure C1 compares annual rates of change of nominal GDP and the non-financial money measures. Swings in monetary momentum have generally preceded swings in nominal GDP momentum over the period shown, although the lead time has been variable. Non-financial M1 has given clearer directional signals than non-financial M4.
UK nominal GDP and narrow/broad money (% 12-month change)
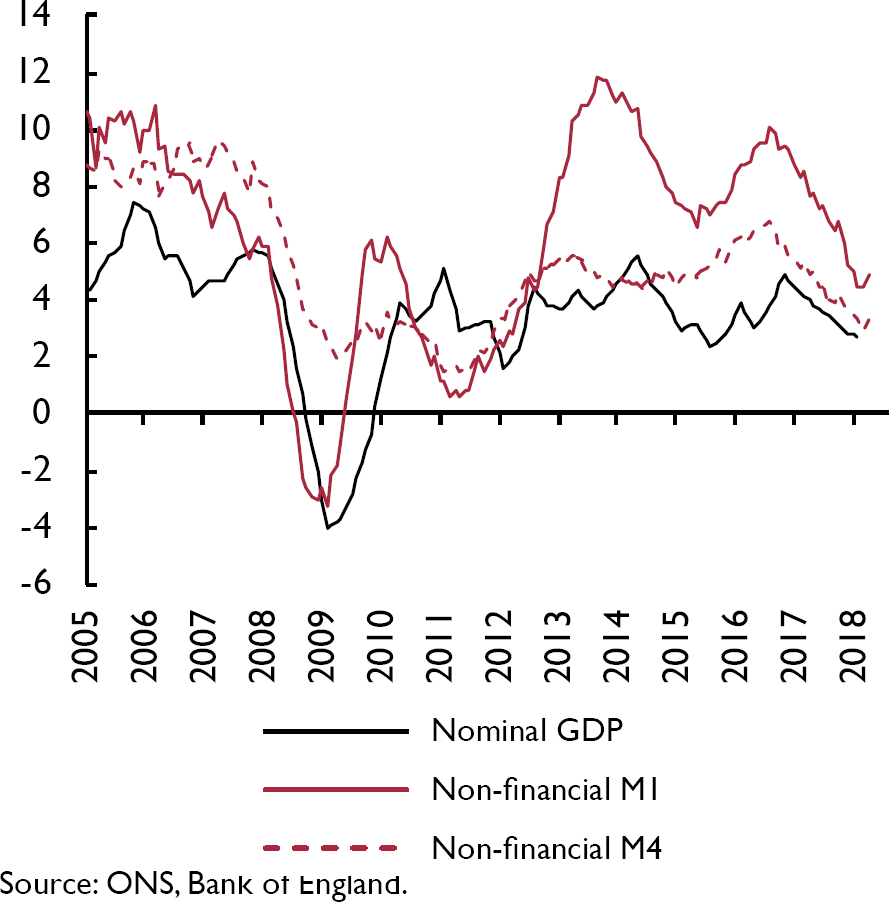
The annual growth rates of the aggregates were well above their post-crisis averages in mid-2016, suggesting that economic expansion would continue in 2016–17 despite the negative shock of the EU referendum result. The growth rates, however, peaked in September 2016, more than halving over the subsequent 18 months before recovering slightly in April/May 2018. This downswing was reflected in a slowdown in nominal GDP, annual growth of which peaked in the fourth quarter of 2016 and fell steadily through the first quarter of 2018.
The monetary slowdown occurred despite the August 2016 rate cut, a further round of quantitative easing between August 2016 and March 2017 and additional monetary base expansion until February 2018 resulting from Bank of England lending to banks under the term funding scheme. This suggests that the slowdown was demand-driven: the referendum shock may have weakened economic confidence and spending intentions, leading to a reduction in desired money holdings.
According to the credit counterparts analysis of non-financial M4, the fall in annual growth between September 2016 and May 2018 was attributable (in an accounting sense) to a combination of slowdowns in bank lending to the public sector and to households/non-financial firms and a drag from other sterling counterparts (i.e. net overseas deposits and non-deposit funding).
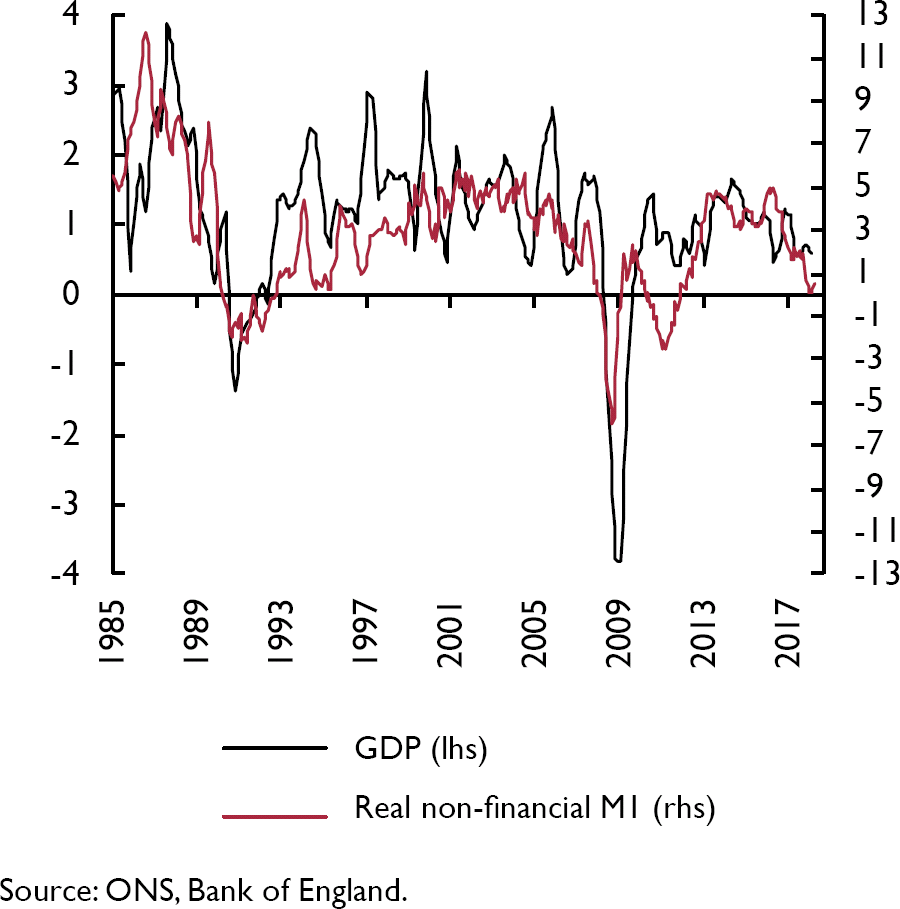
Figure C2 compares, over a longer period, the two-quarter rate of change of constant-price GDP and the six-month change in non-financial M1 deflated by consumer prices. The fall in real non-financial M1 momentum since 2016 ranks as the fourth largest since the mid-1980s. The three larger declines in 1986–88, 1989–90 and 2007–8, and a smaller reduction in 2010–11, were followed by a significant loss of economic momentum.
UK GDP and real non-financial M1 (% six-month change)
A sectoral split is available between the household sector and private non-financial corporations. Six-month growth of real household M1 is currently below that of real corporate M1 but the latter has also slowed significantly since 2016, suggesting weak prospects for both consumer spending and business investment.
The current pace of broad money growth may be inconsistent with achievement of the 2 per cent inflation target over the medium term. The velocity of non-financial M4 – i.e. the ratio of nominal GDP to the aggregate – has fallen at an average rate of 0.7 per cent per annum since end-2009, compared with a reduction of 3.0 per cent per annum over the prior decade. Assuming a continued decline of 0.7 per cent per annum, current annual growth of non-financial M4 of 3.3 per cent in May, if sustained, would result in a 2.6 per cent per annum rate of increase of nominal GDP. This would imply an inflation undershoot unless potential economic expansion is below 1 per cent per annum.
Monetary Policy Committee member Michael Saunders has suggested that broad money trends have been affected by a portfolio shift by households into mutual funds, sales of which rose strongly in 2017 after weakness in 2016. This shift cannot fully explain the slowdown in non-financial M4: annual growth of an expanded liquidity measure including mutual funds, National Savings instruments and foreign currency deposits has also fallen, reaching a six-year low in April/May. Mutual funds and other longer-term savings products, moreover, are not money: a portfolio shift into such funds may indicate a reduced likelihood of near-term spending.
This box was prepared by Simon Ward of NS Partners and Janus Henderson InvestorsWhen setting policy the MPC will need to consider the consequences of ‘getting it wrong’. It is possible that circumstances next year will require much looser monetary policy and the MPC will then regret a decision to raise Bank Rate in August. But would the damage to the economy and the Bank of England's reputation from a premature rate increase outweigh the costs of a delayed rise? Decision-making under uncertainty requires an assessment of outcomes in all possible eventualities that balances the risks. The committee can mitigate the consequences of a policy error by departing from current practice and emphasising the uncertainty (rather than the certainty) of its future policy stance. The communication should also make clear that it stands ready to adjust Bank Rate quickly and aggressively in either direction should circumstances turn out to be different from what currently appears most likely.
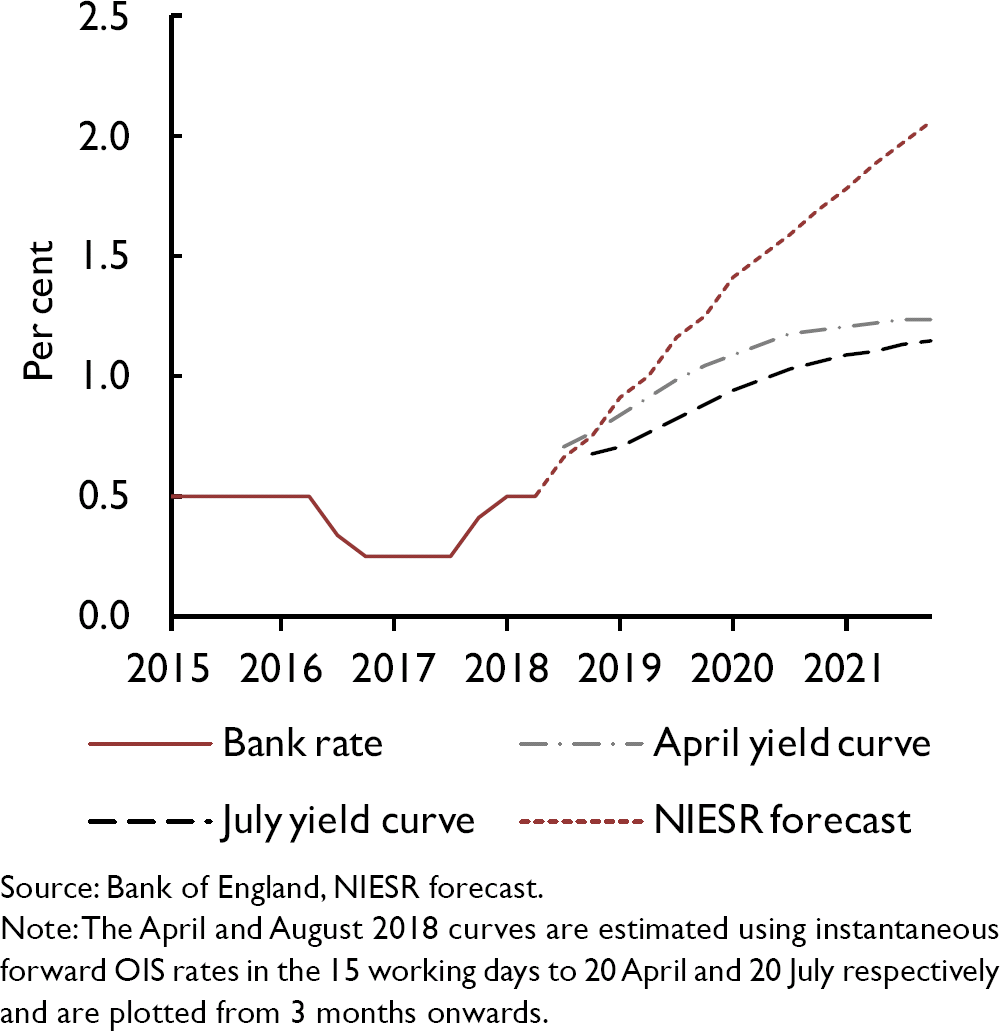
Financial markets are pricing in a rate increase in August. Further out, expectations of Bank Rate have eased slightly since our previous forecast in May (figure 4). The difference between our central forecast and the implied market path is likely to be due to the markets placing weight on downside risks that are not contained in our central forecast. Our central forecast, and our recommendation for further Bank Rate increases beyond August, is conditioned on two very uncertain assumptions about future monetary and fiscal policy.
Market-implied paths for short-term interest rates and NIESR forecast
First, the market view of rates is based on a probability-weighted average of that entire spectrum, whereas our central forecast is based on a soft Brexit.
Second, we have decisively assumed that government spending will overshoot the OBR's latest fiscal forecast published in March. Crucially, from the perspective of monetary policy, some of that additional spending is due to higher public sector wages which will raise the government consumption deflator with some spillover into the private sector (see Public Finance section below).
The MPC has long stated that it will continue to reinvest the proceeds from maturing bonds bought under its Asset Purchase Facility until the policy rate reaches the threshold of 2 per cent. That guidance changed in June and the MPC has decided to lower that threshold by 50 basis points to 1.5 per cent (Bank of England, 2018). We would therefore expect the Bank's balance sheet to start to shrink from mid-2020 as bonds mature, given that on our central forecast the threshold is reached at that point. We assume that the Bank will not actively sell bonds back to the market or reinvest the proceeds of maturing bonds.
At its June meeting, the Financial Policy Committee (FPC) held the countercyclical capital buffer rate unchanged at 1 per cent. Brexit remains a key risk for the FPC and in its judgement the UK banking system has the resilience to continue supporting the economy even through a disorderly Brexit. The FPC however, believes that the risks from a disorderly Brexit are material, especially to derivative contracts.
Public finances
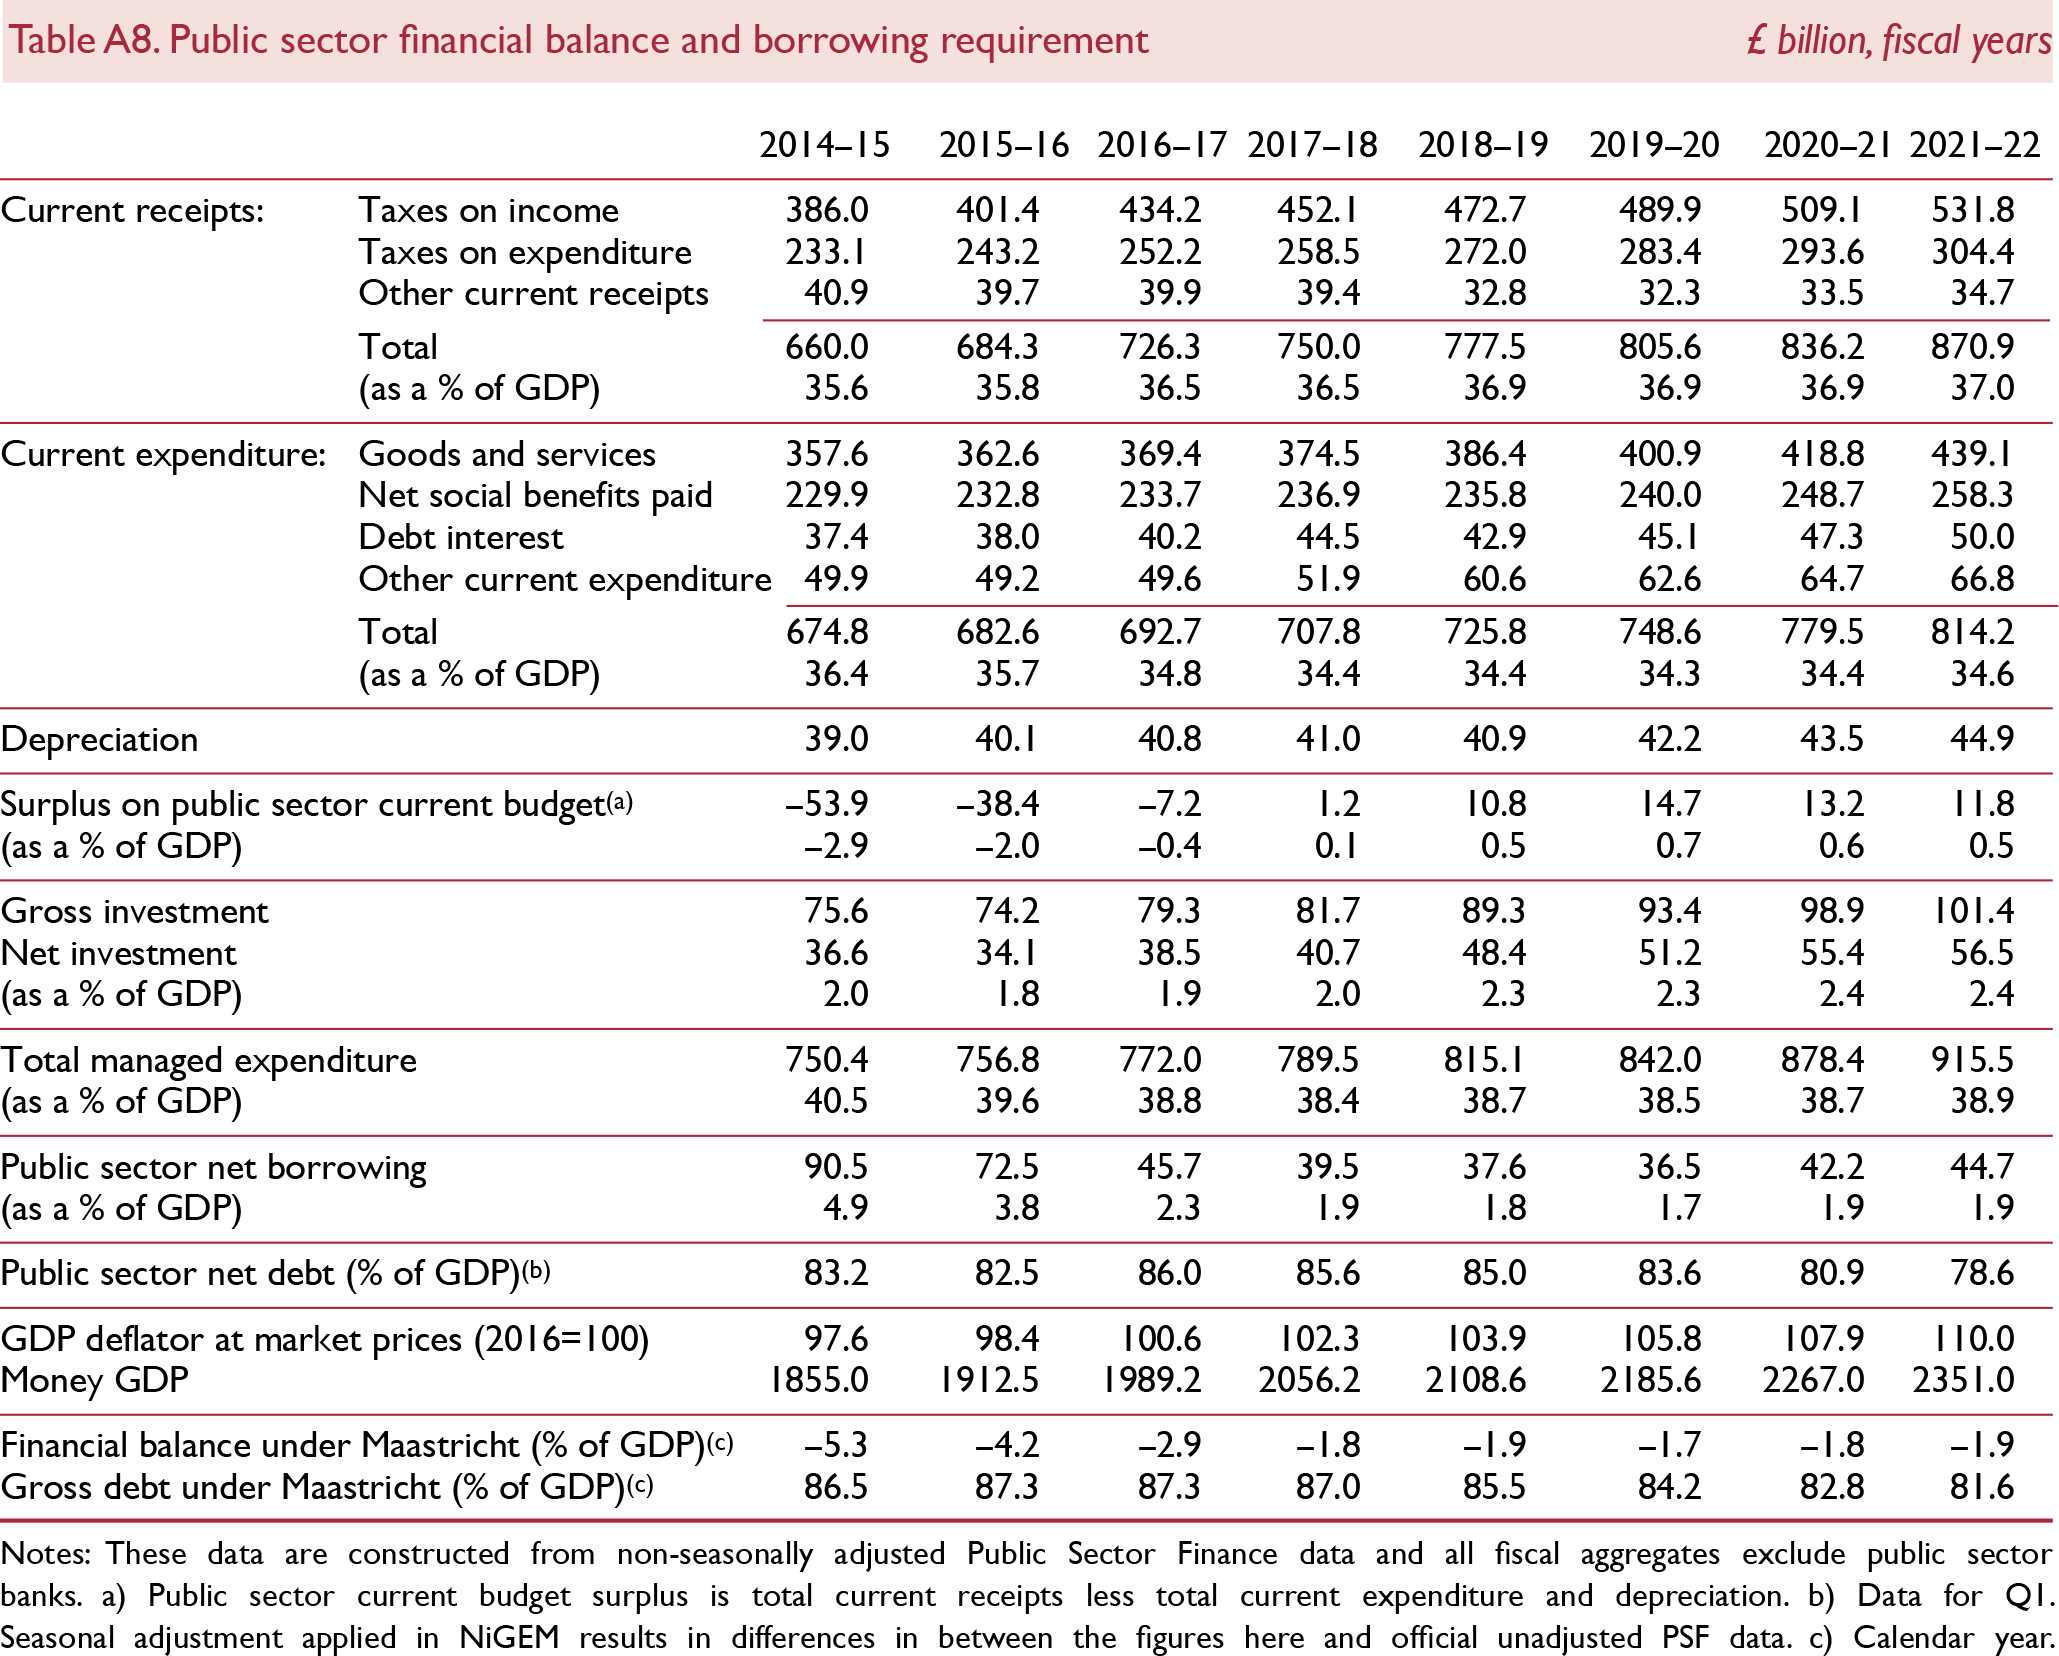
While most recent developments in the public finances have been favourable, substantial risks to the fiscal position are building up in the years ahead. According to the latest ONS outturn estimate from June, public sector net borrowing in 2017–18 was 1.9 per cent of GDP, 0.3 percentage points below the estimate provided by the Office for Budget Responsibility (OBR) in March this year, as a result of both higher receipts and lower spending. Between April and June of the current fiscal year, the government borrowed £5.4 billion less than over the same period one year ago.
Spending pressures
Nevertheless, the government faces rising pressures to increase spending in a number of areas, to accommodate the needs of an ageing population and maintain the quality of public services, as we highlighted in detail in our last Review (Reference Hantzsche and YoungHantzsche and Young, 2018). In its Fiscal Sustainability Report from July 2018, the OBR corroborates our findings and stresses that, absent major policy changes, public finances will come under significant pressure over the next fifty years.
As in our previous forecast, we therefore deviate from official spending plans, which project that total managed expenditure will fall from 38.4 per cent of GDP currently to 37.6 per cent in 2022–3, as laid out in the OBR's March 2018 forecast. Instead we assume that the share of spending in GDP will remain stable over the forecast horizon. In fact, since the Spring Statement the government has announced a substantial increase in NHS spending of £20.5 billion per year by 2023–4, or 0.9 per cent of GDP, as well as £1.25 billion in the next two years to alleviate pension pressures. While the government has stated that this additional spending will be financed by spending cuts in other areas and higher taxes (as well as lower EU budgetary contributions), details remain to be provided.
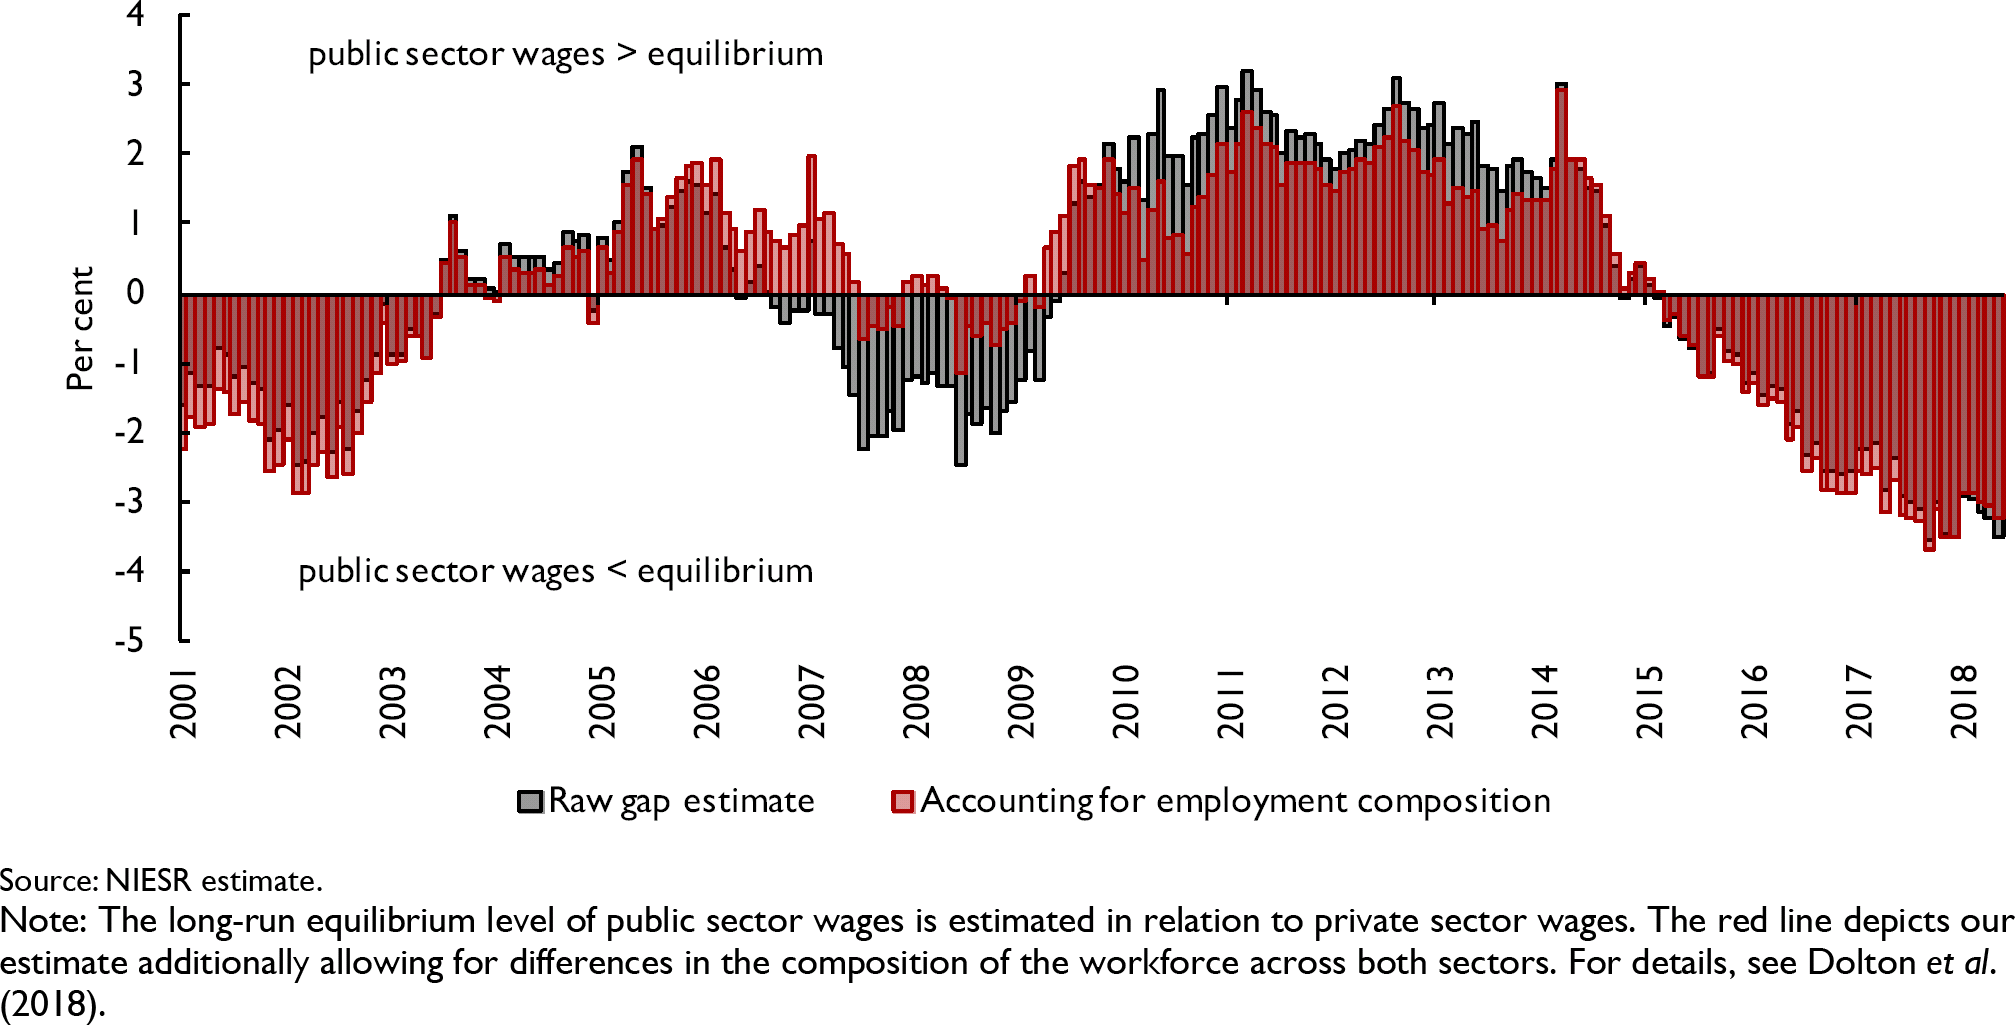
Our assumption of public expenditure remaining stable at just under 39 per cent of GDP would allow the government space to finance the increase in spending on the NHS and allocate additional spending of up to £20 billion per year to other areas, for instance to finance the end of public sector pay restraint. While NHS employees saw the cap on pay growth lifted in April this year, overall earnings in the public sector have remained stagnant. As a result, our estimate of the gap between public sector wages and their long-run trend was around 3 per cent in May (Reference Dolton, Hantzsche and KaraDolton et al., 2018) (figure 5). In July, a pay rise was announced for public sector employees in a number of additional areas, like education and defence, to be financed within their existing budgets. This pay rise will align public sector wage growth better with that in comparable private sectors. Nevertheless, additional adjustments to pay may be necessary for some time to close the gap between public sector pay and its long-run sustainable level in order to prevent recruitment difficulties from building up, which will require additional funding of around £5 billion per year.
Gap between current level of public sector wages and their long-run trend
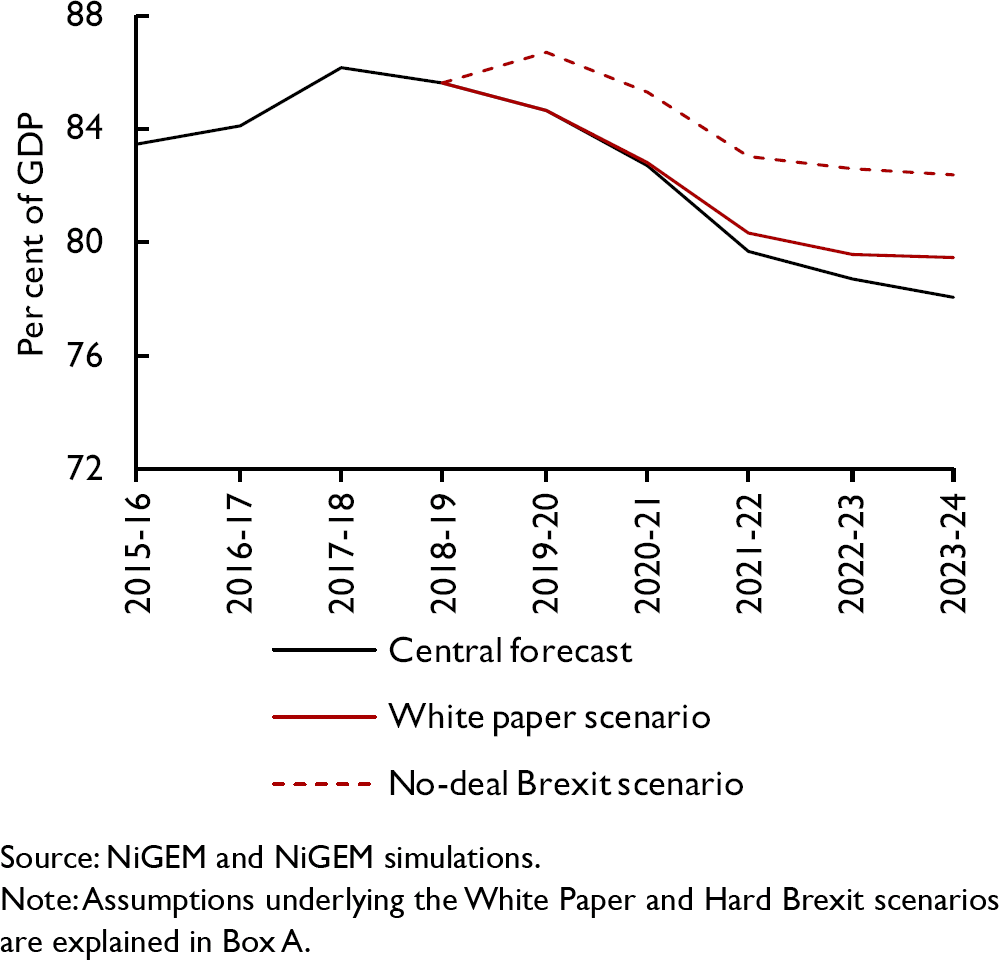
For our central forecast, the assumption of additional spending implies that, absent any adjustments to tax rates, public sector net borrowing will continue to be around 2 per cent of GDP per annum over the forecast horizon. As a result, we project public sector net debt to settle at around 80 per cent of GDP in the medium term. Given that the risks to our forecast are to the downside, this suggests that it is unlikely that the government will reach its target of a balanced budget by the middle of the 2020s without further policy action.
Fiscal risks
In its Managing Fiscal Risks report, HM Treasury outlines how it aims to address several potential risks to public finances. While fiscal risks can also arise from underspending (Reference ChadhaChadha, 2018a), the largest risks to the sustainability of public finances arise from economic downturns and financial crises. In Box A, we assess the economic impact of two Brexit scenarios. One corresponds to the recent White Paper proposal by the government and the other scenario models the potential failure of negotiations and a no-deal Brexit as of the second quarter of 2019.
Figures 6 and 7 illustrate the fiscal consequences of both scenarios for public sector net borrowing and net debt. Figure 6 shows that even if the government's current plans of a free trade agreement in goods and adherence to a common rulebook were implemented, we would still expect the positive fiscal effect of lower contributions to the EU budget to be more than offset by the fiscal implications of an economic slowdown that would result from the reduction in services trade. In this White Paper scenario, the public deficit as a share of GDP is estimated to increase by up to 0.6 percentage points relative to our central forecast which is based on soft Brexit assumptions, leaving no room for a ‘Brexit dividend’. Under a no-deal Brexit scenario, the deficit widens even further, preventing the level of government debt from declining.
Public sector net borrowing and Brexit variants
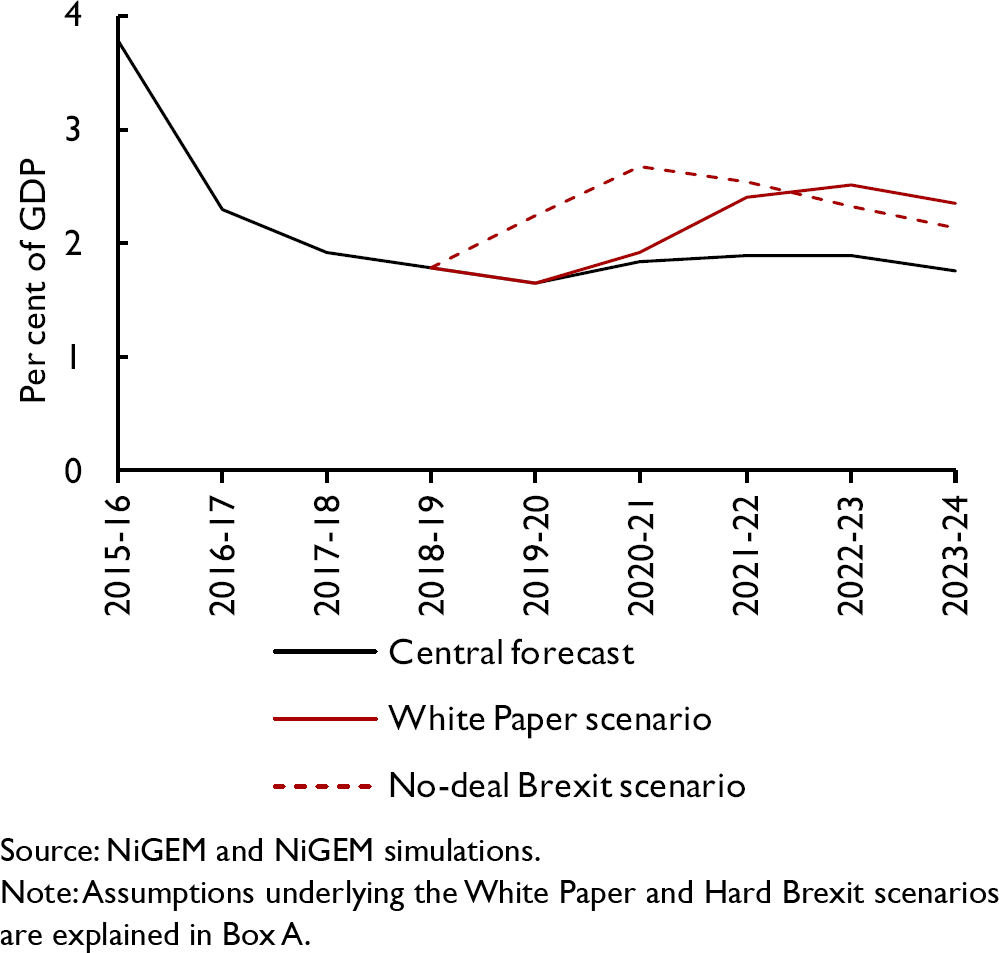
Public sector net debt and Brexit variants
Section 2: Forecast in detail
Financial markets developments
Stronger oil price, exchange rate depreciation and flattening of the yield curve
The FTSE All-Share Index is close to its level of 4,200 from the beginning of the year, after having gone through a trough of 3,811 on 26 March 2018. This probably reflects several forces balancing out each other: on the one hand the surge in oil prices benefitted the oil and gas sector and on the other hand fears about trade tensions, political instability and Brexit weighed down on the outlook for future earnings. Looking at the sectoral performance of the FTSE All-Share Index, we find that the best performers were Health Care and Oil and Gas with 10 per cent returns year-to-date until 19 July, and the laggards were Telecoms and Technology with respective negative returns of 17 and 18 per cent year-to-date. Oil and Gas stocks represent a large share (14 per cent) of the FTSE All-Share Index and were boosted by the higher oil price. On the other hand, the large fall in the performance of the Telecoms and Technology sectors only had a muted impact on the FTSE All-Share Index because taken together, these sectors account for less than 4 per cent of the share of the index.
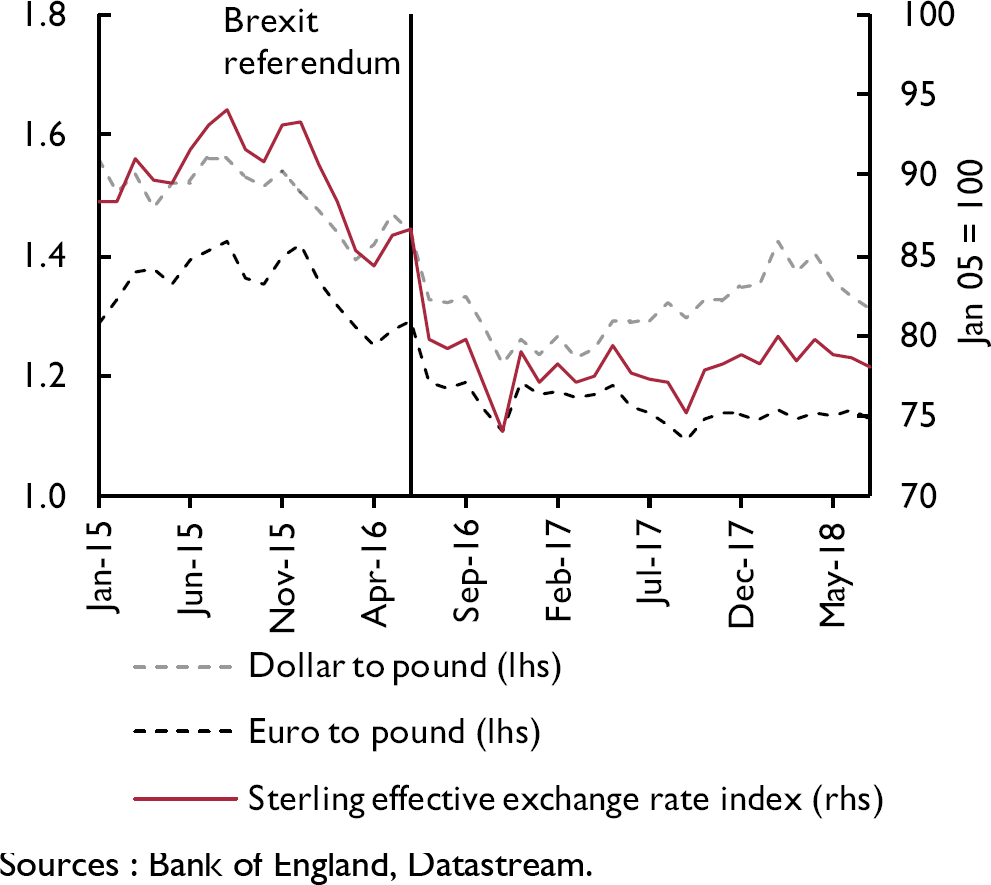
The trade-weighted exchange rate has depreciated by 2.8 per cent since our May forecast (figure 8). The Chequers statement on 6 July and the publication of the White Paper on 12 July detailing the government's Brexit strategy were received with scepticism in the foreign exchange market. Sterling depreciated versus the euro from €1.131 on 6 July to €1.118 on 19 July. That drop may well have been driven by political instability in the UK and the prospect of difficult negotiations. Two senior members of the Cabinet, Boris Johnson, the Foreign Secretary and David Davis, the Brexit Secretary, resigned to mark their disapproval of the new strategy. The initial response by the European Commission was lukewarm; it asked member states to prepare for a no-deal exit. Our forecast assumes that the sterling effective exchange rate will weaken by a further 1 per cent in the third quarter of 2018 and then stay at the same level into the medium term. Our assumption is based on uncovered interest parity, meaning that changes in the exchange rates are driven by relative changes in interest rates.
Sterling exchange rate
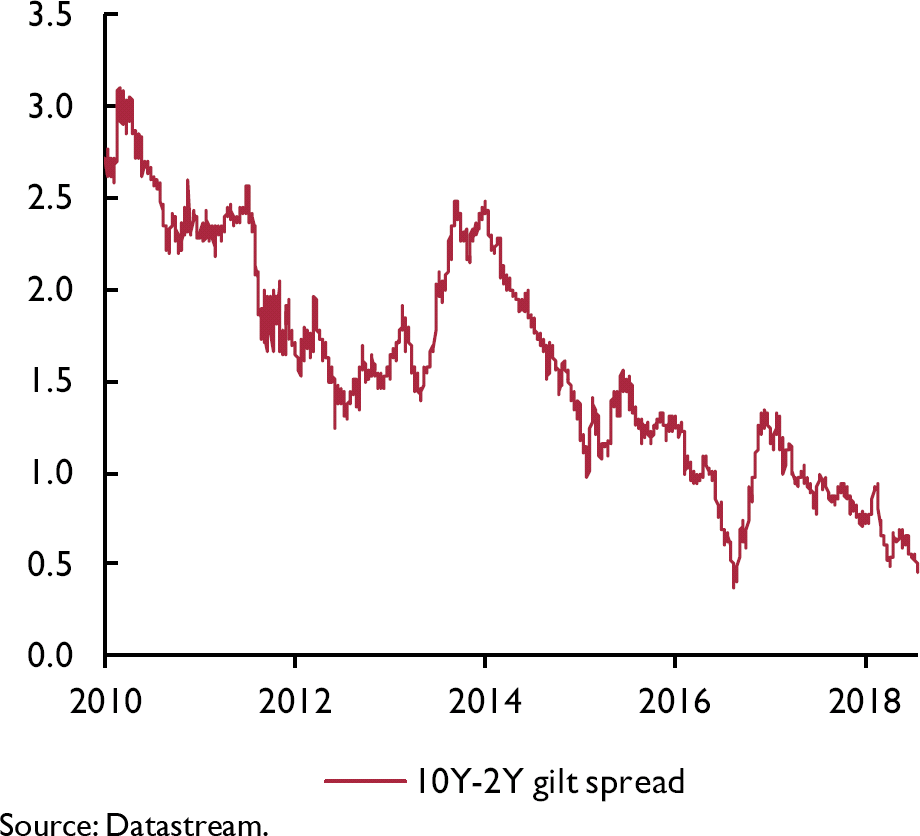
In the bond market, the gilt yield curve flattened in the 3 months from May to July with yields decreasing mainly at the long end of the curve. The 10-year to 2-year spread reached 0.46 percentage points on 19 July (figure 9), the lowest since August 2016 just after the EU referendum, when there were fears that the economy could go into recession. Lower long-term yields may help to stimulate the economy, but an inverted yield curve is often seen as an advance signal of a looming recession, as discussed in the case of the US in Reference LenoelLenoel (2018).
Yield spread between 10-year and 2-year UK government bonds
In the commodities sector, Brent oil, which is the benchmark for crude oil in Europe, has traded at a higher price recently. Converted into sterling, the price per barrel increased from an average of £48 in the first quarter to £57 at the time of writing. Regarding other commodities, the price of coal traded at ICE increased from £62.4 per ton in the first quarter to £77 at the time of writing but the price of natural gas decreased in the Nymex market from £2.14 to £2.08 per million British thermal units over the same period.
Output and the components of demand
The ONS nudged higher its estimate of first quarter GDP growth from 0.1 per cent to 0.2 per cent in line with our monthly GDP estimate. Growth nevertheless slowed in the first quarter and the precise reason for the weakness is unclear. Temporary factors such as adverse weather conditions have, in all likelihood, played a part but that does not appear to be the whole story.
To start with, other economies such as the Euro Area, US and Japan also slowed and, furthermore, an examination of the national accounts data across a number of countries, including the UK, for this period suggests that much of the weakness reflects a slowdown in trade volumes, pointing therefore to a common international trigger, but again there is no clear explanation.
Monthly GDP Tracker
Looking ahead into the second quarter and beyond, our judgement is that economic growth will recover and that the slowdown in the first quarter was a temporary soft patch rather than the start of a prolonged period of weakness. Our short-term UK GDP growth forecast is informed by our new monthly GDP Tracker (see figure 10). Accordingly, UK growth is forecast to rise to 0.4 per cent in the second quarter and 0.5 per cent in the third.
NIESR monthly GDP Tracker
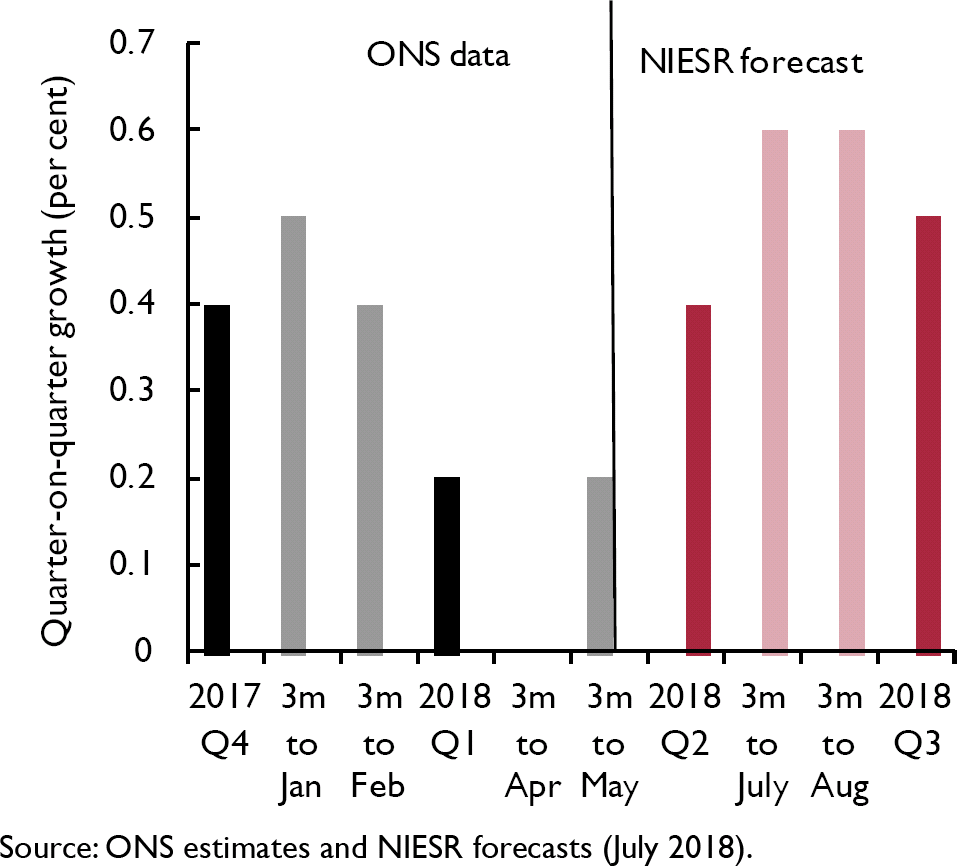
From July 2018, the ONS started publishing an official monthly GDP series and its main sub-components with a two month lag, so we now have the estimate for May. Building on this new initiative by the ONS, our monthly GDP Tracker is a bottom-up model that forecasts ten sectors on the output side of the national accounts. It takes account of recent trends in the ONS data, consumer and business surveys, and judgement based on a variety of other available information and intelligence. We published our forecast for June and also for Q2 and Q3 on the same day as the ONS.
Trade
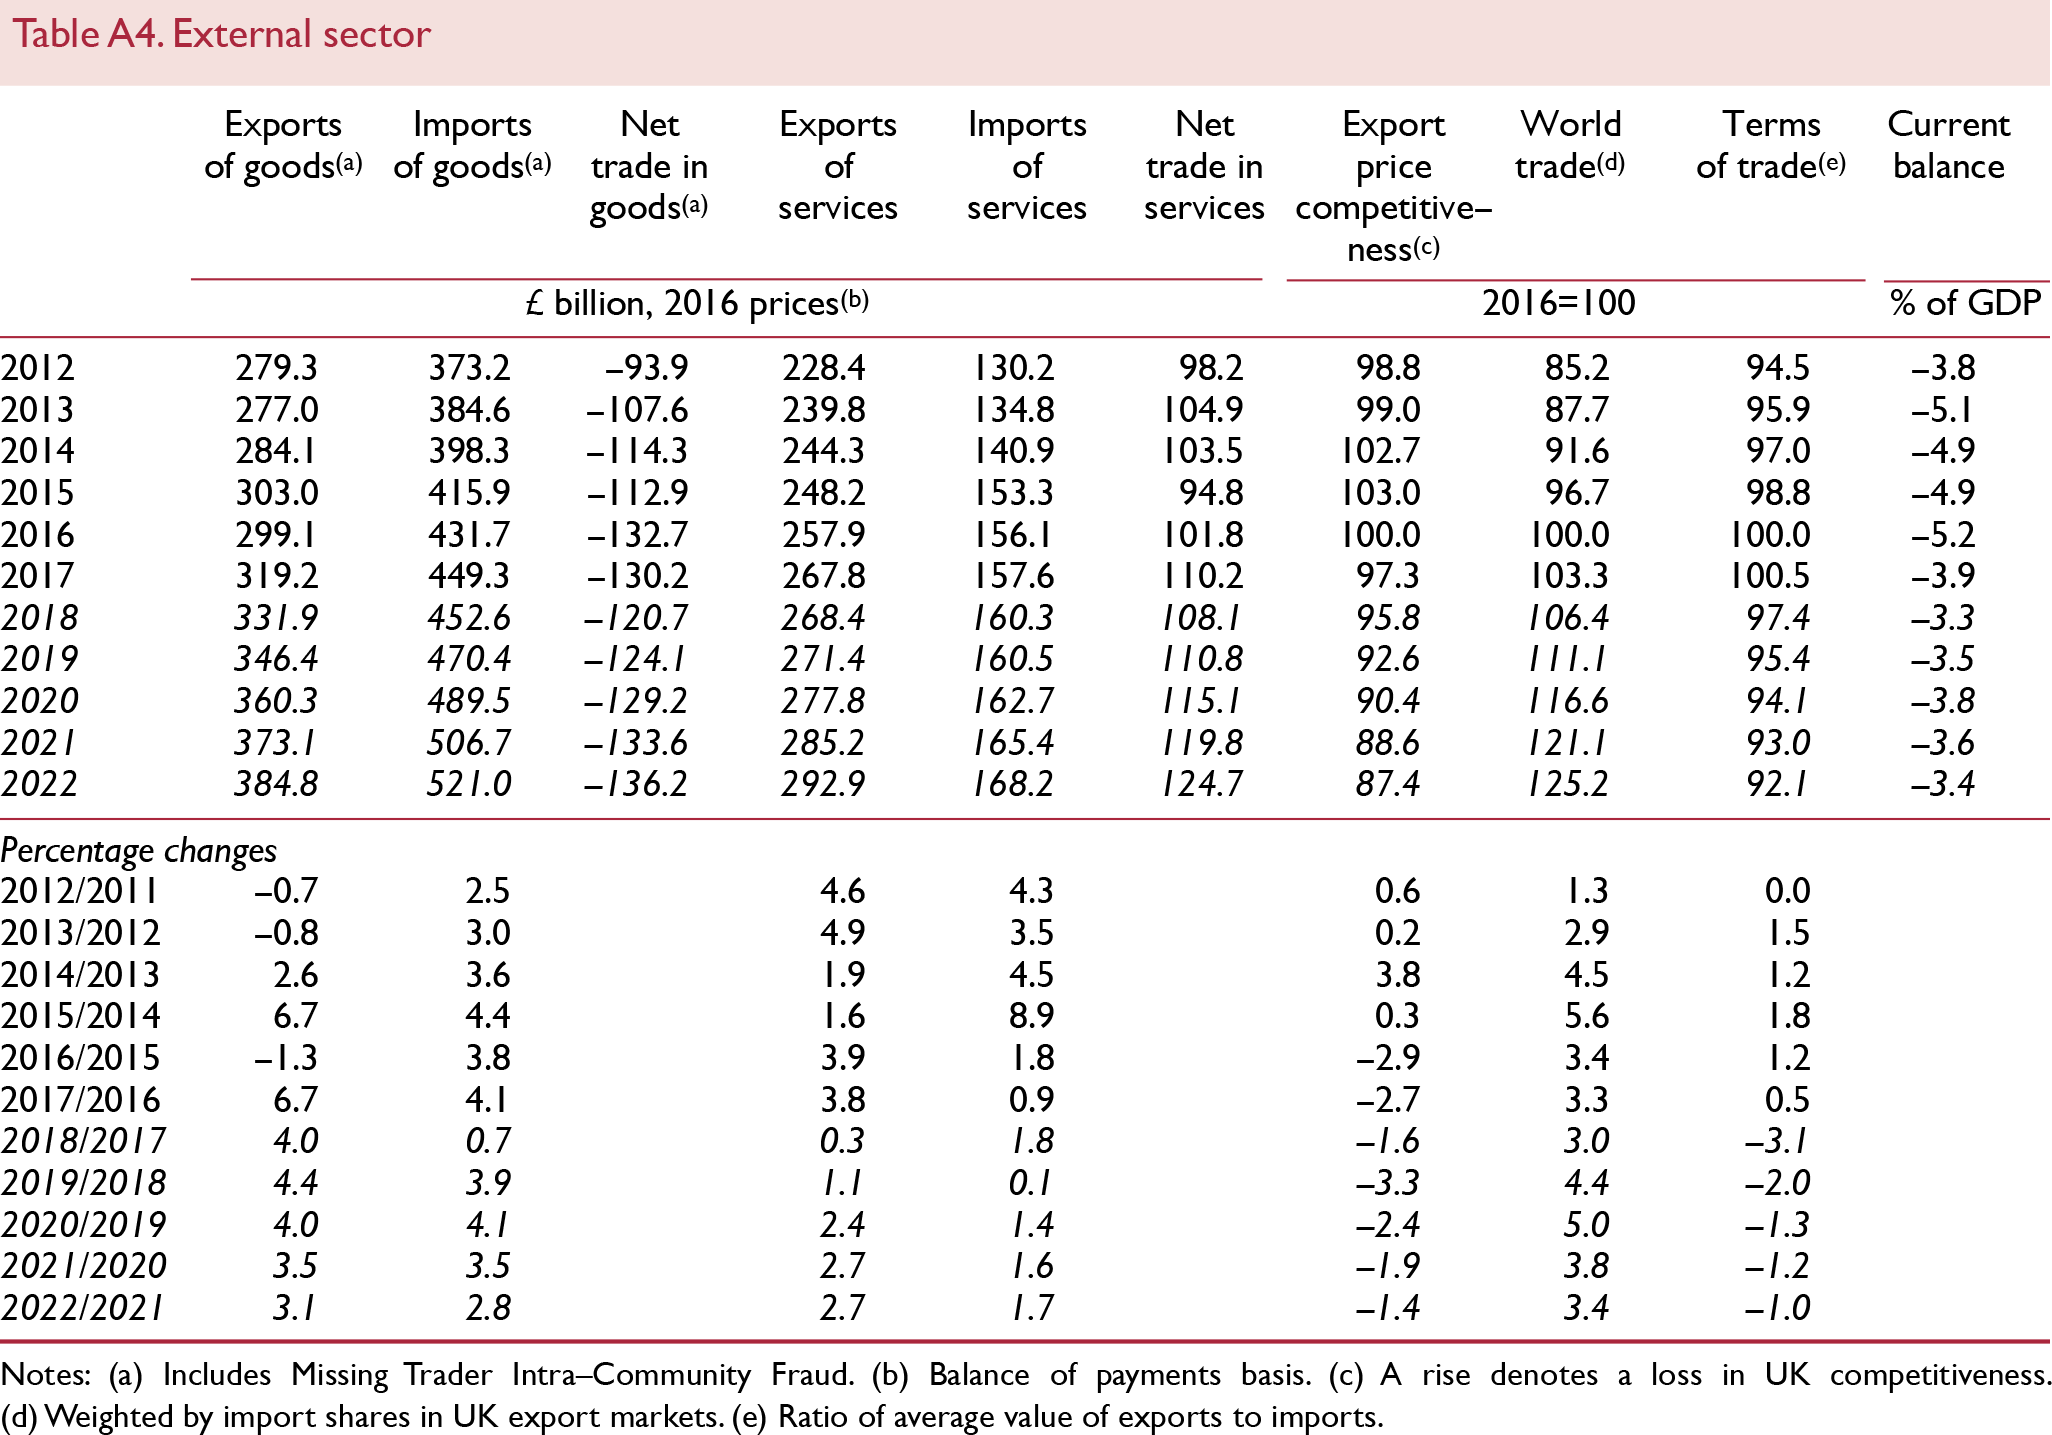
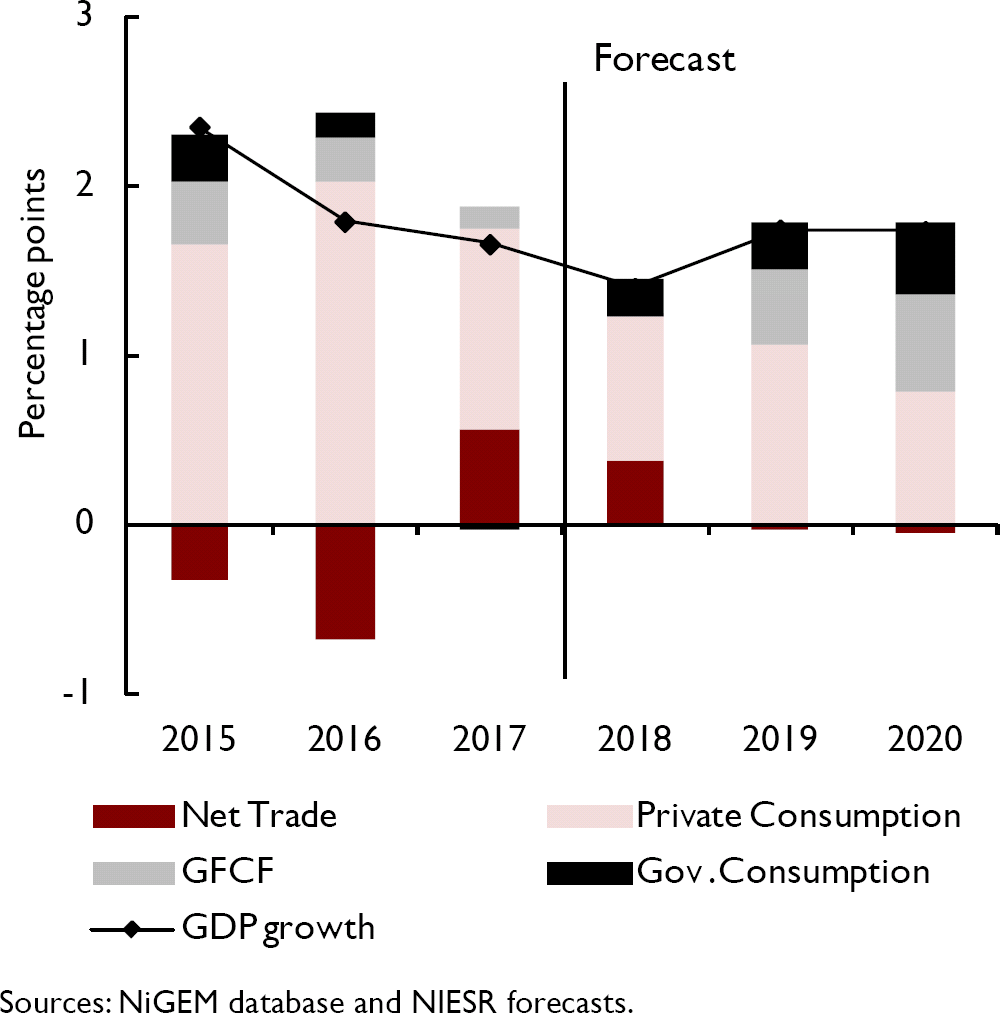
On the expenditure, net trade is set to make a positive contribution again in 2018 in spite of weak first quarter export volume growth, following a strong positive contribution to real GDP growth in 2017 (figure 11).
Expenditure components: contribution to GDP growth (percentage points)
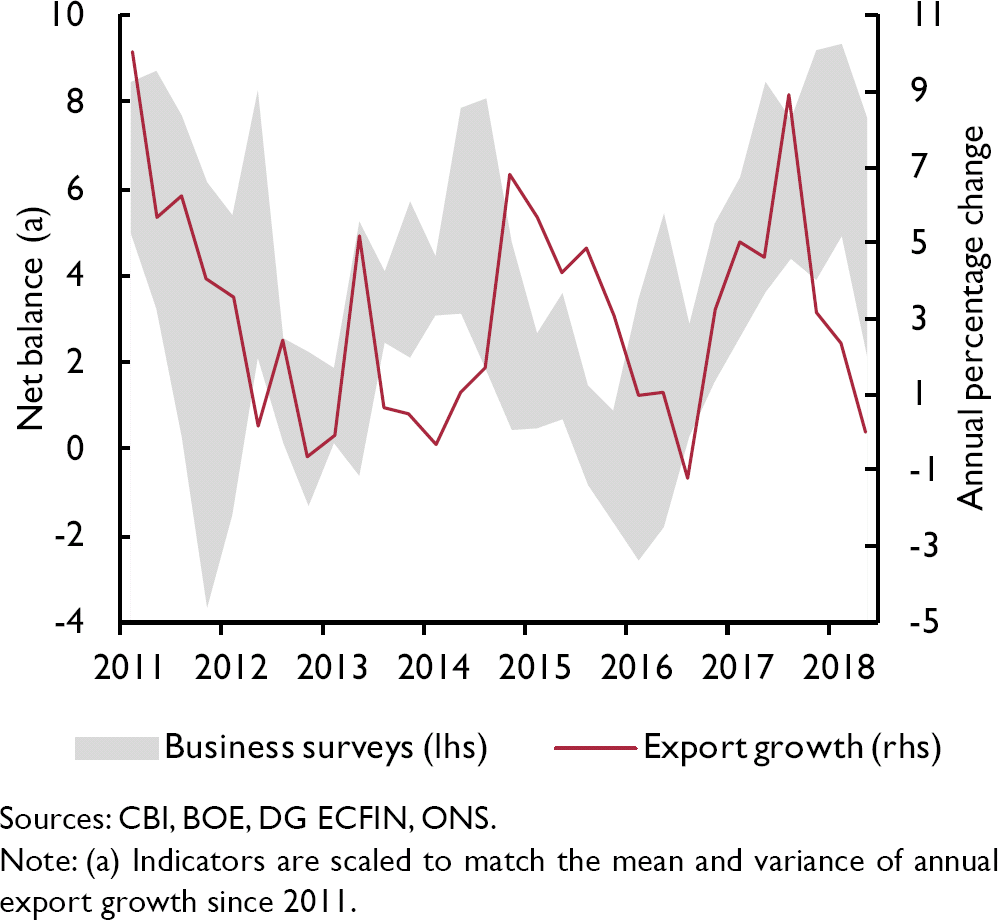
Survey indicators such as those from Markit PMI/CIPS and BCC have been pointing to robust export growth recently (figure 12). Export volume growth is supported by the competitive exchange rate in the near term, but going forward, even with a soft Brexit, we judge that UK exports will face headwinds as the uncertainty of future relationships offsets the benefits of the currency depreciation.
Exports expectations and export growth outturn
Household consumption
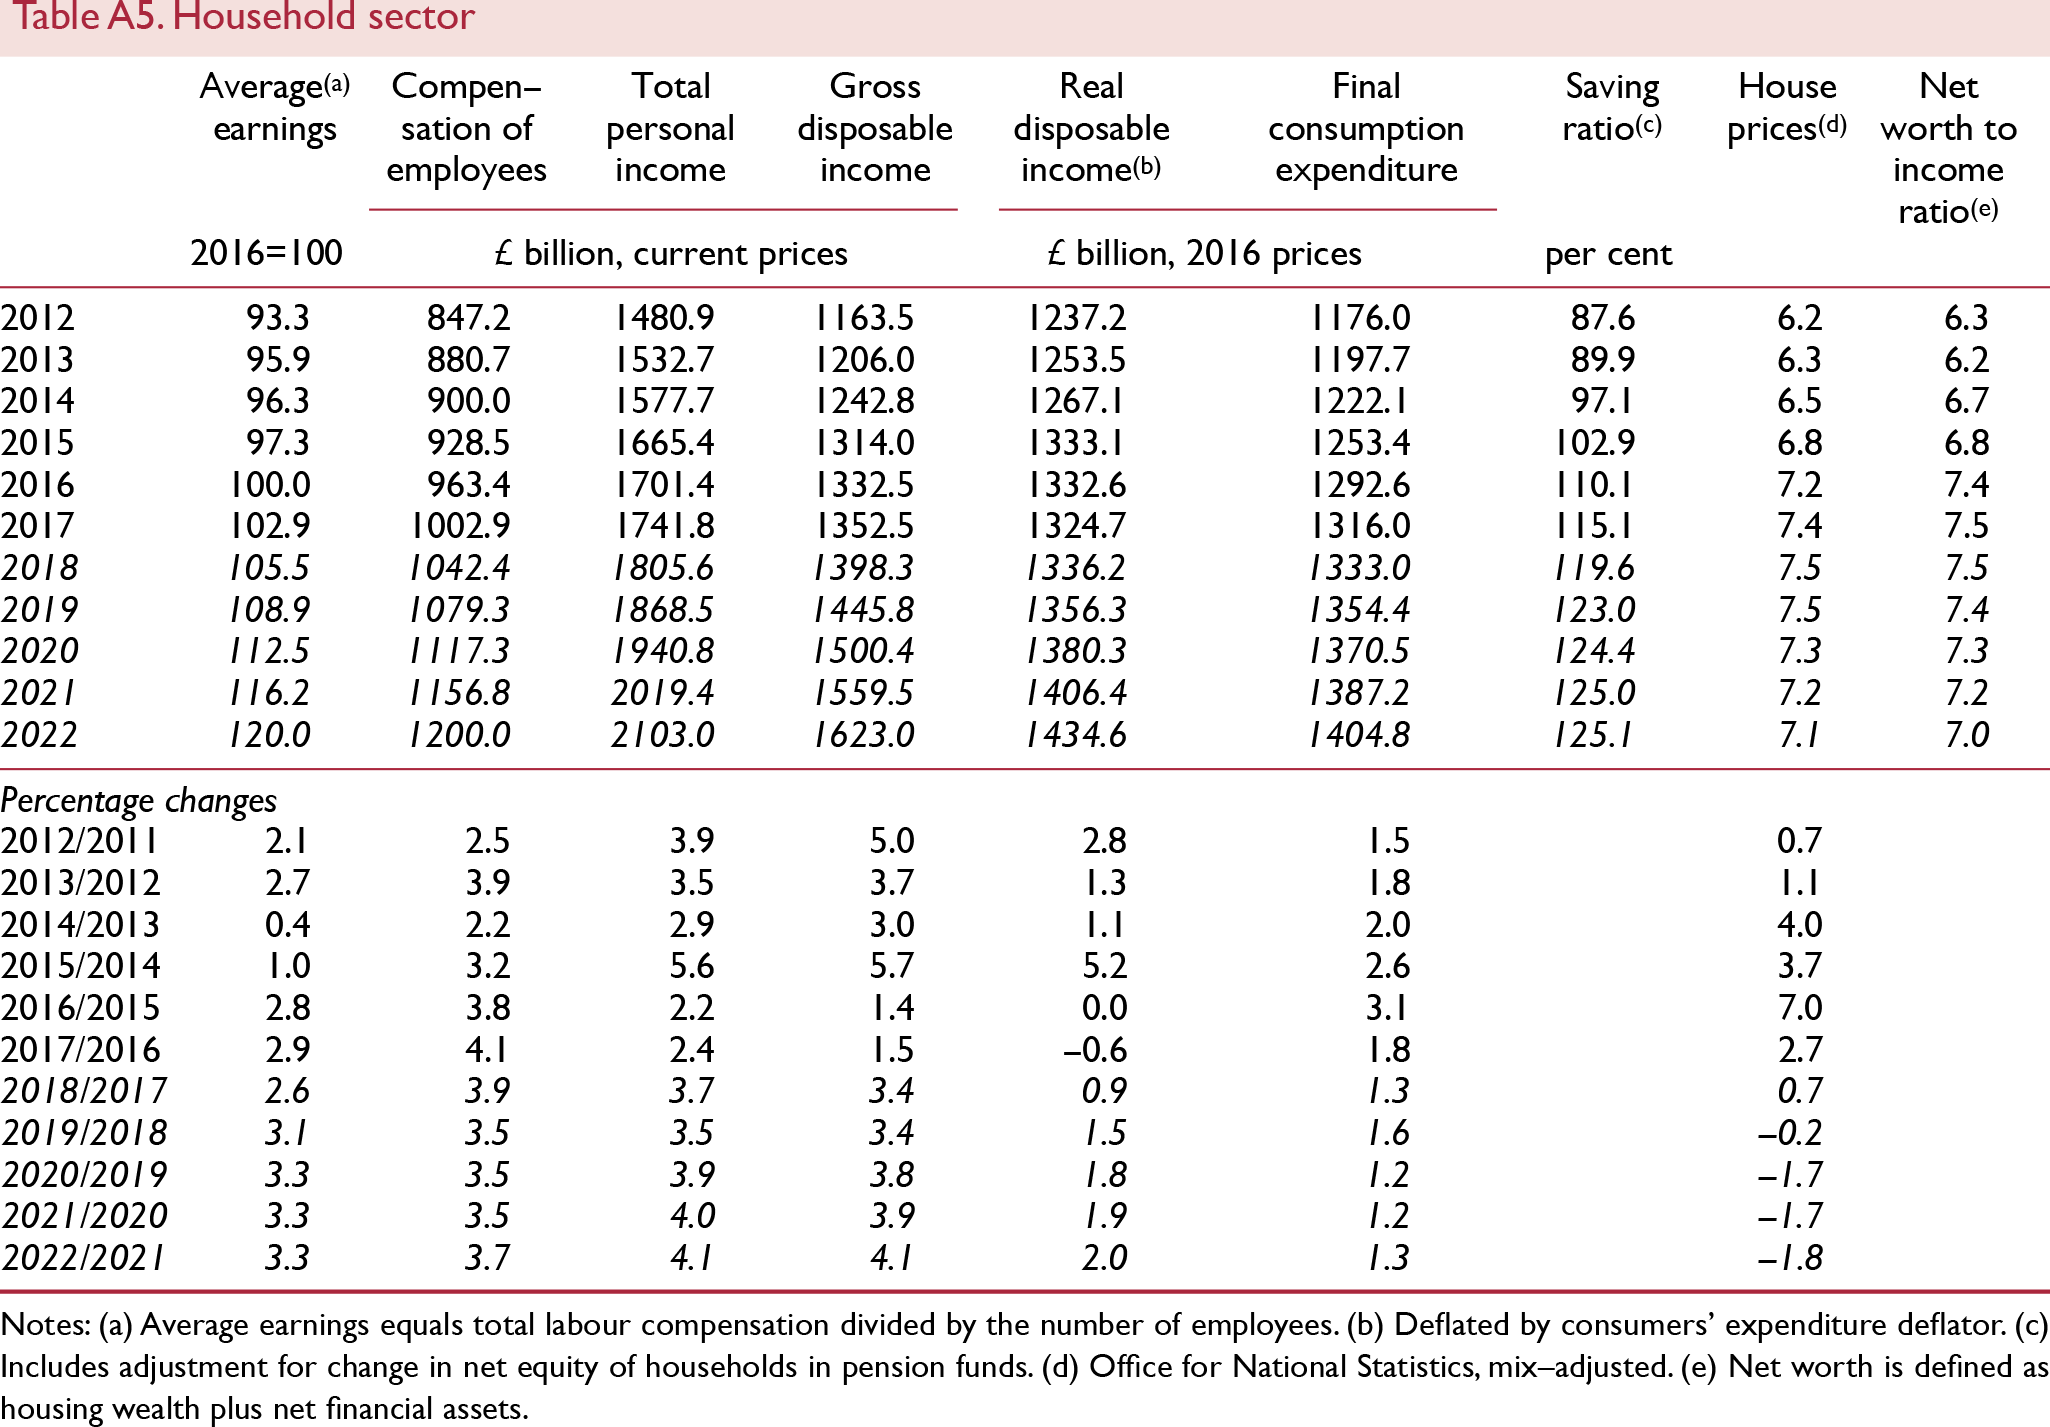
Turning to the other expenditure components, we expect consumption growth of just below 1.5 per cent in 2018. Household consumption depends largely on real disposable income, in turn determined by real wages and employment. Real disposable income was weak at the end of last year, but should recover in 2018 as wage growth picks up, inflation declines and employment continues to rise.
Household consumption is also affected by tangible wealth such as housing. Annual house price inflation slowed recently from 4.8 per cent in the third quarter of 2017 to 3.0 per cent in May 2018, according to HM Land Registry, on the back of stamp duty increases, less generous tax allowance for buy-to-let properties and the squeeze in real incomes. This was the lowest annual growth since August 2013 when it was also 3.0 per cent and is in line with our earlier predictions of a cooling down of the housing market. The number of transactions on residential properties declined by 0.5 per cent in May compared to a year ago and the number of mortgage approvals decreased by 2.1 per cent over the same period according to the Bank of England. However the housing market is not cooling off in all UK regions: house prices in the East Midlands grew at an annual rate of 6.3 per cent in May compared with a decline of 0.4 per cent in London. According to Reference ChadhaChadha (2018b), the dispersion of regional house prices growth can partly be explained by the productivity of workers in different regions. Analysis by Reference Dhingra, Machin and OvermanDhingra et al. (2017) on the local economic effects of Brexit suggests that the South of England and urban areas – in particular London – would be hardest hit by Brexit. The negative productivity shock from Brexit could therefore explain why the London housing market is cooling off more than in the rest of the country.
Considering short-run factors, the GFK Consumer confidence survey, which has been on a downward trend since the Brexit referendum, seems to have stabilised since the turn of the year. Unusually warm weather as well as morale-boosting events such as the royal wedding and World Cup may have supported a recovery in retail sales in the second quarter. Retail sales volume growth rebounded from −0.4 per cent in the first quarter to 2 per cent in the second. In reflection of that, retail sales surveys, such as the British Retail Consortium, have been strong since they dipped in spring, possibly mirroring the adverse weather conditions.
Government spending
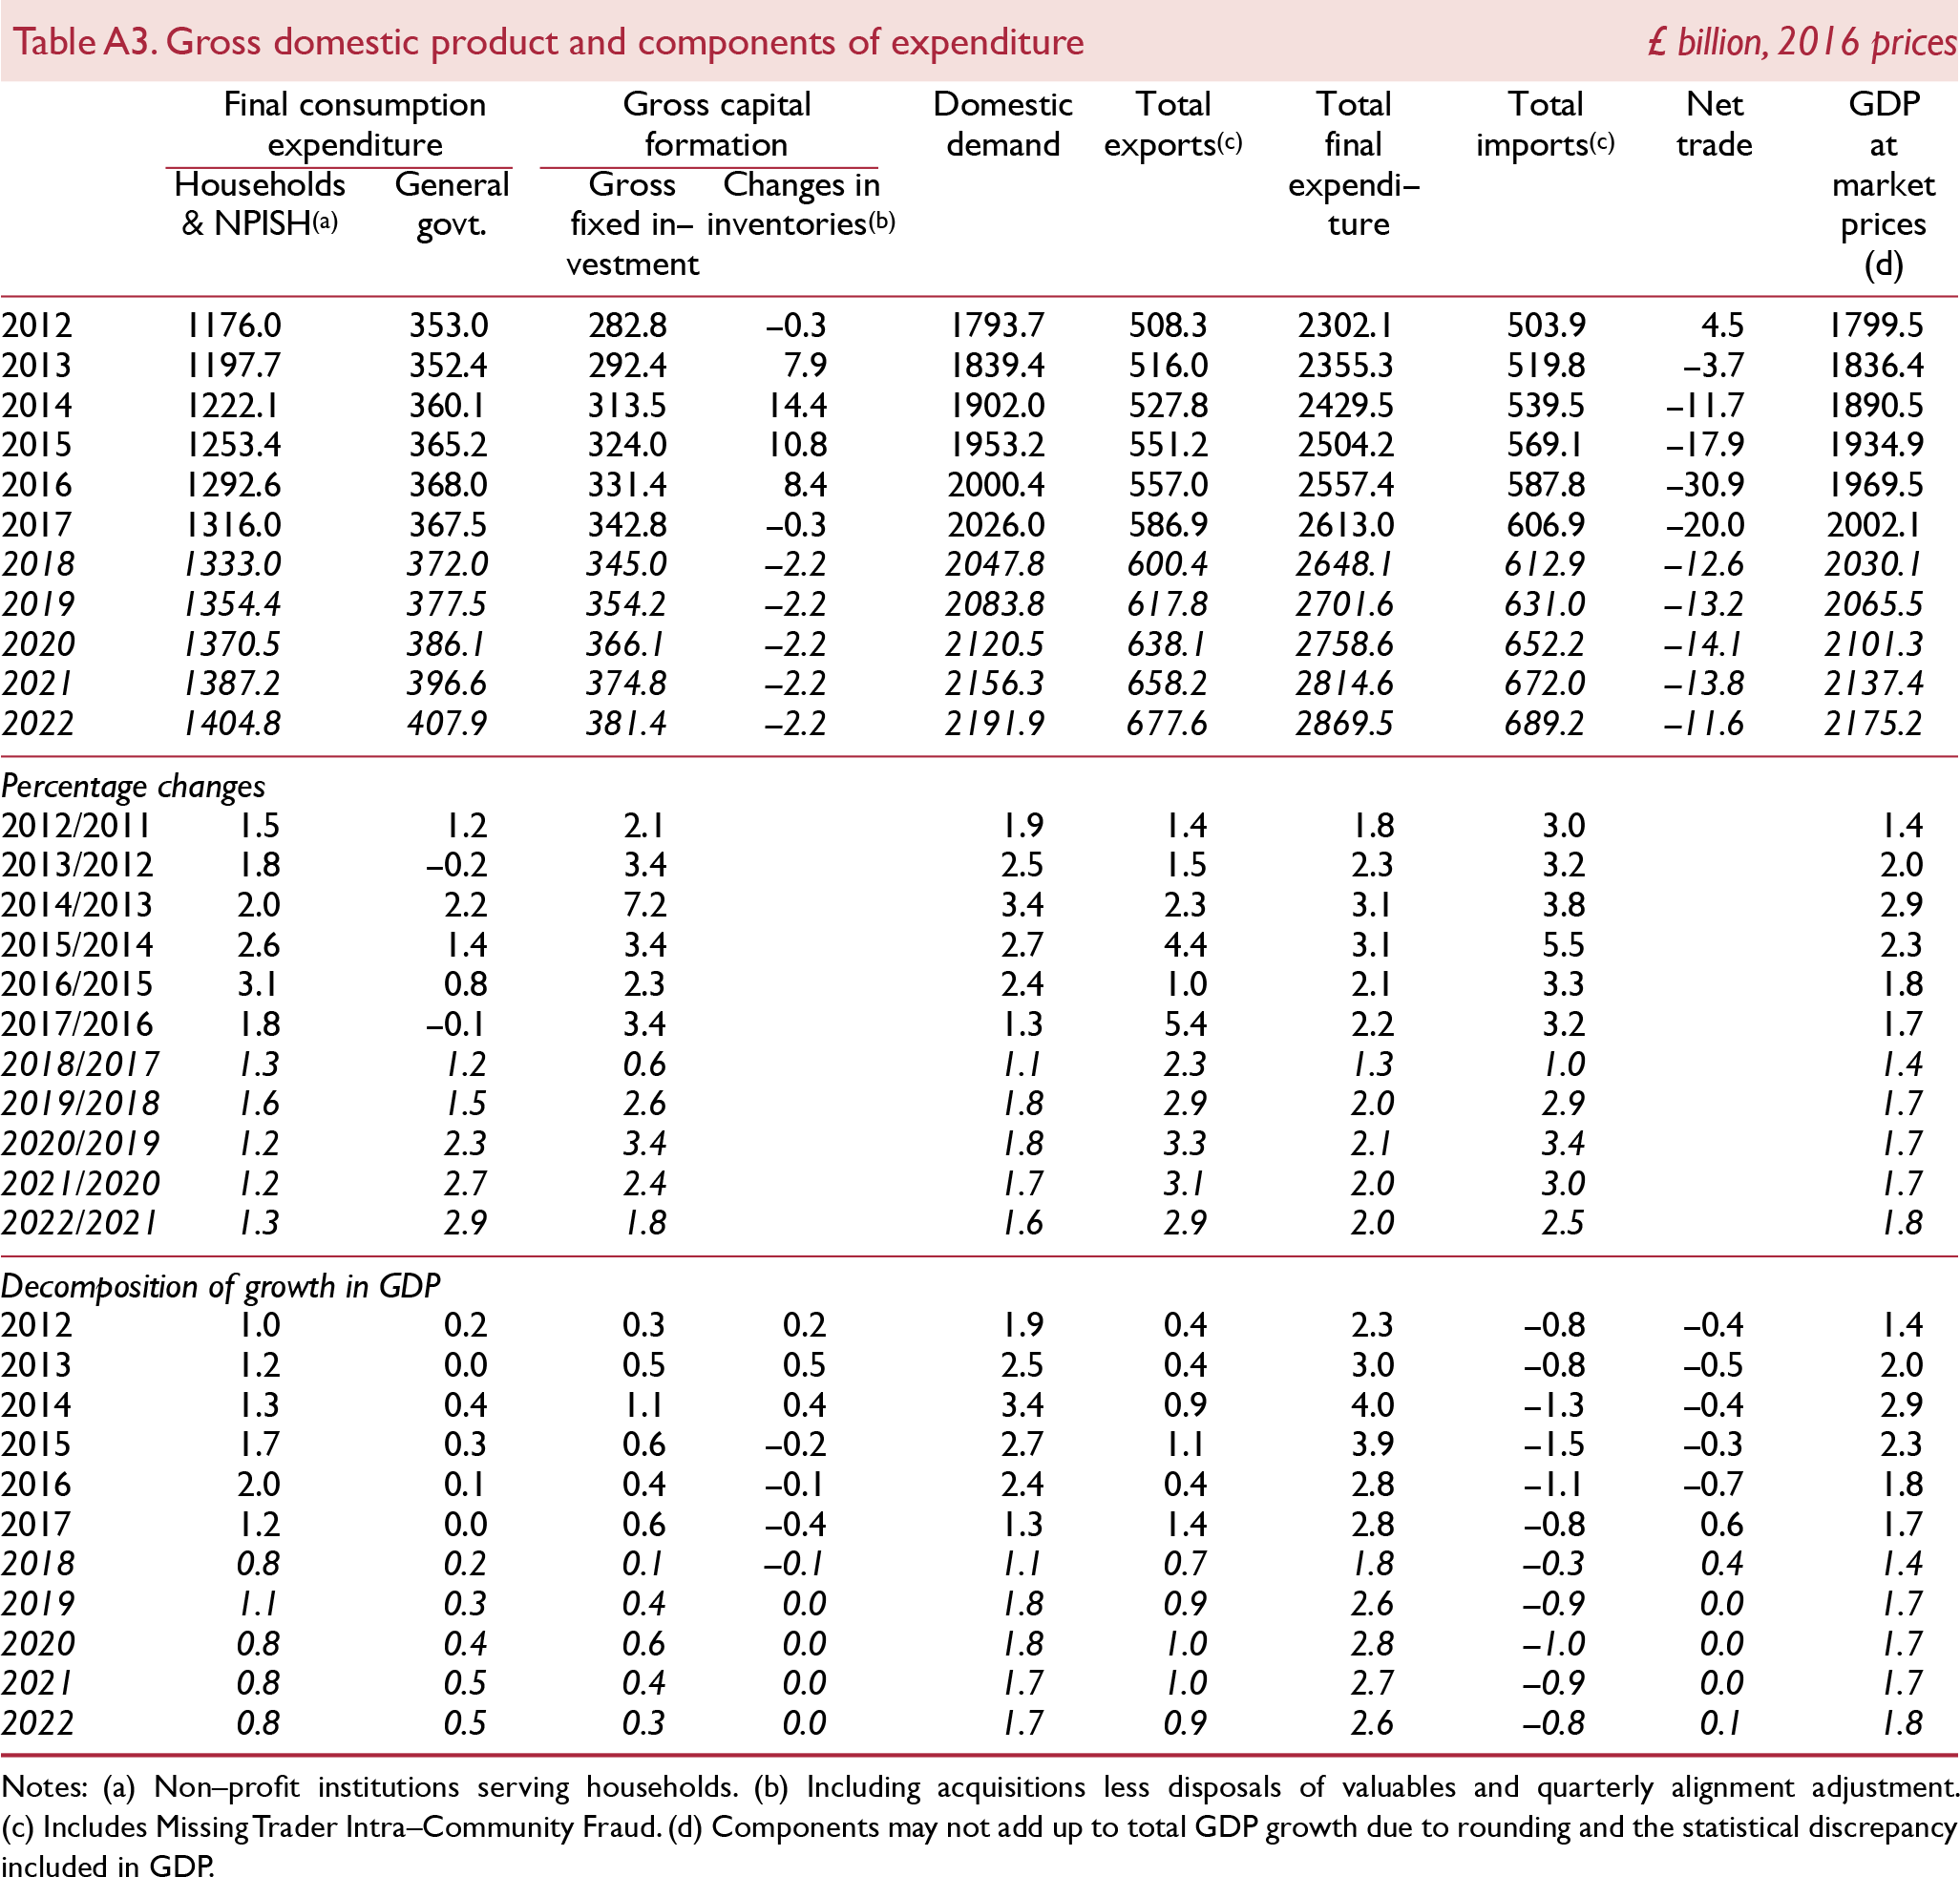
As in the May Review, we have replaced our practice of adopting the OBR's forecast of government spending, and assume a higher path for government consumption relative to the OBR. As a result, government spending should add 0.2 points to real GDP growth this year and 0.3 the next.
Business investment
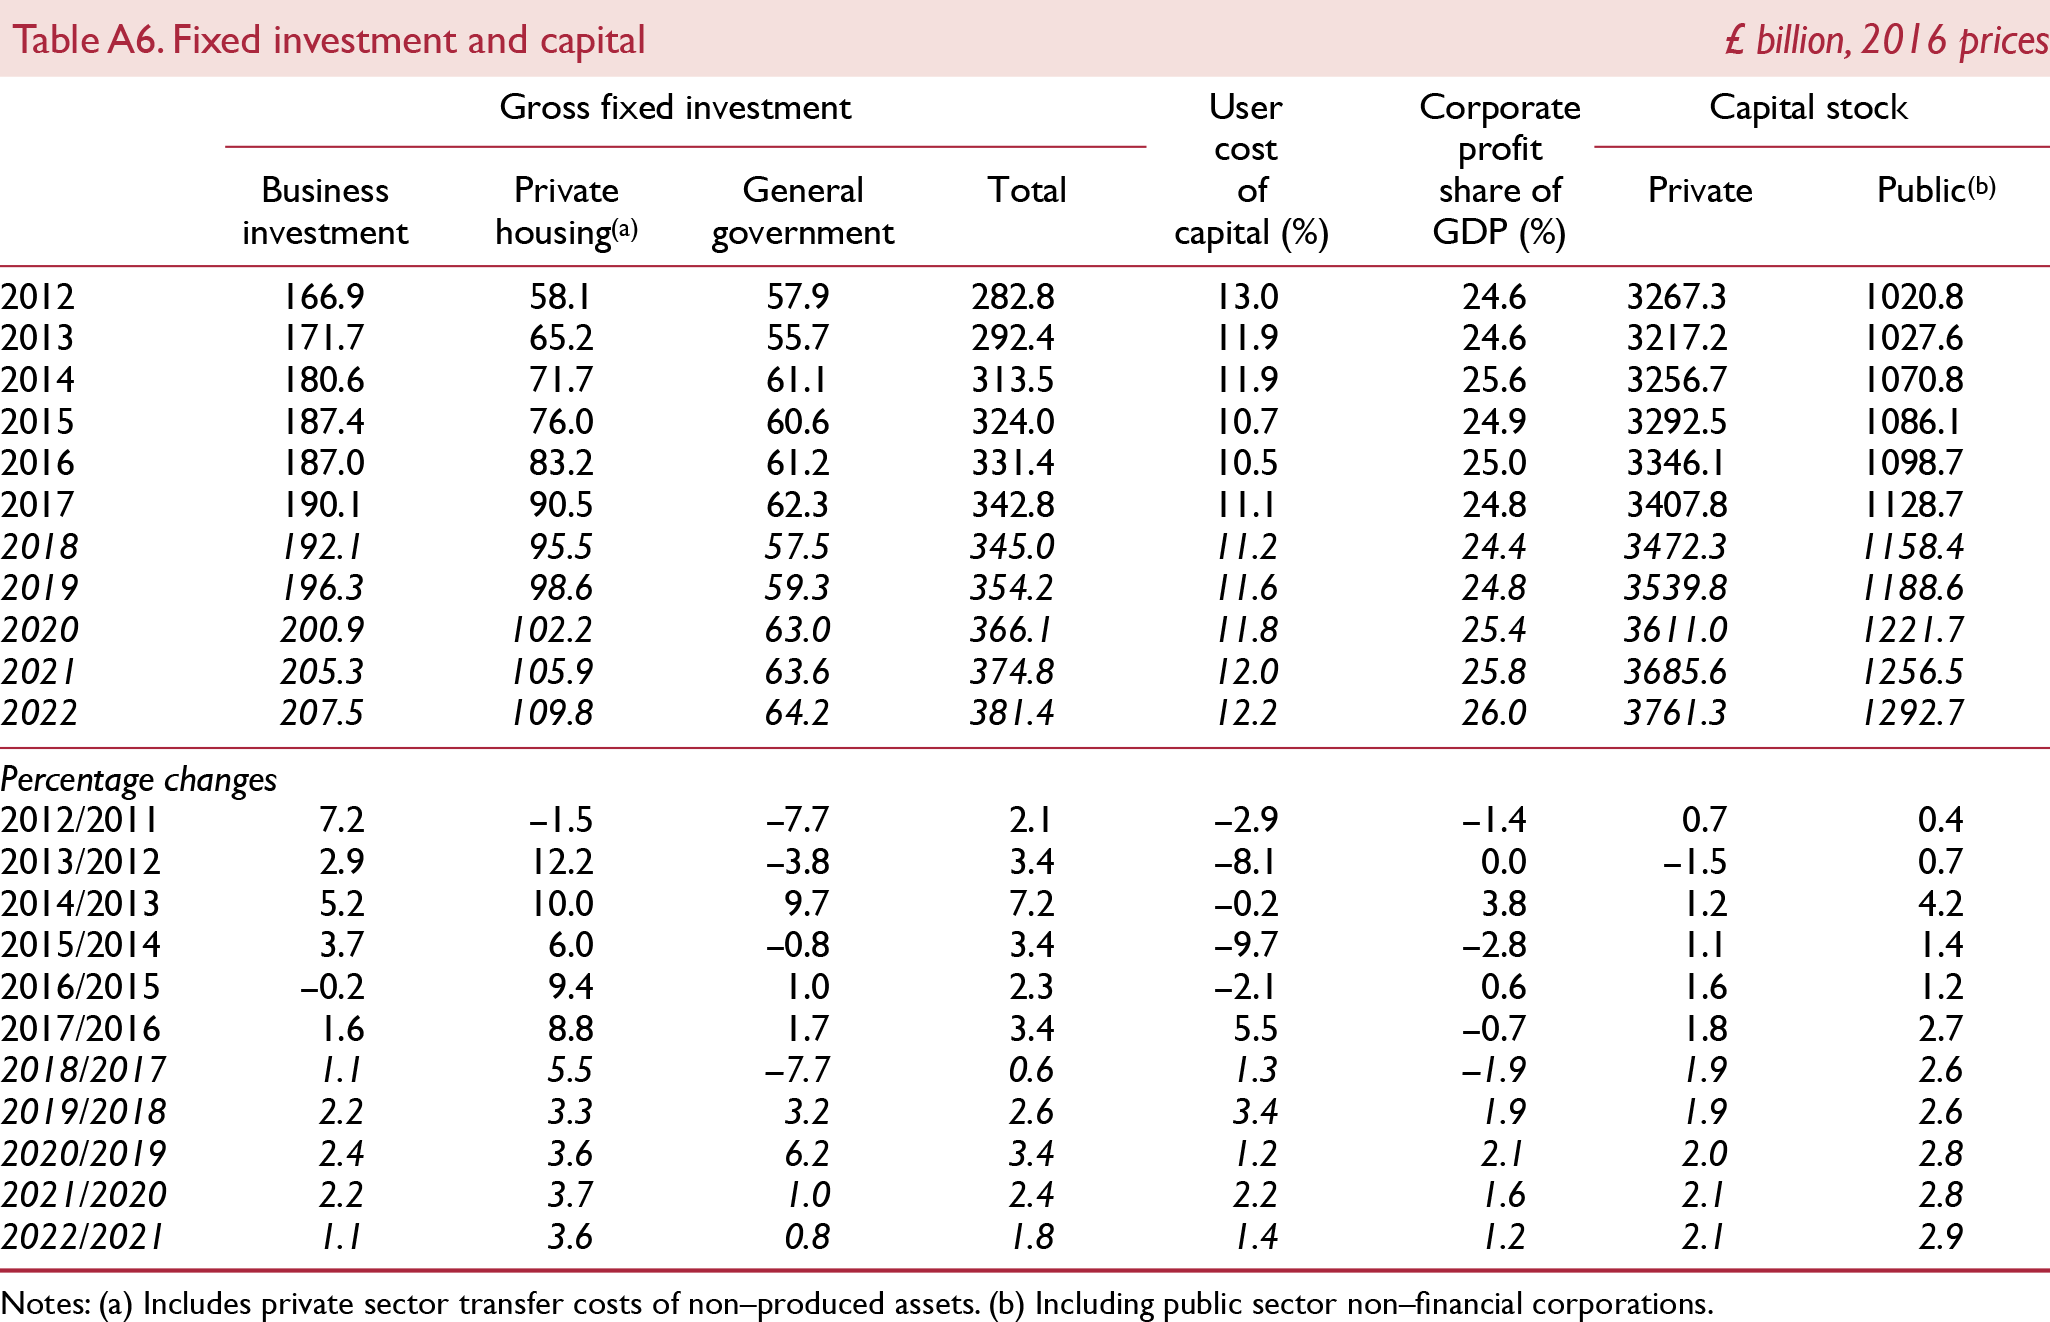
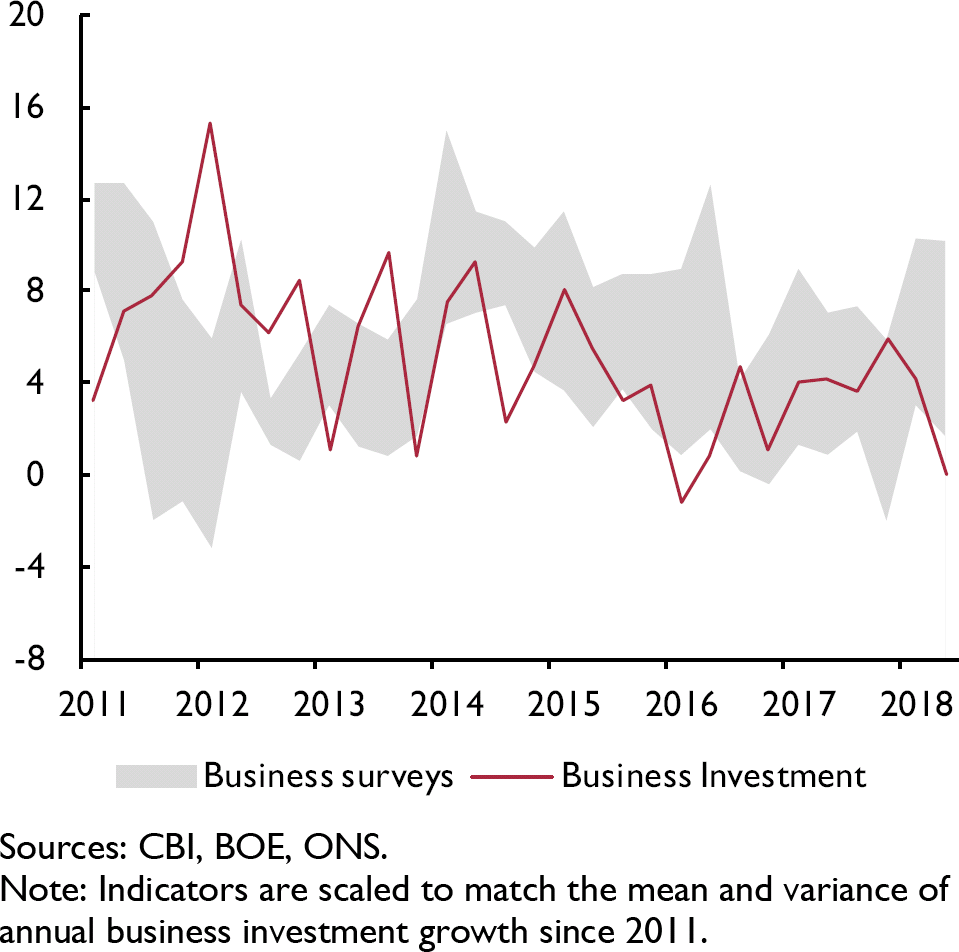
Business investment has also shown signs of moderation since the turn of the year, similar to the trend in the other major economies. Survey indicators paint a somewhat different picture, having shown a pick-up in investment intentions since the start of the year (figure 13). Looking ahead, a number of opposing factors, taken together, point to business investment growth of around 2–3 per cent in 2018. On the one hand, linked to the increase in exports and a substitution away from imports, investment should pick up to sustain the process of transition towards domestic production (Bank of England Inflation Report, May 2018). On the other hand, there is clear evidence from business surveys that Brexit-related uncertainty is weighing down on medium-term investment plans. In the most recent Decision Maker Panel survey, 37 per cent of panel members thought that Brexit was currently in the top three sources of uncertainty. That is slightly lower compared to one year earlier, yet overall it shows that the shadow of Brexit-related uncertainty on businesses persists (Agents' summary of business conditions, 2018 Q2).
Investment intentions (net balance) and business investment (annual percentage change)
Supply conditions
Migration
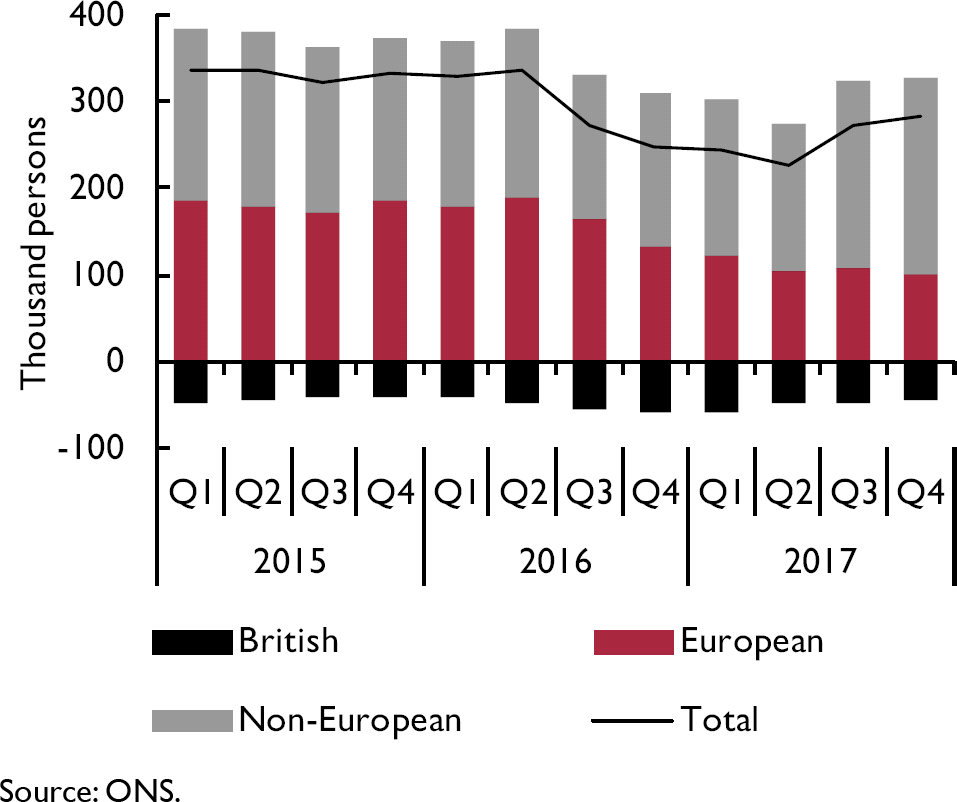
The latest ONS data show that net migration to the UK rose slightly to 282,000 in the year ending in the fourth quarter of 2017, however it remains around 50,000 lower per year than the level that prevailed prior to the 2016 referendum (figure 14). This can be largely attributed to a reduction in net migration from the EU (Reference RolfeRolfe, 2018), which reached its lowest level since 2013, with net migration from A8 countries in particular showing a sharp decline. This has more than offset the rise in net migration from outside the EU over the same period. Whilst some of this reduction can undoubtedly be attributed to uncertainty surrounding potential migrants' access to the labour market once the UK leaves the EU, stronger economic growth in the A8 countries relative to the UK reduces the incentives for migration. Additionally, the depreciation of sterling, which has fallen by around 19 per cent relative to the Euro since its peak in the third quarter of 2015, means that any savings or remittances from wages earned in the UK are worth less in a migrant's home currency and reduces the attractiveness of the UK as a destination compared to Germany for example. The effect of leaving the EU on net migration of EU nationals will depend largely on the outcome of negotiations between the EU and the UK regarding movement of labour. The assumption underlying our forecast is that the UK population evolves according to ONS principal projections, which are based on a gradual reduction in net migration in the near and medium term. Thus net migration falling more sharply following the UK's exit from the EU presents a downside risk to our forecast for output capacity. Reference Hantzsche and KaraHantzsche and Kara (2018) simulate the effects of a reduction in net migration of 100,000 per year compared to the ONS principal projection and find that this reduces the level of real GDP by around 1.7 per cent after ten years.
Net migration to the UK
Employment
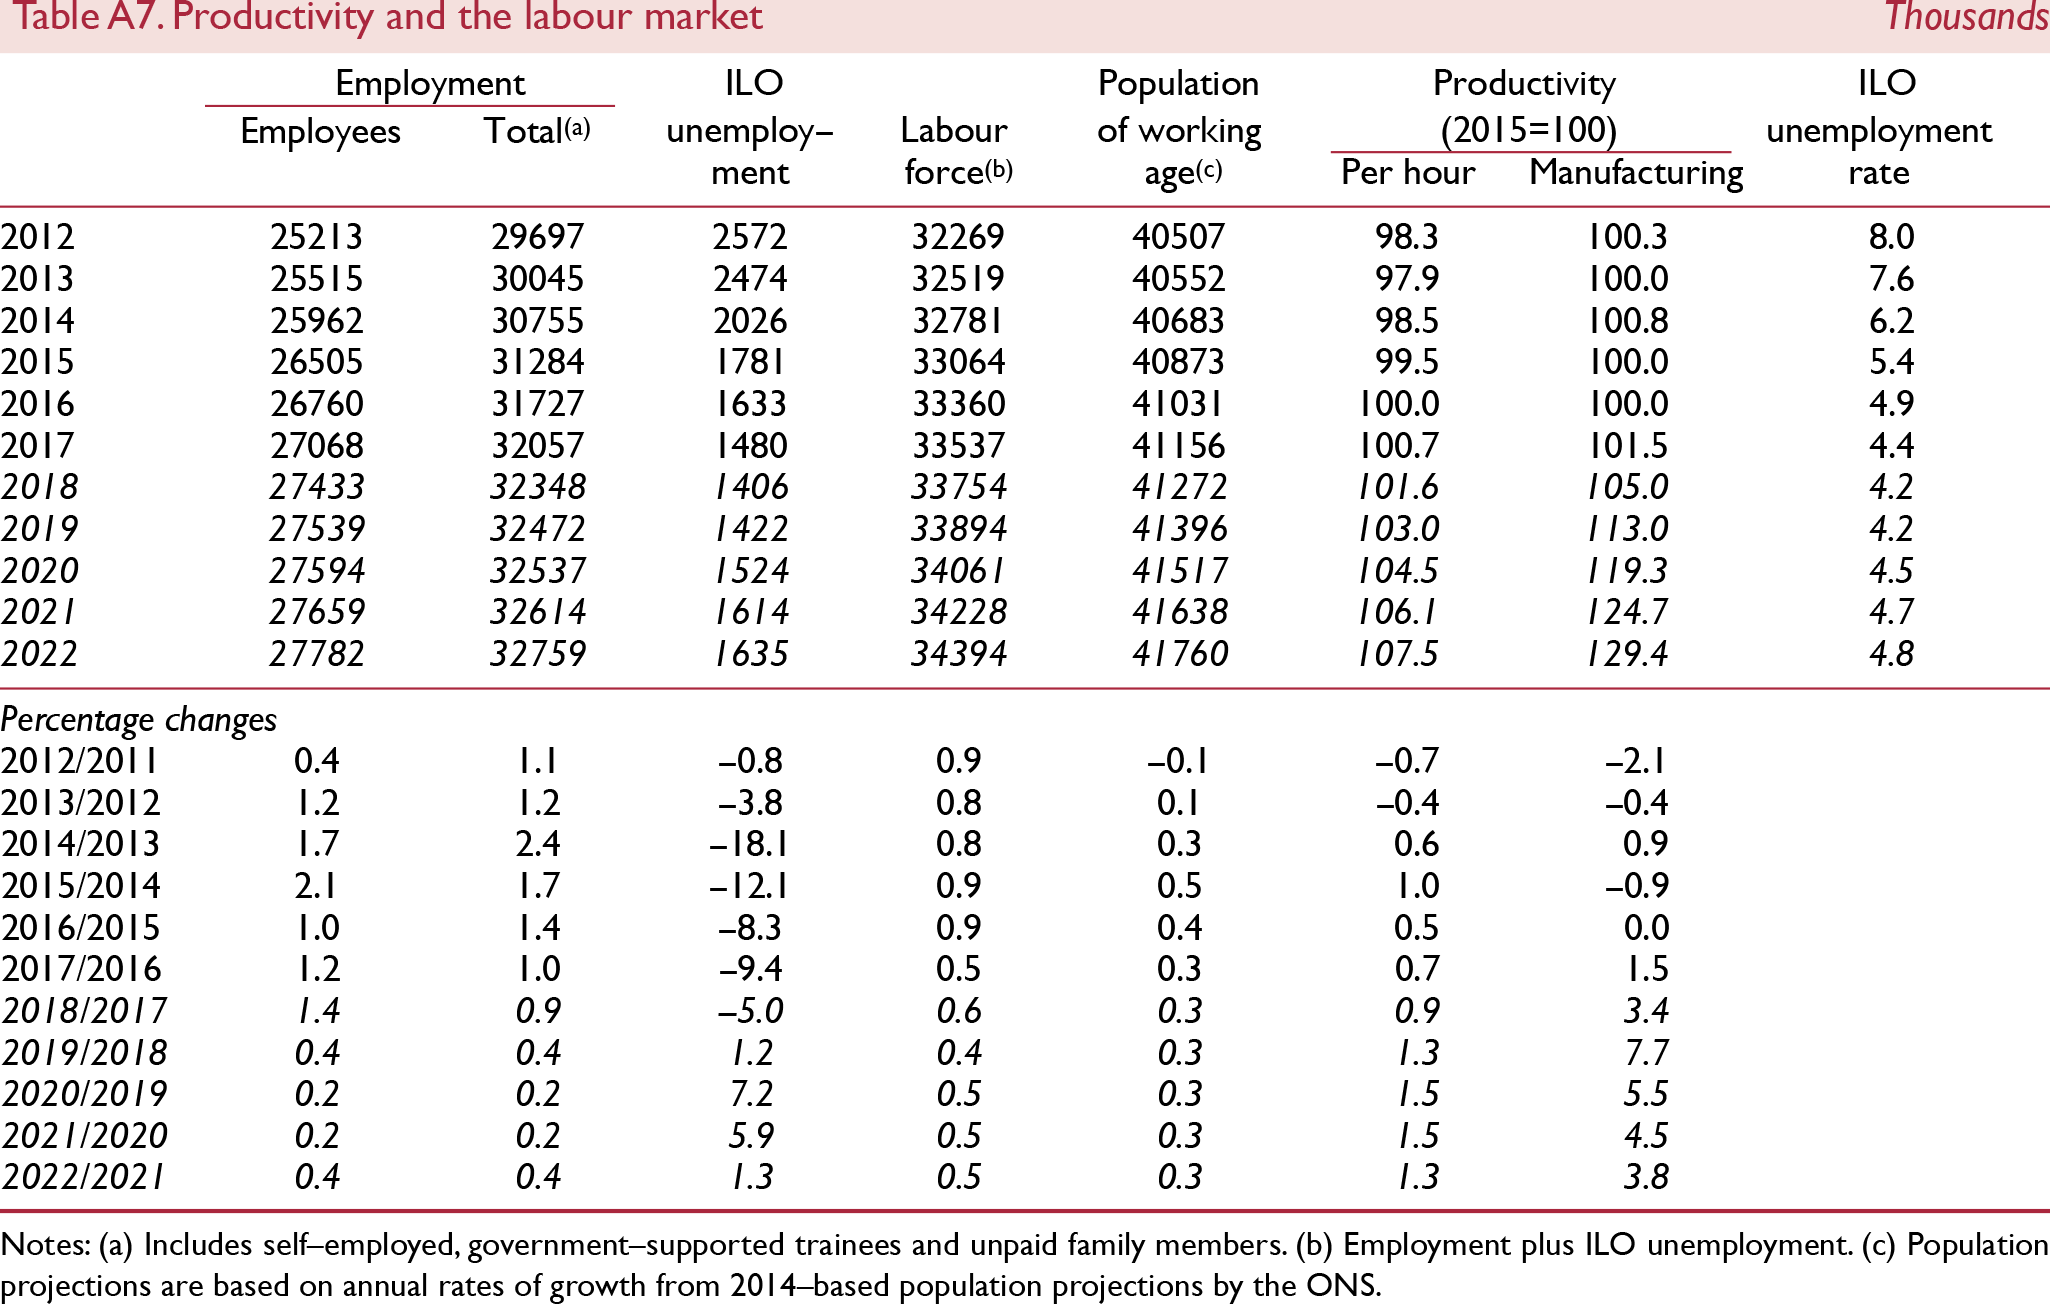
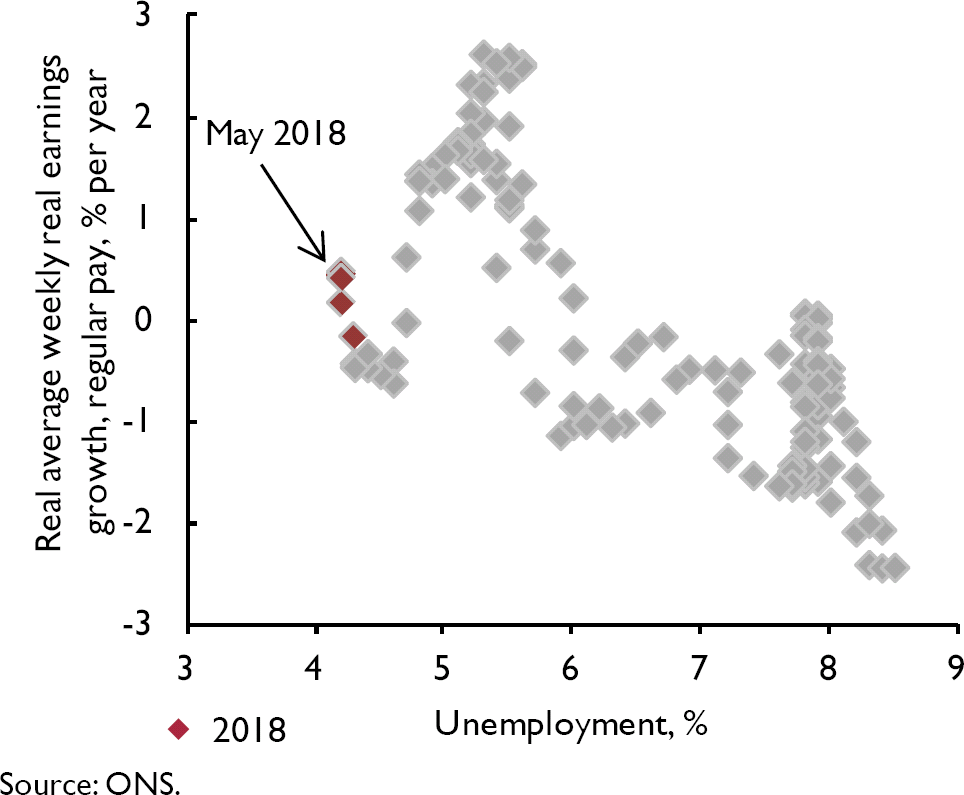
The unemployment rate remained at a 42-year low of 4.2 per cent in the three months to May, while the employment rate rose to a record high of 75.7 per cent. Despite this apparent labour market tightness, wage growth has remained weak (figure 15). Real average weekly earnings grew by 0.2 per cent including bonuses and 0.4 per cent excluding bonuses in the three months to May compared to the same period one year earlier. Reference Bell and BlanchflowerBell and Blanchflower (2018) contend that part of the explanation for this sluggish wage growth, despite the very low unemployment rate, is that the underemployment rate, which rose during the Great Recession, has not yet returned to pre-recession levels. Thus by looking at the unemployment rate alone, we are underestimating the amount of slack in the labour market. They also conclude that the natural rate of unemployment has shifted down as workers' bargaining power has been reduced due to increased migration, the public sector pay freeze, and heightened fear in the wake of the Great Recession. We expect unemployment to remain low in the near term, averaging 4.2 per cent in 2018 and 2019, before stabilising at around 4¾ per cent in the medium term.
Unemployment and average weekly earnings, January 2007–May 2018
Productivity
A further explanation for the underperformance of real wages is the weak labour productivity growth since the recession. Reference Kara, Lopresto and PiggottKara et al. (2018) estimate a wage equation for the G7 economies and find that productivity is by far the most important contributor to low wage growth in the UK and the other G7 economies. Strong growth in output per hour in the second half of 2017 has continued into 2018, rising by 0.9 per cent in the first quarter compared to the same quarter in 2017. However much of this boost was due to a reduction in average hours worked, which is a volatile measure often subject to revisions. Output per worker, a more stable measure of labour productivity, declined slightly in the first quarter of 2018, compared to the same quarter in 2017. Both output per worker and output per hour declined by 0.4 per cent in the first quarter of 2018 compared to the previous quarter.
On the basis of our soft-Brexit assumption, we expect business investment to pick up modestly next year and for this to be sustained over the medium term. The resulting increase in the growth rate of capital stock should support labour productivity growth. We continue to expect modest growth in output per hour this year and a slight acceleration into the medium term.
Prices
Having climbed above 3 per cent in 2017, consumer price inflation has been unchanged at 2.4 per cent in each month between March and June 2018.
Developments
Recent developments in the value of sterling and oil prices suggest that there may be some upward pressure in the pipeline on CPI inflation that has not yet materialised. On a trade weighted basis, sterling depreciated by roughly 2 per cent between the ends of March and June. And the sterling price of Brent Crude has risen from an average price of £47 a barrel in March to £56 in June.
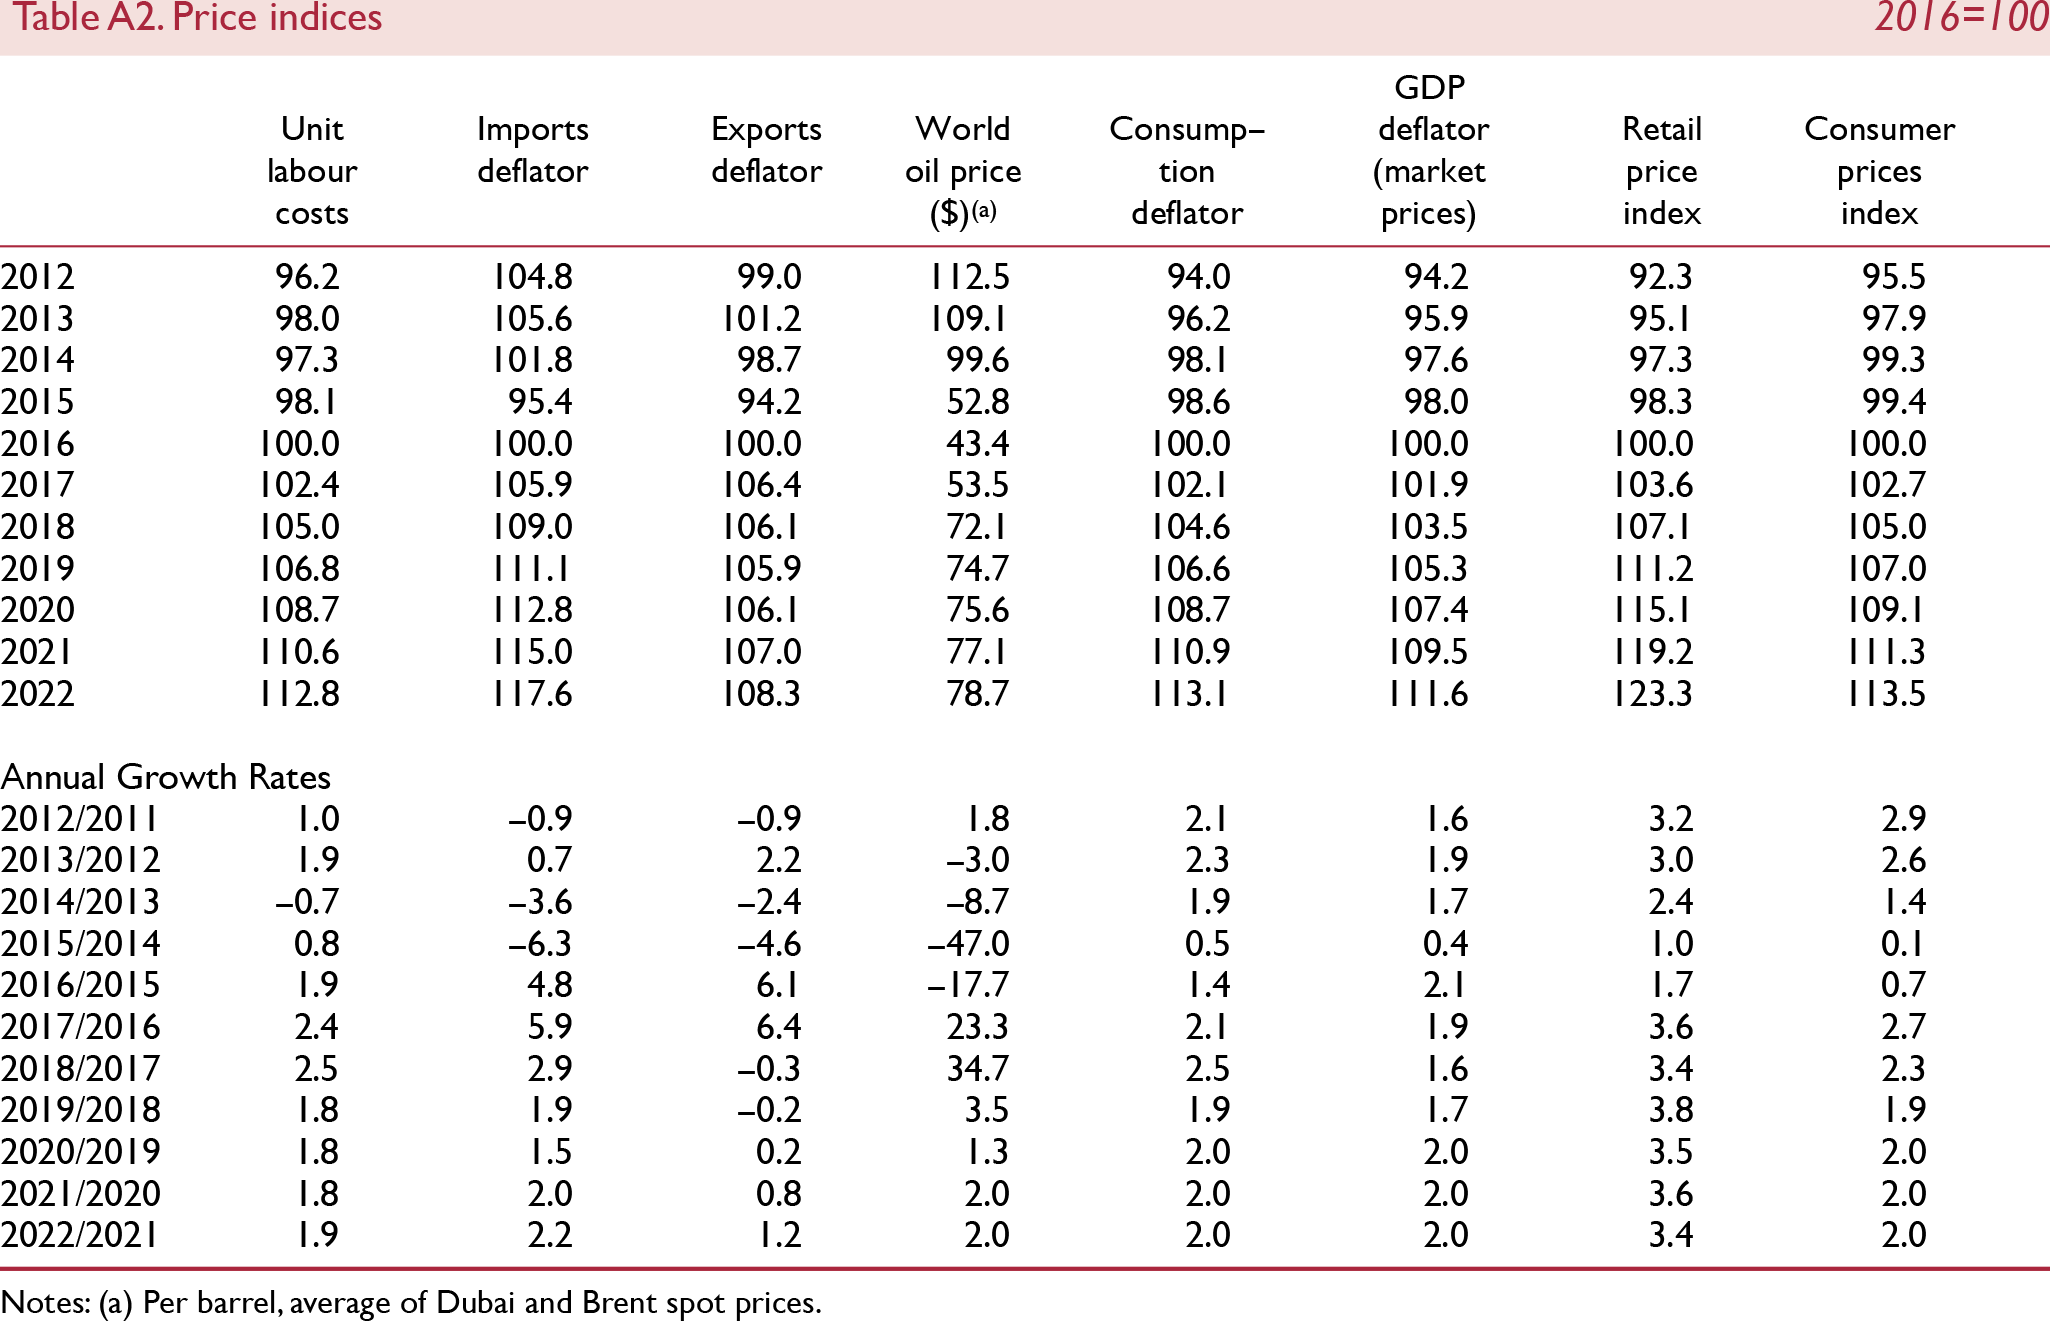
But there are reasons to be cautious about the effect of these specific changes on inflation. Empirical estimates of the degree of pass-through from exchange rate movements suggest that only large changes (in excess of 5 per cent) have significant effects on consumer prices (Reference LewisLewis, 2016), as firms absorb the impact of small changes into their markups (Reference Nakamura and ZeromNakamura and Zerom, 2010). And while oil prices are higher, beneath the surface of the consumer price index are a number of goods and services experiencing disinflation. Our measure of trimmed mean inflation, which is the arithmetic mean of all price changes once 5 per cent of the highest and lowest price changes have been excluded, has fallen by 1.5 percentage points since October 2017 to 1.2 per cent in June (see box D).
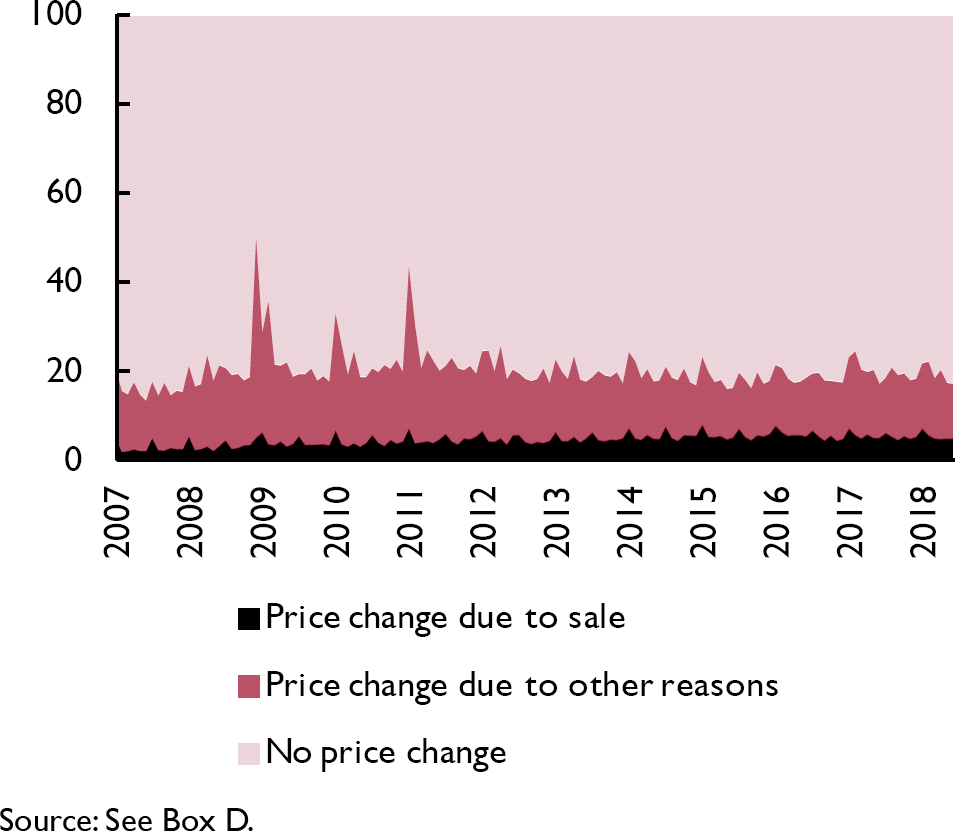
It has been suggested that CPI inflation was temporarily depressed in June because stores were bringing forward their summer sales (Financial Times, 2018). There is little evidence of this. Figure 16 shows the fraction of prices that remain fixed each month, the fraction of prices that change due to sales and the fraction of prices that change due to other reasons. While sales have become more common over time, 5 per cent of the goods and services that make up the CPI were at sale prices in June, precisely the same as in each of the previous five Junes.
Decomposing price changes (per cent
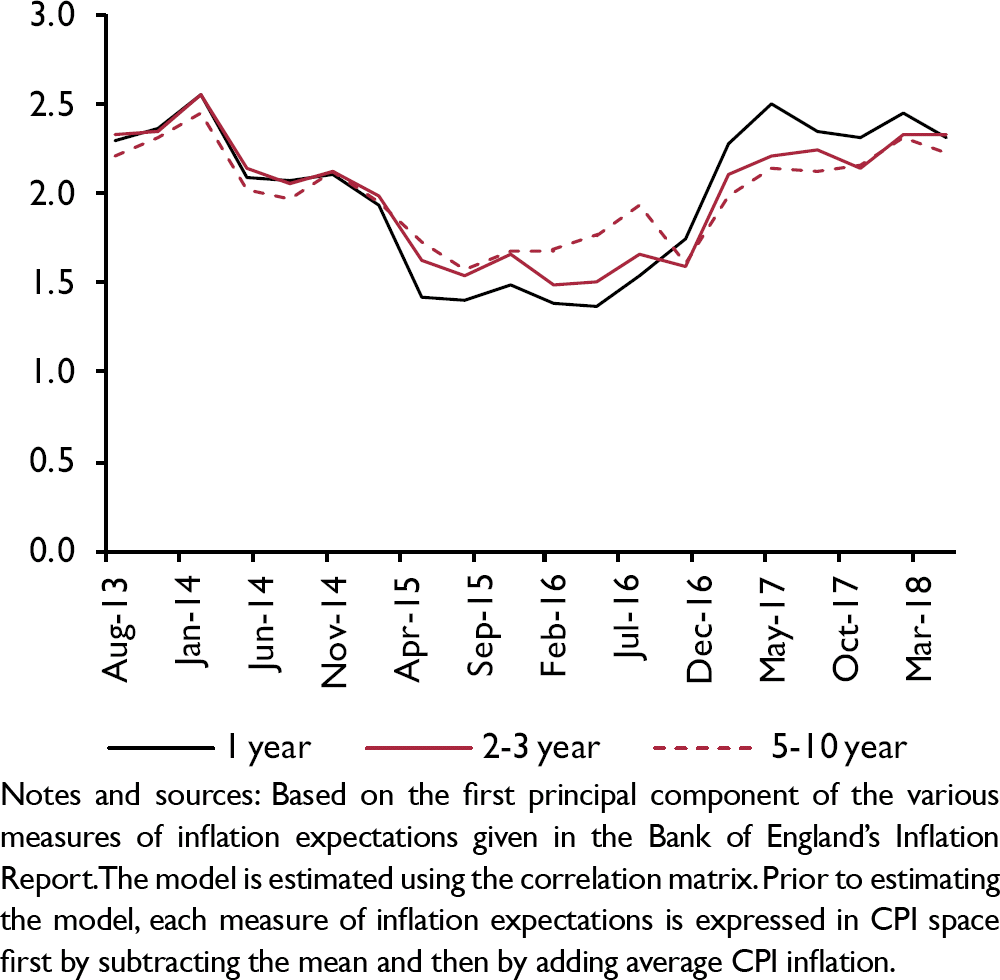
Expectations of future inflation remain broadly consistent with the inflation target. As there is an array of measures of inflation expectations (Reference Kapetanios, Maule and YoungKapetanios et al., 2016), we construct a new composite measure. Using various household surveys, firm surveys and financial market measures, we use principal component analysis to summarise this information at various horizons. This composite measure implies that expected inflation fell from 2.5 per cent to 2.3 per cent at the 1-year horizon and from 2.3 per cent to 2.2 per cent at the 5–10-year horizon between February and May, but remained flat at 2.3 per cent at the 2–3 year horizon.
Outlook
Our forecast incorporates both the short-run temporary impact of higher oil prices and the long-run disinflationary trend. We expect CPI inflation to fall from 2.3 per cent at the end of this year to around the Bank of England's target of 2 per cent thereafter. A hard Brexit is the biggest risk to our forecast. Another large depreciation could push inflation over and above our estimate (see Box A).
Sectoral balance
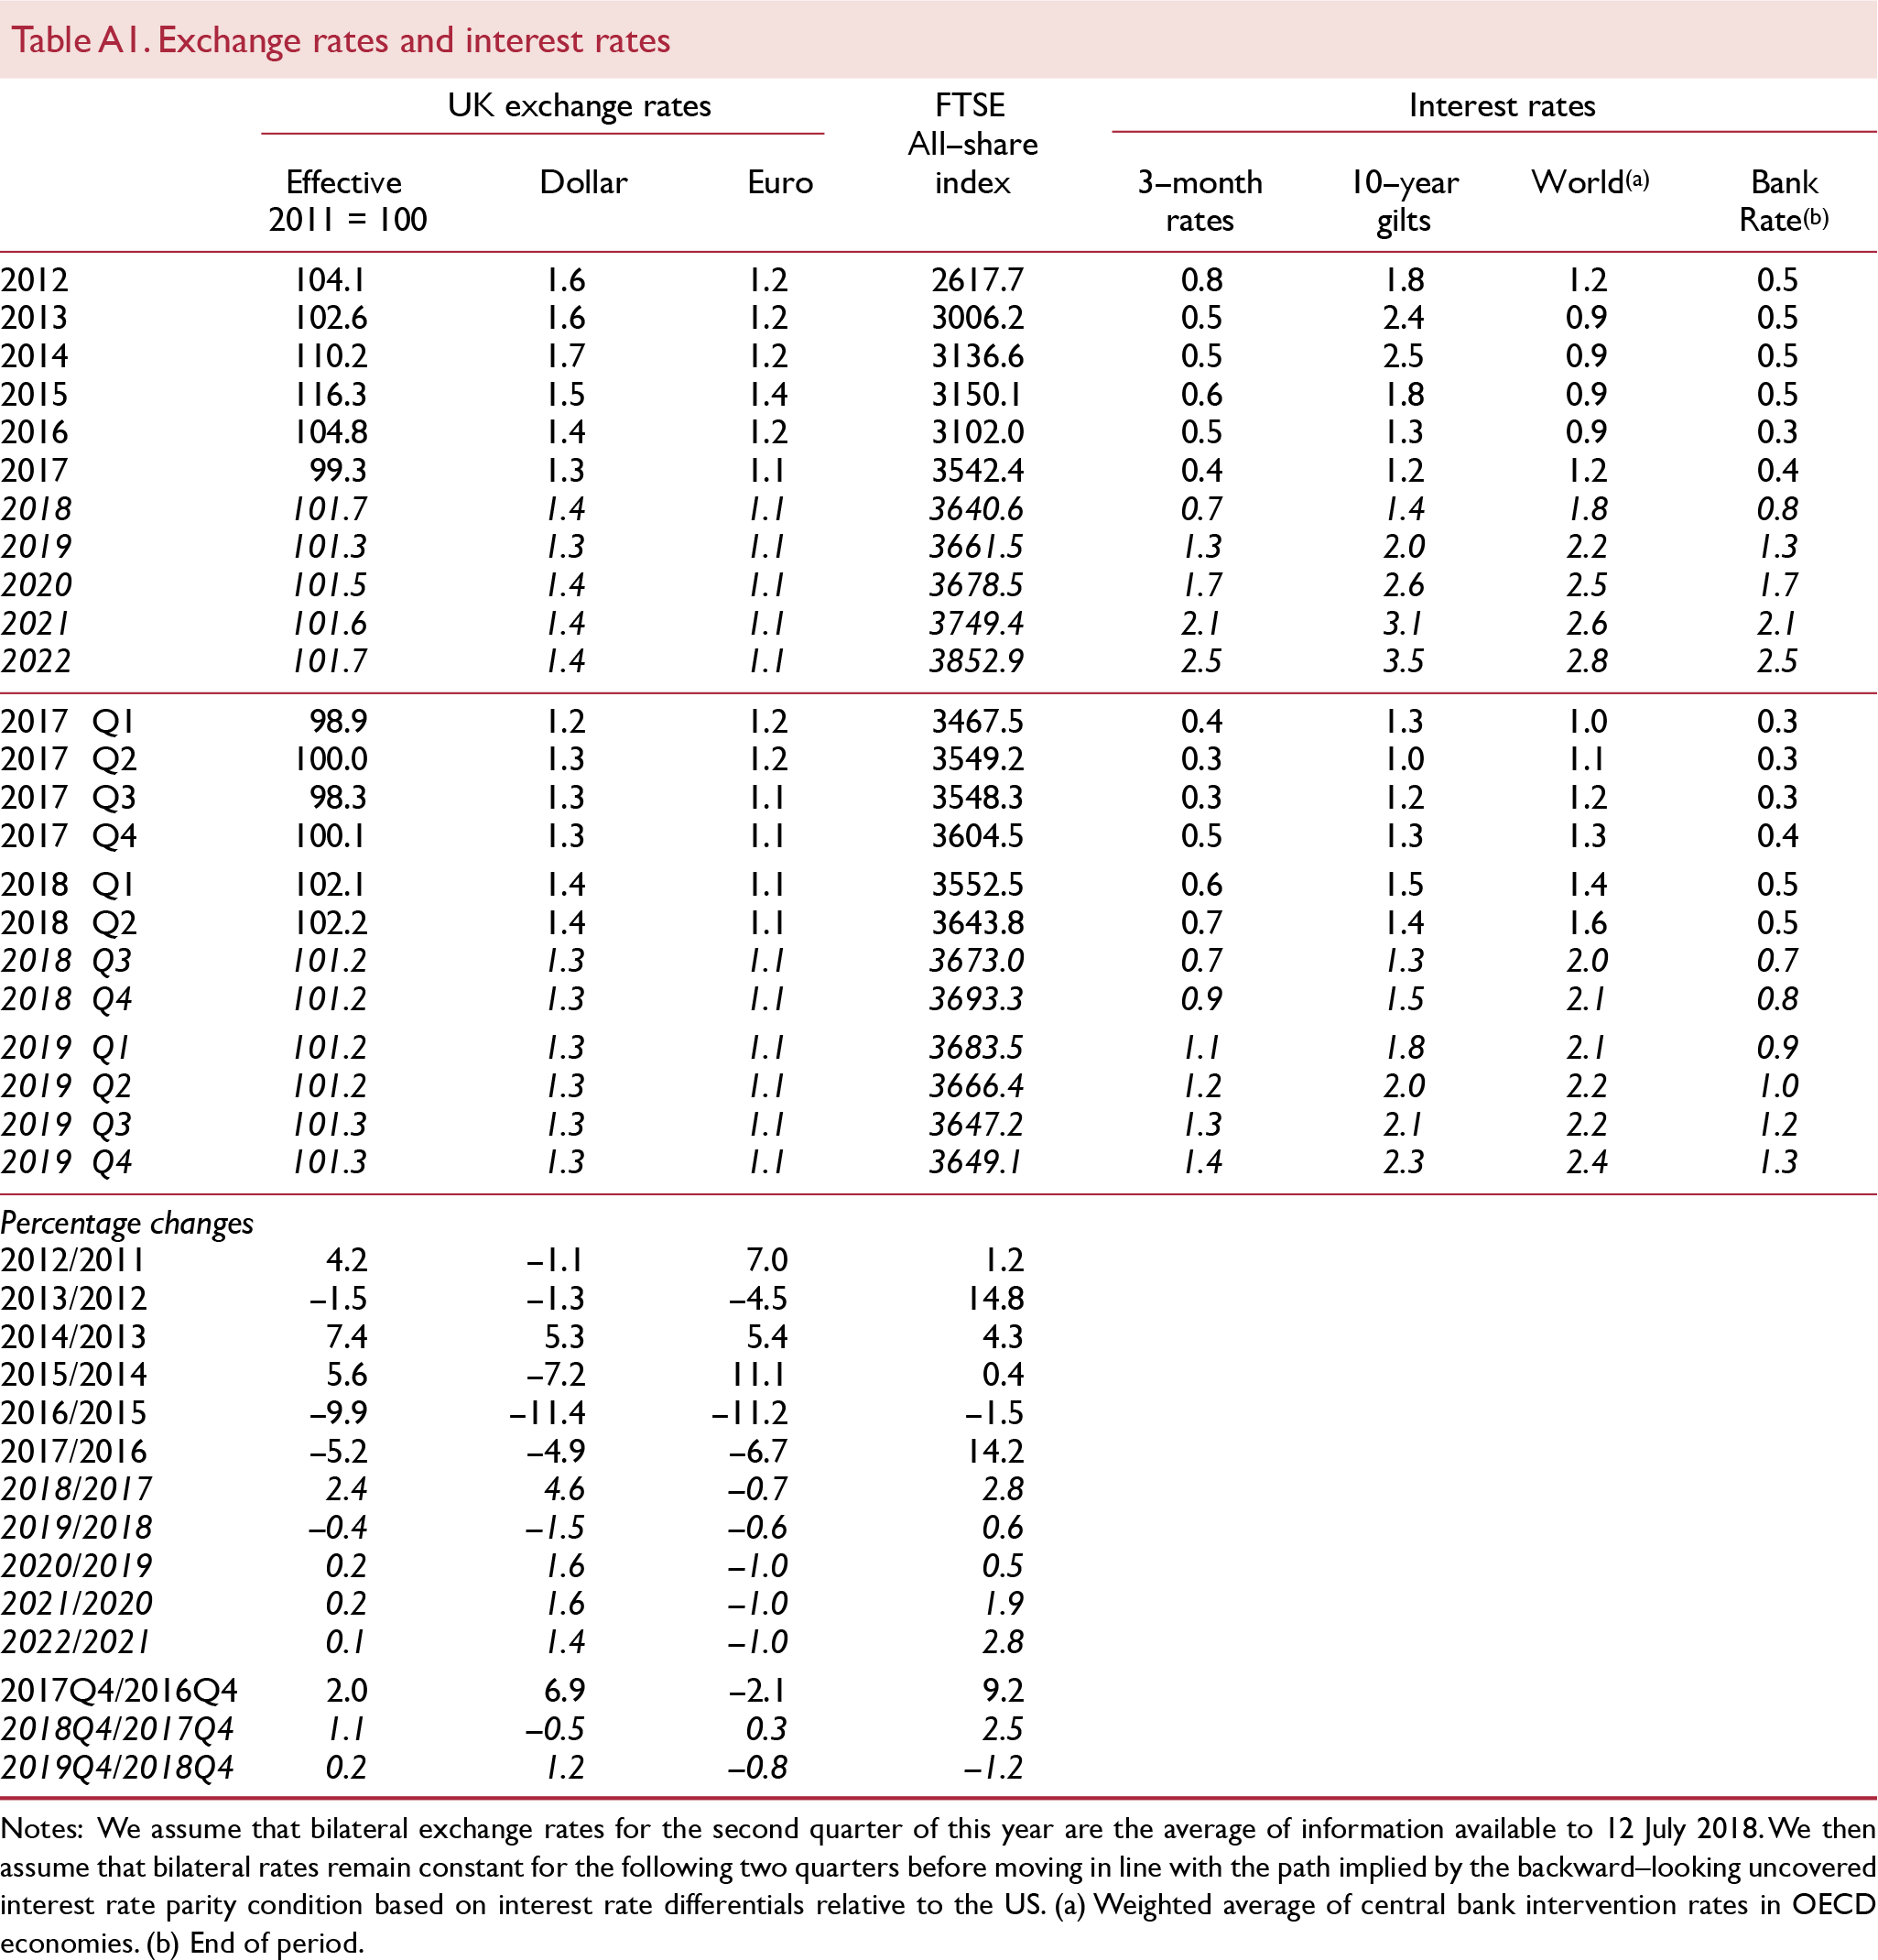
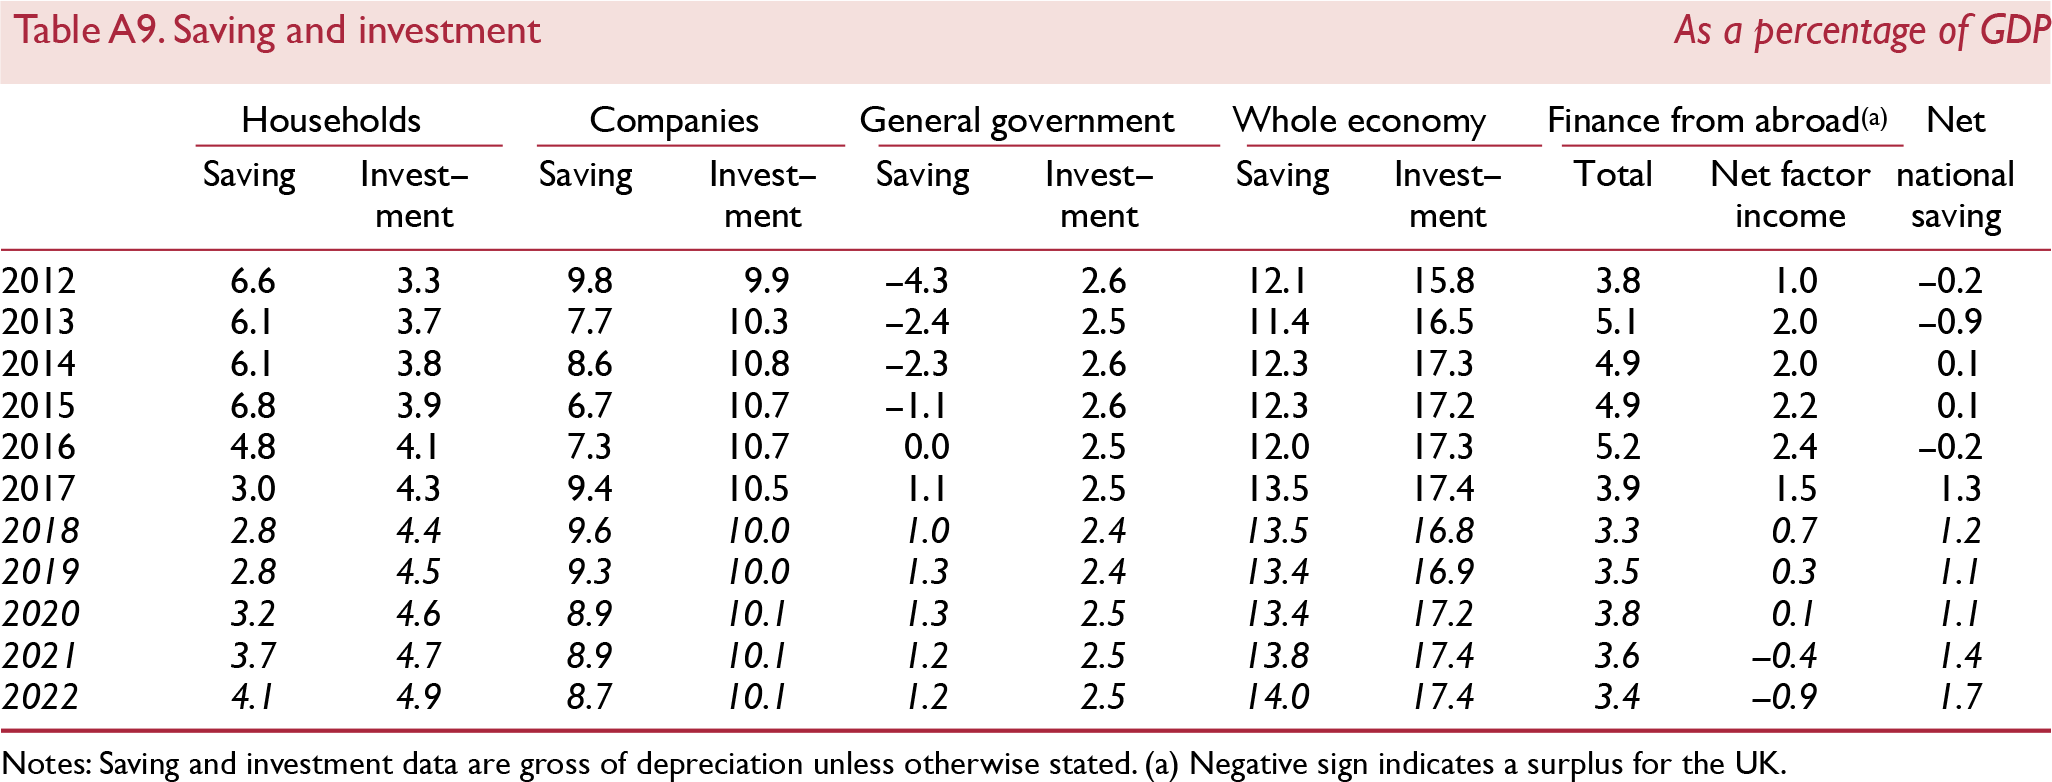
Table A9 shows the financial position of the private and public sectors of the economy and the resulting balance with the rest of the world. The private sector is further split into a household and a corporate sector. If investment is greater than saving for a sector, then this sector is a net borrower. The aggregation of these three sectors is the current account balance, which, if in deficit, implies that borrowing from the rest of the world is required in order to fund domestic investment plans.
The price of everything
The consumer price index is a fundamental economic statistic for households, firms and policymakers. This number summarises the prices of hundreds of thousands of goods and services across the country. Yet the behaviour of individual prices is erratic, some rise and fall by an order of magnitude from one month to the next, others rarely change. These idiosyncrasies are central to understanding aggregate price dynamics (Reference GagnonGagnon, 2009; Nakamura et al., forthcoming).
What is the rate of inflation when the most volatile prices are excluded? This box answers this question by constructing a measure of trimmed mean inflation, which excludes a fraction of the highest and lowest price changes each month, calculating the arithmetic mean across the remaining observations.Footnote 1 We find that current trimmed mean inflation is a powerful predictor of future consumer price index inflation. Although trimmed mean inflation has fallen in recent months, it remains in line with the Bank of England's target.
We begin by collecting micro data on the prices of the individual items that underlie the all items consumer price index (CPI) for the United Kingdom. This data set contains the prices of up to 135,000 goods and services each month, which adds up to approximately 30 million price quotes since the 1990s.Footnote 2 This data will also allow us to monitor the variance, skewness, kurtosis and frequency of price changes at a regional and national resolution.
In order to calculate the trimmed mean, the first step is to calculate month-on-month inflation rates for items i = 1,2 …, N at time 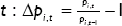 . The second step is to calculate the j = 0,1, …, 50 per cent trimmed mean for each month,
  . The final step is to calculate the jth per cent annualised trimmed mean for each month:
  .
.
It is possible to discard anything from 0 per cent of the most extreme price changes, which is simply the mean of the full distribution, to 50 per cent, which is equivalent to the median.Footnote 3 In order to select the optimal trimming percentage, we run a simple horserace, where we assess how well the jth per cent trimmed mean forecasts future CPI inflation. In this race, we also include CPI inflation and CPI excluding energy, food, alcoholic beverages and tobacco inflation (CPI-ex) as benchmarks. Specifically, we calculate the root mean square error (RMSE) from the following equation:

which regresses year ahead CPI inflation, π t+12, on a constant, α, and a measure of inflation (either the jth trimmed mean, CPI or CPI-ex), x t.
The results are shown in figure D1. The results indicate that the 5 per cent trimmed mean is optimal. In addition, the 5 per cent trimmed mean yields better forecasts of future inflation than the CPI and CPI-ex not only at the 12-month horizon but also at the 24- and 36-month horizons.
Forecasting inflation: RMSE (percentage points)
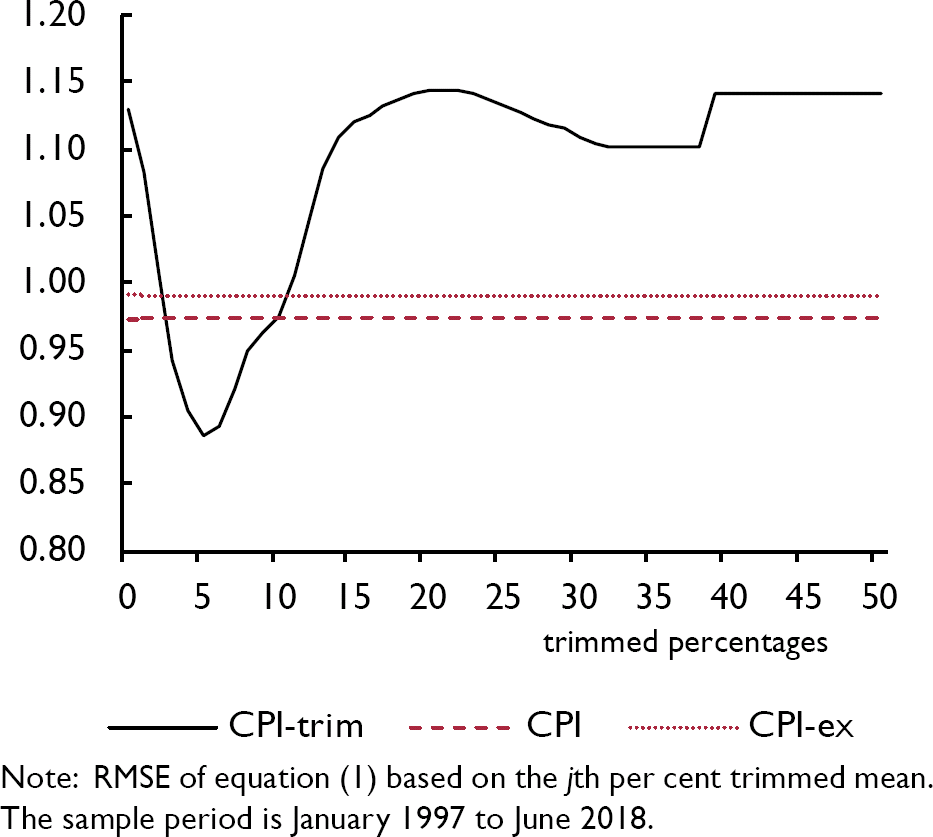
Figure D2 plots the 5 per cent trimmed mean, CPI and CPI-ex inflation rates. The three measures are highly correlated, with a correlation coefficient of 0.90 between trimmed mean and CPI inflation and 0.74 between trimmed mean and CPI-ex inflation. The level of CPI-trim inflation is lower on average but more volatile than CPI inflation. These differences are due to how the largest price changes are treated and to how the prices are weighted, as trimmed mean inflation is an unweighted average of a truncated distribution, while CPI inflation is a weighted average of the full distribution.
Measures of inflation (per cent)
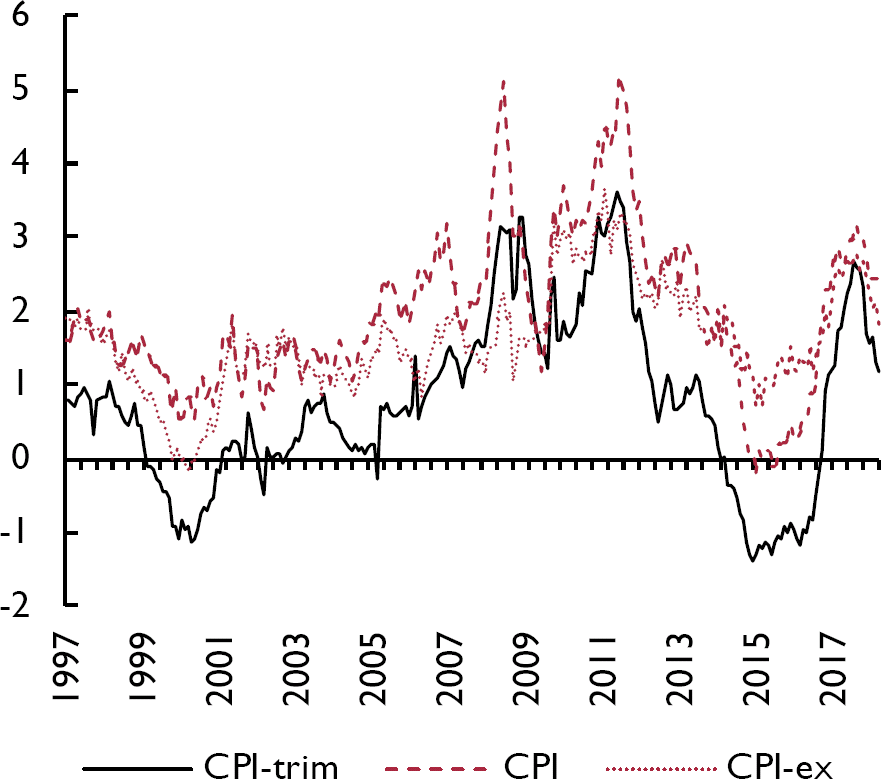
An important result is how trimmed mean inflation has recently fallen. After the depreciation of sterling in 2016, both trimmed mean inflation and CPI inflation rose sharply following a spell of disinflation. Since October 2017, however, trimmed mean inflation has fallen by 1.5 percentage points, suggesting that the pass-through effects are fading. Based on the latest outturn of trimmed mean inflation, equation (1) suggests that CPI inflation will be 2.2 per cent in a year's time.
Notes
1 See Reference DolmasDolmas (2005) and Reference Bryan, Cecchetti and MankiwBryan and Cecchetti (1994) for overviews of trimmed mean inflation measures. Trimmed mean inflation is based on the arithmetic mean, while the CPI typically uses the geometric mean.
2 Quotes are linked by the item ID, shop code, shop type and region to form a panel. Items that could not be uniquely linked between months were excluded, as were items where the price is zero.
3 Asymmetric trimmed means can also be calculated, where a different percentage is trimmed from each tail. While we only focus on integers, there are still 2450 possible combinations. For computational reasons, we focus on the 50 possible integers for symmetric trimmed means.
It is not possible to infer the optimality of the levels of capital from the current account but rather just the immediate financing needs of the economy. In 2017, all three domestic sectors of the economy – households, companies and government – were in deficit for the first time since at least 1987 (figure 18), and we forecast this pattern to carry on into the medium term.
The term structure of CPI inflation expectations (per cent)
Sectoral balances
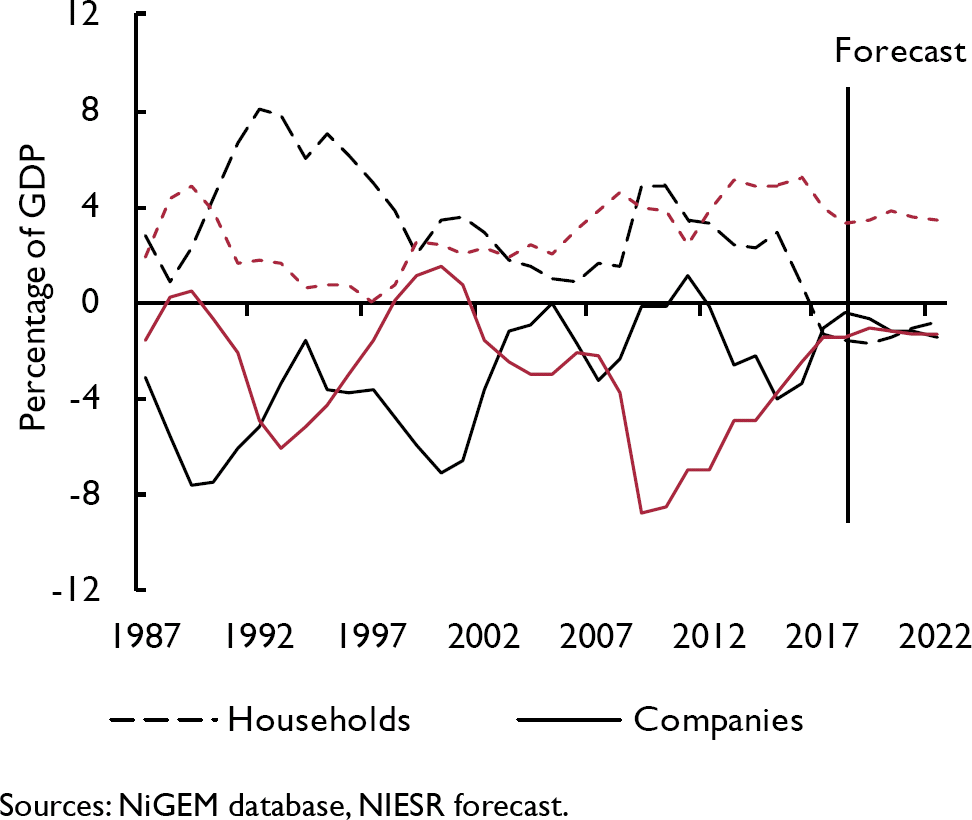
Household
The ONS has revised lower its estimate of wages and salaries and as a result, the household saving estimate for 2017 was revised downwards. According to the latest vintage of data, household saving was just 3 per cent of GDP in 2017, which is the lowest on record.
In the first quarter of 2018, household saving as a fraction of GDP remained at about the same level as in 2017. We expect households to continue to favour consuming over saving in 2018 and 2019. Over the medium term however, we see saving as a proportion of GDP rise as real personal disposable income recovers. An important driver of the increase in saving will be the ongoing auto-enrolment into workplace pensions.
Household investment rose steadily from a trough of 3.2 per cent of GDP in 2009 to 4.3 per cent of GDP in 2017, which is similar to the pre-crisis high of 4.5 per cent in 2006–7. With demand for housing still growing strongly, we project household investment to increase in each subsequent year and to reach 5 per cent of GDP in 2022. The saving and investment positions of the household sector imply that in 2017 households required 1.3 per cent of GDP in funding from the rest of the economy. This represents the first time since at least 1987 that the household sector was a net borrower. With both household saving and investment growing slowly, we expect households to return to a near-balanced net position in the medium term.
The Brexit assumptions underpinning our forecasts
In this box we outline the Brexit-related assumptions embedded in our central forecast. The UK government published its preferred blueprint for a future relationship between the UK and EU in a White Paper on 12 July. We discuss the White Paper proposals in Box B. Suffice to say that the White Paper has done little to lift the fog of uncertainty about the future relationship and as a result our central forecast continues to assume a soft Brexit. We define ‘soft’ Brexit as: the UK and the EU maintain a very high level of access to each other's market for both goods and services, fully functioning financial markets, free movement of labour, a budgetary contribution that is broadly unchanged and a 21-month transition period after the UK exits the EU in March 2019 during which the country remains bound by regulations of the single market and customs union. Our central forecast continues to assume a soft Brexit.
The specific assumptions in our central forecast are as follows:
UK trade: As before, we assume the UK maintains a close but not frictionless trading relationship with the EU. This also reflects the Prime Minister's expectation that “people need to face up to some hard facts” and “life is going to be different”. That less comprehensive relationship is reflected by negative residuals to the export volume equation.
Productivity: The smaller degree of competition due to lower trade volumes, less investment and a potential reduction in skilled migration could drive productivity lower in the long run. Effects on labour productivity are likely to materialise only with a long lag and may be ambiguous in the short run if employment reduces as a result of Brexit. We have not explicitly introduced a Brexit-related productivity shock into our forecast, which therefore constitutes a key downside risk to our forecast.
Fiscal contributions: Regarding the UK's financial contributions to the EU budget, a payments schedule is yet to be decided. The British government has already announced that it would seek associate membership in EU agencies, which would require financial contributions to be made, in addition to payments towards the ‘divorce bill’. We have assumed that the UK continues to make contributions beyond 2020 as if it were a member of the EU.
The risk of a more pessimistic scenario remains high. In our February 2018 Review we reported estimates for a case in which negotiations fail and the UK moves to a WTO-style trading relationship on exit.Footnote 1 Our results show that this would cause a mild recession within one year and real GDP per head would be some £2,000 lower relative to our ‘soft’ Brexit case after a decade. In the May 2018 Review, Reference Erken, Hayat, Prins, Heijmerikx and de VreedeErken et al. (2018) provided a more pessimistic view: their headline result for a ‘hard’ Brexit is that cumulative GDP growth could be 18 percentage points lower by 2030 compared to a scenario in which the UK remains in the EU.Footnote 2 In this Review (Box B) we provide an analysis of a scenario that is broadly in line with the proposals outlined in the July White Paper.
Notes
1 See also Reference Dolton, Hantzsche and KaraHantzsche, A. and Kara, A. (2018), ‘Deal, or no deal? The £2,000 question’, NIESR blog, 16 February 2018.
2 Reference Erken, Hayat, Prins, Heijmerikx and de VreedeErken, H., Hayat, R., Prins, C., Heijmerikx, M. and de Vreede I. (2018), ‘Measuring the permanent costs of Brexit’, National Institute Economic Review, 244, pp. 46–55.
Corporate
On the corporate side, saving rebounded strongly in 2017, rising to 9½ per cent of GDP from 7½ per cent in 2016. This was driven by an increase in corporate profits both in manufacturing and in the oil and natural gas exploration and extraction sector. We forecast corporate saving to GDP to remain close to 9 per cent in the medium term as the headwinds from Brexit are balanced by stronger international growth. The corporate investment ratio was steady at around 10½ per cent of GDP in 2017. Conditional on a soft Brexit assumption, we forecast corporate investment to remain at about 10 per cent of GDP in the medium term, and therefore the corporate sector still to require about 1½ to 2 per cent of GDP of net financing from the rest of the economy over the same time horizon.
Government
Government sector dis-saving, which reached a peak in 2009 of around 5½ per cent of GDP, has vanished in 2016 as a result of the ongoing fiscal consolidation. We now expect saving to be steady at 1–1½ per cent of GDP from 2018 to 2022. This represents a deviation from the OBR forecast and reflects our belief that the government will slow the pace of fiscal consolidation from 2019 onwards. Government investment stayed stable in 2017 at 2½ per cent of GDP and we have maintained our estimate of 2½ per cent of GDP over the forecast horizon. As a result of reduced saving and constant investment, we now expect the government to remain in a net borrowing position of 1–1½ per cent of GDP until 2022, after having borrowed 1.4 per cent in 2017.
External
To finance the triple deficit of the household, corporate and government sectors, the domestic economy had to borrow 3.9 per cent of GDP in 2017 from the rest of the world, the lowest ratio since 2012. The current account balance is forecast to stabilise at around 3½ per cent of GDP in 2022.
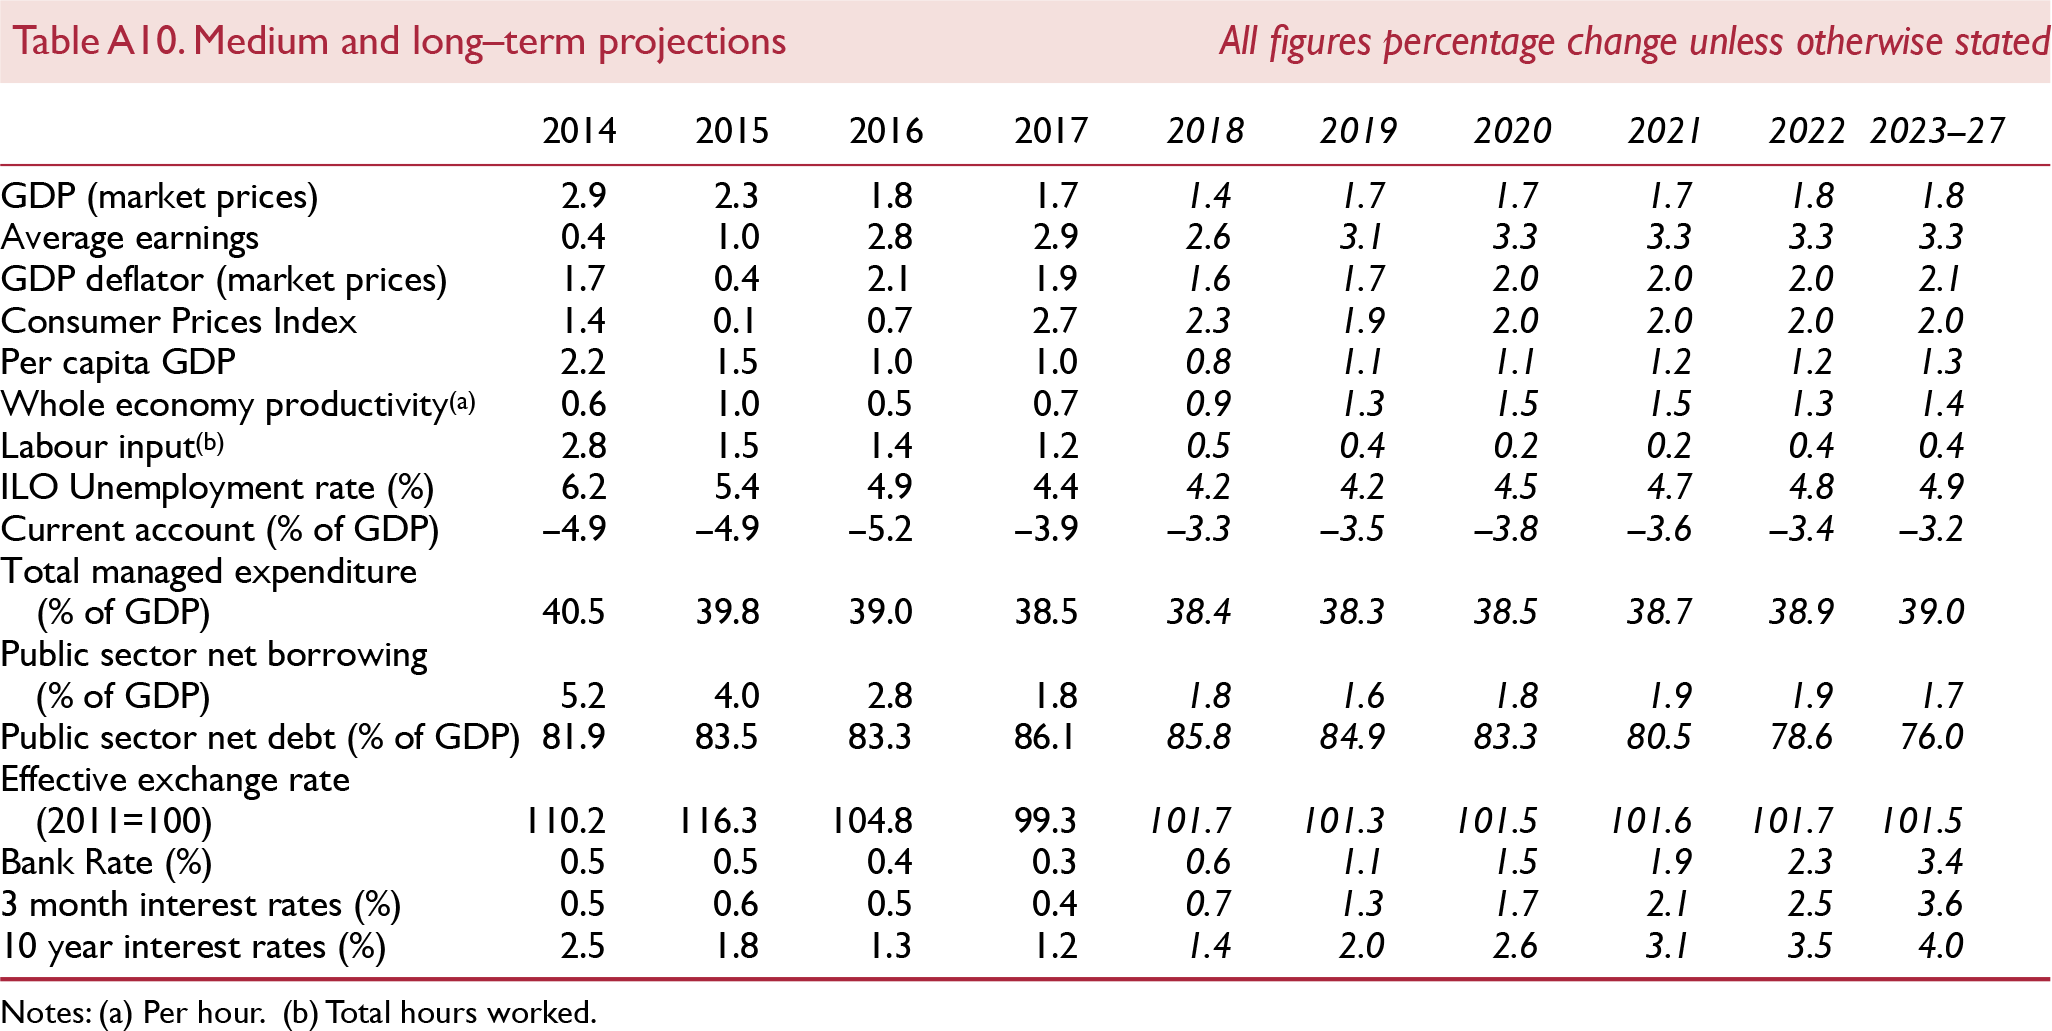
Appendix – Forecast details