

Introduction
Does it matter who exactly sits in the national government? The answer will depend not only on who is asked but also in what context that happens. In socially fairly homogeneous countries, the answer will be determined mainly by partisan considerations. In heterogenous countries, that is, in contexts marked by deep structural divisions, group membership will equally play a role (Kymlicka Reference Kymlicka1995). Indeed, one of the many ways in which states deal with multiculturalism is through grand coalitions and “proportionality as the principal standard for political representation, civil service appointments, and allocation of public funds” (Lijphart Reference Lijphart1977, 25). In other words, political stability arises also – and even in large part – because the national government includes members of the main cultural minority/-ies (Kelly Reference Kelly2019, 38ff.; Agarin and McCulloch Reference Agarin and McCulloch2020).
The main mechanism through which this happens is well known: elite members of different groups cooperate, for instance in cabinets, thereby empowering also non-elite members of these groups. In practice, the causal chain linking societal diversity to political stability is nevertheless much longer: groups must be able to choose their own representatives or at least accept them as legitimately representing them (Mueller et al. Reference Mueller, Bühlmann and Zuber2019); government inclusion must be adequate and meaningful, i.e., minority representatives must not only be present but also have and use the power to influence decisions in ways desired by them (Hänni Reference Hänni2017; Fraenkel Reference Fraenkel2020); minority group members should know of such intra-executive influence and accept it as satisfactory; and they should consequently – because of all that – mollify their political opposition to an otherwise “alien” regime (Hechter Reference Hechter2014; also Gay Reference Gay2002; Banducci et al. Reference Banducci, Donovan and Karp2004) and regard it as theirs, too.
This paper focuses on that last step and asks whether the members of specific groups behave differently when one of theirs sits in government than when this is not the case. More particularly, do group members behave more like citizens in the rest of the country when they are so included? The context chosen for empirically investigating this question is Switzerland, in general, and differences in voting behavior across all 26 cantons, in particular.
To a certain extent, Switzerland lends itself only partially well for a study on “peripheral elites in the central state’s apparatus,” which is the theme of this special issue: the whole country is a periphery, there are no real political elites, and even the term “state” is an expression reserved to the 26 cantons, not the federation. Nevertheless, there are important cultural differences between the various areas and cantons, with language (today) and religion (historically) counting among the most important markers of cultural distinctiveness. This could mean that government inclusion is more important for the voters of some cantons than others. Moreover, Swiss citizens voted in a total of 670 nationwide referendums between 1848 and February 2022,Footnote 1 and only a maximum of 7 cantons can ever be represented in the federal council (the national executive), allowing us to directly compare the voting behavior in times of government inclusion with periods of exclusion.
The next section briefly reviews two strands of the literature: those dealing with consociationalism and descriptive representation, respectively. Section three introduces the case of Switzerland, derives case-specific hypotheses, and explains how they are assessed. Section four presents the results, section five concludes with a more general discussion.
Theory: From Descriptive Inclusion to Group Integration
Although somewhat related in their primary target, the literatures on consociationalism and descriptive representation have developed in a largely independent way from one another. One reason for this might be that despite both studying group representation, the former usually centers on governments, the latter on parliaments. A second difference lies in their main dependent variable, which for “consociationalists” amounts to stability, peace, and democracy, whereas “representationists” care mainly about specific policy outputs and representatives as such. But if we accept that peace and stability are closely related to what governments do and deliver, and considering also that both governments and parliaments (as well as the courts and other institutions) each have their functions to fulfill, both strands of the literature have valuable insights to provide. The brief review provided in this section also highlights what is yet amiss in either domain: a systematic account of the political behavior of (un)represented group members themselves over a long period of time.
A key concern in the literature on representation is the (mis)match between descriptive and substantive representation. The former refers to a near-perfect reflection of societal differences in the composition of parliament, government, or any other (supposedly) representative body. It describes “being something rather than doing something” (Pitkin Reference Pitkin1967, 61). The latter, in turn, refers to the decisions taken by the representatives and asks to what extent they are in line with the preferences of the represented (Bailer et al. Reference Stefanie, Breunig, Giger and Wüst2021). In principle, the two notions of representation are distinct and thus independent from one another. However, after pointing out that descriptive representation can harm its substantive cousin, Mansbridge (Reference Mansbridge1999, 641ff.) emphasizes two main avenues through which the former might improve the latter: enhanced (vertical) communication, i.e., between group members and their representatives, and experiential (horizontal) deliberation, i.e., between minority and majority representatives. In other words, citizens belonging to a minority group might feel more confident contacting an MP or minister who is “one of theirs,” and such an MP or minister can more credibly argue for the interests of “her” group to be taken into account. Representatives from certain groups might also be better able to themselves reach out to those they represent because of shared cultural codes, residence, symbols, communication channels (e.g., social media for younger groups), language, or dialect.
Much less studied in representational studies are the effects of representation on the represented themselves, on the one hand, and how the mechanisms play out when we shift our attention to executive presence, on the other hand. Arnesen and Peters (Reference Arnesen and Peters2018, 880), for instance, show that descriptive representation enhances the general acceptance of decisions, but what about the perception of decisions taken by “selectively descriptive” bodies (Mansbridge Reference Mansbridge1999) among those selectively represented? Hänni’s (Reference Hänni2018) analysis is one of the few studies on that link: substantive representation reduces the likelihood of minorities protesting against the state of which they are part (531). Although her research design is unable to tease out whether this correlation amounts to causation, the mixed findings for mere descriptive representation go some way toward increasing our confidence in this. In fact, merely descriptive representation in parliament even has “a protest-promoting effect [implying] that the symbolic aspect of inclusion is not sufficient to accommodate minorities” (534).
So substantive parliamentary representation depends to a large extent on descriptive representation, and the former has indeed been associated with desired effects among minority groups. Banducci et al. (Reference Banducci, Donovan and Karp2004) also find that parliamentary “minority empowerment” can lead to higher turnout and feelings of political efficacy (551f.), although trust in the government remains unaffected (545f.). But what about executive membership? Of interest here is another finding by Hänni (Reference Hänni2017, 114f.): when minority groups are included in government, language rights are twice as likely to be granted, although economic discrimination increases. Yet representational studies of the executive are surprisingly rare (on women, see Homola Reference Homola2021), which is perhaps due to the fact that the core functions of governments are administration and execution, not representation and public deliberation. But if dinner is served at the executive table, this is where groups want to be seated.
This brings us to consider the second strand of the political science literature which this paper aims to contribute: consociationalism. Here, the focus has almost exclusively been on power-sharing in the executive, for two reasons. First, the core belief is that “political stability can be maintained in culturally fragmented systems if the leaders of the subcultures engage in co-operative efforts to counteract the centrifugal tendencies of cultural fragmentation” (Lijphart Reference Lijphart1971, 9). Second, given its practical and symbolic importance at the helm of the entire state, the national executive is where this cooperative effort should most fruitfully take place. Particularly if “the subcultures are geographically concentrated […] the central government is then the site for the overarching accommodation among the elites of the different subcultures” (Lijphart Reference Lijphart1971, 10; see also Kelly Reference Kelly2019, 28f.). Sometimes corporate intra-executive parity is constitutionally prescribed, as in Belgium (Popelier Reference Popelier, Keil and McCulloch2021, 101), while at other times more informal and liberal solutions are practiced (Stojanović Reference Stojanović2008, 243ff. on four multilingual Swiss cantons).
A key dilemma highlighted by the consociational literature is the perception of executive inclusion by non-elite members of the groups so included. Fraenkel (Reference Fraenkel2020, 125) puts it like this: On the one hand, “leaders of the minority group may be tempted by access to powerful portfolios, but such Faustian bargains risk threatening party links with their political bases, and/or prompting allegations of betrayal.” On the other hand, “even if both the legislature and cabinet are legally constituted proportionally, executive decision-making may still be via majority rule,” leading to merely “tokenistic power-sharing” (Fraenkel Reference Fraenkel2020, 132). The perception of how adequate minority representation is can also be moderated by political parties (Zuber Reference Zuber2015); several developments of the past decades such as mediatization, personalization and globalization have further challenged the link between the represented and the representing (Bühlmann and Fivaz Reference Bühlmann, Fivaz, Bühlmann and Fivaz2016, 2).
But whereas “representationists” care mainly about specific policy outputs within established democracies – for instance, enhanced language rights (Hänni Reference Hänni2017) or delivering on gender equality (Homola Reference Homola2021) – for “consociationalists” what is at stake is nothing less than stability, peace, and democracy. What started as a description of a few small West-European countries has become one of the main prescriptions for post-conflict societies worldwide (McCulloch Reference McCulloch, Keil and McCulloch2021; Kelly Reference Kelly2019; Bogaards et al. Reference Bogaards, Helms and Lijphart2019). For the real goal of consociationalism is integration writ large, defined by Deutsch (Reference Deutsch1953, 33) as “the attainment of a sense of community […] sufficiently strong and widespread to assure peaceful change” within a society (cf. also Lijphart Reference Lijphart1971, 3f.). Ideally, political integration allows minority members to feel both valued as a specific group but also be accepted as full and equal members of the overall polity (Kymlicka Reference Kymlicka1995). While consociationalism may not be the only way to achieve such integration, it is one of the main paths. Indeed, “to build democracy in divided societies” (Stojanović Reference Stojanović2020, 30) is its raison d’être.
There are thus two main contributions this study aims to make, both of which speak to the literatures just reviewed:
-
1. What is the effect of government inclusion on the behavior of groups with which executive power is so shared? To fulfill its promises from a consociational perspective, executive power-sharing should be more than just “tokenistic” (Fraenkel Reference Fraenkel2020). Representational studies, in turn, push us to consider not only the perceptions of group members but also their political behavior.
-
2. How can we tell a specific group to have become more or less politically integrated, particularly over a long period of time and beneath the radar of all-out war or successful secessions? For it is not just any type of behavior that is desired by consociationalism; rather, the divide in deeply divided societies should ultimately become less deep (Stojanović Reference Stojanović2020, 32f.). In paraphrasing representational scholarship, we would want groups to be integrated not just descriptively but also substantively.
Accordingly, the next section proposes different indicators to assess the degree to which a particular group can be said to be politically integrated or segregated. In so doing, the focus is on the impact of government inclusion on territorial groups, although the reflections put forward might equally be applied to non-territorial groups (e.g., women or citizens with a migration background).
Helvetia: Terra Nullius or Res Communis?
This section explains why Switzerland, in general, and cantonal membership in the federal executive, in particular, are chosen for closer scrutiny. Also, the use of referendum results to assess political integration is justified, and specific hypotheses are developed.
The Swiss Government and Its Cantons
Switzerland is widely known for the successful integration of its (historic) linguistic and religious minorities. The three main national languages are German, French, and Italian, currently spoken by 72%, 24%, and 6% of Swiss citizens, respectively (BFS 2021a), whereas Catholicism and Protestantism have both been widely present since the Reformation.Footnote 2 Two institutions in particular have facilitated the unification of Swiss society: federalism and consociationalism (Steiner Reference Steiner1981 and Reference Steiner2002; Linder and Mueller Reference Linder and Mueller2021). While the former rests on territorial boundaries and spatial identity, the latter operates via community-based affiliation and recognition. Care has been taken to ensure that next to safeguarding regional and group autonomy, representation and inclusion at central level are proportionally distributed too. With seven – at least on paper – equally powerful members of government called “Federal Council” (Bundesrat/Conseil fédéral), the Swiss system offers an almost ideal venue to provide both the different groups and territories with a share of central executive power without, in principle, privileging the one over the other. This forms a stark contrast not only to presidential (Linz Reference Linz1990) but also Westminster-type majoritarianism (Lijphart Reference Lijphart2012), although of course there are other ways to practice inter-elite cooperation than a formally constituted grand coalition (Lijphart Reference Lijphart1971, 10).
Since 1848, when modern Switzerland was founded, the Federal Council has been composed of seven persons who, in principle, can be chosen from among all of the currently 5.4 million Swiss citizens with the right to vote in federal matters (BFS 2021b). Each of the seven directs one ministry or “department,” possesses the exact same voting rights in the plenary (whose proceedings are secret), and is elected in a separate vote by the two chambers of parliament united in common session (Vatter Reference Vatter2020b, 219ff.). Governmental elections take place every four years, right after parliament has been renewed. It is customary to reelect ministers who present themselves anew: since 1848, only four ministers have not been reelected despite wanting to continue (Vatter Reference Vatter2020b, 78f.).
The Federal Constitution (1999) specifies several specific but only one general rule and otherwise leaves it to parliament to interpret and apply those rules in each specific government elections (see also Stojanović Reference Stojanović2016). Specificities cover the number, electoral body, term of office, and eligibility of Federal Councilors (Art. 175.1–3); the generality refers to the fact that care must be taken to ensure that the various geographical and language regions of the country are appropriately represented (Art. 175.4). The Parliament Act (2002) further specifies the details of the electoral system: secret ballot (Art. 130.1), simple majority on the basis of all valid votes (Art. 130.2), one vote per member of parliament (Art. 132.2), and exclusion rules if more than one round is necessary (Art. 132.3+4). Other than that, MPs are free to choose whomever they wish.
What matters for our purposes here is power sharing, as the goal, and proportionality, as the means to achieve it. In this way, the party composition of the Council has evolved from seven liberals, back in 1848, through the gradual inclusion of Catholics and farmers between 1891 and 1929, to finally the sharing of executive power also with the Socialists, uninterruptedly since 1959 (Vatter Reference Vatter2020a, 205). But while religious attributes have largely lost their importance with the gradual secularization and modernization of society, territory and language have remained unchanged in needing to be satisfied alongside party proportionality. In fact, while the Federal Council has become broadly inclusive of Swiss society in terms of political parties only after 1959, it has always been at least bilingual and often trilingual (Giudici and Stojanović Reference Stojanović2016, 297). Moreover, right since the start the territorial or, more specifically, the cantonal origin of Federal Councilors has also been a crucial aspect of electoral and, by implication, representational concerns.
To fully appreciate why cantons matter, we need to take a brief detour into the history and operation of Swiss federalism (for a fuller account, see Vatter Reference Vatter2018). What started as a defense compact among several de facto sovereign cities and rural communities in the Middle Ages came to an abrupt end after the French invasion in 1798. Yet after several years of failing to operate in a centralized fashion, the old confederal order was reestablished in 1815. Even the birth of modern Switzerland in 1848 did not abolish the (then 25) cantons but nationalized only what was necessary to ensure a common economic space (e.g., currency and tariffs; Dardanelli and Mueller Reference Dardanelli and Mueller2019). Finally, even if the subsequent 170 years were marked by a gradual increase in centralization at the expense of cantonal autonomy, the cantons remain in charge of most of implementation and especially finance (Dardanelli and Mueller Reference Dardanelli and Mueller2019). National political parties, too, are all based on cantonal parties; the cantons form the constituencies for federal parliamentary elections; and to amend the Swiss constitution, a majority of both voters and cantons (or rather, of cantonal popular majorities) is needed.
Of course, one should not exaggerate the importance of the 26 cantons either. Switzerland is a relatively small country, and – just as elsewhere – urbanization, migration, post-materialism, and globalization have had little regard for existing territorial boundaries. Moreover, cultural communities largely transcend cantonal borders, with French the (co-)official language in 7 cantons, German in 21, and Italian in 2 (4 cantons are plurilingual). However, none of the 4 language groups has its own exclusive political organization, all the main parties are multilingual, and there are important historical, religious and economic differences also within the language groups. For instance, in 2002 citizens of both Vaud and Geneva overwhelmingly rejected the idea of merging these 2 French-speaking cantons (APS 2002), while in 2013 voters of the French-speaking Bernese Jura district (again) refused to join the equally francophone Jura canton (Siroky et al. Reference Siroky, Mueller and Hechter2017).Footnote 3 Finally, unlike language or other cultural communities, each of the 26 cantons has its own constitution, directly elected government and parliament, court system, police force, education system, and, last but not least, the power to decide on its own official language(s) and regulate religious affairs.
The cantonal origin of Federal Councilors has been so important, and representational concerns so salient, that in 1848 one of the few formal quotas introduced into the constitution specified that a canton could not “have” more than one member of government at the same time.Footnote 4 That provision was abolished only in 1999 on the initiative of parliament after six years of debating and a popular vote in which 75% of voters, and all but two cantons (Valais and Jura) consented (Swissvotes 2022). Accordingly, while the canton of Berne could “send” a representative without interruption between November 1848 and December 1979, it remained excluded until December 1987 and then again between January 2009 and November 2010 – whereupon it had two councilors until December 2018, in exchange. The only other canton to have had two members of government at the same time is Zurich: without government presence only between January 1989 and November 1995, it made up for this temporary exclusion by sending two members between January 2004 and December 2007 as well as from January 2009 to October 2010 (Giudici and Stojanović Reference Stojanović2016 and own updates).
Nevertheless, while the number seven and the parity that comes with it are obviously better suited to proportional accommodation than a single presidential or prime-ministerial office, the risk of excluding some groups and/or territories persists. Unlike for the European Union’s Commission, for example, there are simply more member states than seats. Moreover, ever since its creation in 1848, despite the formal freedom of choice, members of the Swiss government have had to more or less informally comply with several criteria, notably religion, language, region, party, and, since 1971 – when women were finally granted the right to vote and be elected – also gender (Giudici and Stojanović Reference Stojanović2016). For some groups, notably Italian-speaking Swiss, the occasional and protracted lack of representation in the collegial government can thus cause feelings of exclusion and neglect.
In turn, even when specific groups or cantons are included, it remains an open question whether such representation also furthers their influence and/or integration. Each canton has its own history, tradition, party system, political elite, economic structure, and so on, which are unlikely to change, for better or worse, just because one of theirs sits in the central government. The Swiss government, in being collegial, not only provides each member of government with more power than ordinary cabinet members in other system, but it also provides them with less. While a single minster may well have more autonomy in deciding policies falling into her domain, by convention consensus is sought within the Federal Council (Vatter Reference Vatter2020b, 236ff.). Moreover, approval of parliament is by no means guaranteed; for constitutional changes a popular vote is mandatory, and contentious parliamentary acts can equally be stopped in an optional referendum. Neither the government nor parliament always has the final word – with the somewhat paradoxical result that the steering and coordinating function of the executive becomes even more important (Linder and Mueller Reference Linder and Mueller2021, 175).
Assessing Political Integration
The main hypothesis tested here is that the inclusion into the federal government of a person from a specific canton leads to the political integration of citizens living in that canton. The availability of close to 700 referendum results over more than 170 years allows for creating different measures of political integration. Each puts the political behavior of cantonal citizens in relation to the rest of Switzerland. Integration is mainly conceived of as greater similarity. The question can thus be reformulated as follows: does federal government inclusion bring a cantonal electorate more in line with their co-nationals in terms of whether and how to vote?
We can imagine several mechanisms and outcomes. First, having one of theirs sit in the government could lead cantonal citizens to identify more with that government than would otherwise be the case. Instead of “alien rule” (Hechter Reference Hechter2014), government inclusion would seem to ensure that the views and preferences of cantonal citizens are adequately voiced where it matters: at the heart of federal governance. Consequently, the executive council should be more likely to cater to cantonal interests, which in turn should be appreciated by cantonal citizens. At the same time, having one of theirs among the seven cabinet members can raise the attention paid to national politics. One’s own members of government will be better known in a canton since still today most national politicians begin their career locally to then work their way up, via cantonal and/or federal parliamentary mandates. Their election to the Federal Council is also typically celebrated in their home village and canton. Both a higher identification with the national government and greater awareness of an upcoming vote – which is set by the government – could thus manifest in higher aggerate turnout at cantonal level as particularly less frequent voters might be drawn to the polls. Hence,
H1a: A canton produces higher turnout in federal votes when it has Federal Council representation than when it does not.
However, what matters from an integrationist perspective is less the absolute level of political participation but rather differences to the rest of the country. Whereas executive exclusion might drive people to the polls in a sign of protest or keep them away as they feel alienated (or both), inclusion could also simply bring aggregate participation in line with the rest of the country. Thus,
H1b: A canton produces a lower turnout differential in federal votes compared to the rest of Switzerland when it has Federal Council representation than when it does not.
Second, ahead of every popular vote, government members talk to the press and appear in other events to defend the official position, recommending either a “yes” or a “no” in answer to every referendum question (Trechsel and Sciarini Reference Trechsel and Sciarini1998, 101ff.; Jaquet et al. Reference Jaquet, Sciarini and Gava2022). To be sure, the government’s position is defined by parliament, with both chambers having to agree on the recommendation – and the recommendation is generally “no” for popular initiatives and “yes” for optional and mandatory referendums. Also, there usually is just one member of government appearing publicly, namely the one in charge of the ministry in whose domain a referendum question falls. Nevertheless, the visibility of executive members overall is much higher than of MPs, and members of government appear publicly all the time. Also, every canton has at least two federal MPs and five cantonal ministers, further underlining the singularity of having a federal minister. It can thus be assumed that citizens will have more trust in a government that includes one of theirs, especially if speaking their language or particular Swiss-German dialect.Footnote 5 This could translate into government support. Hence,
H2: A canton is more likely to vote like the government recommends when it has Federal Council representation than when it does not.
Third, government representation as theorized above is not a one-way street, or at least is not thought of and sold as such. Indeed, there is usually a reason why representatives of this or that group are included: to carry the views, values, and worries of their members into government and thus shape central decisions along specific preferences and priorities. Given that the Council subsequently tries to convince first the federal parliament and then also the whole of Switzerland to vote this or that way, another effect of government inclusion could be a closer match between a canton and the rest of Switzerland. A government minister from a certain canton could also better bring its citizens into the national fold, for the above-mentioned reasons of communicative ease and greater trust (Mansbridge Reference Mansbridge1999, 641ff.; Trechsel and Sciarini Reference Trechsel and Sciarini1998, 116). Hence,
H3: A canton is more likely to vote like the rest of Switzerland, i.e., it has a smaller approval differential when it has Federal Council representation than when it does not.
The fourth hypothesis deals with yet another indicator of integration: losing or winning. Cantons or groups that are constantly on the losing side are more likely to feel excluded; indeed, perhaps the main reasons for adopting a non-majoritarian political system are precisely demographic imbalances between cultural segments. Conversely, to the extent that even cultural minorities end up on the winning side of a priori majoritarian devices such as referendums can be thought a sign of their successful integration. Partly because of greater trust, partly out of (the belief of) having their preferences accommodated through “their” member of government, then, defeats could become less numerous. For a corollary of lower approval differentials (H3) is that eventually it reaches 0; in other words:
H4: A canton is less likely to lose when it has Federal Council representation than when it does not.
Finally, all these hypotheses could be particularly true for minority groups and cantons. It is for them that non-majoritarian devices such as intra-executive power-sharing and optional referendums were developed, and it is they who will be the most sensitive to inclusion and exclusion. Hence,
H5: The observed inclusion/exclusion effects will be greater in minority than in majority cantons.
Data and Method
To assess whether the (non-)inclusion into central government of cantonal representatives is associated with differences in voting behavior at cantonal level, this article makes use of the – next to consociationalism and federalism – third Swiss peculiarity: direct democracy, which gives citizens ample opportunities to bindingly decide specific policy questions. More precisely, I assess the extent to which cantonal citizens vote differently when one of theirs sits in the central government. The data assembled cover all 670 popular votes held between 1848 and February 2022 and the cantonal origin of all 119 Federal Minsters that served in that same period. Covered are thus 198 obligatory referendums (in existence since 1848), 202 facultative referendums (1874–), 228 popular initiatives, and 42 direct counterproposals to such initiatives (both 1891–) (see also Table A1 in the Annex).
While all four types of referendums constitute important elements of overall Swiss direct democracy, their underlying logics and success rates differ (see, more generally, Linder and Mueller Reference Linder and Mueller2021, chp. 4). The obligatory referendum concerns proposals by parliament, usually initiated by the government, to change the Federal Constitution. To be approved, a majority of voting people and cantons must be in favor. In total, 75% of such proposals were accepted. For the facultative referendum, roles are somewhat reversed: parliamentary bills enter into force unless they are successfully challenged via the facultative referendum. Of all the instances analyzed here, 43% of the bills were eventually rejected by the people. Popular initiatives again relate to constitutional change, but rather than waiting for the government a group of citizens can itself specify the type of change it seeks. The success rate of the initiative, however, is very low: only 25, or 11% of all initiatives ever voted, were accepted by the people and cantons. Finally, the counterproposal allows parliament to react to an initiative in the hope that it is either withdrawn or rejected at the polls in favor of a more moderate measure. In fact, 62% of counterproposals were accepted.Footnote 6
Governmental representation by canton is equally varied. Five cantons have never ever had one of theirs sitting in government: next to French-speaking Jura (created only in 1979), that is also the case for German-speaking Schaffhausen, Uri, Schwyz, and Nidwalden. Ironically, the latter three constitute the historic-mythological heart of Switzerland. Other cantons can look at tens of thousands of days during which they were included in the central executive: Zurich (60,591 days; or 166 years out of 174) and Bern (163 years) lead the ranking as of March 1, 2022 if we discount double tenures. Despite the mentioned structural, historical, and cultural differences, however, population size today strongly correlates with governmental presence overall.Footnote 7
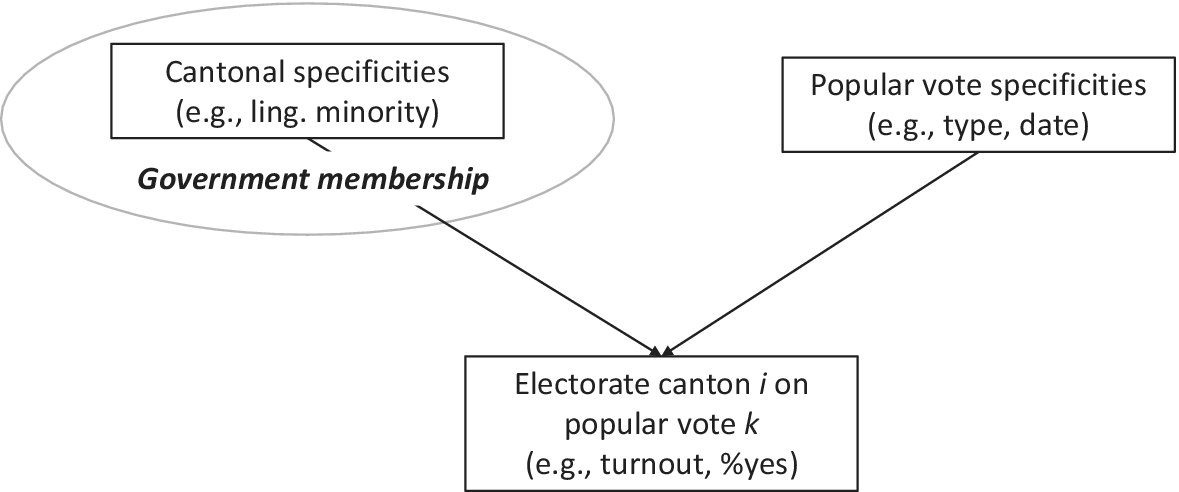
To assess the statistical effect of government inclusion on cantonal turnout, vote choice, voting with the authorities, and winning, I model multilevel regressions using cantonal and vote properties at level 2 (Figure 1). In other words, cantonal voting behavior is nested within cantons and specific votes, but the latter two are independent from each other (Gelman and Hill Reference Gelman and Hill2007, 289ff.; also Jaquet et al. Reference Jaquet, Sciarini and Gava2022 for a similar approach). The main independent variable of interest, federal government membership, is also located at level 2 since it pertains to cantons. Multilevel models offer a compromise between complete pooling (which ignores variation between cantons and votes) and no pooling (which ignores it through separate models for each canton or vote) (Jaquet et al. Reference Jaquet, Sciarini and Gava2022, 253 and 279). I model random intercepts at the level of cantons and votes because basic levels of turnout, for instance, could be inherently different across cantons. Models were estimated in R using the lme4-package (Bates et al. Reference Bates, Mächler, Bolker and Walker2015), tables and plots were generated using the sjPlot-package (Lüdecke Reference Lüdecke2021).
Data structure.
The unit of analysis is thus always a single federal referendum question in a single canton that could be answered with either “yes” or “no.” The independent variable captures whether a canton was represented in the Federal Council when the referendum took place. If so, the inclusion dummy takes on the value of 1, and 0 otherwise. Data on the voting behavior of citizens grouped by the canton in which they resided come from Swissvotes (2022), information on the duration and cantonal origin of members of government from Giudici and Stojanović (Reference Stojanović2016/2019 plus own updates).
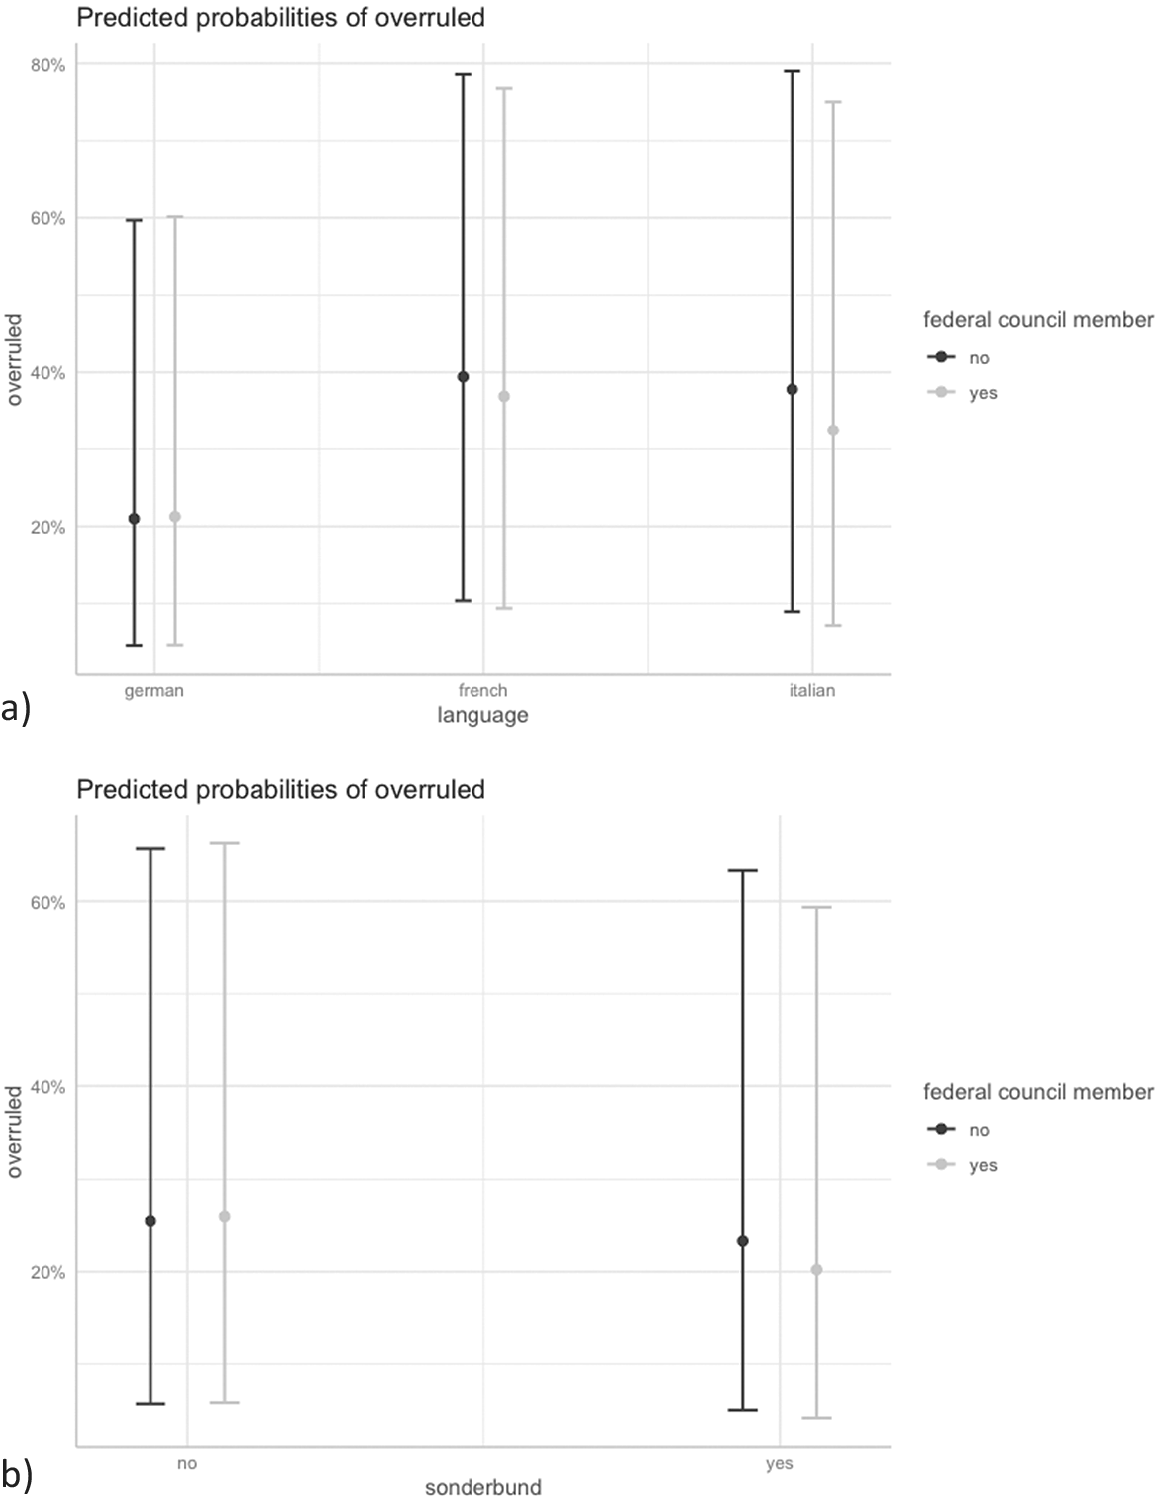
The dependent variables measure participation and vote choice in five different ways. For H1a, cantonal turnout is calculated as the share of valid votes on a referendum question from all those with the right to vote at that time. For H1b, turnout differential assesses the difference between cantonal turnout and turnout in the rest of Switzerland (excluding the canton concerned). Positive numbers denote higher, negative numbers lower cantonal turnout. For H3, approval differential expresses the extent to which a canton voted differently from the rest of Switzerland (again excluding the respective canton). To control for the actual preferences, I calculate absolute differences between the yes-shares. Furthermore, two dummy variables capture whether a cantonal majority voted in line with the official recommendation, as per H2 (voting officially: 1 if yes, 0 otherwise), and whether a cantonal majority was eventually overruled, as per H4 (overruled: 1 if yes, 0 otherwise). Overruling means the bill or constitutional amendment passes but is rejected in a canton or vice versa.
Because the hypothesized effects are expected to be particularly strong for minority cantons (H5) and in line with the overall theme of this special issue, I include two additional variables at the level of cantons: A factor variable assessing whether a canton belongs to the linguistic minorities, French (GE, VD, NE, JU, FR and VS) or Italian (TI); and a dummy capturing former members of the Sonderbund, i.e., the (Catholic-rural) losers of the civil war of 1847 (UR, SZ, OW, NW, LU, ZG, FR and VS). Both will be interacted with government inclusion.
As controls, several variables at referendum-level can be thought to influence the results. First, the type of the vote is included, with the four possibilities as explained above. Overall expected support before a vote is assessed through the share of yes-votes in the National Council (the lower, popular chamber). A third control variable measures time through the year in which a referendum took place. Alternatively, I specify five different periods that correspond to broad phases in Swiss politics (adapted from Vatter Reference Vatter2020a, chps. 3 and 12): 1848–91, 1892–1919, 1920–59, 1960–92, and 1993–. The final indicator – consensus – is a dummy taking on the value of 1 if the four main national parties (Socialists, Liberal, Christian-Democrats/Centre and Swiss People’s Party) issued the same voting recommendation, and 0 otherwise. It can be thought of to assess disputedness. Because not all the data for all the variables are always available, the final N oscillates across models (see Table A1 for descriptive statistics).
Results: The Statistical Effect of Government Inclusion on Cantonal Voting Behavior
Turnout
Is turnout higher and are turnout differentials lower in times of executive representation? Table A2 provides the results for three models, the first specifying only random intercepts at vote and canton level, the second and third interacting government presence with linguistic (French and Italian) and religious (former Sonderbund members) peripherality, respectively. Figure 2a shows the very limited effect of federal government inclusion on cantonal turnout, in general. However, Figure 2c shows a positive effect of government inclusion in French-speaking cantons, a negative one for Italian-speaking Ticino, and no effect across German-speaking majority cantons. Since the confidence intervals overlap to a large degree, we should not read too much into these figures, although what is analyzed here is the totality of cases, not a mere sample (cf. also Kobi Reference Kobi2000, 18).
Coefficient and marginal effects plots for cantonal turnout.
Note: plot a) based on Model 1, b) on Model 2 of Table A2; 90% confidence intervals.
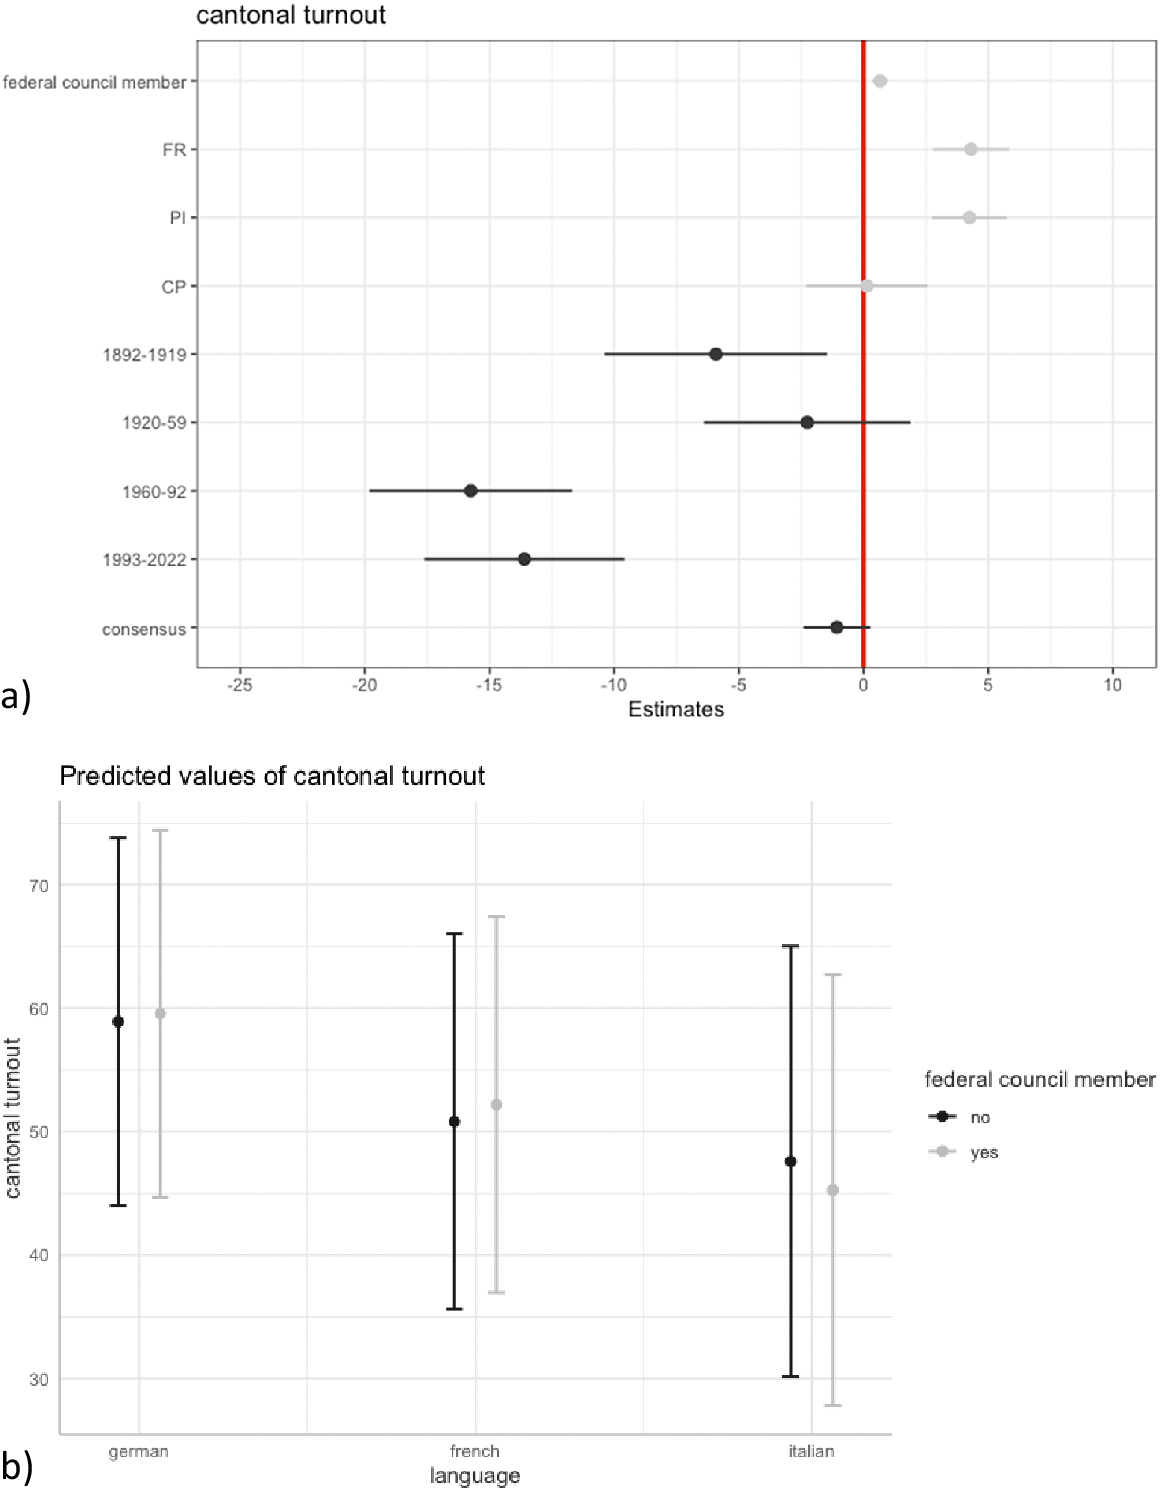
Results for turnout differentials are by and large identical (Table A2): Government inclusion pulls participation in the French-speaking cantons closer to the rest of Switzerland, from −6.6 percentage points to −5.2, but increases the gap in Italian-speaking Ticino, from −9.9 to −12.4, on average (not shown).
Voting with the Authorities
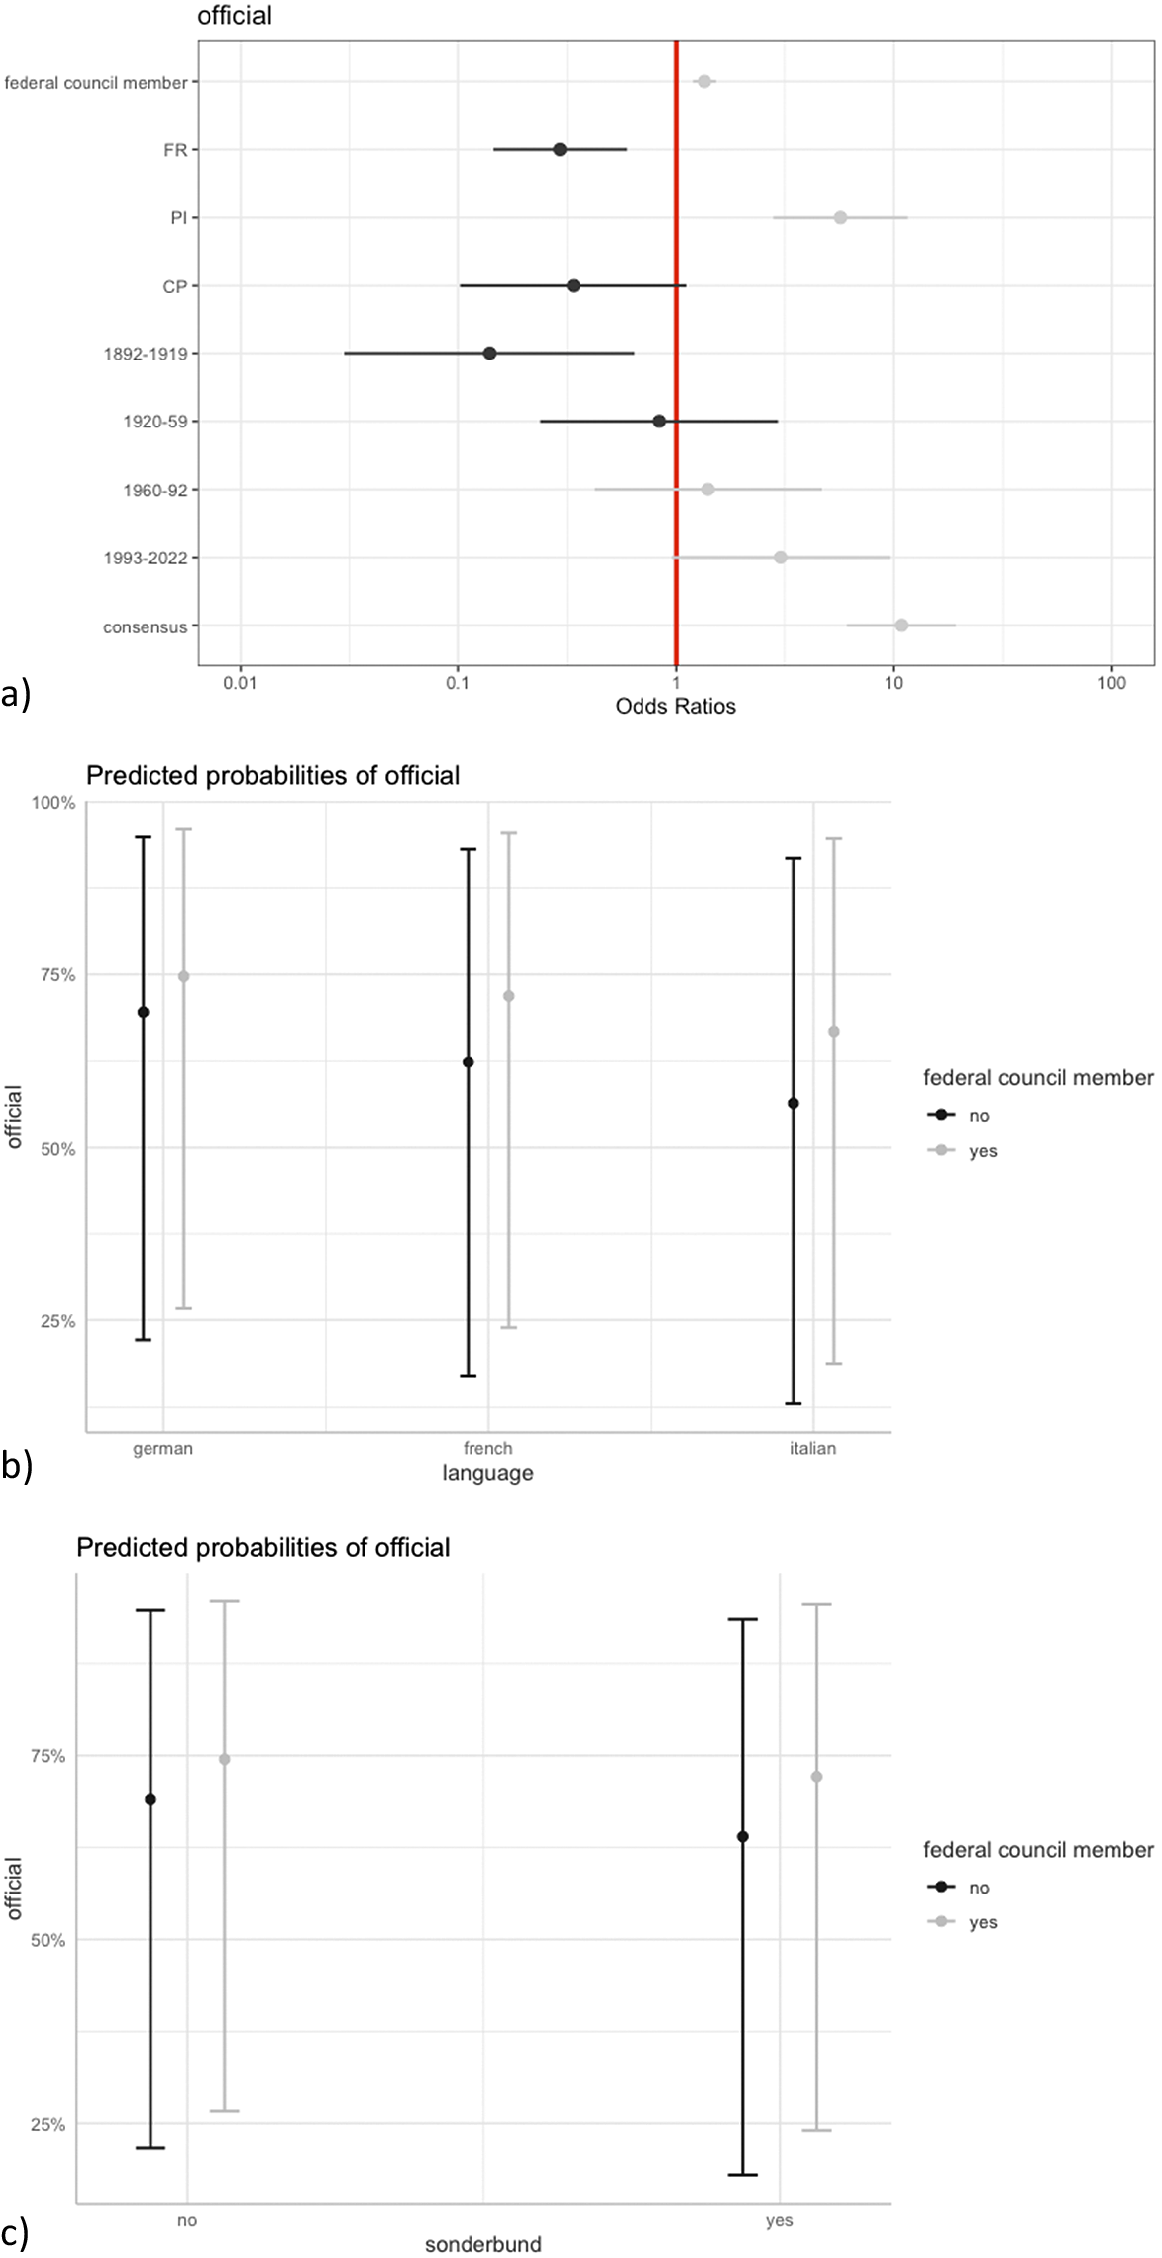
The second hypothesis asks us to assess whether embracing the official position is more likely when a canton has federal government representation. Since the dependent variable is now binary, I run multilevel logit models with the same predictors as before (Table A4). Figure 3a plots the resulting coefficients, showing how falling into the official line is associated with (major) party consensus, the fact of voting on (and mostly rejecting) popular initiatives, but also cantonal government presence. The effect is biggest for French- and Italian-speaking cantons (Figure 3b), but also former Sonderbund members have a somewhat greater likelihood to vote as recommended when present in the federal executive.
Coefficient and marginal effects plots for cantonal voting as recommended.
Note: plot a) based on Model 1, b) on Model 2, and c) on Model 3 of Table A4; 90% confidence intervals.
Note that over time all the cantonal majorities have increasingly voted as recommended: since 1975, some 75% of cantons have returned government-supporting majorities, compared to fewer than half before 1900. But whether particularly faithful cantons such as Zurich and Bern are rewarded with a seat at the government table, whether the latter leads to the former, as hypothesized here, or whether another factor – size, location, history, dominant language, or a combination thereof – is responsible for the observed statistical association we cannot pursue further here. The fact is the two most “rebellious” cantons, Jura and Schwyz, have never had one of theirs sit at that federal executive table.
Voting to Win
The final two dimensions of the analyses relate to winning: does government inclusion reduce differences in the approval rate vis-à-vis the rest of the country and/or lead to fewer instances of being overruled? Table A5 provides the results for being overruled, where no significant coefficient obtains for government presence across all cantons. However, both French- and Italian-speaking cantons are somewhat less likely to be overruled when represented, although still almost double than German-speaking ones (Figure 4a) – Swiss consociationalism and successful political integration notwithstanding. The same is true for former Sonderbund members (Figure 4b).
Marginal effects plots for cantonal losing by language groups.
Note: plot a) based on Model 2, b) on Model 3 of Table A5; 90% confidence intervals.
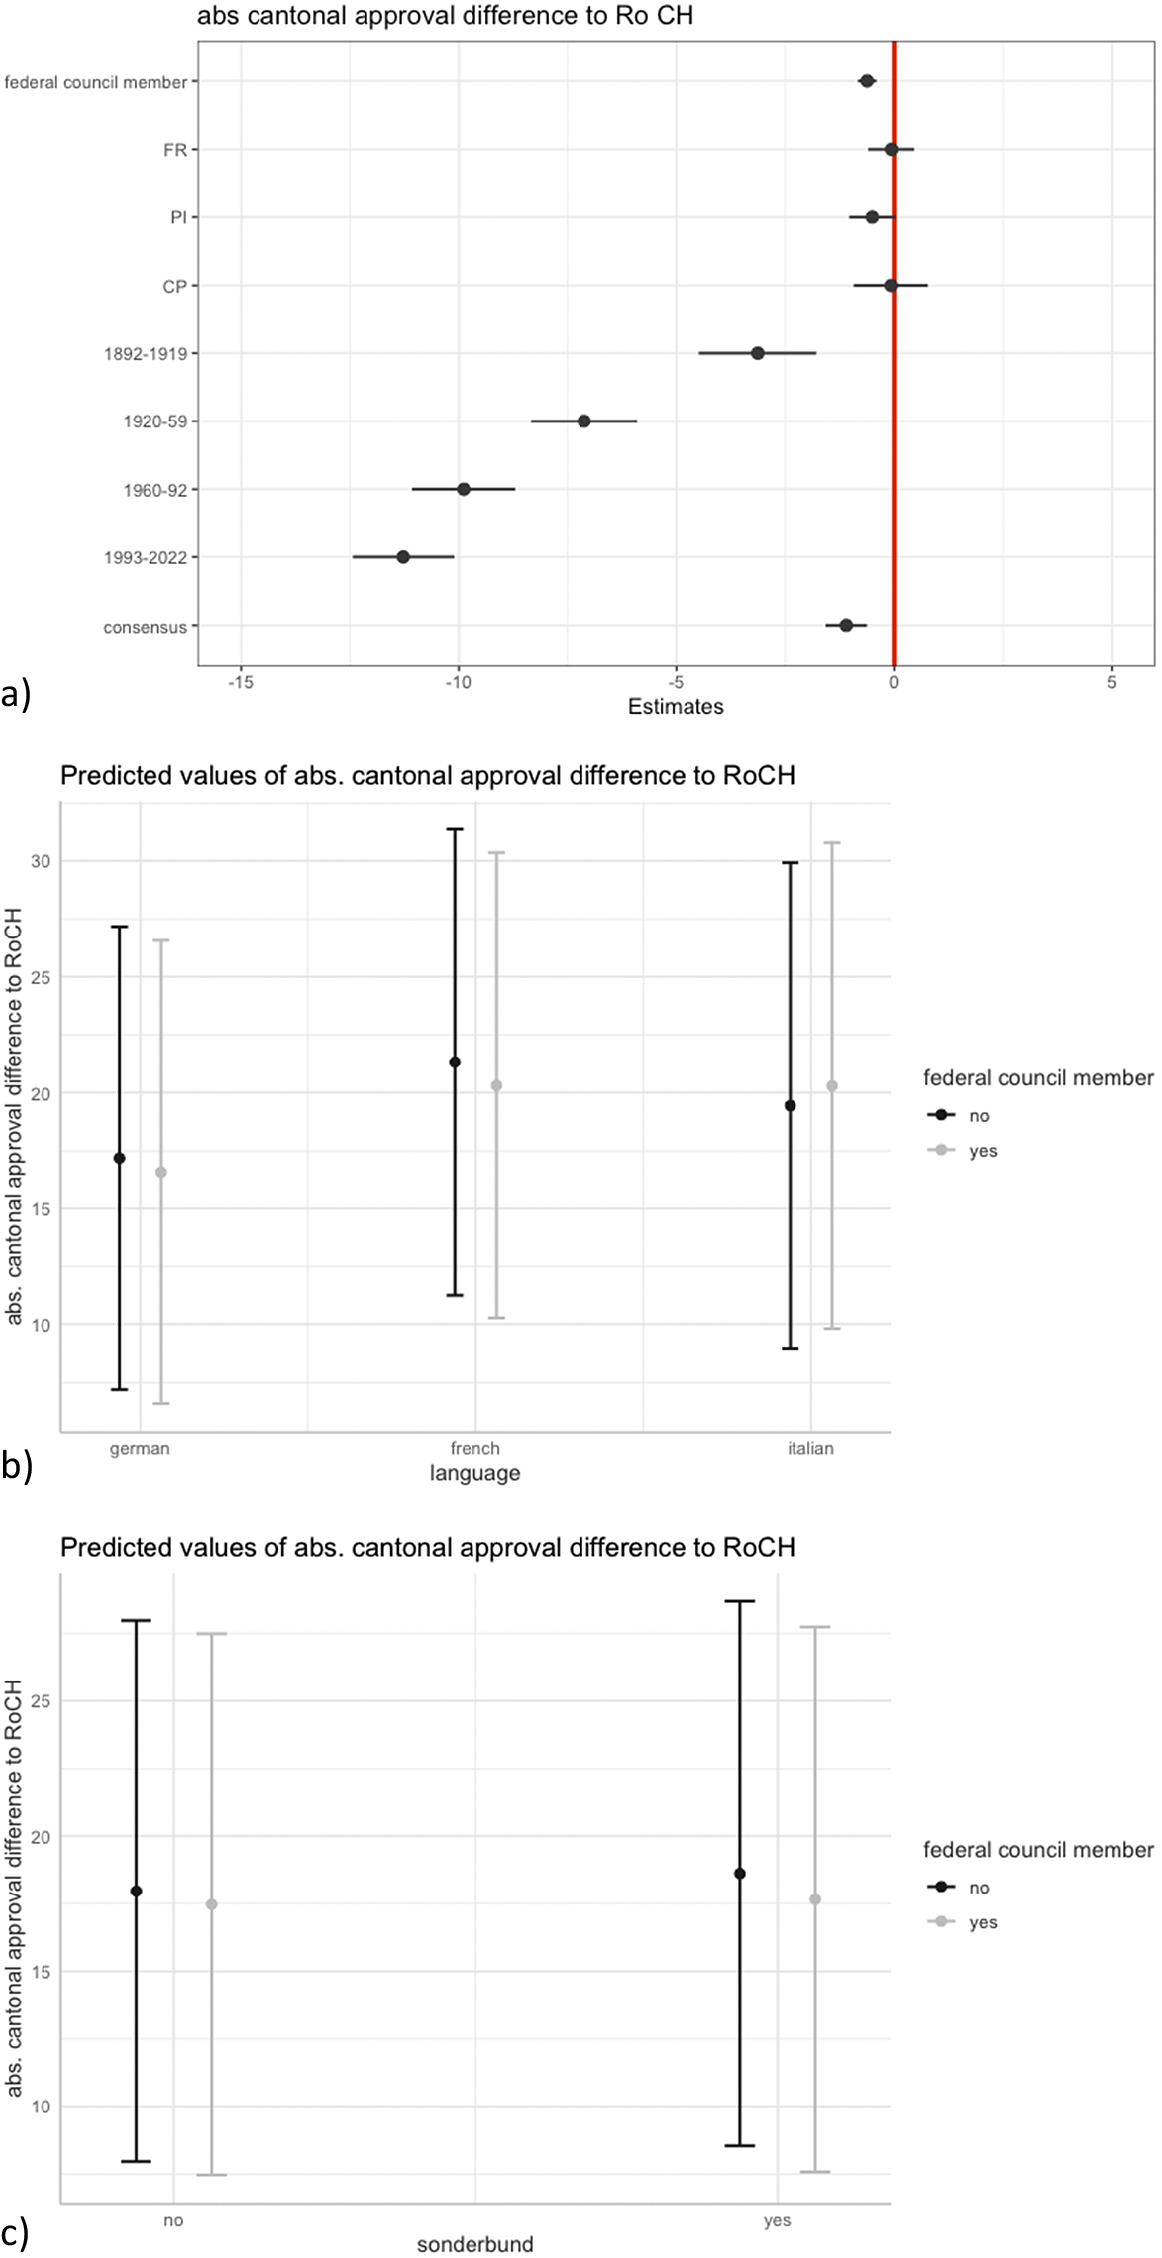
However, government presence is indeed associated with a lower cantonal approval differential towards the rest of Switzerland, as shown in Figure 5 (see Table A5 for full results). Again, both the magnitude and the direction of the effect vary across minority and majority cantons, although remaining modest in size. The period dummies confirm that a) over time all the cantons have become more alike in their voting behavior and b) party consensus and especially popular initiatives serve as “unifiers.”
Coefficient and marginal effects plots for cantonal approval differentials.
Note: plot a) based on Model 1, b) on Model 2, and c) on Model 3 of Table A6; 90% confidence intervals.
Robustness Checks
Three types of robustness checks were run.Footnote 8 First, if instead of periods I use the year in which popular votes took place as a (now linear) control, the substantive results do not change. That year variable itself is in fact always significant, resulting in positive (turnout differences, voting as recommended) or negative (cantonal turnout as such, being overruled, approval differences) coefficients or effect sizes in terms of likelihood. This shows the importance of taking the time dimension seriously.
Second, the degree of support in the National Council for a proposal later voted by the people is yet another control variable. It was omitted from the full models displayed above because of multicollinearity issues – popular initiatives are almost always overwhelmingly rejected (mean support: 27%), government proposals by definition receive support by at least a majority (mean support for mandatory referendums: 86%). Proposals on which all major parties issued the same “consensual” recommendation equally enjoy much greater support (77% vs. 58%, on average). Nevertheless, using approval in the National Council instead of the consensus-indicator again does not change the substance of the results (but VIFs rise to 4.6). The degree of support in the National Council itself is never significant.
Third and finally, I have also estimated the exact same multilevel models as displayed here but without the five cantons that have never had a government minister. While specifying cantons as their own level already takes this circumstance into consideration, results could still be biased. Again, however, results are virtually identical.
Conclusion
Switzerland is a peculiar country in that it combines consociationalism with federalism and direct democracy. Its central government, the Federal Council, is elected using majority rules, with the two chambers of parliament sitting in joint session acting as the electorate. Because German-speaking MPs constitute almost a three-quarter majority in both houses (Vatter Reference Vatter2020a, 330), they could easily impose an all-German executive on their French-, Italian- and Romansh-speaking co-citizens. However, right since the start of Switzerland’s history as a modern federation in 1848, the Council has always been at least bi-, often tri-, and in 1917–1918 even quadrilingual and with a non-German speaking majority (own calculations based on Giudici and Stojanović Reference Stojanović2016 and Reference Giudici and Stojanović2019; see also Stojanović Reference Stojanović2021). Peripheral elites have always found a seat at the executive table – possibly owing to the fact that the whole country is one big periphery, composed of the linguistic “leftovers” of the three big nation-states surrounding it: France, Germany, and Italy.
The fact that not only in the Federal Council but also in the federal administration, extra-parliamentary committees, and in the Federal Supreme Court the four language groups are more or less proportionally represented (Linder and Mueller Reference Linder and Mueller2021, 46ff.) constitutes further evidence of consociationalism along Lijphart’s (Reference Lijphart1977) seminal definition (cf. also Lijphart Reference Lijphart2012). Yet, while federalism is responsible for securing group autonomy, self-rule is allocated on purely territorial grounds. On some questions the differences within the French-speaking camp are as large as or even greater than those vis-à-vis the German-speaking cantons. That is one of the reasons why central government representation has until this day retained a strong cantonal dimension alongside cultural and party-political characteristics, as well as, since the 1970s, gender. Only 5 out of 26 cantons have never been able to “send” one of theirs into the Federal Council, whose seven members enjoy perfectly equal powers.
The question posed in this article centered on the effects of precisely such central government inclusion: is it as beneficial as one could assume given the importance that parties, politicians, pundits, but also cantonal representatives ascribe to it? And is exclusion therefore as damaging as for example one Italian-speaking Swiss politician observed when complaining that without a member from Ticino, no government member could come to his canton and talk to voters in their mother tongue?Footnote 9 Profiting from the fact that the Swiss not only regularly elect but even more frequently vote on policy questions directly, different possible consequences of government inclusion were probed in this exploratory article. The main finding can be summarized thus: government inclusion is indeed significantly associated with some of the positive effects theorized; on average, these effects are very small; but still sometimes rather stark differences result across cantons – differences that, in turn, are related mainly to language.
Hence, with government inclusion, cantonal turnout increases by about 0.7 percentage points, on average. At the same time, government inclusion most often reduces the gap between cantonal turnout and participation rates in the rest of Switzerland. Notably, French-speaking cantons are pulled “up” and closer to the rest of Switzerland. By contrast, in Italian-speaking Ticino, that gap increases from about −10 to −12 percentage, i.e., cantonal turnout seems to be pulled “down.” Federal government participation also comes with a small increase in the probability to vote as recommended, from 68% to 75%, on average. The effect is again biggest for French- and Italian-speaking cantons, raising their chances to vote as recommended from 62 to 72% and from to 56 to 67%, respectively. And while no significant coefficients emerged on being overruled, both French- and Italian-speaking cantons are marginally less likely to be overruled when represented in government, namely 39% vs. 37% and 38% vs. 32%, respectively. By contrast, German-speaking cantons stay at 21%. Finally, government membership also comes with lower cantonal approval differentials vis-à-vis the rest of Switzerland, yet again the magnitude of effect is tiny (−0.6 percentage points).
What to make of these results? Next to being a country that is in a way a periphery of its own, the Swiss political system is also largely devoid of “a” political elite. The few people that could aspire to such a role at national level are the leaders of the main political parties, Members of Parliament (in the Council of States more so than the National Council, cf. Vatter Reference Vatter2020a, 329), and the seven members of the federal government. This might explain why joining this exclusive club brings with it both benefits and downsides: As occupiers of a venerate office going back over 170 years, the cues that federal government members provide before popular votes are highly trusted and thus very effective. Yet being just one among seven also reduces the impact any one person can have in the decision-making process. Moreover, the recommendations and proposals the government makes must be approved by both houses of parliament in separate sessions, thereby further reducing executive power both within and outside the representative architecture. So executive membership might still matter, but its effect gets watered down in the partisan, cultural, economic, personal, mobilizational, and conjunctural whirlpool of daily politics.
This brings us to consider the limitations of this study, which are numerous enough to hopefully inspire further research. First, all of the above analyses have operated at the aggregate level of cantons. At least for the past few decades, one could also draw on post-vote surveys VOX and VOTO to study individuals (Kobi Reference Kobi2000; Trechsel and Sciarini Reference Trechsel and Sciarini1998). Second, some particularly interesting cantons could be chosen for a more qualitative investigation of the role and perception of government members from those cantons and/or adjacent, linguistic-geographic neighbors. Third, cantons may have remained prominent refence points in Swiss politics, serving as both springboards for national careers and arenas of national debates and referendums, but they have by no means a monopoly. Indeed, for many groups, different frames constitute the main anchors of their coordinate system, from local and city governments to macro-regions such as Western or Central Switzerland to language communities. All of the above analyses could thus be reproduced at the local level, with the ca. 2,000 municipalities all nested within a canton with or without government presence. The importance of regional and local party strength could also be taken into account, as could the ministry a government member occupies. Finally, the mobilization effect of a new member of government might be particularly high just after she has assumed office and wane off thereafter – or, in turn, take some time to develop. Hence, the timing of popular votes and the distance to when government presence was established – and/or lost – could be modeled in a more sophisticated way than here, where a static effect was assumed.
Nevertheless, insofar as the cantons remain socially and especially politically relevant units, even and above all for group identities, it is at this level that the effects of government inclusion ought to be the most significant. Cantons and their governments are functionally similar to political parties in that they recruit, aggregate, and voice the interest of their members. In other words, in Switzerland, the long chain from group recognition, governmental inclusion or representation, influence, accommodative policies and integration works above all through the cantons. This is not to say that other types of actors (political parties, trade unions, civil society organizations, and so on) or territorial frames (both above and below the cantons) are absent or without importance. Indeed, the (ongoing) mobilization in favor of an adequate political representation of women is largely detached from cantonal identities, even if some cantons were much faster in allowing women to vote and creating gender parity within their institutions. This contrast helps underlining the general message of this article: the Swiss federation itself being a peripheral creation of its cantons, these have never really had to struggle for recognition or accommodation.
In that sense, we are well advised to remember that “consociationalism is a package, not a menu, and trying to isolate the impact of its individual features comes at the risk of underestimating its joint effects” (Bogaards et al. Reference Bogaards, Helms and Lijphart2019, 349). Where the (non-)inclusion of cultural minority and majority members in a collegial executive happens against the background of proportional representation in parliament, the administration, and the courts; where strong subnational autonomy at regional and local level guards against the occasional tyranny of the majority; and where veto points are numerous and real, it should perhaps not come as a surprise that occasional exclusion does not lead to all-out disaffection and disintegration. It might even be because of regular debates about whom to include from which areas of the country that an overall sense of togetherness has developed.
More generally, this article has taken but a first step in trying to assess the long chain from individual group membership, group recognition, and central government inclusion (i.e., “accommodation”); through intra-executive influence as opposed to merely “tokenistic power-sharing” (Fraenkel Reference Fraenkel2020) and individuals’ acceptance and perception; to – finally – the political behavior of the (un)represented themselves over a long period of time. While the existing literature has a lot to offer on the level of political elites, how group members themselves not only think about but also act and react to government inclusion and exclusion awaits further exploration. Perhaps in that sense rather peaceful Switzerland provides a fertile point of departure because especially linguistic group identities are only occasionally mobilized, notably in the wake of defeats of French-speaking cantons by the German-speaking majority, but never to the extent of constituting “nations” or even just ethnic groups in the traditional sense. Whether an intricate set of rules on territorial, linguistic, religious, partisan, and gender proportionality in the central government helps to appease group conflicts before they even arise must thus remain an open question. But for sure they do not damage the prospects for successful integration. A collegial membership of seven could be just exclusive enough to be seen as important whilst also sufficiently penetrable so that all have a reasonable chance of being eventually included.
Acknowledgments
The author thanks the editors of the special issue, the Nationalities Papers board, and the three reviewers for their commitment and constructive criticism.
Supplementary Materials
To view supplementary material for this article, please visit http://doi.org/10.1017/nps.2022.89.
Disclosures
None.
Funding Information
This research was funded by a 2016–2019 Ambizione grant from the Swiss National Science Foundation (Nr. PZ00P1_161257).


 Open access