

Introduction
The curious history of both the study area and the previous studies within that area provided the motives for our work on Taku Glacier, the largest glacier draining the Juneau Icefield in southeast Alaska (Fig. la). The glacier was formerly identified as a prototypical calving tidewater glacier but it now terminates on its own terminal moraine and no longer calves. Its potential ability to block the Taku River has prompted many scientists and passers-by to ponder its future behavior; however, meaningful predictions are difficult without a reliable knowledge of the bed elevation. We have used geophysical techniques to measure the thickness of this unusual glacier to resolve substantial inconsistencies between previous thickness measurements, determine where the bed of the glacier rises above sea level and understand better the glacier’s behavior since about AD 1750, when it underwent retreat by accelerated calving (Lawrence, 1950; Post and Motyka, in press).
Much is known about the history of Taku Glacier through a variety of sources, and several somewhat conflicting theories regarding its dynamics have been developed as a result (Post and Motyka, in press). Repeatedly during the Holocene, and as recently as 1750, the glacier blocked the Taku River and created a large lake within the river valley (Motyka and Begét, in press). The glacier’s last retreat began about 1750 (Lawrence, 1950); a subsequent advance was under way by 1890 (Motyka and Post, in press). While the advancing glacier actively calved into Taku Inlet early this century, calving flux, was greatly reduced after a moraine shoal rose above sea level in 1941 (Field, 1954) and was negligible by 1946 (Pelto and Miller, 1990). Its terminus has remained nearly stationary since 1988 and is presently separated from tide water, except at several outlet stream channels, by several hundred meters of vegetated terminal moraine and outwash deposits. All other glaciers draining the Juneau Icefield were retreating by 1912 (Motyka and Begét, in press), while Taku Glacier’s rate of advance was increasing. This anomalous advance sparked fears of an imminent river blockage and has been variously attributed to, for example, local climate change (Miller, 1963), positive average mass balance (Pelto and Miller, 1990) and non-climatic factors unique to tide-water glaciers (Motyka and Post, in press).
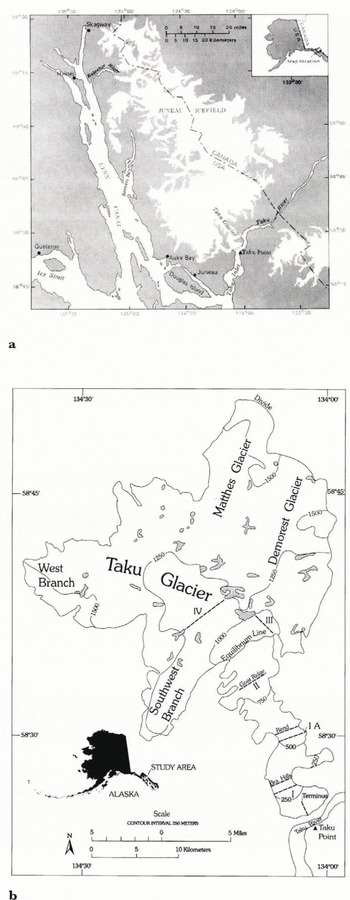
(a) Location map for Taku Glacier and (b) drainage map with profiles referred to in text. Profiles with descriptive names Terminus, Brassiere Hills, Bend and Goat Ridge refer to transects used in this study. Profiles numbered I, II, III and IV refer to Juneau Icefield Research Program (JIRP) transects. Transect locations are approximate.
One complication in understanding Taku Glacier’s dynamics is a lack of information between 1793 and 1890. The glacier stopped retreating and began advancing during this interval and, thus, the extent of terminus retreat is unknown. (We refer to this unknown terminus location as the 19th century minimum terminus location or, simply, the 19th century minimum.) Without this information, the relationship between bed elevation and terminus behavior cannot be thoroughly studied. Current hypotheses hold that retreating tide-water glaciers will stabilize and begin to re-advance (exclusive of surge events) when the terminus has retreated into water that is less than 100m deep, near where the underlying bed rises above sea level (Mercer, 1961; Post, 1975; Brown and others, 1982). Motyka and Post (in press) suggested that this location may have been within several kilometers of the 1890 location, which was mapped by the U.S. Coast and Geodetic Survey (USCGS) along with the bathymetry of Taku Inlet. Seismic reflection measurements by Poulter and others (1949) show that Taku Glacier’s bed crosses sea level within 1 km of that location, agreeing well with theory.
However, several lines of evidence have indicated that the measurements by Poulter and others (1949) were incorrect. Nielson (1957) found that the balance flux was much larger than the ice flux through their cross-sections and attributed some of the imbalance to incorrect thickness measurements. We arrived at similar conclusions after measuring ice velocities in 1989–90 (unpublished data of R.J. Motkya). Poulter and others’ (1949) four transverse cross-sections (labeled I, II, III and IV on Figure lb) show a flat bottom and average thickness of between 300 and 350 m; these thicknesses seem anomalously shallow considering that the glacier is 3–4.5 km wide there. Our subsequent radio-echo soundings (RES) indicated that the ice thickness not far from the margins was, in fact, thick enough to exceed RES capabilities (500–600m). A 1992 Juneau Icefield Research Program (JIRP) study (unpublished data of M. Nolan) reported a seismically determined maximum ice thickness of 1400 m along JIRP profile IV (Fig. 1b). Our estimates based on ice-deformation theory, assuming no basal motion, where surface velocity information was available, yielded thicknesses compatible with these recent measurements. These analyses suggested that the actual sea-level crossing point of the bed was 25 km further up-glacier than indicated by Poulter and others (1949), prompting further thickness research and opening new questions regarding the factors controlling the glacier’s retreat and advance.
This paper presents the methods and results of new ice-thickness measurements Steep valley walls and temperate ice prevented us from collecting RES data on ice thicker than approximately 600 m; subsequently, we collected seismic data to measure thicknesses greater than We completed the RES measurements during August 1989 and 1990 and the seismic measurements in August 1993. Our results have led to new constraints on the ice-thickness distribution for the full 55 km length of Taku Glacier, on the location where the bed elevation crosses sea level and on the mechanisms responsible for ending the glacier’s most recent retreat and controlling its re-advance.
Geophysical Methods
Surface-location determination
Shot and receiver locations for both seismic and RES measurements were determined using combinations of tape measure, theodolite/electronic ranger or differentially corrected Global Position System (DGPS) methods. Optical surveys are accurate to ±0.10m. A GPS base receiver was located at a known benchmark near Juneau airport, approximately 30km southwest. Differential corrections reduced the GPS location errors to ±2–5 m, on satellite geometry and the duration of data logging at each location.
Radio-echo sounding methods
A monopulse glacier radar transmitter (Watts and Wright, 1981; modified for greater power) was used for the RES measurements in a standard manner. The transmit and receive antennas were laid parallel to each other, separated by 100m. The 40m half-length dipole antennas produced a center frequency of about 1.7 MHz. The antennas were oriented either parallel or perpend-to the direction of flow, depending on surface degree of crevassing and signal strength The receiving antenna was connected to an oscilloscope. It was not possible to distinguish between an ice/till interface and an ice/rock interface from the rharacter of the basal returns. In the cross-sections presented later, the possible bed location for each return is indicated by the lower part of an ellipse with the antennas at the focal points (Echelmeyer, 1983)
Accuracy of RES ice-thickness measurements is limited by wavelength, wave speed and uncertainty in the travel time. The wavelength in ice for a frequency of 1.7 MHz is approximately 20 m; maximum resolution is considered to be on the order of one-quarter wavelength. The wave speed in temperate ice is 168±3mμs−1; the maximum error (at our thickest measurement, 652 m) is ±12m. Uncertainty in travel time ranges from ±0.01μs for strong signals to ±0.1;μs for very weak signals, or roughly 2–17 m in temperate ice. Total uncertainty for RES measurements is ±7–22m, depending on signal strength and thickness.
Seismic methods
Our seismic equipment and methods are typical of those used for ice-thickness measurements. We employed a Bison 7012 digital seismograph, typically set for a 0.25 ms sampling rate, and took 2000 samples per record for a total record length of 0.5s. These parameters proved adequate to record most reflecnons, although a delay was sometimes used on large shot-receiver offsets (>500m) Often, reflections from two to four locations along the bed were recorded on a single seismogram. Twelve 28 Hz vertical geophones were placed directly on glacier ice 30m apart in a straight line perpendicular to ice flow. Energy sources, or “shots”, were provided by explosives; for each shot, 0.4kg of dynamite was loaded into a hole in depth. The seismograph was triggered by a light-gauge wire that was wrapped around the explosive charge and connected to the seismograph, 30–1000m away. Detonation severed the connection, causing an open-circuit trigger pulse. This method, while at times inconvenient, minimized errors due to hlastingcap delays and faulty radio triggers.
The accuracy of the seismic results is limited by several factors, which are described fully in Appendix A. Lack of clarity of the seismograms limits the ability to determine travel times accurately; samples of seismograms recorded at the Goat Ridge and Bend transects (Fig. 1b) are shown in Figure 2. We determined the locations of reflecting interfaces by data migration, using variations of a wave’s travel time between geophones, known as the “move-out”. Data migration was necessary because the reflecting interface was often not directly beneath the array and often steeply inclined. We used the pointwise migration technique developed by Clarke and Echelmeyer (in press; outlined in Appendix A). The method differs significantly from those given in most geophysical texts because it was developed for single shots over a steeply dipping interface rather than the large number of shots and receivers used for common depth point (CDP) analysis. Our seismic method (the common approach for valley glaciers), however, does not allow us to distinguish easily between an ice/till interface and an ice/rock interface as might be possible with the CDP method. A maximum-error estimate off ±43m is assumed, although ±30m is likely for much of our data, as described in Appendix A. This error applies to both depth and horizontal location of the reflector.
Description of Cross-Sections
(The terms cross-section, profile, section and transect are used interchangeably; for consistency, we use “cross-section” when referring to our measurements and “transect” for their map locations.)
Terminus and Brassiere Hills cross-sections
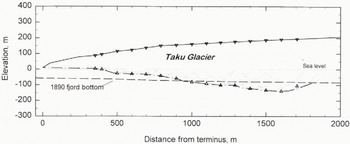
Data for these cross-sections were obtained exclusively by the RES equipment. Soundmgs were made along the longitudinal Terminus transect near the center of the terminus, extending from 350 to 1700 m up-glacier from the terminus (Fig. 3). The ellipse segments represent all possible locations for a reflector within the vertical plane; the bed itself, indicated by the dashed line, is the envelope of these ellipses (following Echelmeyer, 1983). The glacier bed is at or near sea level from the terminus to about 400 m up-glacier. Between 400 and 500 m it deepens to about 50 m below sea level (b.s.l.) and remains at about this level for another 300 m. It then steadily deepens up-glacier to approximately 140m b.s.l. at its deepest point in this cross-section, where the ice thickness is 330 m.
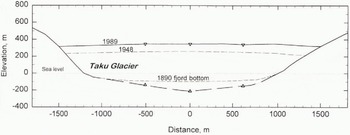
We made three radio-echo soundings along the transverse Brassiere Hills transect, about 5.5 km up-glacier from the terminus. The cross-section (Fig. 4) was constructed using radar data and valley-wall contours from the 1893 International Boundary Commission maps. The deepest sounding on this transect, near the center line, is 212 mb.s.l. and the ice thickness there is 558m.
Sample seismograms from Taku Glacier. Waves marked D and G are direct P-wave and ground-roll respectively. Waves marked R indicate one or more basal P-wave reflections. Seismogram a. was recorded from a shot 880 m. east of the closest geophone of the western array on the Goat Ridge cross-section (Fig. 5). The last refections indicated on this seismogram delineate part of the deepest ice on Taku Glacier. Seismogram b was recorded from a shot 600 m east of the closest geophone of the eastern array on the Goat Ridge cross-section (Fig. 5). The closest geophone in that case was the comer of an L-shaped array with two geophones located perpendicularly up-glacier with respect to the remaining ten geophones. Seisogram c was record from a shot 398 m east of the closest geophone of array on the Bend crass-section (Fig. 6). The last reflections indicated on this seismogram delineate what we have speculatively described in the text as a sediment layer. Geophone spacing was 30m. The time is given in ms from shot detonation; note that seismograms b and c were recorded with a 100 ms delay.

Goat Ridge cross-section
We collected seismic and RES data for this cross-section (Fig. 5) in three different years and on slightly different transects, yet they agree well. RES data were obtained near the west wall during 1989 and 1990. The soundings revealed a relatively steep wall with the deepest return at no radar returns were obtained from thicker ice. Subsequent seismic measurements made during 1993 revealed reflectors overlapping with the radar soundings and several from the bottom of the trough. A single radio-echo sounding was measured near a velocity-measurement stake located about 500m from the east margin about 2km down-glacier from the Goat Ridge cross-section. The sounding produced two echoes which were projected on to the Goat Ridge cross-section and used to constrain the bedrock slope beyond the last seismic reflector.
Terminus cross-section as determined by radio-echo sounding. Triangles at the surface indicate location of RES equipment. Dotted ellipse segments indicate all possible bed locations and lower triangles indicate the maximum bed location. The maximum ice thickness along this longitudinal transect is 330m. Bathymetry in 1890 is also shown. The advancing terminus did not reach the up-glacier end of this transect until 1948; deposition since 1890 had raised the fjord bottom here to sea level by 1948.
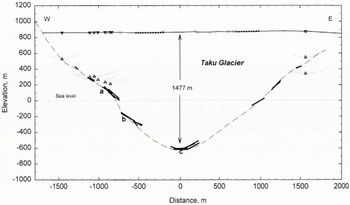
The deepest part of the bed is well defined by the migrated seismic results. We deployed two geophone spreads and recorded a total of 16 shots. Many of the seismic shots generated several useful reflections from a single seismogram (e.g. Fig. 2b). In addition, reflections recorded from both geophone spreads overlap in groups a, b and c (Fig. 5). Groups a and b show a change in slope with depth and are probably rounded protrusions (Röthlisberger, 1972, p. 50). The lack of reflections between them suggests that the slope between them is steep. The thickest section of the glacier at this transect is well delineated by group c. These reflections were measured from five separate shots, overlapping with little scatter, and the clarity of the signal for the deepest reflector was good. While the systematic error in velocity remains, these factors greatly reduce the random error (see Appendix A). The maximum thickness measured at this transect was 1477 ± 30m. This is the thickest ice measured on Taku Glacier.
Bend cross-section
We combined RES and seismic data for the Bend transverse cross-section (Fig. 6) as well. The RES data constrain the bed elevations near the ice margins and indicate that the bottom of the trough is well below sea level. Radio-echo soundings near the west wall show that the wall is very steep. Echoes were lost below 534 m. Subsequent seismic sounding on this transect detected at nearly the same location as these RES measurements. RES data near the east wall also indicate a steep wall; these data were obtained about 1.5 km down-glacier from the Bend transect. The depth and lateral positions of these soundings were projected on to the Bend cross-section to help constrain the slope along the east wall where we were unable to establish bedrock using seismic techniques.
A single geophone spread was deployed along this transect and eight shots recorded. Reflection group a (Fig. 6) was very clear and aligns well with group b. All seismic returns from this profile were generated from shots on the west side of the geophone spread. The lack of reflections from the east side indicates that the steep slope of the east valley wall probably continues down into the ice for several hundred meters. The geophone array would need to be located closer to this wall in order to obtain reflections.
Group c does not align well with b and is not considered to be part of the same interface. Group b contains reflections from several shots and has an internally consistent alignment; all of group c’s reflections came from a single seismogram and are of poor quality for determining arrival times. Reflection group c might have come from an area not within the vertical plane of the geophones, or from a second interface that is below the bed of the ice. The underlying granodiorite (Miller, 1963; Gehrels and Berg, 1992) is unlikely to have internal reflection interfaces. However, an unlithified sediment or till layer deposited during the last retreat might exist here. The travel times indicate that such a layer would have a thickness of about 65 m, assuming a P-wave velocity of 1600 ms−1 (Röthlisberger, 1972, p. 36; Blankenship and others, 1987). Logistic constraints prevented additional measurements from this part of the bed and, thus, the source of reflection group c is speculative.
Brassiere Hills cross-section as determined by radio-echo sounding. The maximum ice thickness is 558 m along this transverse profile. Bathymetry from 1890 and photogrammetry from 1948 are also .shown.
Goat Ridge cross-section as determined by radio-echo sounding and seismic reflections. Solid lines indicate the length and angle of reflecting interfaces from seismic measurements. The interfaces are labeled with letters a, b, c for reference in the text. Circles at the surface indicate location of geophones, determined ty GPS. Open triangles at the surface are seismic shot locations. One shot often generated several reflections. The east wall is not exposed at this transect as the glacier laterally extends into a small valley filed with stagnant ice. The maximum thickness is 1477 m. This is the thickest ice measured on Taku Glacier.
The final constraints on the cross-section were made by continuing the slope of the valley walls below the ice and passing through reflection groups a and b on the west side and a single RES measurement on the east side. The center-line thickness estimate based on these constraints is 1200 m and could be as much as ±150 m in error, as the eastern half of the bed is relatively unconstrained.
Complete longitudinal cross-section
We constructed a complete longitudinal cross-section (Fig. 7) from the terminus to the ice divide at the head of Matthes Glacier (Fig. 1b) to estimate where the bed of Taku Glacier rises above sea level. To accomplish this, the Terminus cross-section was extended to include the following: the maximum thicknesses of our Brassiere Hills, Bend and Goat Ridge cross-sections; the maximum profile IV thickness from a 1992 JIRP seismic study (unpublished data of M. Nolan); and the maximum ice-divide depth from a 1993 JIRP seismic and RES study (personal communication from B. Hammoud) Smooth curves were fitted between these data points to complete the cross-section.
Bend cross-section as determined by radio-echo sounding and seismic refections. Reflections labeled c are not considered part of the ice-bedrock interface, as described in the text, and may indicate the presence of a subglacial till layer. The east side of the valley is relatively unconstrained, therefore the maximum thinckness of 1200 m indicated is an estimate.

Longitudinal cross-section of Taku Glacier. Sources for bed data are given in the text. Center-line values of Poulter’s 1949 measurements and estimated thicknesses based on measured surface velocities are included for comparison with the present work. We estimate that the glacier retreated as far as 8–14 km from Taku Point during the 19th century, as descirbedin the text.

Based on this longitudinal cross-section, a fjord about 40 km long would result if Taku Glacier retreated until the terminus withdrew from tide water. (Subsequently, we use “fjord” to refer to the marine section of the valley that would be exposed if the glacier vanished.) We estimate that the bed elevation crosses sea level 38–48 km from Taku Point (Fig. 7). This range is delimited by two abrupt drops in ice-surface elevation which suggests rough bed topography. The depth estimates between our measurements in the ablation area are speculative as well; studies on Columbia Glacier (Brown and others, 1986) and Tarr Inlet (Carlson and others, 1983) have shown bedrock topography characterized by rises and depressions which vary from the average bed surface by up to 80 m.
Discussion
Relevance of our results to previous research
Previous seismic measurements unsubstantiated and flawed
The primary goal of our work on Taku Glacier was to settle debate on its ice-thickness distribution. Our results confirm that the actual ice thicknesses are up to 1100 m greater than those previously published (Poulter and others, 1949). This discrepancy is due, in part, to the fact that their seismograms did not span enough time to sample most of the deeper reflections that we identified from our longer recordings In addition, Poulter and others (1949) estimated a single depth from each seismogram and assumed that the reflector was directly beneath the midpoint of the shot and geophone line. Of the three waves on their seismograms apparently interpreted as reflections, only one, taken near the ice margin, appears to us to be a reflection. The other two, taken from measurements near the glacier center line, appear to he part of the direct wave trains and not basal reflections. Thus, it is unlikely that any reflecting interface exists at the depths indicated by Poulter and others (1949), except near the ice margins. Any theories or calculations based on these erroneous thicknesses need to be re-examined.
Taku Glacier is the thickest and deepest temperate glacier yet measured
Although many large glaciers remain unmeasured in Alaska, Taku Glacier is the thickest temperate glacier yet measured. Because its thickness exceeds the range of surface RES measurements on temperate ice, relevant thickness comparisons can be made only with those determined using seismic techniques. Few seismic studies have been made on thick glaciers in North America; the thickest previous measurement is 1150 m on Ruth Glacier in the Alaska Range (unpuhlished data of K. Echel-meyer). The majority of temperate ice seismic work elsewhere has been confined to European glaciers which are on the order of 200–400 m thick, In contrast, Taku Glacier is less than half as thick as the slow-moving polar ice sheets of Antarctica (4500 m) and Greenland (3000 m). However, its thickness does lie within the range of fast-moving tide-water ice streams which drain those ice sheets; for example, Jacobshavns Isbrae in West Greenland is about 2500 m thick (Clarke and Echelmeyer, in press) and Ice Stream Β in West Antarctica is about 1100m thick.
As well as being uncommonly thick, Taku Glacier fills a fjord whose maximum depth (600 m b.s.l.) exceeds those measured in the surrounding area. Water depth (which is not necessarily fjord depth to bedrock) for most cf the major fjords in southeastern Alaska has been measured (Jordan, 1962; Brown and others, 1982; Carlson and others, 1983; unpuhlished data of A. Post). Bed elevation below sea Level has also been measured on Columbia Glacier (Brown and others, 1982), Malaspina Glacier (Sharp, 1988, unpublished data of D. C. Trabant, 1994), and Bering Glacier (unpublished data of D. C. Trabant, 1994). All of these measurements are at least 200 m higher than the bed elevation of Taku Glacier. However, because most deglacierized fjord bottoms are overlain by sediments, valid comparisons can only be made with those measured by ship-borne seismic methods which can penetrate sediment layers and measure depth to bedrock; the closest such measurement is 480 m. b.s.L in Tarr Inlet (Carlson and others, 1983). The possibility still remains that some of these fjords (as well as ice thicknesses) are deeper (and thicker) in locations not measured.
Last advance began in a location which conflicts with prevailing theories
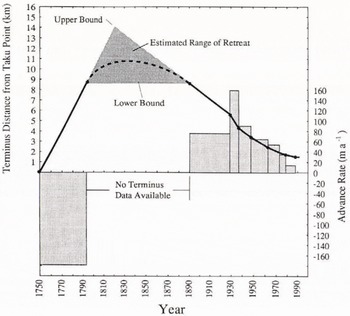
The 19th century minimum terminus location is currently unknown but must be estimated to determine the bed elevation there. We estimated this using terminus-location measurements of Motyka and Post (in press), whose sources include c. 1750 moraines and trim lines, Vancouver’s 1793 notes, 1890 USCGS bathymetry, photogrammetry from 1948 and 1989 photographs, and numerous maps, surveys and photographs from 1893 to 1989. We estimate a maximum retreat of 8–14km from Taku Point (the terminus location in 1750) from these data (Fig. 8); the corresponding bed depth within that range, estimated from Figure 7, is 200–500m bsl. The lower bound of 8 km shown on Figure 8 merely connects the known locations in 1793 and 1890. The upper bound of 14 km is a linear extrapolation based on the average retreat rate between 1750 and 1793 and the average advance rate between 1890 and 1929. It is possible that the terminus retreated more than 14 km. However, this would imply that the advance rate prior to 1890 was significantly faster than the 1890–1929 rate (76ma−1), which is already greater than measured advance rates of all other tide-water glaciers (Meier and Post, 1987). The possibility of a major advance and subsequent retreat between 1793 and 1890 is also improbable because the age of trees along the margins, recently over-run by the advancing Taku Glacier, indicate a deglaciation of at least 200 years (Lawrence, 1950).
Estimated minimum terminus location during the 19th century. Solid line represents probable terminus location and bar chart represents corresponding advance and retreat rates (Motyka and Post, 1994). A large gap in knowledge exists between 1792 and 1894, when the glacier began advancing. Shaded area is estimated range of terminus location between 1792 and 1890, as described in text; the dotted line assumes a continuity in velocity and represents a likely function of terminal location with time. The minimum location is approximately 14 km from Taku Point, which is slightly down-glacier from our Bend transect.
Our depth measurements and estimated range of 19th century retreat allow the significance of several mechanisms, presumably influential on Taku Glacier dynamics, to be examined more closely. These mechanisms include the effects of a decreasing bed elevation up-glacier from the terminus, a critically shallow bed elevation and pinning points. These three factors have been demonstrated to play an important role in the advance and retreat cycles of other tide-water glaciers in Alaska.
Taku Glacier did not retreat in the catastrophic manner that other glaciers have. Post (1975) successfully predicted that rapid retreat of Columbia Glacier was imminent, identifying the deepening of the bed up-glacier from the grounded terminus. As the glacier’s terminus was exposed to ever deepening water, the calving rate increased for a variety of poorly understood reasons. This catastrophic retreat process has also been observed to occur on many neighboring glaciers, with retreat rates between 0.4 and I .S km n 1 (Brown and others, 1982). Taku Glacier is similarly overdeepened up-glacier from the terminus but the only known retreat rate (about 200ma−1 between c. 1750 and 1792) is comparatively slow and is not likely to have been higher during the 19th century, as previously descrihed.
Taku Glacier may be the only example of a tide-water glacier in Alaska that has ended its most recent retreat in both deep water, 200–500 m, and more than 25 km from the inland end of its fjord. Observations of retreating glaciers in Glacier Bay and studies related to the retreating Columbia Glacier (Brown and others, 1982) have shown that, during their most recent retreats, these glaciers were unable to begin a sustained re-advance until reaching shallow water (on the order of 80 m) near the heads of their fjords, possibly due to a reduction in calving flux with shallow water. A shallow bed was evidently not required to end Taku Glacier’s last retreat, although, as will be discussed shortly, the possibility of subglacial ridges between our measurements exists.
If Taku Glacier’s last advance began because of a pinning point such as a constriction or bend in the fjord walls, it may be the only glacier in the area to have recently done so in deep water. Mercer (1961) noted that pinning points in the fjords of many Alaska tide-water glaciers have caused retreat rates to slow or stop, possibly due to a reduction in calving flux. There are several constrictions and bends which could act as pinning points within the estimated range of Taku Glacier’s retreat. However, Mercer (1961) did not suggest that any of these pinning points have caused a tide-water glacier which was in recession or at a standstill to begin an advance, unless they coincided with a bed elevation near sea level.
Subglacial bedrock ridges, as found in deglacierized Tarr Inlet (Carlson and others, 1983), raise the bed closer to sea level and, although speculative, such ridges could exist between our measurements. Both sides of the lower Taku Glacier valley are characterized by many transverse ridges, several of which appear large enough to connect beneath the ice. Our estimates of thickness at the Bend and Goat Ridge transects (described later) suggest the presence of compressive longitudinal stress gradients; such compression would result if subglacial ridges existed down-glacier of these transects. Such a ridge near Bend could play the same role as a fjord head, possibly explaining why the retreat ended there. This basal obstruction would conceivably cause thickening up-glacier and a change in surface slope across it, up-glacier thickening is generally observed (Fig. 7) and local center-line slope (1 km average) peaks at 4.5° about 2 km down-glacier of this transect, significantly higher than the average slope of 1–2° in this area (1989 photogrammetry; unpublished data of R.J. Motyka). Separating the effects of nearby bends and valley-wall constrictions from potential subglacial ridges is not possible with the limited data available. Therefore, a complete understanding of the last retreat and advance must await further measurements.
The behavior of Taku Glacier may be more similar to the polar Jakobshavns Isbræ than other temperate glaciers, although the validity of such comparisons is arguable. There is a similar submarine trough beneath Jakobshavns Isbræ which extends far inland into the Greenland ice sheet (Clarke and Echelmeyer, in press). This polar tide-water glacier also stopped its most recent retreat in deep water, well seaward of the inland end of the trough. In this case, however, there is a small subglacial island which may have stabilized the terminus in its current deep-water location (Echelmeyer and others, 1991), lending support to the idea that similar subglacial irregularities may exist beneath Taku Glacier. However, comparisons of temperate and polar ice are strained due to the many, albeit not fully understood, differences between the two For example, temperate tide-water glaciers have never been observed to form the extensive floating termini of their polar counterparts, although no theory has adequately described why.
Relevance of our results to current glacier dynamics
High eroston rates may retard further advance and cause measurement errors
Bed-erosion rates can be computed at the two transects where we have knowledge of the bed elevation prior to their being covered by ice The terminus was located at the up-glacier end of Terminus transect as recently as 1948 and the moraine in front of the 1948 terminus was at or near sea level at that time (Motyka and Post, in press). Thus, at the deepest point shown in this cross-section (140mb.s.l), the advancing glacier eroded sediments from the bed at an average rate of about 3.3 ± 0.6 m a−1 between 1948 and 1990 Similarly, the bed elevation (water depth, in this case) at the Brassiere Hills transect was measured in 1890 by USCGS bathymetry, prior to becoming ice-covered. Here, the glacier has displaced sediments well below the 1890 fjord bottom, by as much as 115 m at the glacier center line, at an average rate of about 1.1 ±0.25 ma−1 since 1890. The uncertainty in these estimates is based on a ±25 m uncertainty in the current bed elevation, determined by propagating maximum errors from radar and surface location.
The magnitude of these rates and the characteristics of Taku Inlet (Motyka and Post, in press) indicate that a sediment layer deposited during the last retreat is being eroded, not bedrock (or a bedrock-derived till layer) as is typical for most glaciers. The erosion rates found in the ablation area (1–3 m a−1) are unusually high; for example, the erosion rate beneath Ice Stream Β in Antarctica is less than 0.001 m a−1 (Alley and others, 1987). Furthermore, rapid sedimentation from the Taku River into the recessional fjord is believed to have occurred and to have been an important factor in slowing Taku Glacier’s calving rate, thus allowing its rapid advance (Motyka and Post, in press).
Advance of Taku Glacier is not currently limited by calving and its current standstill may be related, in part, to the sediments deposited during the last retreat. Advance of tide-water glaciers is thought to be limited by the rate of advance of their submarine terminal moraines because ice extending beyond the moraine will calve (Alley, 1991). As predicted, Taku Glacier stopped calving when its terminal moraine rose above sea level, allowing il to over-ride these sediments much like a land glacier, as indicated by the flat bed and thin ice shown on the Terminus cross-section (Fig. 3). Observanons at the terminus reveal that, in addition to stream transport, the ice itself is continually remobilizing sediments from below via thick layers of entrained basal debris (10–30cm). While these sediments were building up into the large terminal moraine now present, the high erosion rates reduced the rate of ice-surface rise by as much as 3 ma-' even though thickening was warranted by the positive net mass balance since 1946, described fully in the next section. The combined effects of raising the moraine and reducing the ice-surface rise probably reduce the ability of the ice to over-ride the moraine.
The glacier will continue to be protected from calving until it (1) over-rides the moraine and enters tide water, (2) retreats substantially from the moraine or (3) stops supplying more sediments to the moraine than are removed by the Taku River. The first two possibilities are controlled by mass balance (described in the next section). The last is related to the amount of remaining sub glacial sediment, this amount speculative but can be constrained. Considering that the area beneath the present terminus was available for sediment deposition for about 120 years prior to the 1890 bathymetry (see Fig 8) and using an average deposition rate between 1 and 2 m a −1 (Jordan, 1962; Carlson and others, 1983), a sediment layer between 120 and 240 m thick (depending on deposition rate) could exist below the water depth in 1890. However, the present bed elevation is more than 100 m below the 1890 water depth in some places, indicating that such a layer may be quite thin now.
Mass-balance estimates using surface-elevation changes do not account for these high rates of erosion and could have considerable error, simply because the erosion rates are within the range of ablation rates (∼0–10m a−1) and much higher than the average “thickening” rate (∼0.4 m a −1) suggested by the areally averaged net mass balance (that us, the volumetric net mass balance divided by the total glacier area) (Pelto and Miller, 1990). This potential error can be avoided by measuring ablation using poles, rather than surface-elevation measurements. Discrepancies between these two techniques, if used simultaneously, may provide an estimate of basal erosion independent of geophysical measurements.
Support for basal motion, high shear stress and ice-volume increase Using ice thickness, surface slope and the flow law of ice, we calculated basal shear stress and estimated basal motion due to sliding or till deformation; details of these calculations are given in Appendix B and results are presented in Table 1 for those cross-sections where sufficient data exist. The basal shear stress is, large throughout the reach of the glacier studied; it is a product of the relatively steep surface slope and large ice thickness. Comparison of measured surface speeds with estimated internal deformation indicates that significant basal motion is likely only beneath the Brassiere Hills transect. At the other transects, the estimated deformational speed is equal to or even greater than the observed surface speed, resulting in thickness estimates less than the measurements. Despite being thinner, these estimated values indicate the glacier is very thick, consistent with our measurements (Fig. 7).
The validity of these results is compromised by several factors. The theoretical deformational speed is very sensitive to surface slope. Surface slopes were computed over a length equal to 6–10 times the ice thickness to minimize the effects of longitudinal stress gradients. This so-called box-car averaging function may not be valid everywhere along the glacier length, especially where the bed slope and surface slope differ substantially, such as at the Bend and Brassiere Hills cross-sections. Furthermore, surface-velocity measurements at the Goat Ridge cross-section show that summer velocities are 25% larger than the annual velocity (unpublished data of R.J. Motyka). This suggests that there is, in fact, some basal motion at this cross-section, at least on a seasonal basis; none is predicted in Table 1.
The “flow-law” parameters (A and n) have considerable scatter in the literature and may also be a significant source of error in our estimates of basal motion. For example, holding n = 3, the value of A has been suggested to be 5.3 × 10⁻²⁴ Pa−3s−1 (Paterson, 1981, p.39) and range from 3.0 × 10⁻²¹ to 3.2 × 10⁻²³ Ρa−3 s−1 (9.4 × 10⁻² to 1 bar−3a−1. (Hooke, 1981) for ice at 0°C; these values have potentially significant errors. As Figure 7 shows, most of our estimates of thickness (using Paterson’s value of A, which is close to the smaller, or “stiffer”, limit of Hooke) are shallower than the measured thickness, suggesting (1) the physically absurd result that there is up-glacier basal motion, (2) unlikely regions of basal ice below the melting point, (3) significant, compressive longitudinal stress gradients (perhaps caused by bedrock ridges buried beneath the ice) or (4) a value for A which a not stiff enough. To illustrate the latter point, we used the values in Table 1 for surface speed, shape factor and measured thickness at the Goat Ridge transect to solve Equation (1) (in Appendix B) for A and found it to be 3 times smaller (stiffer) than the value we used in our calculations; this stiffer value corresponds to that suggested for ice at −3°C (Paterson, 1981, p.39). Applying this reduced value of A at the other locations, basal motion is predicted at each of them; the stiffest value of A available for ice at 0°C indicates basal motion at the Brassiere Hills and profile IV transects only. Use of the largest (softest) value recommended for 0°C ice, as suggested by many laboratory researchers (Hooke, 1981), would further decrease our thickness estimates, but not enough to change the original estimate of some, albeit less, basal motion at the Brassiere Hills transect. Field research consistently indicates stiffer values for A than laboratory research (Hooke, 1981; Paterson, 1981); therefore, we chose the relatively stiff value of A recommended by Paterson (1981) for ice at 0°C and present the magnitude of the basal motion as a crude estimate.
To calculate volume continuity, we first had to determine ice flux and balance flux. Ice flux was calculated by dividing each cross-section into columns and multiplying each column area by a mean velocity for that column, determined as follows. At the transects where basal motion was predicted to be small (that is, at all transects except Brassiere Hills), the surface velocity was interpolated from the measured velocities across the profile and assumed zero slip at the valley walls. We then scaled this surface velocity by a factor of 0.8, following Nye (1965), to obtain a mean columnar speed. At the Brassiere Hills transect, only the estimated deformational speed was scaled by 0.8 and that was added to the inferred basal speed. The ice fluxes have an estimated error of ±10%. Balance flux was calculated by areal integration of the mass-balance data compiled by Pelto and Miller (1990) and Pelto (personal communication). The mass-balance data are both temporally and spatially sparse in the ablation zone and there are other potentially significant sources of error as discussed by Pelto and Miller (1990).These lead to an estimated error of ±10%
Estimates of thickness, basal motion and basal shear stress are based on surface speed as descrzbed in Appendix Β. Surface speeds from profiles 1A and IV are taken from Miller (1963) and are probably extrapolated from, summer measurements. Goat Ridge and Brassiere Hills speeds are taken from Motyka (unpublished data). “Measured thickness” at profile 1A is estimated from Figure 7

Comparison of ice flux and balance flux for three cross-sections at Taku Glacier. A positive difference represents the volume of ice in excess of in flux out of the cross-section and, thus, volume increase up-glacier from it. Percentage differences compare flux difference to balance flux

in the balance fluxes hut the errors may be substantially higher at the lower profiles.
The differences between the ice flux and mass-balance flux (Table 2) are close to the estimated error bounds and, thus, are only marginally significant Nevertheless, they do indicate that some thickening (or volume increase, to he precise) should be occurrtng up-glacier of the Brassiere Hills and Goat Ridge cross-sections. This thickening is consistent with (1) the thickening suggested by a 0.36 ± 0.06 m (water equivalent) areally averaged annual net mass balance averaged over the period 1946–86, which ended with an increasing trend (Pelto and Miller, 1990), (2) the measured thickening near profile IV of 10–25 m over the past 40 years (unpublished data of M. Lang and W. Welsch) and (3) the measured thickening below profile IV (unpublished data of R.J. Motyka). The positive imbalances at the lower transects, the 40 year history of positive areally averaged net mass balance (essentially a positive imbalance at the zero ice-flux terminus) and the thickness measurements suggest that the glacier volume is increasing (particularly toward the ablation area) and that, should terminus conditions permit, the glacier may begin a new advance.
Summary
Our study settles previous debate over the actual thickness distribution of much of Taku Glacier and reveals several unexpected findings. The maximum thickness measured was 1477 ± 30 m, at a location near the equilibrium line; this is the thickest measurement on record for a North American glacier. The minimum bed elevation, which is also located near the equilibriu line is approximately 600m below sea level; this is deeper than all measurements of glacierized and recently deglacierized fjords in Alaska. In addition, more than half of Taku Glacier’s bed rests below sea level. Estimates of the 19th century minimum terminus location place the terminus in 200–500 m of water, more than 25km from the head of the fjord. A considerable amount of sediment has been eroded from the bottom of the fjord since 1890, at average rates of about 1–3m a−1. Basal motion may be significant at the terminus and high basal shear stresses exist for much of its length. The mass-balance flux is slightly in excess of the ice flux in the ablation area, which is consistent with measurements of thickening there. The glacier stopped advancing in 1988 despite a 40 year record of positive net mass balance, high basal erosion may have contributed to the standstill as some of the excess ice flux dug deeper into the moraine instead of continuing to over-ride it.
Acknowledgements
We are grateful to C. Larsen, R. Hughes, E. Anderson, R. Noll and S. Liss for their help in the field, and to W. Harrison, R. Hooke, R Alley and an anonymous referee for their helpful comments on the manuscript. This research was supported by the Alaska Department of Natural Resources, the U.S. National Science Foundation (N.S.F. grant OPP-9122783) and the U.S Geological Survey.
Appendix A Seismic Reflection Migration
The pointwise migration method (Clarke and Echelmeyer, in press) assumes that a single layer of homogeneous material (i.e. temperatre icw with a constant P-wave velocity) overlies bedrock, that the geophones used in the analysis are placed in a horizontal linear array and that the reflection points are in a vertical plane passing through the array. No corrections for surface statics were made in this analysis, because the vertical offset for all geophones and shots was less than 10m and often less than 1 m.
Two pairs of data are needed to calculate the depth, slope and horizontal position of the reflector: the first arrival times at any two geophones (typically the first and the last of the spread) and the distance to those geophones from the shot along the surface. If discrepancies arise between several reflections, priority is based upon the clarity and strength of the reflected waves.
The most important consideration when choosing arrival times is obtaining the correct move-out, which is the slope of a theoretical line that best fits the first arrival times of the reflected-wave packet on the geophone traces. The reduction of seismic data was conducted independently by two of the authors and checked for comatency. If discrepancies in arrival-time picking were greater than 1 ms and could not be resolved, the wave was discarded. The estimated error in choosing arrival times for clear reflections is therefore ± 1.0 ms. Errors in determining arrival times from the seismogram will result in incorrect move-outs that are either parallel but shifted (with end points shifted by the same amount) or skewed (with end points shifted by different amounts) to the correct line. Parallel move-outs that are 1 ms in error result in less than 2% errors in both depth and horizontal location of the reflector. Skew move-outs that are off by 1 ms often produce much larger errors in both depth (5–150%) and horizontal location (100–4000%). Because the error due to skewed move-out can be so large, they often can be easily detected and corrected. We believe that the reduced seismic data presented in this paper are free from these larger errors, giving a random-error estimate of approximately ±30 m (2%) at the deepest point (1477m). If several clear reflections overlap when plotted, this random error can be reduced to the scatter of the reflections’ position.
Another potential source of error in seismic results is choice of compressional wave velocity. The literature is noticeably lacking in consensus for a P-wave speed in temperate ice, perhaps because P-wave speed is very sensitive to temperature variations between 0° and −1°C. Röthlisberger (1972) concluded that results from various authors of 3600–3620 m s−1 and 3670–3700 m s−1 have equally valid data supporting them. We used the mean of these suggested values, 3650m s−1, consistently throughout the calculations. Our measurements on Taku Glacier show that the average direct P-wave speed, determined from the move-outs of ten seismo-grams, was 3700 ms−1 with a standard deviation of 46 m s−1. The relationship between direct-wave speed at the surface and bulk ice speed varies with surface location and probably changes with season; for example, the direct-wave speed could be slower than the bulk-ice speed due to crevassing or faster due to a lower average temperature. Increasing the speed used in the calculations to 3700 m s −1 increases the thickness estimate by approximately 21m (1.4%) at the deepest point. Therefore, we conservatively estimate the maximum systematic error at ±2%, or approximately 30m at the deepest point of Taku Glacier. Propagation of maximum random and systematic errors results in error bounds of ±43m.
Appendix B APPLICATION OF ICE-DEFORMATION THEORY
Measured surface velocity on Taku Glacier can be used to ice thickness following techniques developed by Nye (1965) for ice flow down a uniform parabolic channel and, when combined with a measured thickness, estimate basal motion. The center-line surface velocity due to ice deformation is given by
where n is the flow-law exponent (n= 3), A is the flow-law parameter (5.3 × 10⁻²⁴Pa−3s−1 from Paterson (1981, p. 39)), ρ is the average density of ice, g is the acceleration of gravity, α is the surface slope averaged over 6–10 times the glacier thickness, H is glacier thickness at the center line and f is a shape factor which accounts for the drag of the valley walls, Equation (1) assumes a basal shear stress calculated by τ b = fρgH sin α. Inverting for thickness from Equation (1) is usually an iterative process because f depends on H.
Shape factor, f, as a function of W, the ratio of half-width to thickness. A polynomial (solid line) was fitted through elliptical shape-factor values (circles) given by Nye (1965). This function is used to eliminate the need to iterate solutions for thickness in Equation(1).

We presenr a simple method to solve for thickness directly. A polynomial, f(W), was fitted through the values of the shape factor given by Nye (1965) as a function of W (Fig. 9), where W is the ratio of glacier half-width, w½, to center-line thickness, H.

Normalizing Equation (1) by ud evaluated for W = 1 (i.e. Η = w½ and f = 0.445) = yields a normalized velocity, U, which is independent of actual glacier thickness, width and surface dope
U from Equation (3) is shown in Figure 10 as a function of W. Grouping the Constant terms of Equation (1) together, the value of u d(W = 1) for a given surface slope and width can be calculated as follows
where w is the glacier width in meters and ud is given in m a−1.
To solve for thickness H, evaluate the lefthand side of Equation (3) by setting u
d(W) equal to measured surface speed and then finding u
d(W = 1) from Equation (4). W can then be estimated from Figure 10, or by solving Equation (3), and then the center-line depth from H = ![]() . Estimates based upon these calculations are very sensitive to surface slope and can easily be in error by ±100 m.
. Estimates based upon these calculations are very sensitive to surface slope and can easily be in error by ±100 m.
For example, consider a glacier that has a width of 4.5 km, a surface slope of 1.0° averaged over 10 km, and a measured surface velocity of 220 m year−1. From Equation (4), u d(W = 1) = 691 m a–1. The dimensionless velocity ratio, U, is 220/691 = 0.318. From Figure 10, W= 1.67 and thus H = 2250m/1.67 = 1350m.
If the estimated thickness is greater than the measured thickness, this difference may indicate basal motion, due to the ice sliding over bedrock Of a layer of deforming subglacial till. The ratio of basal motion to measured surface motion can be estimated by first determining the contribution of deformation to surface speed, ud , using the measured thickness for H in Equation (1). The remainder of measured surface speed and this deformation speed is an estimate of basal motion.
Normalized velocity U vs W. U is the ratio of the measured surface velocity to the deformational velocity with W=1 from Equation (4). Center-line thickness can be determined froom W using this figure.


