


Introduction
As disasters grow in frequency, scale, and severity, regional and statewide coordination of patient transfers has become increasingly critical for sustainable health care. Natural disasters, such as hurricanes, floods, earthquakes, and wildfires, can disrupt hospital operations through physical damage, power outages, and water shortages, often necessitating the partial or full evacuation of inpatients from multiple affected facilities within a short period.Reference Zhou, Zhang and Gou 1 –Reference Sofuoglu, Ozturk and Er 5 Even when hospitals remain intact, these disasters and other mass casualty incidents, including terrorism and infectious disease outbreaks, can cause patient surges that exceed local hospital capacity for beds, staffing, equipment, and specialty services.Reference Sofuoglu, Ozturk and Er 5 –Reference Berkeveld, Rhebergen and Bloemers 8 In such situations, transfer management serves as a critical mechanism not only for ensuring access to appropriate care but also for redistributing load and helping avert health care system failures at the local, regional, and state levels.
Various coordination models have emerged to support systemwide management of patient transfers within and across regions.Reference Burkle, Hsu and Loehr 9 –Reference Epley, Stewart and Love 11 Spurred by the September 11, 2001 terrorist attacks and Hurricane Katrina, the concept of medical operations coordination centers (MOCCs), also referred to as regional medical operations centers, has emerged and developed in the United States as a model for patient transfer management and load balancing during emergencies.Reference Mitchell, Taylor and Paulsen 7 , Reference Epley, Stewart and Love 11 –Reference Armstrong, Scherer and Dorlac 13 Although many hospitals rely on formal agreements and informal interorganizational partnerships to independently arrange transfers,Reference Zhou, Zhang and Gou 1 , Reference Nagata, Himeno and Himeno 2 patient surges can still strain traditional referral systems.Reference Sexton, Alperin and Stobo 3 –Reference Berkeveld, Rhebergen and Bloemers 8 , Reference Epley, Stewart and Love 11 , Reference Baum, Vlaanderen and James 14 Specifically, surges in care demand may exceed the capacity of partner hospitals, and critically ill patients may require specialized care at tertiary or quaternary hospitals outside established referral networks. These challenges become more pronounced when multiple hospitals are disrupted simultaneously or in succession.Reference Schultz, Koenig and Lewis 4 Prior research documents that MOCCs and similar coordination bodies centralizing oversight of patient flow, resource allocation, and interfacility communication can address these gaps, supporting systemic load balancing and better alignment of patient needs with available capacity across the system, especially for rural and under-resourced urban hospitals.Reference Mitchell, Taylor and Paulsen 7 , Reference Armstrong, Scherer and Dorlac 13 –Reference Franklin, Mitchell and Villarroel 16
Despite their value, coordination centers such as MOCCs can face significant challenges during periods of extreme surge, particularly when limited systemwide capacity information is available to support timely decision-making, as evidenced during the COVID-19 pandemic.Reference Mitchell, Taylor and Paulsen 7 , Reference Franklin, Mitchell and Villarroel 16 In response to these challenges, researchers and practitioners alike have emphasized the critical role of data analytics and visualization in supporting coordination center operations and decision-making. Hick et al. and the U.S. Department of Health and Human Services Office of the Assistant Secretary for Preparedness and Response (ASPR), among others, propose key data elements to track real-time capacity and utilization, capturing shifts in patient demand (volume, variety, and acuity) and hospital resources (bed availability, staffing, and other resource capacities), enhancing situational awareness for effective decision-making. 12 , Reference Hick, Toner and Hanfling 17 Moreover, as geography affects resource distribution and patient transport, spatial data have gained increasing attention for supporting equitable resource allocation and care.Reference Bartlett and Greenwood-Ericksen 18 , Reference Carr, Walsh and Williams 19 Despite these advances, existing approaches centered on patient and facility-level conditions fall short in capturing systemwide transfer flows and facilitating informed interfacility coordination. More fundamentally, frameworks for translating transfer dynamics into actionable, geographically contextualized information for regional and state-level coordination remain limited.
In this article, we propose a typology-informed, spatial-network framework for characterizing interhospital transfer patterns at the system level, accounting for hospital attributes, transfer characteristics, and geographic context, to enhance situational awareness and inform transfer coordination decisions. Although retrospective analyses of transfer patterns have often been conducted,Reference Schultz, Koenig and Lewis 4 , Reference Baum, Vlaanderen and James 14 –Reference Franklin, Mitchell and Villarroel 16 a systematic approach leveraging network structural features to illuminate system-level stress, identify hub facilities central to care escalation, load balancing, and capacity recovery, and detect bottlenecks or failure points remains rare. Combined network and spatial analyses of transfer flows are even more limited. Addressing this gap is particularly important, as such an approach could generate substantial benefits when integrated into coordination centers’ information systems. By linking transfer types to observable structural patterns of patient flows in a geographic network of hospitals, the proposed framework seeks to help coordination centers capture and interpret transfer dynamics that are otherwise difficult to observe during emergencies, informing coordination strategies based on transfer purpose. We further demonstrate its applicability using the case of patient transfers during Hurricane Irma in Florida.
A Spatial Network Approach to Transfer Coordination
Coordinating Patient Transfers: Transfer Management and Load Balancing
A patient transfer refers to the physical movement of a patient from one facility to another, along with a formal handoff involving the transfer of information, authority, and responsibility for patient care.Reference Gosselin 20 The basic unit of interhospital transfer is a dyad of sending and receiving hospitals, yet these dyads are embedded in broader systems spanning local, regional, and state levels.Reference Ku, Cha and Lee 21 That is, at the dyad level, a transfer is an event that connects a patient from one hospital to another to address constraints in hospital capacity (the availability of resources such as staffed beds and intensive care units) or capability (the ability to deliver appropriate care, including specialized resources for specific patient populations).Reference Hick, Hanfling and Burstein 22 Individual transfer decisions are not independent, however; they collectively shape systemwide transfer patterns that recursively influence subsequent transfer decisions and, ultimately, system performance and the quality and equity of patient care.
The ASPR proposes two operational goals of transfer coordination in emergency response: transfer management and load balancing. Transfer management prioritizes arranging transfers to facilities where patients can receive the right care at the right time, primarily to ensure access to critical and specialty care. 12 Complementing this, load balancing redistributes patients from overloaded hospitals to less burdened ones, thereby maximizing the use of available resources. 12 Achieving these goals requires timely monitoring and interpretation not only of each hospital’s transfer behavior, capacity, and operational status, but also of collective transfer patterns across the system. In particular, capturing transfer patterns in relation to the geographic distribution of hospitals and disaster impacts is essential, as these factors jointly influence transfer distance, transport mode, transfer time, and which regional or state coordination center bears responsibility for managing transfer requests.Reference Mitchell, Taylor and Paulsen 7 , Reference Berkeveld, Rhebergen and Bloemers 8 , Reference Baum, Vlaanderen and James 14 , Reference Franklin, Mitchell and Villarroel 16 , Reference Kose, Kose and Akpinar 23 , Reference Lerner, Billittier and Sikora 24 Spatial network analysis can reveal otherwise hidden transfer dynamics while accounting for geographic context, and can provide richer information when combined with hospital- and patient-level data,Reference Hick, Toner and Hanfling 17 , Reference Ventura 25 as elaborated in the following section.
Spatial Transfer Networks: Concepts and Structural Indicators
A spatial network is a graph in which nodes are embedded in geographic space and edges represent relationships between them.Reference O’Sullivan, Fischer and Nijkamp 26 In a directed interhospital transfer network of this kind, geolocated hospitals serve as nodes, and patient flows from sending to receiving hospitals constitute directed edges. In a dynamic setting, node status (e.g., active or inactive in transfer activities) and attributes (e.g., occupancy and available resources) can change over time. Edges can similarly be weighted by quantifiable flow attributes, such as transfer volume or transfer time measured over a defined interval (e.g., hourly, daily, weekly, or a specific event), with the width of each edge reflecting transfer intensity or delay. Patient transfer urgency (e.g., emergency vs. nonemergency), clinical condition (e.g., trauma, stroke, or cardiac), and patient age (e.g., pediatric or adult) may further define network boundaries, depending on the scope and focus of coordination.
Capturing and monitoring interhospital transfers as a spatial network can inform coordination decisions by addressing key questions regarding transfer demand, capacity, and system vulnerability—questions that extend beyond the commonly asked one of which hospitals cannot find receiving facilities for their patients. These include:
-
• Which hospitals are the most central in patient transfer flows as major senders or receivers, and where are they located?
-
• Which hospitals face disproportionate incoming transfer volume relative to their outgoing transfer volume and care capacity?
-
• To what extent are transfers concentrated among a small number of referral or admission hospitals; which hospitals function as these hubs; and where are they located?
-
• How well connected is the transfer network locally, regionally, and statewide?
-
• Which hospitals, if removed, would fragment the network or isolate a subregion, and which anchor local clusters of transfer activity?
-
• Which communities are most structurally isolated in their access to acute and specialized care?
-
• Are any local or regional transfer subnetworks at risk of failing, and if so, where?
-
• Are hospitals transferring within their designated regions or crossing regional boundaries, and in what patterns?
These questions are particularly well suited to a spatial network lens. For example, even when hospital capacity information is available, hospitals that transfer or receive the most patients, or that play central roles by admitting, stabilizing, and redistributing patients across many hospitals within and beyond their regions, cannot be identified without understanding systemwide transfer patterns. This systemwide view is also pivotal for assessing whether, and where, the system is at risk of breaking down or impeding response efforts.Reference Tsai, Cheng and Hsu 27 , Reference Lee, McGlone and Song 28
Table 1 presents basic network measures organized by analytical level and key coordination indicators, along with the observable transfer features each measure captures with or without hospital-level situational data.Reference Lee, McGlone and Song 28 –Reference Newman 30 These measures are often applied without spatial informationReference Ku, Cha and Lee 21 , Reference Tsai, Cheng and Hsu 27 , Reference Lee, McGlone and Song 28; however, their interpretation becomes richer and may even shift when nodes and edges are spatially embedded. For example, when interhospital distance is incorporated as an edge attribute, a dominance of short-distance transfers may reflect stable localized patient redistribution during emergencies, whereas long-distance, high-volume transfers may signal system-level capacity stress arising from local or regional system failures. Measures such as spatial betweenness centrality, defined using distance or travel time, can help identify hospitals on geographically efficient transfer pathways—those positioned as natural intermediaries given both the network structure and the spatial distribution of hospitals. This is particularly important for identifying hospitals that function as high-efficiency bridges between disaster-affected facilities and those with available capacity for scarce specialized care. Spatial modularity and the spatial clustering coefficient can identify closely connected hospital subgroups for patient redistribution and reveal whether transfer clusters are driven more by physical proximity, institutional arrangements (e.g., health care coalitions, trauma service areas, and EOC or MOCC coordination), or both.Reference Han, Wan and Horns 31
Basic network measures for transfer coordination decision-making

Table 1. Long description
The table is organized into three columns: Level, Coordination indicator, and Network measure (network feature).
Under the Node level, there are five coordination indicators:
1. Sending hospitals: Measured by Out-degree (number of outgoing edges) and Out-strength (sum of outgoing edge weights).
2. Receiving hospitals: Measured by In-degree (number of incoming edges) and In-strength (sum of incoming edge weights).
3. Hospital transfer position (net sender, net receiver, or balanced): Measured by Net flow (difference between in-strength and out-strength) and Inflow share (ratio of in-strength to the sum of in- and out-strength).
4. Hospital hub role (sending, receiving, or dual): Measured by Out-degree centrality (proportion of outgoing edges) and In-degree centrality (proportion of incoming edges).
5. Hospital criticality as a bridge: Measured by Betweenness centrality (proportion of shortest paths passing through a node) and Articulation point (a node whose removal disconnects the system).
Under the Network level, there are six coordination indicators:
1. Systemwide connectivity: Measured by Density (proportion of observed edges to maximum possible).
2. Total transfer volume: Measured by Total flow (sum of all edge weights).
3. Outbound concentration: Measured by Out-centralization (extent to which transfers are concentrated in a few sending hospitals).
4. Inbound concentration: Measured by In-centralization (extent to which transfers are concentrated in a few receiving hospitals).
5. Transfer regionalization: Measured by Modularity (degree of partitioning into distinct transfer subgroups).
6. Transfer cohesion: Measured by Global clustering coefficient (ratio of closed triplets to all connected triplets).
Patient Transfer Typology and Coordination Function
The basic network measures provide a toolkit for coordination centers to analyze and understand the structural features of interhospital transfer networks in geographic context, thereby supporting situational awareness and transfer coordination. In particular, density can inform assessments of systemwide interhospital connectivity for patient transfer, and total flow can help monitor systemwide transfer volume. Centralization measures capture the extent to which the system relies on a small number of hospitals for transfers, with node-level measures identifying these hospitals and the direction and magnitude of their roles. Modularity and the global clustering coefficient reflect how strongly transfers are organized within distinct hospital groups and the overall tendency toward clustering in the transfer network, respectively. However, to draw practical implications for transfer management and load balancing, these measures should be interpreted in light of transfer direction (upward, lateral, or downward) and purpose across levels of care. We therefore propose a typology of patient transfers and suggest how the network measures presented in Table 1 can map onto specific transfer types to inform transfer coordination decisions.
Upward transfers refer to the movement of patients to higher-level facilities for care escalation. In the United States, hospitals are stratified by trauma care capability into trauma and non-trauma centers, with trauma centers further subdivided into levels according to the scope and complexity of specialized care they can provide. For example, in Florida, adult trauma centers are designated as Level I and Level II, with Level I centers providing the highest level of care. Pediatric trauma centers are designated separately, and Level I and select Level II adult centers also provide pediatric trauma services. Upward transfers typically occur from non-trauma centers to trauma centers or from lower- to higher-level trauma centers. Trauma centers, especially those providing highly specialized care for complex medical conditions, are limited in number and often experience patient surges from both direct admissions and transfers during emergencies. Effective coordination thus requires identifying tertiary hospitals with high incoming transfer volumes, broad connections with many sending hospitals, and wide geographic catchments, as well as non-tertiary hospitals with high outgoing transfer volumes to these hubs. Combined with real-time hospital capacity monitoring,Reference Baum, Vlaanderen and James 14 , Reference Hick, Toner and Hanfling 17 such identification can facilitate the appropriate and timely matching of patients with specialized critical care. Node-level measures, particularly in- and out-degree, in- and out-strength, and in- and out-degree centrality, directly support this. At the network level, in-centralization indexes system vulnerability to admission hub failures.
Downward transfers are increasingly recognized as an important mechanism for load balancing. Successful load balancing depends on leveraging capacity at lower-level trauma or community hospitals to treat stable, lower-acuity patients. 12 , Reference Carmichael, Balls and Bledsoe 32 , Reference Ceferino, Mitrani-Reiser and Kiremidjian 33 Downward transfers include the redirection of patients from higher- to lower-level facilities capable of meeting their care needs, as well as the transfer of patients who were previously critically ill but no longer require specialized care after stabilization and treatment. Both cases aim to preserve staffed beds and other critical resources in tertiary hospitals for newly arriving acute patients requiring specialty care. Out-degree, out-strength, and out-degree centrality identify tertiary hospitals that offload stable patients to lower-level facilities, whereas in-degree, in-strength, and in-degree centrality identify non-tertiary hospitals that admit them for step-down care. Net flow and inflow share, especially when computed from both upward (incoming) and downward (outgoing) transfer volumes at a hub, provide additional insight into the sustainability of offloading and the hub’s contribution to system-level critical care capacity. Specifically, a tertiary hub’s net-sender or balanced position, where downward offloading matches or exceeds upward absorption, indicates active capacity preservation, whereas a net-receiver position with high net inflow reflects absorption outpacing offloading and may signal that the hub is approaching saturation. Combined with real-time bed and staffing data, these measures can offer coordination centers early indicators of where capacity is being preserved and where it is being exhausted.
Patient transfers between comparable hospitals can help the system achieve a more efficient and equitable distribution of strain through load balancing and better align patient needs with clinical capabilities across hospitals. Lateral transfers can occur from more strained to less strained hospitals with available staffed beds and critical clinical resources, both across non-tertiary hospitals and among tertiary hospitals.Reference Zhou, Zhang and Gou 1 , Reference Nagata, Himeno and Himeno 2 , Reference Schultz, Koenig and Lewis 4 Yet, because a large proportion of disaster-affected patients tend to have low acuity, their redistribution among non-tertiary hospitals—particularly from highly affected to less or unaffected ones in the same or neighboring regions—often becomes central to lateral transfer coordination.Reference Kahn, Schultz and Miller 34 Capturing and coordinating regional transfer groups is therefore critical, particularly for identifying underserved communities with limited access to care and connecting them to hospitals with available capacity within a reasonable distance. Given this, modularity, along with methods for identifying transfer subgroups (e.g., community detection algorithms), can serve as core network measures.Reference Han, Wan and Horns 31 Interpreting these measures in relation to geographic and administrative boundaries can also help coordination centers assess whether existing regional and administrative boundaries function effectively as coordination mechanisms, and reconsider them when warranted. Node-level measures identifying central sending and receiving hospitals (in- and out-degree, in- and out-strength, and in- and out-degree centrality), intergroup bridges (betweenness centrality and articulation points), and transfer positions (net flow and inflow share) are relevant across all transfer types. For lateral transfers in particular, bridge measures are critically pertinent, complementing network-level measures such as modularity and, potentially, the global clustering coefficient. Table 2 summarizes this typology.
Spatial-network typology for patient transfer coordination

Table 2. Long description
The image consists of three network diagrams representing different spatial-network structures.
1. Upward Transfer: At the bottom are four small circular nodes labeled N T. Arrows from each of these nodes point upward and converge at a single, larger central circle labeled Tertiary Hub. A bracketed label at the top left reads c, d, t-time, and t-mode.
2. Downward Transfer: At the top is a large central node labeled Tertiary Hub. Four arrows point downward from this hub to four smaller circular nodes labeled N T at the bottom. A bracketed label at the top left reads c, d, t-time, and t-mode.
3. Lateral Transfer: This panel shows two separate clusters of nodes. In the first cluster, node A points to node B. In the second cluster, node D points to nodes C, E, and F. Node C points to node F. Nodes E and F are connected by bidirectional arrows. A bracketed label at the top left reads c, d, t-time, and t-mode.
Note. c = transfer category defining network boundary (e.g., emergency vs. nonemergency, adult vs. pediatric); d = distance; t-time = travel time; t-mode = transport mode (e.g., ground, air); T = tertiary facility; NT = non-tertiary facility; solid arrow = patient transfer.
Illustrative Application: Patient Transfers During Hurricane Irma in Florida
Florida is one of the most disaster-prone states in the United States, periodically requiring hospital evacuations and large-scale emergency patient transfers. In 2017, Hurricane Irma struck the state as a Category 4 hurricane, resulting in 84 fatalities and approximately $50 billion in damages across all 67 counties. 35 During the response, Florida relied primarily on ESF-8 (Emergency Support Function for Public Health and Medical Services) coordination within state and local EOCs to support health care facilities facing evacuation and transfer demands. Although the state’s data practices in transfer coordination are not well documented, the Florida Agency for Health Care Administration (AHCA), as an ESF-8 support agency, collects and maintains inpatient discharge data from all licensed hospitals and monitors hospital capacity, damage, and evacuation status during emergency responses.
While hospital capacity data during the hurricane were not accessible for this study, we constructed interhospital transfer networks using AHCA inpatient discharge data. These data contain patient pseudo-Social Security numbers (pseudo-SSNs), admission and discharge dates, point of origin, and discharge disposition from 301 licensed hospitals, including 10 Level I trauma centers, 23 Level II trauma centers (2 offering pediatric trauma services), and 2 pediatric trauma centers. Patient transfers were identified by matching records with identical pseudo-SSNs in which a patient was discharged from one hospital with a transfer designation and subsequently admitted to another hospital through transfer on the same or following day. Although Hurricane Irma’s declared impact period in Florida was September 4 through October 18, 35 we selected a study window of July 24 through November 29 to capture hurricane-related changes in transfer dynamics, including 6 weeks before and after the impact period.
The transfer networks were mapped onto a Florida base map, with hospital nodes and weighted directed edges representing interhospital transfer relationships. Hospital street addresses were geocoded to point locations and projected to the NAD 1983 Florida GDL Albers coordinate system. Transfer distances between sending and receiving hospitals were calculated using the Haversine formula. County-level homeowner property damage data from the Federal Emergency Management Agency (FEMA) were overlaid as a proxy for the geographic scope and severity of the hurricane’s physical impacts, although all counties statewide were affected. FEMA Housing Assistance Data, obtained through the OpenFEMA data portal, 40 contain total property damage assessments for homeowners registered in the Individuals and Households Program at the ZIP code level. We aggregated these records to the county level for the map overlay. We also overlaid the boundaries of Florida State Emergency Response Team (SERT) regions, the state-defined emergency planning and response coordination units in effect in 2017. All mapping and network analyses were conducted using R packages including sf, tigris, and igraph. Reference Pebesma 36 –Reference Csardi and Nepusz 38 The Institutional Review Board (IRB) of Florida State University reviewed this study and determined that it does not meet the federal definition of human subjects research (IRB Protocol #STUDY00002855).
Figure 1 illustrates the spatial distribution of Florida hospitals and their transfer relationships during the hurricane period. The map provides foundational information on the state’s mid-storm transfer dynamics by showing which hospitals participated in transfers, their locations relative to affected areas and emergency response regions, and the transfer routes among them. The network measures presented in Table 1 offer a more detailed interpretation of these spatial and relational patterns, as summarized in Table 3 across the pre-, during-, and post-hurricane periods. Of the 301 licensed hospitals, 285 (95%) participated in transfers as senders, receivers, or both. A total of 7,684 transfers occurred through 1,837 directed edges, resulting in a network density of 0.023 among active hospitals. This indicates that, although transfers during the disaster occurred on a large scale, transfer routes were sparse, covering only 2.3% of all pairwise possible pathways. Out-transfer volumes varied across hospitals from 0 (16 operating hospitals with no recorded transfers) to 197, with a median of 21, indicating a highly skewed distribution of transfer activity.
Spatial network of Florida interhospital transfers during Hurricane Irma.

Figure 1. Long description
A map of Florida is overlaid with data points and regional shading.
Legend on the West side:
* Hospital Type: Red circles for Level I Trauma, orange for Level I I and Pediatric Trauma, yellow for Level I I Trauma, light blue for Pediatric Trauma, and dark blue for Non-Trauma Hospitals.
* Out-Transfer Volume by Facility: Represented by circle size, ranging from 0 to 197.
* Total Damage: A grayscale gradient from white at $0.00 M to dark gray at $24.72 M.
* Emergency Response Region: Indicated by thick black boundary lines.
Map Details:
* The Y-axis shows latitude from 25 degrees North to 31 degrees North. The X-axis shows longitude from 88 degrees West to 80 degrees West.
* Total Damage shading is concentrated in the Northeast near Jacksonville and the Southeast near Miami and the Florida Keys, with some dark gray regions on the central East coast.
* Hospital distribution: Non-trauma hospitals (dark blue) are scattered throughout the state. Level I Trauma centers (red) are located in major urban hubs including Jacksonville in the Northeast, Gainesville in the North-Central, the Tampa Bay area on the West coast, and the Miami-Fort Lauderdale area in the Southeast.
* Out-transfer volumes are highest in the North-Central and Southeast regions, indicated by larger circle diameters.
Structural characteristics of the Florida interhospital transfer network by period

Table 3. Long description
The table consists of 10 rows of metrics across three time periods: Pre-hurricane (July 24 to September 3), Hurricane (September 4 to October 18), and Post-hurricane (October 19 to November 29).
* Node: 286 (Pre), 285 (Hurricane), 285 (Post).
* Edge: 1,694 (Pre), 1,837 (Hurricane), 1,722 (Post).
* Total flow: 6,639 (Pre), 7,684 (Hurricane), 6,515 (Post).
* Density: 0.021 (Pre), 0.023 (Hurricane), 0.021 (Post).
* In-centralization: 0.176 (Pre), 0.168 (Hurricane), 0.180 (Post).
* Out-centralization: 0.095 (Pre), 0.108 (Hurricane), 0.092 (Post).
* In-strength centralization: 0.885 (Pre), 0.882 (Hurricane), 0.883 (Post).
* Out-strength centralization: 0.872 (Pre), 0.866 (Hurricane), 0.874 (Post).
* Modularity: 0.811 (Pre), 0.791 (Hurricane), 0.803 (Post).
* Global clustering coefficient: 0.264 (Pre), 0.259 (Hurricane), 0.253 (Post).
Note. In- and out-strength centralization values range from 0 (uniform distribution) to 1 (concentration in a single node).
Note. Node (circle) color indicates hospital type; node size is proportional to out-transfer volume. Edge width reflects directed transfer volume (sender to receiver) for each unique hospital pair during the hurricane period; edge directions are preserved in the underlying data but not visually displayed for clarity. County shading reflects total FEMA housing assistance damage (USD).Thick black lines mark Florida SERT region boundaries.
Note. In- and out-strength centralization apply Freeman’s formulaReference Freeman 39 to in- and out-strength values, ranging from 0 (uniform distribution) to 1 (concentration in a single node).
Transfer connections were relatively evenly distributed, as shown in the map and reflected in the low in-centralization (0.168) and out-centralization (0.108). However, the markedly higher in-strength centralization (0.882) and out-strength centralization (0.866) indicate that a small number of hospitals accounted for a disproportionate share of transfer volume in both directions. The high modularity (0.791) indicates that the transfer network was compartmentalized into relatively distinct regional subgroups, while the low global clustering coefficient (0.259) suggests a limited tendency toward triadic closure, implying that densely connected local transfer clusters among hospitals were relatively uncommon. These network-level structural characteristics remained largely stable across the three study periods, despite increases in the number of edges (8.4%) and total flow (15.8%) during the hurricane period compared to the pre-hurricane period. Although FEMA homeowner damage data provide only a partial proxy for disaster impact, overlaying the geographic distribution of damage with transfer patterns provides useful context: transfer demand may not scale linearly with damage severity, as densely populated but moderately damaged areas may still generate high transfer volumes.
The daily distribution of transfers during the study period, plotted in Figure 2, provides a complementary view of interhospital transfer dynamics. Transfer demand peaked on September 8 at 378 transfers, a 139% increase from the pre-hurricane mean of 158.1, before dropping sharply to a minimum of 25 on September 10. Daily total flows then rebounded to 318 on September 13, remaining elevated on September 14 (251) and 15 (267) before declining again. Given that the hurricane made landfall on September 10 and moved across Florida through September 11, these patterns indicate a concentration of transfers immediately before landfall, a near-complete halt during the storm’s passage, and a reactivation of transfers as the storm exited the state. Although the AHCA data do not indicate whether a transfer was associated with hospital evacuation or storm-related injury, the timing suggests that many transfers likely reflected evacuation-related movements in the early hurricane period and return transfers in the later period, while daily critical care transfers likely remained at similar levels throughout. This interpretation is supported by the predominance of lateral transfers on peak-flow dates, as shown in the transfer type breakdown.
Daily transfer volume around Hurricane Irma by transfer type.

Figure 2. Long description
The figure consists of four panels sharing a common X-axis (Date from July 24 to November 27) and Y-axis (Number of Transfers from 0 to 300+). A red shaded area with dashed borders marks an event period from September 04 to October 16. Each panel includes a horizontal dotted line representing the pre-event mean.
* Overall Panel (Top): Shows a fluctuating baseline. Within the shaded region, it reaches a Peak on Sep 08 with n = 378 and a Min on Sep 10 with n = 25. Pre-event mean = 158.1.
* Upward Panel (Second): Shows low-volume activity. Within the shaded region, it reaches a Peak on Sep 07 with n = 70 and a Min on Sep 10 with n = 5. Pre-event mean = 29.9.
* Lateral Panel (Third): Closely mirrors the Overall trend. Within the shaded region, it reaches a Peak on Sep 08 with n = 291 and a Min on Sep 10 with n = 10. Pre-event mean = 92.8.
* Downward Panel (Bottom): Shows low-volume activity with a delayed peak. Within the shaded region, it reaches a Peak on Sep 13 with n = 80 and a Min on Oct 15 with n = 9. Pre-event mean = 35.3.
Upward transfers similarly peaked in the early hurricane period, though at a much smaller volume than lateral transfers. Downward transfers, however, peaked three days after landfall, indicating a time lag between the acute surge in transfers to tertiary care and subsequent step-down transfers. Monitoring these dynamics in real or near-real time, particularly when and where transfer activity surges or declines, is critical for coordination centers to respond to fast-evolving transfer demand and account for lags between surge and recovery, especially in critical care. This situational awareness can support early identification of bottlenecks, strategic resource reallocation, and continuity of coordination during evolving disasters.
Figure 3 further illustrates the utility of the spatial network approach proposed in this study by mapping type-specific transfer patterns, including node-level trauma designation, inflow intensity, and articulation points, during the three peak days of each transfer type: upward (September 7), lateral (September 8), and downward (September 13). The maps reveal that non-trauma hospitals, particularly those in metropolitan areas, were predominantly active in lateral and downward transfers, whereas upward transfers concentrated patient flows at trauma centers, with active hospitals and transfer patterns shifting across the three peak days. Node sizes, reflecting facility-level inflow intensity measured as inflow share multiplied by in-strength, directly identify which hospitals bore high incoming transfer burden for critical care (upward), load balancing and care management (lateral), and capacity offloading (downward). The articulation points identified on the lateral transfer maps further highlight hospitals critical to maintaining network connectivity for load balancing and transfer management.
Interhospital transfer subnetworks on peak transfer days during Hurricane Irma.

Figure 3. Long description
A multi-panel grid with 3 rows and 4 columns. The rows are labeled Sep 07, 2017, Sep 08, 2017, and Sep 13, 2017. The columns are labeled Lateral, Upward, Downward, and Upward plus Downward. Each panel contains a map of Florida with county outlines.
* The Lateral column shows colored circles and blue lines primarily concentrated along the coastlines and the Panhandle. On Sep 13, there is a high density of blue circles in the Southwest and Southeast regions.
* The Upward column uses colored circles and red lines. On Sep 07, activity is concentrated in the Southeast. By Sep 08, a thick red line indicates significant movement in the North-Central region. By Sep 13, activity is scattered across the Central and Southern regions.
* The Downward column uses colored circles and green lines. Activity is sparse on Sep 07, increases in the Panhandle and Central regions on Sep 08, and shows clusters in the West-Central and Panhandle regions on Sep 13.
* The Upward plus Downward column combines the red and green data. It shows the highest density of movement in the Southeast on Sep 07, the North-Central and West-Central regions on Sep 08, and the West-Central and Panhandle regions on Sep 13.
Note. Node (circle) color reflects trauma designation, as detailed in Figure 1. Node size represents volume-adjusted inflow intensity (inflow share multiplied by in-strength). Black rings in lateral subnetworks mark articulation points. Edge color indicates transfer direction: blue (lateral), red (upward), green (downward). Edge width reflects daily directed transfer volume between each hospital pair; directions are preserved in the data but not displayed for clarity. Thick black lines mark SERT regional boundaries.
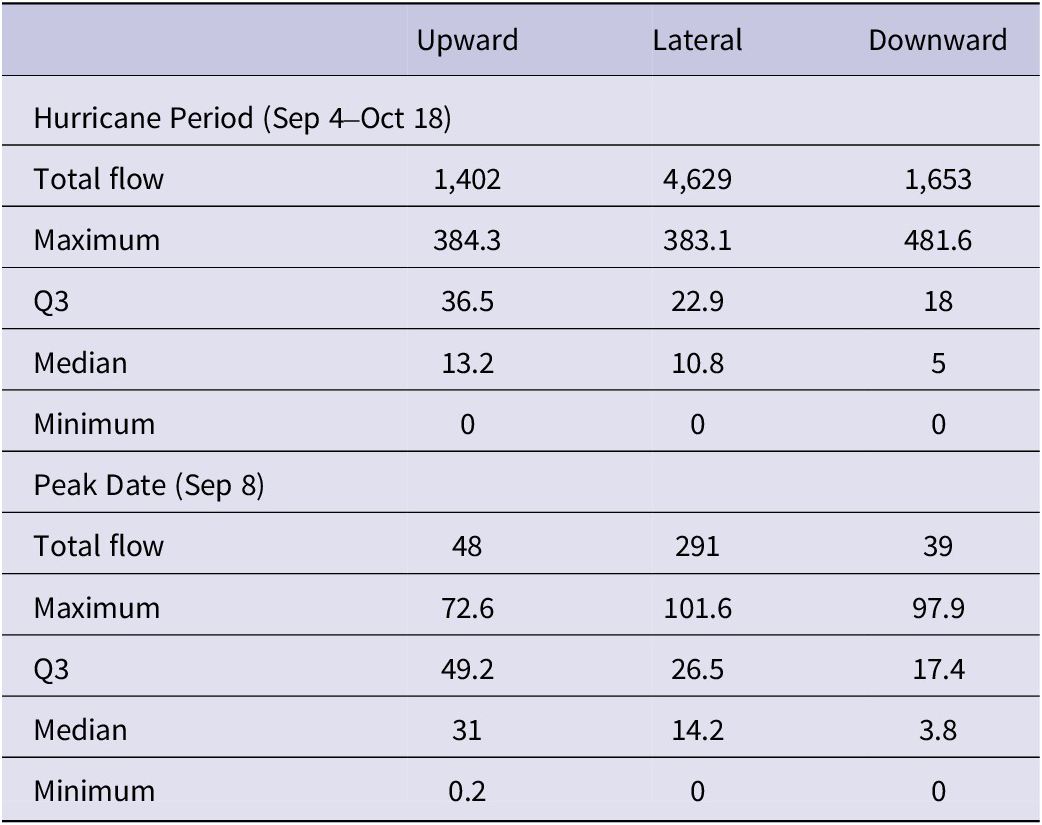
Table 4 summarizes the distribution of transfer distances by type during both the overall hurricane period and the peak transfer day. The results suggest that patient redistribution during disasters tends to favor local or regional transfers, with extended-distance transfers occurring as needed depending on the geographic distribution of hospital resources. Such monitoring of transfer distances, whether event-level or daily, alongside maps and changes in transfer counts, can help coordination centers determine whether transfers occur locally or at a distance from origin hospitals, identify their destinations when distant transfers occur, and inform decisions on transport resources and the emergency response regions involved in transfer coordination.
Transfer distances (miles) by transfer type during the hurricane and on the peak date

Table 4. Long description
The table is organized into four columns: Metric, Upward, Lateral, and Downward.
Section 1: Hurricane Period (September 4 to October 18)
* Total flow: Upward 1,402; Lateral 4,629; Downward 1,653.
* Maximum distance: Upward 384.3; Lateral 383.1; Downward 481.6.
* Q 3: Upward 36.5; Lateral 22.9; Downward 18.
* Median: Upward 13.2; Lateral 10.8; Downward 5.
* Minimum: 0 for all three types.
Section 2: Peak Date (September 8)
* Total flow: Upward 48; Lateral 291; Downward 39.
* Maximum distance: Upward 72.6; Lateral 101.6; Downward 97.9.
* Q 3: Upward 49.2; Lateral 26.5; Downward 17.4.
* Median: Upward 31; Lateral 14.2; Downward 3.8.
* Minimum: Upward 0.2; Lateral 0; Downward 0.
Note. A value of 0 represents transfers between facilities sharing the same street address.
Note. A value of 0 indicates transfers between facilities sharing the same street address.
Conclusions
The need for coordinating interhospital patient transfers as a mechanism of transfer management and load balancing during disasters has grown, alongside increasing demand for data analytics to support situational awareness and decision-making at MOCCs and other centralized coordination bodies. However, little attention has been paid to what data these centers should be equipped with and how such data should be analyzed to inform coordination processes. To address this gap, we have proposed a framework for analyzing and interpreting interhospital transfer dynamics as spatial networks, translating type-specific transfer patterns into practical and actionable coordination information. Using administrative inpatient data from the Florida health agency, we have further demonstrated the framework’s applicability and utility in a real-world coordination setting, showing how such data can be converted into spatial networks for visualization and analysis, alone or in combination with other data sources. We believe this study represents an important step forward, particularly as automated data collection techniques and analytic tools for public health information continue to advance. However, the proposed framework may require further refinement as it is adopted in practice, and discussions on data requirements and implementation challenges will be necessary to fully integrate these analytic approaches into coordination centers’ information systems, policies, and practices.
Author contribution
Minyoung Ku: Conceptualization, formal analysis, software/visualization, investigation, data curation, writing—original draft, writing—review and editing, project administration. Dohyo Jeong: Formal analysis, software/visualization, investigation. Keon-Hyung Lee: Formal analysis, software/visualization, investigation. Soonwoo Choi: Investigation.
Competing interests
The authors declare no competing interests.



 Open access

