


Introduction
There is compelling evidence that democratic governments have constantly added new policies to their policy portfolios to confront societal, economic and ecological challenges. This phenomenon of ‘policy accumulation’ (Adam et al., Reference Adam, Hurka, Knill and Steinebach2019) has been described from different analytical angles, including the concepts of rule growth (Jakobsen & Mortensen, Reference Jakobsen and Mortensen2015) or policy layering (Daugbjerg & Swinbank, Reference Daugbjerg and Swinbank2016). Policy accumulation is not only driven by vote‐seeking politicians who aim to demonstrate responsiveness to the public and interest groups demanding action (Rasmussen et al., Reference Rasmussen, Reher and Toshkow2019). Policies are also governments’ primary problem‐solving tool as they allow to deal ‘with issues and problems as they arise’ (Orren & Skowronek, Reference Orren and Skowronek2017, p. 3). While politicians thus have quite strong incentives to come up with new policies constantly, it is less rewarding to cut back existing policy provisions, even when they have turned out to be largely ineffective. Policies, once adopted, create expectations and dependencies for their beneficiaries, and they are thus challenging, if not impossible, to terminate or dismantle (Bauer et al., Reference Bauer, Green‐Pedersen, Héritier and Jordan2012; Pierson, Reference Pierson1994). In combination, these underlying incentive structures trigger governments to adopt more policy targets and instruments than they eliminate over time – regardless of the exact policy sector in question.
There are several reasons why we should care about this phenomenon. Existing research suggests that ‘a landscape densely laden with policies’ (Mettler, Reference Mettler2016, p. 367) does not only increase the chance for policy conflict and controversy but also lowers the citizens’ ability to assign responsibility for political success and failure (Hinterleitner, Reference Hinterleitner2022). Moreover, policy accumulation can overburden the implementing authorities, shifting them ‘from a Weberian to a Kafkaesque bureaucracy’ (Gratton et al., Reference Gratton, Guiso, Michelacci and Morelli2021). This is the case if ‘too many and too frequent laws overload […] the bureaucracy with too many acts to implement’ (p. 2965). Limberg et al. (Reference Limberg, Steinebach, Bayerlein and Knill2021) make a similar observation showing that an ‘ever‐growing stock of rules might negatively affect the achievement of intended policy targets if the burdens of rule implementation are not matched by corresponding increases in administrative capacities’ (p. 449).
These insights point to the need to advance our knowledge of potential ‘drivers’ and ‘brakes’ of policy accumulation. In this regard, the academic debate is still in its infancy. Existing scholarly contributions have primarily concentrated on institutional factors that might affect the dynamics of policy growth, including bureaucratic capacities or the patterns of vertical coordination between policy‐producing and policy‐implementing bureaucracies (Fernández‐i‐Marín, Knill, et al., Reference Fernández‐i‐Marín, Knill, Steinbacher and Steinebach2023; Knill et al., Reference Knill, Steinbacher and Steinebach2021). Moreover, studies on rule growth have placed particular emphasis on endogenous growth dynamics, arguing that rules, once adopted, create a constant need for the development of additional laws and regulations (‘rules breed rules’) (March et al., Reference March, Schulz and Zhou2000; van Witteloostuijn & de Jong, Reference Van Witteloostuijn and De Jong2010). Political determinants of policy accumulation, by contrast, have remained largely unexamined. Apart from research on the effects of party positions on administrative rules in Denmark (Jakobsen & Mortensen, Reference Jakobsen and Mortensen2015), there is a lack of comparative studies that systematically look at the influence of political factors on policy accumulation. This research gap is particularly striking, considering that policy accumulation is not (only) a technocratic and functionally driven but, first and foremost, also a political phenomenon.
This article offers a first contribution to addressing the role of political factors in policy accumulation. More precisely, we focus on the impact of governments’ party ideologies on policy accumulation in social policy. Social policy is particularly suited to analysing this relationship for three reasons. First, social policy is marked by party‐political differences along the classical left–right dimension. Second, social policy is a comparatively long‐established field. Consequently, policy accumulation should be less dynamic than for younger areas, such as environmental policy, which only took off in the early 1970s. Given the maturity of the social policy field, the impact of political parties on accumulation patterns plays a stronger role than for younger policy fields in which new problem pressures can be expected to lead to relatively similar responses across parties. Third, social policy is still predominantly developed at the national level. International and supranational influences that might blur the effects of party differences are thus comparatively limited.
Our analysis builds on an extensive data set covering policy accumulation in three subfields of social policy (pensions, unemployment, child benefits) for 22 OECD countries over 30 years (1976–2005). We find that the probability of social policy accumulation is not affected by the government's ideological position. In other words, left governments do not produce larger social policy portfolios than right ones. However, this striking result does not contradict the traditional partisan theory, as left and right parties accumulate for different reasons. While left parties produce new social policies to broaden the scope of the welfare state, right parties use new policy instruments to reform and ‘condition’ social benefits. These findings hold regardless of how we measure governments’ ideological positions and despite strong endogenous policy growth dynamics, that is, countries with greater policy portfolios also display higher rates of policy accumulation. In sum, our findings indicate that party political considerations can explain the reasons for but not the level of policy accumulation. Changes in government are thus unlikely to stall or slow down the constant expansion of public policy portfolios.
The remainder of this paper is structured as follows. In the second section, we discuss the concept and the consequences of policy accumulation in greater detail. In the third section, we develop our theoretical expectations regarding the effect of the government's party positions on social policy accumulation. In the fourth section, we present our research design and methodology. Empirical findings are presented and discussed in the fifth section. The last section concludes.
The concept and the consequences of policy accumulation
Policy accumulation is the result of the continuous addition of new policy elements to existing policy portfolios without the compensatory reduction of already existing ones. Policy elements capture both policy targets (defining who or what is being addressed) and policy instruments (defining how the target is being addressed) (Hall, Reference Hall1993). Simply put, policy accumulation occurs whenever governments adopt new policy targets or instruments without abolishing existing ones. The concept of policy accumulation thus offers a distinctive perspective on policy change.
First, the concept of policy accumulation captures the aggregate patterns of policy outputs. The central unit of analysis is thus a country's policy portfolio size and its changes over time. Policy accumulation hence goes beyond approaches that are concerned with explaining changes at the level of individual policies such as whether and why a specific policy has been adopted (Kingdon, Reference Kingdon2003; Sabatier, Reference Sabatier1988). Second, the concept of policy accumulation is explicitly different from other aggregate measures of public policy and policy change, such as welfare state generosity in at least two ways.
One key difference is that policy accumulation focuses on the number of policy elements (policy targets and instruments) in a given sector. The central focus is on the addition of new policy targets and instruments rather than on changes in the settings of policies. To illustrate this difference, let us consider legislation granting mothers a bonus for giving birth. In the ‘accumulation logic’, this provision represents the production of an additional policy element as it combines a new policy instrument (a one‐time payment) with a specific policy target (the mothers of newborn children). By contrast, a reform that only alters the amount of money being paid for giving birth would not be considered relevant as it does not affect the number of elements in a country's policy portfolio. As discussed in more detail below, it is primarily the number of policy targets and instruments and not so much their exact calibration that creates complexity and administrative burden.
Another difference is that policy accumulation measures the ‘penetration and internal differentiation of a policy field’ (Adam et al., Reference Adam, Hurka, Knill and Steinebach2019, p. 17). It does not provide or include any information on how ‘well’ a state treats the individuals or families receiving the welfare state benefits. High levels of social protection, for instance, could be achieved by both a low (e.g., a universal basic income scheme) and a high (e.g., multiple supplementary support programmes) number of public policies in place.
While other aspects of public policies, such as the overall level of welfare state generosity, definitely have a great impact on the citizens’ perceptions of their government's performance (Kumlin & Haugsgjerd, Reference Kumlin, Haugsgjerd, Zmerli and van der Meer2017), there are several distinct reasons why it is important to study policy accumulation. First, policy accumulation has the potential to undermine the input legitimacy of democratic governments by impeding the citizens’ ability to hold their governments accountable. While governments could theoretically react in multiple ways to the citizens’ demands for greater social protection (e.g., by simply increasing the generosity of existing measures), they typically do so by adopting new social policy instruments. This way, policy accumulation inevitably creates more and more complex policy mixes with often interacting and interdependent policy targets and instruments (Limberg et al., Reference Limberg, Knill and Steinebach2023). This, in turn, implies that a greater number of governmental interventions will not work out as planned and trigger policy controversies (Hinterleitner, Reference Hinterleitner2022, p. 3). As Bovens and ‘t Hart (Reference Bovens and ‘t Hart2016) put it, only ‘a part of this myriad of ambitions and activities unfolds as hoped (…) [while] [a]nother part throws up surprises, complications, delays, disappointments, and unintended consequences’ (p. 654).Footnote 1 At the same time, however, the accumulating array of interacting policy targets and instruments in existing policy portfolios makes it more difficult (if not impossible) to assess whether the policy measures taken by the government make a substantial difference in the outcome addressed (Sager & Andereggen, Reference Sager and Andereggen2012). Taken together, policy accumulation thus might lead to a greater chance of political conflict but overall less ability to assign political responsibility.
Second, policy accumulation can undermine government's implementation effectiveness, challenging the output legitimacy of democratic systems. The constant production of new policies directly translates into new administrative burdens for the authorities in charge of implementation. In a perfect world, newly adopted policies should thus go hand in hand with the provision of additional administrative resources needed for their implementation. In reality, however, this is not always the case (Gratton et al., Reference Gratton, Guiso, Michelacci and Morelli2021). Recent empirical evidence suggests that the policies up for implementation in industrialized democracies have increased much stronger than the states’ administrative backing over the last decades – leaving a substantial ‘gap’ between what is needed and what is available to make policies properly work (Dasgupta & Kapur, Reference Dasgupta and Kapur2020; Fernández‐i‐Marín, Hinterleitner, et al., Reference Fernández‐i‐Marín, Hinterleitner, Knill and Steinebach2023). Analysing the case of Portugal, for instance, Lourenço (Reference Lourenço2023) finds ‘that the number of public officials has not changed significantly during the last decades [while there is] a general trend to accumulate public policies and rules’ (p. 7). The author considers ‘this a strong signal of decreasing administrative capacity to manage those policies and rules, thus creating administrative overload’ (ibid.). Adam et al. (Reference Adam, Hurka, Knill and Steinebach2019) make a similar observation in the case of social policy administration in Germany. Here, the key finding is that ‘despite some variation across different authorities, the aggregate burdens of policy implementation have in fact constantly increased for almost all of them’ while ‘public sector employment (…) has constantly declined across all state levels over the past decades’ (ibid., p. 112). Implementers might find different ways to cope with overburdening (Tummers et al., Reference Tummers, Bekkers, Vink and Musheno2015). They might, for instance, start ‘creaming’, prioritizing easier cases (e.g., applicants for social benefits) over more complicated ones (Vedung, Reference Vedung2015). In the end, however, all these coping strategies have detrimental effects on the proper functioning of public policies (Kaplaner & Steinebach, Reference Kaplaner and Steinebach2023).
In sum, it should become clear that policy accumulation is a distinct concept that captures facets of public policies not yet covered by other approaches. Moreover, the continuous growth of policy portfolios has the potential to affect the smooth functioning of modern democracies.
Party difference and social policy accumulation: Competing expectations
As discussed in the previous section, policy accumulation provides an analytical perspective different from established public policy and policy change accounts. This brings about different theoretical challenges. We cannot simply transfer theories and explanations that have been developed for entirely different phenomena. Yet, several studies reveal that policy accumulation is not only a dominant feature of modern democracies but also that the level of accumulation varies considerably across countries and sectors (van Witteloostuijn & de Jong, Reference Van Witteloostuijn and De Jong2010).
Attempts to explain this variance have so far concentrated on technocratic or structural reasons, such as administrative capacities, institutional structures or endogenous dynamics of rule growth. The fact that policy accumulation is primarily a political phenomenon has been largely ignored so far (but see Gratton et al., Reference Gratton, Guiso, Michelacci and Morelli2021). In fact, we know close to nothing about the influence of political parties in this context. Does it make a difference to the accumulation of policies whether left or right parties are in government? And if so, to what extent? In the following, we theorize the role of parties and party ideologies in the context of policy accumulation in social policy by drawing on existing insights from the welfare state literature.
Although the question of whether political parties matter for public policies is one of the core themes in comparative political science research, the link between party ideology and policy accumulation has not been systematically studied so far. Instead, the literature has primarily focused on the direction of policy change, that is, the question of whether the ideological position of the governments affects the level of welfare state generosity. Yet, even with regard to this aspect, unstable class cleavages and changing party strategies have challenged the assumption of traditional partisan theory, namely that parties represent a stable group of voters and adopt policies in line with the preferences of their electorate (see, e.g., Gingrich & Häusermann, Reference Gingrich and Häusermann2015; Oesch, Reference Oesch2013). In line with these insights, several studies have found that the partisan differences in the context of welfare state politics are diminishing or are still only present for specific subsectors (e.g. Bandau & Ahrens, Reference Bandau and Ahrens2020; Jensen & Wenzelburger, Reference Jensen and Wenzelburger2020) and when the ‘relative salience’ (Hillen, Reference Hillen2022, p. 1) of economic matters is high.
Despite these advances in the study of partisan effects, there are good reasons to assume that parties are not mere agents of changing voter preferences but that party ideologies are still relevant and matter for public policy. More specifically, partisan effects on public policies emerge from the fact that political parties are not only vote‐ and office‐seeking but also policy‐seekers (Müller & Strøm, Reference Müller and Strøm1999). In this context, Wenzelburger and Zohlnhöfer (Reference Wenzelburger and Zohlnhöfer2021) emphasize that
[i]f we take actors seriously, partisan effects on public policies are not only dependent on a direct link to the electorate. (…) If political actors decide on policies in line with their ideological view, which has been formed during their long career in a political party, policies will reflect partisan differences, quite independently of the current distribution of voter preferences. (p. 1055)
Parties themselves (rather than their electorate) are hence key for the development of party positions and the policies parties adopt in government.
If we accept the claim that party ideology still matters for public policy, the essential question is whether party ideology does not only affect the kind of policies adopted but also the number of them (Jakobsen & Mortensen, Reference Jakobsen and Mortensen2015). In this regard, we consider the cleavage between left and right parties as the most relevant one (Allan & Scruggs, Reference Allan and Scruggs2004; Häusermann et al., Reference Häusermann, Picot and Geering2013).
For several reasons, we can expect that left parties in office foster policy accumulation in social policy stronger than right parties. Given their traditional support for a large welfare state and market regulation, left parties generally favour a stronger involvement of the government (Jakobsen & Mortensen, Reference Jakobsen and Mortensen2015). Right parties, by contrast, display more liberal and conservative ideologies, focusing on the creation of a free and prosperous society through individual freedom and a rather limited state.
A central aspect in which parties have continued to follow different ‘paths’ is the development of social investment reforms (Hemerijck, Reference Hemerijck2013; Morel et al., Reference Morel, Palier, Palme, Morel, Palier and Palme2012). While the social investment paradigm has not developed into a key issue on the political agenda of right‐leaning parties, it has influenced left parties in the late 1990s during the so‐called ‘Third Way’ (Häusermann et al., Reference Häusermann, Garritzmann, Palier, Garritzmann, Häusermann and Palier2022). Especially for social democratic parties, the rise of the social investment paradigm implied ‘a shift from the traditional social‐democratic goal of equality towards a focus on ensuring the equality of “opportunities”’ (Bremer & McDaniel, Reference Bremer and McDaniel2020, p. 446). Given the structural transformations emerging from economic globalization, the focus turned from social protection to the creation of human capital. This included the adoption of a broad range of new policy targets and instruments, such as active labour market policies or education programmes for certain groups of persons. Our first hypothesis therefore is:
Hypothesis 1 : The more to the left the government can be located, the more it is likely to expand a country's social policy portfolio.
Yet, there are also theoretical arguments that might challenge the above expectation and point to the exact opposite scenario in which the right rather than the left governments are the stronger drivers of policy accumulation. Previous research has shown that the ‘retrenchment of social rights is [often] inversely related to the introduction of new policies and instruments’ (Jensen et al., Reference Jensen, Knill, Schulze and Tosun2014, p. 532). This is the case as the adoption of new policy instruments such as retention periods (mandatory time that beneficiaries have to wait until they can claim social benefits) or means‐tested benefits often imply a ‘conditioning’ of social benefits and thus the turning away from a more inclusive and universal welfare system (Paz‐Fuchs, Reference Paz‐Fuchs2008). Given that right parties and their voters are more sceptical about large welfare states, we can expect that right rather than left governments are more likely to rely on a strategy of giving ‘less by doing more’. The respective hypothesis reads as follows:
Hypothesis 2 : The more to the right the government can be located, the more it is likely to expand a country's social policy portfolio.
Contrary to the above considerations, presuming that parties matter for policy accumulation, sectoral policy dynamics might be primarily driven by endogenous factors. The literature on rule growth argues that policy accumulation emerges from endogenous dynamics or cascade effects (March et al., Reference March, Schulz and Zhou2000). From this perspective, policy accumulation is a self‐evolving process (van Witteloostuijn & de Jong, Reference Van Witteloostuijn and De Jong2010). This view can be traced back to Weber's (Reference Weber1972) prediction that modern society would develop into an iron cage of reason, implying that ‘rules breed rules’.
Endogenous growth dynamics are due to four reasons. First, rule application creates specific growth dynamics: the adoption of new rules may be driven by the need for increased control, the need to unify and coordinate many rules and the fact that many rules create new problems that must be solved with further rules (March et al., Reference March, Schulz and Zhou2000). Second, the literature emphasizes bureaucratic self‐interest in constantly expanding rules because rules generally empower bureaucratic actors with interests and beliefs compatible with rule‐making (van Witteloostuijn & de Jong, Reference Van Witteloostuijn and De Jong2010). Third, after the seal has been broken and a set of policies is introduced in a certain sector for the first time, citizens get used to the existence of policies in this area and might accept and even demand further policy portfolio expansions (Orren & Skowronek, Reference Orren and Skowronek2017). Fourth, policies, once established, are constantly subject to incremental adjustments, further differentiation and other ‘policy maintenance’ activities (Mettler, Reference Mettler2016) as a result of policy learning. This process often takes the form of layering (Hacker, Reference Hacker2004; Thelen, Reference Thelen2004), where new rules are constantly added to existing ones without replacing or abolishing existing rules. Policies thus develop through an accumulation of innovations, which engenders a dense layering of new arrangements on top of existing arrangements. Regardless of the drivers at work, these considerations generally suggest that rates of policy accumulation should be strongly affected by the size of the existing policy portfolio. The higher the number of policy targets and instruments in place, the higher the demand for and supply of additional policies. This might imply that social policy accumulation occurs largely independently from the party in government.
Hypothesis 3 : The greater the size of the policy portfolio, the more likely that the government further expands a country's social policy portfolio.
Research design
The country sample includes 22 OECD countries. These are Australia, Austria, Belgium, Canada, Denmark, Finland, France, Germany, Greece, Ireland, Italy, Japan, the Republic of Korea, Netherlands, New Zealand, Norway, Portugal, Spain, Sweden, Switzerland, the United Kingdom, and the United States. Thus, within the broader sample of developed countries, we employ a ‘diverse case’ selection strategy (Seawright & Gerring, Reference Seawright and Gerring2008). A diverse case selection ensures a high degree of representativeness, while at the same time allowing exploitation of the variation in theoretically relevant variables for systematic comparison. While all of these countries are advanced democracies, they vary substantially regarding the institutional characteristics and the maturity and type of the welfare state.
Capturing events of policy accumulation through policy portfolios
We measure the degree of policy accumulation by changes in sectoral policy portfolios. Policy portfolios are composed of two dimensions: policy targets and policy instruments. Policy targets are all issues addressed by the government. Policy instruments are the means that governments have at their disposal to address policy targets. We are not interested in the restrictiveness or generosity of a certain policy (i.e., the setting of the policy instruments) as mere changes in instrument calibration do not affect the size of the policy portfolio. The differentiation between policy targets and instruments leaves us with a two‐dimensional portfolio space.
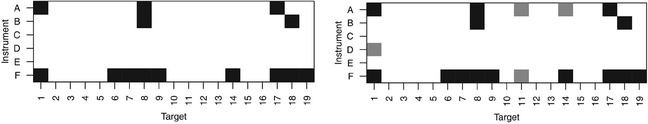
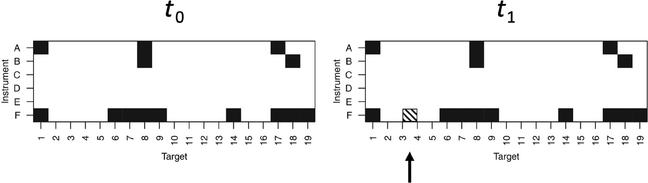
Based on this portfolio space, we can capture events of policy accumulation whenever a new target‐instrument combination is addressed. Figure 1 presents an exemplary policy portfolio consisting of 19 possible policy targets and six policy instruments. The dark boxes indicate different target‐instrument combinations. Thus, the major difference between the left‐ and right‐hand sides is that on the right side, the portfolio grew by four new ‘boxes’ (grey shaded).
Exemplary policy portfolios.

The empirical data (policy targets and instruments) needed for measuring the size of the policy portfolio were collected in the context of the CONSENSUS project.Footnote 2 In the project, we coded information on social policies for 30 years, from 1976 to 2005. Our investigation period thus covers more or less the entire ‘silver age’ of the welfare state, a time in which the welfare state was steadily reformed but at the same time proved remarkably resilient to the challenges (labour market restructuring, demographic transition and economic globalization) it has been confronted with (Taylor‐Gooby, Reference Taylor‐Gooby2002). The focus on the respective period is primarily due to data availability issues at the time of writing, as no other data available allows for a systematic distinction between policy targets and instruments. Even though an even longer and more recent data set would (as always) be even better, we are convinced that the investigation period in no way hampers or restricts the empirical examination of our theoretical arguments. In the conclusion, we provide an in‐depth discussion on how the focus on the ‘silver age’ of the welfare state affects the generalizability of our findings.
Within the CONSENSUS project, all relevant information regarding policy targets and instruments was extracted from legislative outputs such as national legislation, regulations, decrees, ordinances and administrative circulars. To obtain the necessary information from the legal texts, a coding manual was utilized. For a detailed excerpt of the coding manual, please refer to Part 1 of the Online Appendix. The identification and coding of relevant legislative documents were carried out by experts from each country. These experts primarily consisted of political scientists and professionals from related disciplines, who were supported by a team of student assistants. To ensure a shared understanding of the coding manual and address any challenges that arose, two 2‐day coding workshops were conducted. During these workshops, the participating experts came together to discuss and clarify the coding guidelines. Inter‐coder reliability tests could not be uniformly executed across all countries in the study. This was due to the unavailability of more than one country expert/coder for some of the countries. Regardless of this constraint, the members of the core project (the principal investigators) diligently scrutinized the coding process to guarantee a high degree of consistency.
A list of all targets and instruments under scrutiny is presented in Part 1 of the Online Appendix. We distinguish between 25 policy targets spread across three subfields of unemployment, retirement and children. This gives a comprehensive perspective on the developments in the area of social policy. Policy targets include, amongst others, regular unemployment, temporary unemployment due to bad weather, regular retirement for individuals, retirement of married couples and retirement of unmarried couples. Furthermore, targets include birth, children and juveniles. Overall, we consider seven policy instruments. These are, amongst others, universal benefits/allowances, means‐tested benefits, contributions/fees, tax exemptions/subsidies, bonuses/grants, retention periods and one residual category (‘others’).
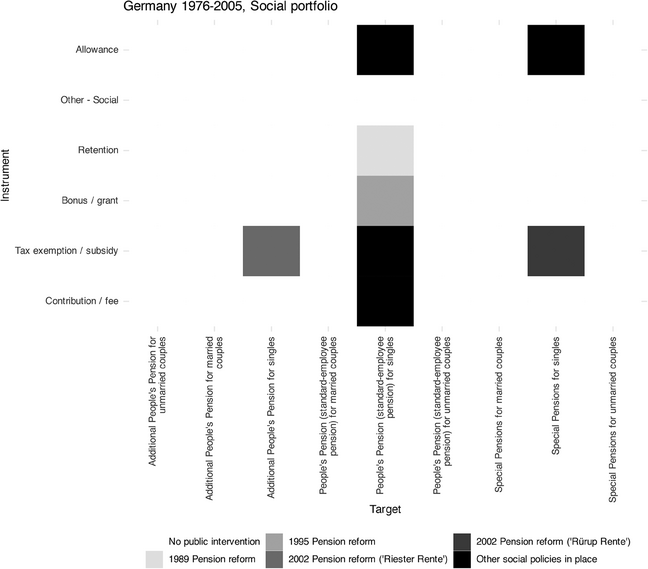
Figure 2 illustrates our approach in the context of the German policy portfolio in the (sub)field of pension policy. Here, the government expanded the country's social policy portfolio four times during our investigation period. In 1989, the government introduced a retention clause (policy instrument: retention) for people retiring before a given pensionable age (policy target: standard‐employee pension for singles). In 1995, the governments established a grant scheme that provided financial bonuses (policy instrument: bonus grant) to the health care insurances of pensioners (policy target: standard‐employee pension for singles). In 2002, the governments introduced two new private pension schemes that the state fostered through tax privileges (policy instruments: tax exemption). While the ‘Rürup’ pension was intended to function as a pension system for self‐employed persons (policy target: special pensions for singles), the ‘Riester Rente’ targeted employed people (policy target: ‘second layer pension’, i.e., pensions originating from another source than the basic people's pension).
German social policy portfolio (1976–2005).

In Part 2 of the Online Appendix, we illustrate all countries’ social policy portfolios and their development over time. On average, the countries in our sample started with about 10.3 target‐instrument combinations in place in the year 1976 and, on average, grew by about another six policy elements over the investigation period (implying a 60 per cent increase).
Independent variables
Our central independent variable is the government's ideological orientation. We find different ways to assess governments’ party positions in the literature. By and large, we can distinguish between (1) static and dynamic as well as between (2) general and sector‐specific approaches.
In static assessments, party positions are typically assessed at a given point in time, usually based on their name or expert evaluations. In more dynamic measures, by contrast, parties’ ideological positions are constantly updated and changed. In this context, the most common and widely used measure is the hand‐coded policy estimations of party manifestos provided by the Comparative Manifesto Project (CMP) (Klingemann et al., Reference Klingemann, Volkens, Bara, Budge and Macdonald2006; Volkens et al., Reference Volkens, Burst, Krause, Lehmann, Matthieß, Merz, Regel, Weßels and Zehnter2020). The second key difference is whether assessments focus on the general party positions or look into specific policy areas. In the case of the former approach, scholarly contributions focus on the ‘left‐right [cleavage] as a “super” dimension structuring contestation among parties’ (Bakker & Hobolt, Reference Bakker, Hobolt, Evans and de Graaf2013, p. 28). In the latter approach, scholars try to capture the parties’ position on specific issues such as social redistribution, moral issues, migration or European integration (ibid.).
In this paper, we use two different measurements that are most diverse with regard to the above‐mentioned aspects. First, we use the cabinet seat share of ‘left’ parties within the government, relying on the data set by Armingeon et al. (Reference Armingeon, Engler and Leemann2022). We assess the relative power position of social democratic and other left parties in government based on their seat share in parliament, measured in percentage of the parliamentary seat share of all governing parties. Imagine two parties forming a government. Government Party A, representing the left, has 50 seats in Parliament, while Party B, a right‐leaning party, holds 100 seats. In this scenario, the influence of Party A in the government could be represented as 50 out of 150 seats, or one‐third of the total. Second, we measure the government's pro‐welfare state attitude relying on the CMP (per503 + per504) (Volkens et al., Reference Volkens, Burst, Krause, Lehmann, Matthieß, Merz, Regel, Weßels and Zehnter2020). Again, the programmatic dimensions are weighted by the parties’ seat shares in the government coalition.Footnote 3 This information comes from Döring et al. (Reference Döring, Huber and Manow2022). While the first measure is rather static and general, the second one is dynamic and sector‐specific. This way, we ensure that the results of our analysis are not driven by methodological choices on how to specify governments’ party positions.
In conclusion, we have two continuous measures of a government's party ideology. The first measure assumes that a government leans more to the left (and less to the right) based on the increasing proportion of ‘social democratic parties or political parties to the left of social democrats’ (Armingeon et al., Reference Armingeon, Engler and Leemann2022, p. 44) within the governing coalition. The second measure assumes a leftward tendency (and correspondingly less rightward inclination) in the government in relation to the increasing proportion of parties in the coalition that emphasize the ‘concept of social justice and the need for fair treatment of all people’ (Volkens et al., Reference Volkens, Burst, Krause, Lehmann, Matthieß, Merz, Regel, Weßels and Zehnter2020, p. 17) and the ‘necessity to introduce, maintain or expand any public social service or social security scheme’ (ibid, p. 18) in their party manifestos.
Our second (alternative) expectation is that policy accumulation is not only driven by political factors but also results from endogenous growth dynamics. To take account of this aspect, we test for the influence of the size of the policy portfolio on the dynamics of policy accumulation. We calculate, for each point time, the overall portfolio size. It gets the value of ‘0’ when the policy portfolio is completely ‘empty’ (no boxes at all in Figure 1) and ‘1’ when the policy portfolio is completely ‘filled’. Given that we identified a total of 25 policy targets and seven policy instruments, a maximum portfolio size of ‘1’ would equal a total of 175 target‐instrument combination (25 targets*7 instruments).
Control variables
We test the effect of the government's party ideology and the portfolio size on the chance for policy accumulation against several control variables. Our analysis includes vertical policy‐process integration (VPI), institutional constraints, the occurrence of economic crisis events, the level of public debt, the system of interest intermediation and the effects of policy diffusion.
VPI is an important determinant of policy accumulation as it affects the extent to which the costs of policies fall at the policy‐making level or can easily be passed onto subordinate governmental levels in charge of implementation (Knill et al., Reference Knill, Steinbacher and Steinebach2021). Amongst other aspects, VPI captures whether the policy formulating level has to directly reimburse lower levels of government or (even) has to establish, design and equip the structures needed for the implementation itself. High levels of VPI, thus, generally reduce the incentives for governments to ‘overproduce’ policies in response to public demands. The data on VPI can be obtained from Knill et al. (Reference Knill, Steinbacher and Steinebach2021). To assess the institutional hurdles for policy change in different national political systems, we rely on the degree of institutional constraints provided by Henisz (Reference Henisz2000). The indicator essentially captures the ‘number of independent veto points over policy outcomes and the distribution of preferences of the actors that inhabit them’ (Henisz, Reference Henisz2000, p. 7). Higher values represent systems with higher institutional constraints. Economic crises are operationalized as every full year with negative growth rates in real gross domestic product (GDP) as a period of economic stress (OECD, 2020). All economic crises under scrutiny also affect other key macroeconomic indicators, such as unemployment, inflation rates and public deficit. The level of (central) government debt is measured as the share of total GDP and taken from the World Bank (2022). Here, some of the data had to be imputed using the mean of the previous and the following year. To account for the influence of the system of interest intermediation, we rely on the corporatism index developed by Jahn (Reference Jahn2016), which includes the most important conceptual aspects of corporatism and the changes in corporatist arrangements over time. Finally, we account for drivers of policy accumulation that emerge from international policy diffusion. Here, we expect that governments are more prone to ‘follow’ one another when they are geographically close or connected via trade ties. We control for these aspects by checking whether countries have a common border and by examining the share of goods being exported from one country to the other.
Empirical analysis
Based on Bayesian inference, we employ an event history analysis approach to estimate the likelihood of portfolio increase over time. Our explanatory model consists of different levels and components. It is an event history model (survival analysis) with a fixed‐year survival rate using logistic regression. Our unit of analysis is thus the combination of policy targets and instruments within a given country and point in time. Each of these target‐instrument combinations can either be covered or not by a policy. Units of analysis are discarded once the specific portfolio space is ‘filled’ with a policy and recovered when a given target‐instrument combination is abolished and no longer addressed.
Our approach comes with several methodological benefits and advancements. First, we go beyond aggregated country‐year observations and can explore specific target‐instrument combinations. In the empirical section, for instance, we examine whether governments tend to drive social policy accumulation primarily through the establishment of new policy targets. This would not be possible through a ‘traditional’ approach based on aggregating data at the country level. Second, and related to the first aspect, we can assess the interdependencies of specific target‐instrument combinations across different policy portfolios. We can thus accurately model policy diffusion effects caused by trade ties and contiguous borders. Third, by employing Bayesian inference we are able to deal with an event history analysis scenario with low cases of realizations. This way, we achieve a numerically stable solution from which we can estimate the effects of our explanatory variables (for a comparable approach, see Jordana et al., Reference Jordana, Levi‐Faur and Fernández‐i‐Marín2011). Our methodological approach can be summarized as follows.
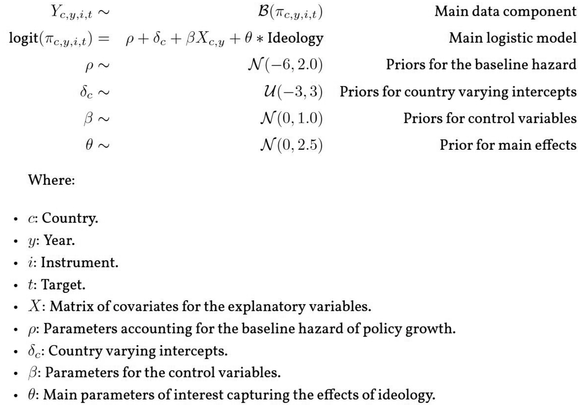
In our model, we introduce an equation that specifies the factors influencing policy adoption. We primarily focus on whether a specific country (c), in a given year (y), with a particular policy instrument (i) and target (t), has adopted a policy (Y = 1) or not (Y = 0). Our logistic model incorporates several elements: a parameter for assessing the overall likelihood of policy growth (ρ, denoted as the baseline hazard), a vector for control variables (β), varying intercepts unique to each country (δ) and a primary variable to measure the effect of ideology (θ). To refine our model, we opt for weakly informative priors for most variables, with the exception of the baseline hazard. Here, we employ a specialized prior for the baseline hazard that centres at exp(−6), equivalent to a 0.002 per cent probability of policy growth within a specific target‐instrument combination for a single year.
The combination of repeated observations on target‐instrument combinations clustered in countries and years leads to a total of 66,360 observations. The theoretically ‘maximum’ pool of observation is 115,500 (25 targets*7 instruments*22 countries*30 years). As is customary in event history analysis, our analysis only considers policy spaces (blank boxes in Figure 1) that are ‘at risk’ of getting adopted (Box‐Steffensmeier & Jones Reference Box‐Steffensmeier and Jones2021, p. 8). In other words, once a certain country and target‐instrument combination are addressed, it ‘drops’ from the pool of potential spaces that can grow (event = 1) or not (event = 0). Overall, we observe about 180 instances of policy accumulation. We deliberately exclude events of simultaneous policy expansion and termination, for example, a shift from means‐tested to universal benefits. Overall, such constellations occurred only twice during our investigation period.Footnote 4 Following the logic of layering, new policy instruments are typically established alongside existing ones without the pre‐existing policies being entirely abolished (Hacker, Reference Hacker2004).
Attentive readers may question our choice of using logistic regression (modelling the binary adoption or not of a new policy when policy spaces are at risk) instead of Cox regression (modelling time‐to‐event data), given that the accumulation of policies inherently appears to involve repetitive events. In contrast to logistic regression, Cox regression models are better suited for managing situations with repeated events and censored data (Allison, Reference Allison1982; Mills, Reference Mills2011). However, it is important to grasp the essence of policy accumulation: it involves the inclusion of new policy elements into pre‐existing policy portfolios. Hence, each target‐instrument combination can only contribute once to the phenomenon of policy accumulation. In other words, the expansion of target‐instrument combinations does not qualify as repeated events by definition. Given this perspective, we find that a logistic regression aligns more suitably with our specific analytical purpose. In addition, using a logistic regression allows us to easily incorporate time‐varying explanatory variables (such as the government's ideological position).
The results of the empirical analysis are displayed in Figure 3. Please note that the values indicating the government's party ideology are reversed so that higher values imply a stronger orientation towards the right/less pro‐welfare state support. In essence, our analysis does not provide support for the hypotheses that left or right governments significantly differ in their chance to accumulate policies (Hypotheses 1 and 2). Party ideology does not seem to matter for social policy accumulation, regardless of how we conceptualize and measure partisan influence. By contrast, we find support for the expectation that policy portfolios keep growing due to some internal growth dynamics (Hypothesis 3). More precisely, the analysis highlights that an interquartile move in portfolio size increases the relative risk of (further) expanding the policy portfolio by about 2.1. This implies a 110 per cent higher probability that a new target‐instrument combination is addressed. This finding perfectly corresponds with our third expectation that – independently from the political colour of the government – larger policy portfolios generate endogenous growth dynamics.
Probability of policy accumulation. HPD, highest posterior densities; VPI, vertical policy‐process integration.
Note: The indicated hazards (probabilities) refer to single target‐instrument combinations, not to the portfolio at large. Highest posterior densities (HPD) of the parameters that control the time‐series variation (95 per cent credible interval). Please note that the values indicating government's party ideology are reversed so that higher values imply a stronger orientation towards the right/less pro‐welfare state support. Regression results are provided in Table 3 in the Online Appendix.
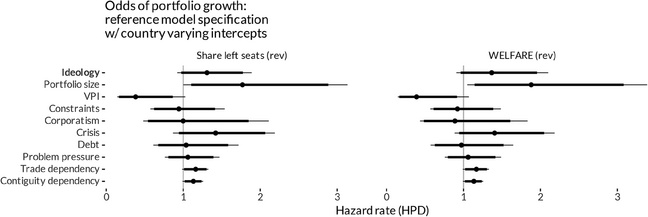
The only other (control) variables that reach levels of statistical significance are the existence of patterns of VPI and the interdependence with trade partners and neighbours. Fewer opportunities to pass policy costs onto subordinate levels of government generally reduce the probability of portfolio expansion. Diffusion dynamics, by contrast, increase the likelihood of social policy growth.
One possible explanation for the observed pattern is that both left and right parties tend to accumulate social policies, but they do so for distinct reasons. Left‐leaning governments often introduce additional policy measures with the aim of incorporating ‘new’ targets or beneficiaries into the welfare state. They focus on expanding social protections and ensuring the inclusion of marginalized or disadvantaged groups (see, e.g., Sainsbury, Reference Sainsbury2012). In contrast, right‐leaning governments are more inclined to produce new policy instruments as a means to restructure the welfare state. Their objective is often to promote efficiency, fiscal responsibility and market‐oriented solutions. Rather than expanding the social safety net, they may seek to introduce reforms that emphasize personal responsibility, reduce the size of the state or encourage private sector involvement in social provision. These reforms can include changes in the distribution of social benefits, such as shifting from universal benefits to a more contributed‐based or means‐tested system. However, it is important to note that these reforms do not necessarily imply a complete overhaul of the entire welfare system.
To test this argument, we perform an additional test. We coded a dummy variable that takes the value ‘1’ whenever a new policy target (e.g., vocational education and training; child benefits, etc.) is addressed for the first time. As illustrated in Figure 4, this ‘target expansion’ equals the first‐time introductions of a dark box in the portfolio space's horizontal (row) dimension. This way, we can control whether it is primarily left or right governments that broaden the scope and inclusiveness of social policy portfolios.
Exemplary policy accumulation via target ‘expansion’.

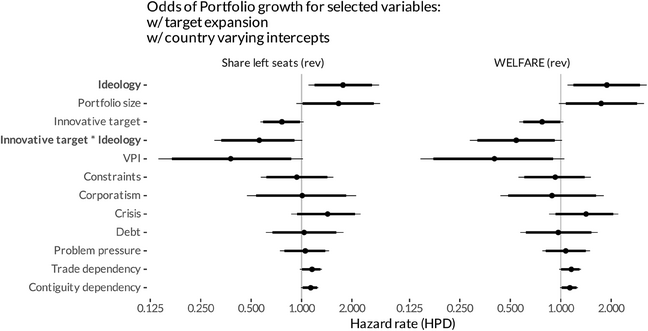
Figure 5 presents the hazard rate for a policy accumulation to go hand in hand with the first‐time introduction of a new policy target. Again, the values indicating the government's party ideology are reversed. The interaction effect between our dummy variable and the government's party position reveals that right governments are less likely to expand via the target dimension. At the same time, the main effect indicates that the government's political ideology moves to the right, reaching statistical significance. In fact, this holds for both ways of measuring the government's ideological orientation. Given that we control for the inclusion of new policy targets, the only plausible way that right governments can produce more policies than their left counterparts is by adding new policy instruments to existing policy targets.
Probability of policy accumulation (controlling for target expansion). HPD, highest posterior densities; VPI, vertical policy‐process integration.
Note: The indicated hazards (probabilities) refer to single target‐instrument combinations, not to the portfolio at large. Highest posterior densities (HPD) of the parameters that control the time‐series variation (95 per cent credible interval). Please note that the values indicating the government's party ideology are reversed so that higher values imply a stronger orientation towards the right/less pro‐welfare state support. Regression results are provided in Table 4 of the Online Appendix.

This finding implies that governments from the right and the left of the political spectrum accumulate to the same extent (Figure 3) but do so for different reasons (Figure 5). While left parties address new social policy targets to broaden the scope of the welfare state, right parties adopt new policy instruments to reform and condition (the type of) social benefits.
The latter aspect also becomes apparent when looking at the type of policy instruments used by the right to expand social policy portfolios. To compare the types of policy instruments used by varying governments, we first calculated the frequency of policy growth events and categorized them based on whether they occurred under left‐ or right‐leaning administrations (share of left/right parties is above or below 50 per cent). Then, to gauge the relative inclination for policy growth between the two, we computed a ratio by dividing the percentage of instances involving right‐wing parties by those involving left‐wing parties. Governments to the right seem to be more likely to introduce (i) retention periods that beneficiaries have to wait before they can claim social benefits and (ii) tax exemptions to promote private forms of provision schemes. More precisely, right governments are about 1.87 times (87 per cent) more likely than left governments to introduce retention periods and about 1.25 times (25 per cent) more likely to introduce tax exemptions. We find, by contrast, no substantial differences when it comes to the introduction of grants and allowances or the establishment of contribution‐based systems.
Robustness
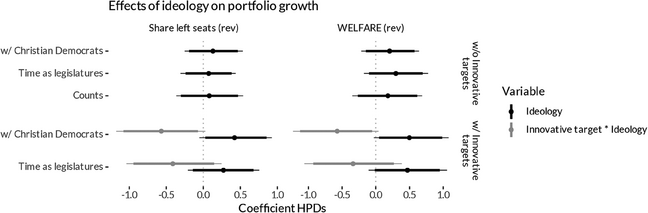
There are naturally several aspects of our conceptual and methodological approach that require further discussion. First, one might criticize that our focus on the left–right dimension might overlook the distinctive role that centre parties and, in particular, Christian Democrats have played in the development of the welfare state. We thus control for the participation of Christian Democrats in government, using a dummy variable. The respective information comes from the PACOGOV data set (Schmidt et al., Reference Schmidt, Zohlnhöfer, Bartscherer and Trocka2021). Second, Schmitt (Reference Schmitt2016) posits that a country‐year design may not be suitable for examining the impact of political parties on public policies, advocating instead for the utilization of cabinets as the units of analysis. While we did not employ a traditional country‐year design, it is important to note that our data are still organized based on years rather than legislatures. To further enhance the robustness of our analysis, we conducted additional checks by restructuring the data accordingly. Third, it could be argued that our analytical model is excessively sophisticated and disaggregated, leading to high interdependence among our data. As a solution, we adopt a simpler count model (negative binomial) where expansion events are aggregated and clustered by country years.
In Figure 6, we summarize the results for the partisan variables for the three alternative model specifications. The upper part of the figure presents the model without the interaction between party ideology and target expansion. The lower part does so with the interaction. All other variables are reported in the Online Appendix.Footnote 5 Please note that in the count model, we cannot take account of target expansion. The count model, by aggregating data by country, lacks the granularity required to discern whether a certain policy target is addressed for the first time or not. The crucial insight gleaned from Figure 6 is that our fundamental empirical findings remain consistent even when employing distinct model specifications. In the legislature model, the interaction is no longer significant. However, it is important to interpret this fact in light of the shift from years to the legislature, which also involved a significant reduction in the number of observations (about 60 per cent). Overall, it is evident that there is no overarching disparity between left and right parties regarding policy accumulation. Rather, the divergence lies in the mechanisms through which policy accumulation is achieved.
Probability of policy accumulation (testing for different specifications).
Note: The indicated hazards (probabilities) refer to single target‐instrument combinations, not to the portfolio at large. Highest posterior densities (HPD) of the parameters that control the time‐series variation (95 per cent credible interval). Please note that the values indicating the government's party ideology are reversed so that higher values imply a stronger orientation towards the right/less pro‐welfare state support. Regression results are provided in Tables 5–9 in the Online Appendix.
Conclusion
This paper departed from acknowledging constantly growing policy stocks in modern democracies. Although more policies provide necessary governmental means to address and respond to emerging societal challenges and political problems, research has shown that policy accumulation also comes with negative consequences both in terms of growing policy complexity and political conflict as well as an overburdening of implementing authorities. These developments can potentially undermine the input and output legitimacy of democratic systems in the longer term.
Given this assessment, the factors that might drive or contain excessive policy accumulation become of both analytical and practical importance. In this regard, existing research has mainly concentrated on the role of institutional factors but has fairly neglected the role of political variables, particularly party politics. In this paper, we provided a first attempt to address this research deficit, focusing on the effects of political parties on social policy accumulation in 22 OECD countries over a period of 30 years.
Our findings show that the ideological position of governing parties does not affect social policy accumulation. Left parties are not more likely to produce more extensive social policy portfolios than right parties and vice versa. While this result is striking at first glance, it is not in contradiction with governments’ political ideologies, as left and right parties engage in policy accumulation for very different reasons. For left parties, the primary rationale behind policy accumulation is to increase the scope of the welfare state by addressing new social policy targets. Right parties, by contrast, employ new policy instruments to condition social benefits. These findings hold despite the fact that there are strong endogenous dynamics of policy growth as countries with greater policy portfolios also display higher levels of policy accumulation. In short, parties do matter with regard to the reasons why governments engage in policy accumulation; however, parties do not matter with regard to the rate of policy accumulation – parties accumulate, albeit for different reasons. From this insight also follows that changes in the government can hardly be considered a remedy to reduce policy accumulation as well as its partially problematic consequences. Overall, our findings can be considered highly robust, as they hold even when using quite different methodological conceptions accounting for the governments’ party positions.
In our analysis, we have focused on a period that largely falls into the so‐called ‘silver age’ of the welfare state (1976–2005). This was primarily due to issues of data availability – especially with regard to the information on policy targets and instruments. A crucial question for the generalizability of our findings is how far the years following 2005 – the so‐called ‘bronze age’ (Moreno, Reference Moreno2016) of the welfare state – have been different from our investigation period. By and large, the existing literature suggests that the welfare state development during the last 15 years has been characterized by two major factors and forces. First, the great recession that occurred between the years 2007 and 2009 has given rise to significant challenges to the welfare state. Especially, the austerity measures imposed as a condition to the ‘bailout’ and European Union emergency measures have resulted in major reforms of social policy programmes (Pavolini et al., Reference Pavolini, León, Guillén and Ascoli2015). Second, the years following the recession have been marked by a re‐emergence of the role of partisanship in social policy‐making above the pre‐crisis level. According to Savage (Reference Savage2019), this is the result of ‘mainstream parties needing to respond to the growing challenge from nonmainstream parties as well as demonstrating that they responded to the economic crisis by offering different policy solutions’ (p. 123). Growing reform pressures as well as reinforced ideological differences in welfare state politics are well in line with our empirical findings. We would expect similar and potentially even higher levels of policy accumulation being driven by different party political motivations.
While we hence have good reasons to claim that our findings hold for welfare state policy in general, it is an open question what our findings mean for the influence of political parties in other policy areas. In this regard, we can at least identify some evidence from research on climate and environmental policy. Schulze (Reference Schulze2021), for instance, finds that left governments ‘produce more hard, but not more soft, climate policies than center and right governments’ (p. 44). In other words, and just in line with our insights for social policy, partisanship seems to matter for the type but not necessarily the level of climate and environmental policy accumulation.
Future studies interested in policy accumulation in general and the role of political parties, in particular, might take our findings as a starting point. Following on from our insights, they might examine whether our findings hold for the years from 2005 onwards. Moreover, they might examine whether the link between party ideologies and policy accumulation also exists for areas other than social policy. Lastly, it might be interesting to check whether policies produced by the left or the right come with different burden implications for the administration.
Acknowledgements
We wish to thank the three anonymous reviewers. Their comments significantly enhanced the quality of this paper. This work was supported by the European Research Council (ACCUPOL Project, Grant. No. 788941) and the European Commission (CONSENSUS project, Grant No. 217239).
Data availability statement
Research documentation and/or data that support the findings of this study are openly available in the Harvard Dataverse at https://doi.org/10.7910/DVN/7XJLJB.
Online Appendix
Additional supporting information may be found in the Online Appendix section at the end of the article:
OnlineAppendix


 Open access