

1. Introduction
Knowledge of the near-surface snow density is essential for the study of surface processes in the Antarctic ice sheet. For instance, the snow density is required to calculate the surface mass balance from stake measurements (e.g. Reference Hubbard and GlasserHubbard and Glasser, 2005;Reference Takahashi and KamedaTakahashi and Kameda, 2007) and to interpret satellite/airborne altimetry (e.g. Reference Zwally and LiZwally and Li, 2002;Reference HelsenHelsen and others, 2008). The density is also important for various types of satellite data analyses because it is directly related to the dielectric permittivity of snow (e.g. Reference Tiuri, Sihvola, Nyfors and HallikainenTiuri and others, 1984), which controls the emission and reflection of electromagnetic waves (e.g. Reference GrodyGrody, 2008; Reference Lacroix, Legresy, Remy, Blarel, Picard and BruckerLacroix and others, 2009). Further, snow densification accompanies changes in the size, structure and bonding of snow particles, properties which are important for finding climatic signals in deep ice cores.
With these factors as motivation, surface snow density and the densification process have been studied by numerous observational (field and satellite), theoretical and numerical methods. The snow density has been measured at many locations in Antarctica (e.g. Reference Cameron, Picciotto, Kane and GliozziCameron and others, 1968;Reference Endo and FujiwaraEndo and Fujiwara, 1973;Reference BraatenBraaten, 1997;Reference Oerter, Graf, Wilhelms, Minikin and MillerOerter and others, 1999;Reference EisenEisen and others, 2008;Reference Kameda, Motoyama, Fujita and TakahashiKameda and others, 2008). Near-surface densification processes have been studied by measuring the vertical density profiles of firn cores and shallow pits (e.g. Reference AlleyAlley, 1988;Reference Craven and AllisonCraven and Allison, 1998;Reference Van den BroekeVan den Broeke and others, 1999; Reference Fujita, Okuyama, Hori and HondohFujita and others, 2009;Reference Vihma, Mattila, Pirazzini and JohanssonVihma and others, 2011). These field data have been used to develop and calibrate numerous snow densification models (e.g. Reference Herron and LangwayHerron and Langway, 1980;Reference Kameda, Shoji, Kawada, Watanabe and ClausenKameda and others, 1994;Reference Spencer, Alley and CreytsSpencer and others, 2001).
Since the direct determination of snow density from satellite data remains difficult, firn-core analyses and pit measurements are the only means to obtain reliable data. However, it is difficult to cover a large area using point measurements, and the measurement sites are not uniformly distributed throughout Antarctica. To overcome these problems, densification models have been coupled with climate and meteorological models to compute the density distribution over the entire ice sheet. Density maps obtained using these models have contributed to our understanding of the age of gases contained in ice cores (Reference Kaspers, Van de Wal, Van den Broeke, Schwander, Van Lipzig and BrenninkmeijerKaspers and others, 2004), firn thickness (Reference Van den BroekeVan den Broeke, 2008) and ice-sheet elevation change (Reference HelsenHelsen and others, 2008). Such an approach requires an accurate densifi- cation model calibrated with field data, and the modeled density map needs to be validated through comparison with field observations.
Despite the need for reliable near-surface snow density data, previously reported field measurements are insufficient to cover the large variability in meteorological and geometrical conditions in Antarctica. Data are particularly scarce for the interior of the ice sheet. To contribute to our understanding of the snow density distribution and densifi- cation processes in Antarctica, we carried out shallow pit measurements during the Japanese-Swedish traverse expedition in the 2007/08 austral summer. In this paper, we report upper 1 (or 0.5)m density profiles collected at 46 survey sites, from coastal to inland plateau areas in East Antarctica. The influence of meteorological variables on near-surface densification is discussed in light of the density variation measured along the 2800 km long route.
2. Method
2.1. Study site
From November 2007 to January 2008, Japanese and Swedish research teams carried out a traverse expedition in East Antarctica, between the Japanese inland base S16 (30 km from Syowa station;69.03° S, 40.05° E;589 m a.s.l.) and the Swedish Wasa station (73.05° S, 13.37° W; 292 m a.s.l.) (Fig. 1;Table 1) (Reference Holmlund, Fujita and ThorenHolmlund and Fujita, 2009). The two teams departed from their home stations in snow vehicles and met at a point ~1400 km from each of the starting points (75.89° S, 25.83° E;3661 m a.s.l.). They exchanged some expedition members and scientific instruments before they began their return trips. Accordingly, various research activities could be carried out along the entire stretch from S16 to Wasa (Reference Sugiyama, Enomoto, Fujita, Fukui, Nakazawa and HolmlundSugiyama and others, 2010; Reference FujitaFujita and others, 2011).
Map of the study region, along with the route traversed by the Japanese-Swedish Antarctic Expedition in 2007/08. Open circles denote the locations of snow-pit measurements. Red circles denote measurement sites referred to in the text. The contours represent surface elevation at intervals of 200 m, based on Reference Bamber, Gomez-Dans and GriggsBamber and others (2009).

Sites along the expedition route referred to in the text
During the expedition, we measured the density, grain size and structure of snow in the near-surface layer at 46 locations along the route (to 1 m depth at 35 locations and to 0.5 m at 11 locations) (Fig. 1). The first survey was made at Z8 (180 km inland from S16) on 17 November 2007. The snow survey was repeated along the rest of the expedition route (covering >2650 km), with measurements taken at intervals of approximately 20-100 km until the final measurement was completed at AWS5 near Wasa station, on 28 January 2008. The elevation of the measurement sites increased from 1991m (Z8) to 3800 m (Dome F), then gradually decreased to 2500 m at the point 290 km west of Kohnen station. From this point, the route descended steeply from the Antarctic plateau to the coastal region. Annual snow layer thicknesses near the surface have previously been measured at 50-400 mm for the section between Z8 and Dome F (Reference Furukawa, Kamiyama and MaenoFurukawa and others, 1996), 140-250 mm in the vicinity of Kohnen (Reference Oerter, Graf, Wilhelms, Minikin and MillerOerter and others, 1999) and 550± 110mm for the coastal region near Wasa (Reference Karkas, Martma and SonninenKarkas and others, 2005). The uppermost 1 m of snow cover therefore consists of several annual layers, in some cases more than ten.
2.2. Measurements
Snow measurements were performed on a side-wall of a snow pit excavated at each survey site. We measured the density by sampling a 30 mm thick snow block using a box- type stainless density cutter (30 mm × 60 mm × 56 mm, Climate Engineering Co.). A digital bench scale (CS200, OHAUS Co.) with a resolution of ±0.1 g was used to weigh the snow blocks. This error corresponds to <1% of measured weight. The accuracy for density measurements performed with similar devices and procedures has been reported as ±4% (Reference Conger and McClungConger and McClung, 2009). The sampling was performed from the surface to 1 (or 0.5) m depth, at intervals of 30 mm.
Stratigraphical information was recorded following the guidelines given by Reference ColbeckColbeck and others (1990). We identified layers after a visual inspection of the snow structure and grain size. The snow structure was classified into four types: fresh snow; compacted snow (Fig. 2a); faceted crystals or depth hoar (we refer to both types of structure as depth hoar in the remainder of this paper) (Fig. 2b);and a crust layer (Fig. 2c). The compacted snow layers include those compacted under overburden stress as well as wind compaction. The crust layers are less than several millimeters thick well-bonded snow, formed probably at the surface due to radiation or wind. The grain size was measured using a magnifier on a plastic plate ruled in millimeters. Several snow samples were taken from each stratigraphic layer, to allow precise measurement of the average grain size. The permittivity of snow was also measured using a snow fork (a parallel-wire transmissionline resonator), whose results are presented elsewhere (Reference Sugiyama, Enomoto, Fujita, Fukui, Nakazawa and HolmlundSugiyama and others, 2010).
Photographs of characteristic snow structures: (a) very hard compacted snow, (b) depth hoar and (c) crust layers indicated by the arrows.

3. Results
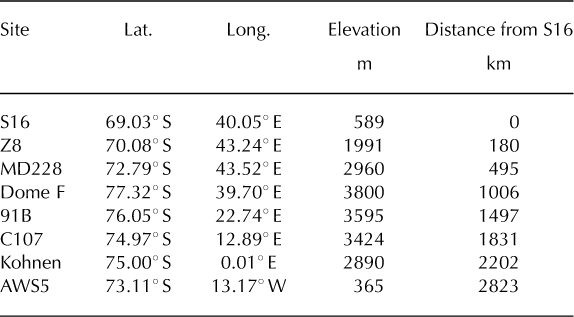
Figure 3 shows vertical profiles of snow density, grain size and the four structures obtained at six selected locations as typical examples of the data. At MD228 (2960ma.s.l.; 495 km from S16), on the slope ascending from S16 to Dome F, the snow was relatively dense (mean density 425 kg m-3), fine-grained (mean grain size 0.33 mm) and dominated by a compacted snow structure (Fig. 3a). At the measurement sites located inland (Dome F, 91B, C107 and Kohnen), the snow was characterized by depth-hoar structures consisting of medium (0.5-1.0mm) to coarse (1.0-2.0mm) grains (Fig. 3b-e). The grain size increased with depth in the pits. Several compacted snow layers were scattered in the snowpack, forming relatively dense and finegrained layers. At C107, for example, there were three compacted snow layers at depth ranges of 0.17-0.35, 0.400.42 and 0.81-0.96m from the surface. All three layers were dense and fine-grained (Fig. 3d). Some of these were exceptionally hard and dense, with tightly bound fine snow grains (0.2-0.5 mm) (Fig. 2a). Crust layers several millimeters thick were frequently observed in this region (Fig. 2c). In the coastal region near Wasa station (AWS5), the snow properties were similar to those at MD228 in terms of high density (419 kgm-3) and domination by compacted snow (Fig. 3f).
Density (red line), grain size (blue line) and stratigraphy measured at (a) MD228, (b) Dome F, (c) 91B, (d) C107, (e) Kohnen and (f) AWS5 (see Fig. 1 and Table 1 for locations). The snow structures are classified as faceted crystals and depth hoar (magenta), compacted snow (cyan) or a crust layer (red line).
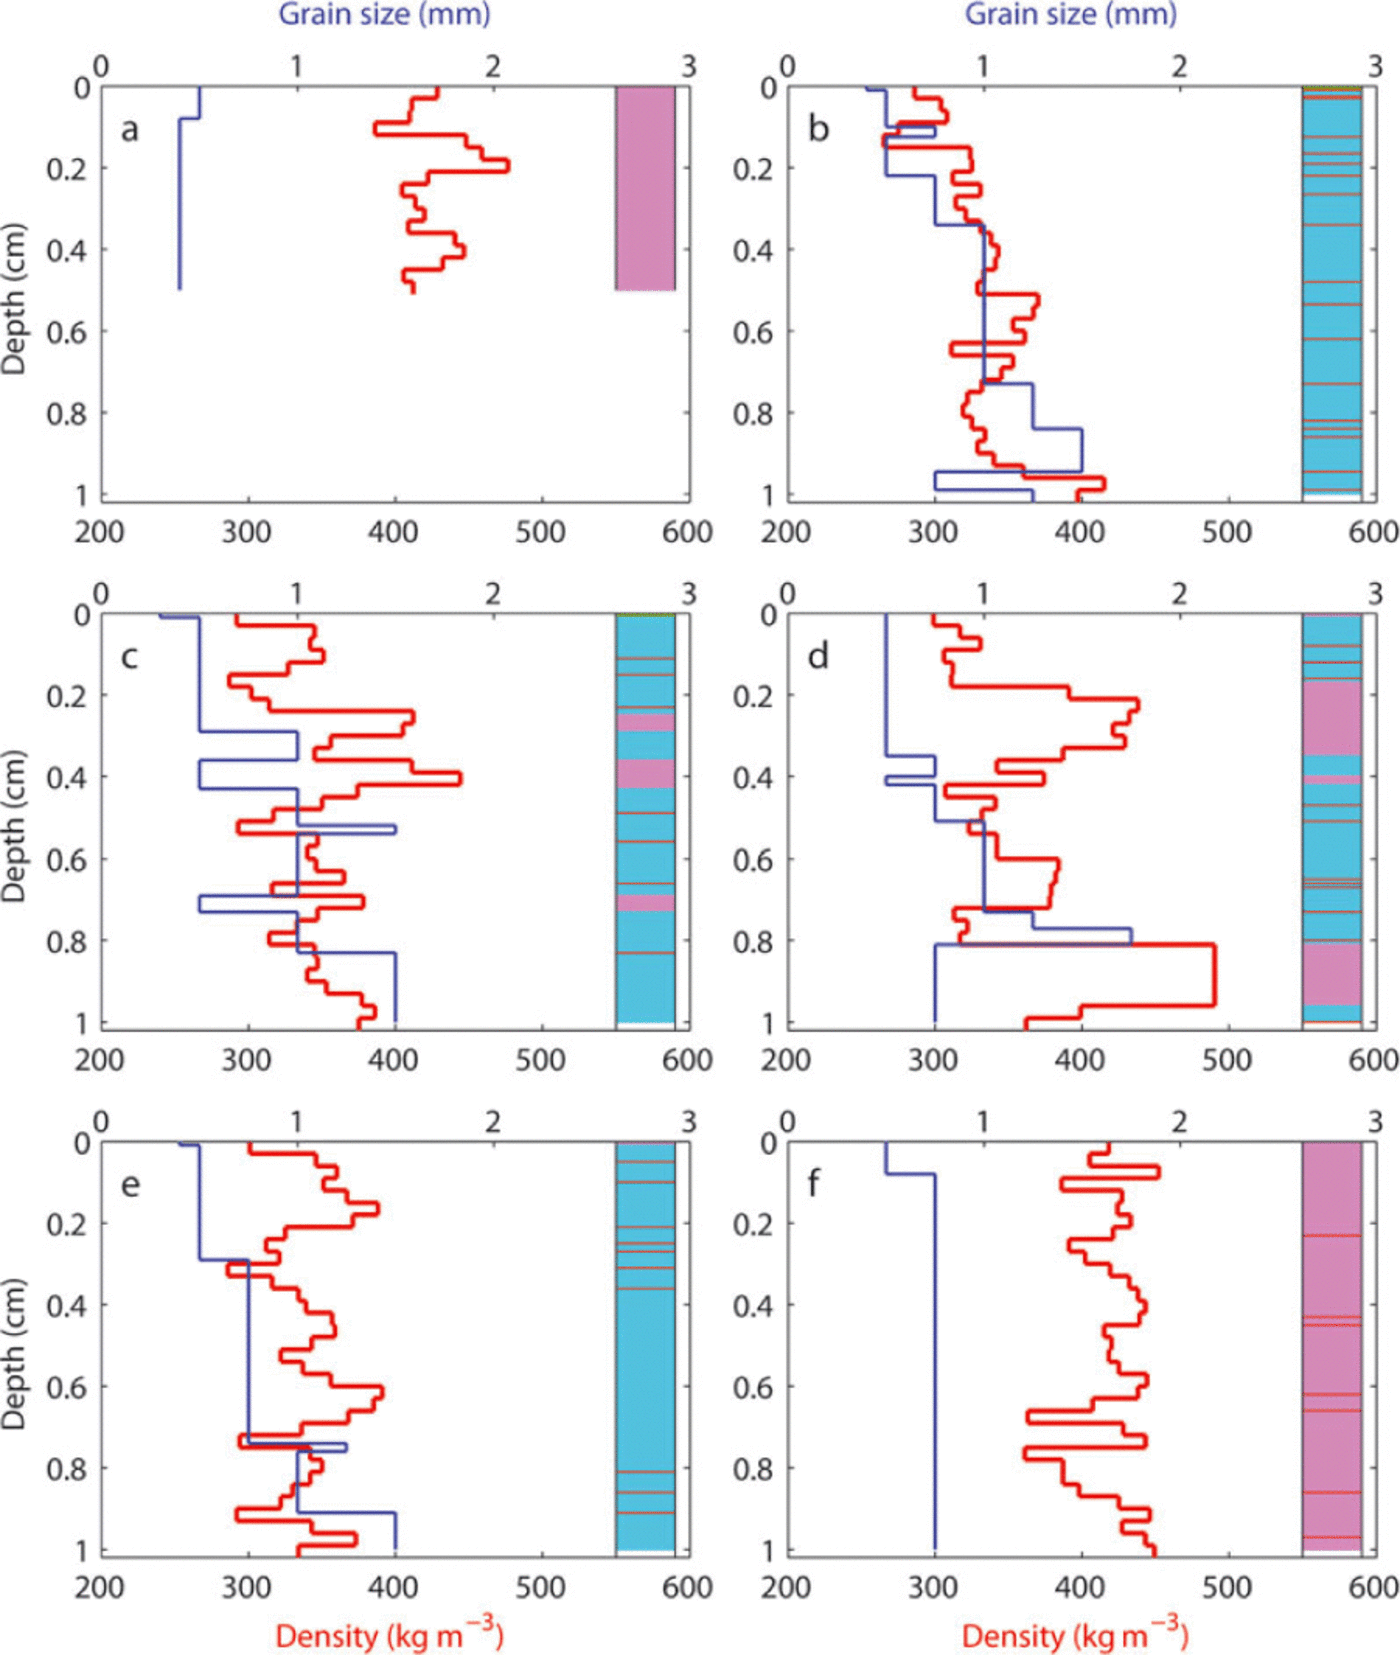
Figure 4 displays vertical profiles of snow density, grain size and stratification obtained over the traverse route. The plot shows an inhomogeneous distribution of snow properties in the horizontal and vertical directions. In general, the density decreased from the coastal region towards Dome F, and increased from Kohnen to Wasa (Fig. 4a). However, a given density profile obtained at one site was not necessarily similar to those obtained at nearby sites. For example, very high-density layers (>500 kgm-3) were observed in a few inland profiles (1000-2000km from S16), but vertical positions of the layers do not correspond. Thus, it was very difficult to define a characteristic high- or low-density layer that could be interpreted as an isochrone.
Vertical profiles of (a) snow density, (b) grain size and (c) stratigraphy measured at 46 locations along the expedition route
The grain size generally increased with distance from the surface (Fig. 4b). Grains were <0.5 mm near the surface, but ranged from 1.0 to 3.0 mm at depths of 1 m. Inland snow was more dominated by depth-hoar structures, while compacted snow structure accounted for a larger proportion near the coast (Fig. 4c). As observed in the density data, neighboring stratifications did not correspond with each other. The vertical positions of compacted snow layers and crust layers were not continuously distributed in the horizontal direction.
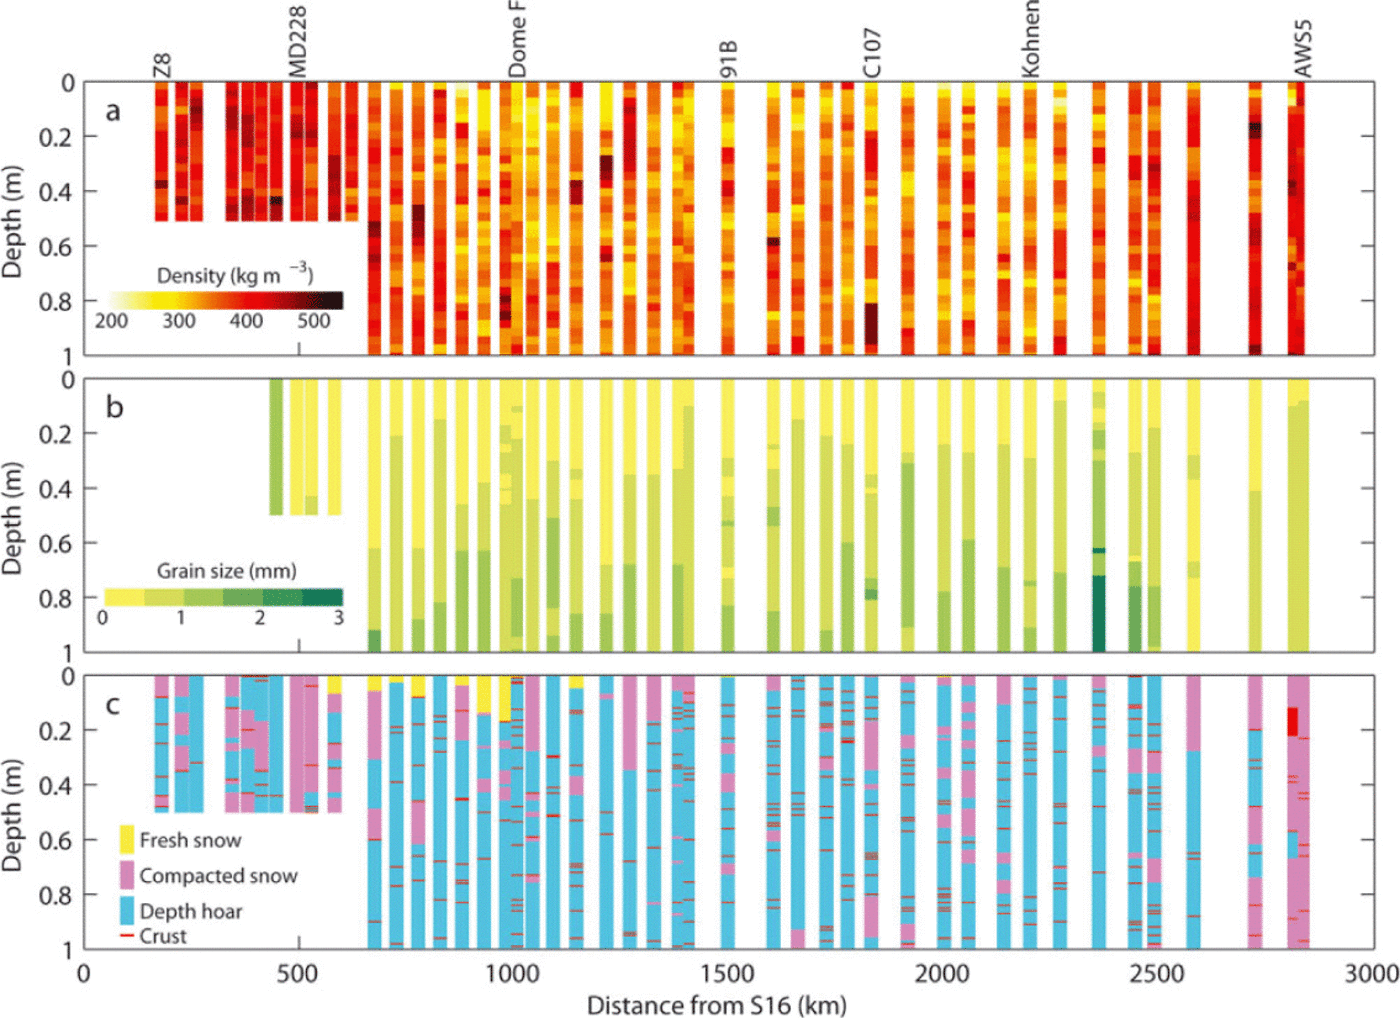
The mean density variations along the route showed interesting features when compared with the surface elevation (Fig. 5a and b). On the route ascending from Z8 to Dome F, the mean density was relatively constant until around MD228, with values in the range 403-439 kgm-3. After MD228, we observed a marked decrease in mean density as we approached Dome F. This density decrease at ~3000m a.s.l. has been reported in previous measurements performed along the same route (Reference Endo and FujiwaraEndo and Fujiwara, 1973;Reference Yamada and WatanabeYamada and Watanabe, 1978;Reference Shiraiwa, Shoji, Saito, Yokoyama and WatanabeShiraiwa and others, 1996). The decrease in density is not consistent with the steadily increasing surface elevation along this section. The mean density was nearly constant from Dome F to Kohnen, with values ranging from 333 to 375 kg m-3, whereas the elevation drops from 3800 to 2890 m. The overall mean density between Dome F and Kohnen was 351 kgm-3, 17% lower than the mean density between Z8 and MD228 (421 kgm-3). The density increased from Kohnen towards the margin of the Antarctic plateau, and exceeded 400kgm-3 after the steep descent from the plateau to the coastal region. Similar density variations have previously been reported in this region (Reference Van den BroekeVan den Broeke and others, 1999).
(a) Surface elevation (blue) and slope (red); (b) snow density; (c) grain size; (d) proportion of fresh snow (yellow), depth hoar (cyan) and compacted snow (magenta); (e) standard deviation of density (blue) and frequency of crust layers; and (f) snow accumulation rate (blue) and 10m depth snow temperature (red) along the expedition route. In (b), individual measurements and mean values are denoted by black dots and red circles respectively. The red lines in (b–d) are linear regressions of the mean density, grain size and the proportion of compacted snow, performed for the sections Z8–MD228, MD228–Dome F and Dome F–Kohnen. The surface slope in (a) was determined using the digital elevation model by Reference Bamber, Gomez-Dans and GriggsBamber and others (2009).
The changes in grain size and snow structure in the vicinity of Dome F corresponded with the density variations. The grain size increased from MD228 to Dome F, then remained fairly steady between Dome F and Kohnen (Fig. 5c). This change can be seen by comparing the regression lines obtained for the two sections. Similarly, the proportion of compacted snow layers decreased from MD228 to Dome F, but was relatively constant between Dome F and Kohnen (Fig. 5d). In general, the compacted snow-layer proportion varied in a manner similar to the density over the entire traverse route. It was also observed that the number of crust layers increased at around Dome F and remained large until the route descended towards Wasa (Fig. 5e).
4. Discussion
4.1. Spatial heterogeneity
Within each of the snow pits, individual density measurements showed large variations (Fig. 5b). These signals in the vertical density profiles are often useful to study seasonal/ annual variations and events in meteorological conditions. However, the standard deviation of density measurements at each site ranged from 17 to 62kgm-3, with no significant trend along the expedition route (Fig. 5e). The frequency and locations of the high-density layers were not consistent among nearby survey sites. These observations suggest spatial heterogeneity in the depositional processes, on a relatively small scale.
On the scale of 1-10 m, the density profile is influenced by non-uniformly distributed snow surface features such as sastrugi and small-scale dunes (e.g. Reference WatanabeWatanabe, 1978; Reference FrezzottiFrezzotti and others, 2005). These features are created by wind-driven deposition and erosion. Even when the layering is uniform over a 10 m scale, it is often difficult to crosscorrelate layers observed at locations separated by 100 m to several hundred meters (Reference Sturm and BensonSturm and Benson, 2004). Depositional conditions are strongly affected by the wind, which is controlled by the ice-sheet surface topography on scales greater than several kilometers (e.g. Reference Furukawa, Kamiyama and MaenoFurukawa and others, 1996;Reference Frezzotti, Urbini, Proposito, Scarchilli and GandolfiFrezzotti and others, 2007). Since spatial scales of these variabilities are smaller than the intervals of our pits, it is not straightforward to use the vertical density profiles to understand temporal changes in meteorological and depositional conditions. In the remainder of the paper, we focus our attention on the vertically integrated mean density, and discuss its variations along the route and the role of meteorological conditions in this variable.
4.2. Elevation/temperature effect
Changes in the upper 1 (or 0.5) m mean density were associated with changes in the surface elevation along the route (Fig. 5a and b). The mean density decreased as the elevation increased from MD228 to Dome F, but this value changed only a little between Dome F and Kohnen. This is because our route after Dome F followed a ridge with relatively constant elevation on the Antarctic plateau (Fig. 1). The density increased again when the route descended from Kohnen to Wasa. Accordingly, we obtain an inverse relationship between the mean density and elevation (Fig. 6a). A likely interpretation of this relationship concerns the surface temperature, which is known to play a key role in snow densification in polar regions (e.g. Reference Herron and LangwayHerron and Langway, 1980;Reference Kameda, Shoji, Kawada, Watanabe and ClausenKameda and others, 1994;Reference Arthern and WinghamArthern and Wingham, 1998; Reference Li and ZwallyLi and Zwally, 2002). Reference Kaspers, Van de Wal, Van den Broeke, Schwander, Van Lipzig and BrenninkmeijerKaspers and others (2004) compiled near-surface snow density data from Antarctica, and found that surface temperature was the meteorological variable that most influenced the density. We obtain essentially the same plot when the density is plotted against the 10m depth snow temperature (Fig. 6b). The temperatures used here are based on the 10 m depth snow temperature measured at 25 locations during our expedition, and the annual mean air temperatures measured at Dome F (Reference Takahashi, Kameda, Enomoto, Motoyama and WatanabeTakahashi and others, 2004) and Kohnen (Reference Van den Broeke, Van As, Reijmer and Van de WalVan den Broeke and others, 2004). We calculated the temperature at density measurement sites by assuming a piecewise linear relationship between the temperature and surface elevation. That is, the relationships were determined separately for the three sections S16-Dome F, Dome F- Kohnen and Kohnen-Wasa. Also shown in Figure 6a and b are near-surface snow densities previously reported for the locations in Antarctica indicated in Figure 7 (Reference Kaspers, Van de Wal, Van den Broeke, Schwander, Van Lipzig and BrenninkmeijerKaspers and others, 2004, and references therein).
Scatter plots of the density vs (a) surface elevation, (b) 10m depth snow temperature and (c) accumulation rate. The data obtained in the sections Z8–Dome F and Dome F–Wasa are denoted by red and blue circles respectively. Field data previously reported in Antarctica (Reference Kaspers, Van de Wal, Van den Broeke, Schwander, Van Lipzig and BrenninkmeijerKaspers and others, 2004 and references therein) are indicated by the grey markers in Figure 7.

Locations of the snow density measurements in this study (red cross) and previously reported data compiled by Reference Kaspers, Van de Wal, Van den Broeke, Schwander, Van Lipzig and BrenninkmeijerKaspers and others (2004) (blue markers). The sources of the previous data are Reference Kaspers, Van de Wal, Van den Broeke, Schwander, Van Lipzig and BrenninkmeijerKaspers and others (2004) (•); Reference SturgesSturges and others (2001) (*); Reference ButlerButler and others (1999) (*); Reference Trudinger, Enting, Etheridge, Francey, Levchenko and SteeleTrudinger and others (1997) (⋄); Reference BenderBender and others (1994) (⌞); Reference GowGow (1968) (Δ); Reference Herron and LangwayHerron and Langway (1980) (×); Reference Van den BroekeVan den Broeke and others (1999) (Δ); and Reference Cameron, Picciotto, Kane and GliozziCameron and others (1968) (+).

The effect of air temperature on the surface snow density is reasonable, but the relationship between these variables was not simple in our data. It is clear from Figure 6a and b that the forms of the density-elevation/temperature relationships differ along the sections ascending from MD228 to Dome F and descending from Dome F to Wasa. As described in Section 3, the density was relatively insensitive to elevation change from Dome F to Kohnen. This segment of the path generates the hysteresis loop in the density-elevation/temperature plots, and implies that the density variation was significantly influenced by additional variables. For instance, the accumulation rate is as important as the temperature in several densification theories and empirical models (e.g. Reference Herron and LangwayHerron and Langway, 1980;Reference Kameda, Shoji, Kawada, Watanabe and ClausenKameda and others, 1994;Reference Arthern and WinghamArthern and Wingham, 1998; Reference Li and ZwallyLi and Zwally, 2002). Thus, we compared our density data with accumulation rates reported along the route. The accumulation data were obtained using stake measurements for the section between S16 and Dome F (Reference Motoyama, Furukawa and NishioMotoyama and others, 2008), ice and snow radar surveys between Dome F and Kohnen (Reference FujitaFujita and others, 2011) and firn-core studies between Kohnen and Wasa (Reference RotschkyRotschky and others, 2007). According to these data, the accumulation rate decreased from S16 to Dome F, and gradually increased towards Kohnen (Fig. 5f). A scatter plot shows good correlation between the density and accumulation rate measured from Z8 to Dome F. Nevertheless, the density was rather insensitive to the accumulation rate increase from Dome F to Kohnen (Fig. 6c). Thus, the accumulation rate does not adequately explain the density variation along this section.
4.3. Wind-speed effect
Another meteorological variable relevant to surficial snow densification is wind speed. The wind-speed pattern over the Antarctic ice sheet is strongly affected by topography, in particular the surface slope (Reference Parish and BromwichParish and Bromwich, 1987). Along the expedition route, the surface slope progressively decreased from S16 to Dome F, and was relatively flat thereafter (Fig. 5a). The surface slope and density showed similar variations between MD228 and Kohnen (Fig. 5a and b), suggesting that the wind influenced the densification. In Figure 8a, the expedition route is superimposed on a 10 m annual mean wind-speed map generated by a climate model. This map was constructed from the 20year (19892009) averaged output of a regional atmospheric climate model with a horizontal resolution of 27 km (Reference Lenaerts and Van den BroekeLenaerts and Van den Broeke, 2012). The computed wind pattern generally represents a topographically controlled katabatic wind system, but also includes the effects of sporadic strong wind events. The first half of the section between S16 and Dome F (the windiest region along our expedition route) was characterized as a strong katabatic wind zone. The wind speed was >8 m s-1 from the first measurement site Z8 (180 km from S16) to 128 km inland of MD228 (623 km from S16). The wind speed rapidly decreased inland, reaching a minimum value near Dome F (5.0 ms-1). These relatively weak wind conditions extended along the ridge towards Kohnen. The measured density correlated well with the simulated wind speed, with a correlation coefficient r =0.79 (Fig. 8b).
(a) Locations of snow-pit measurements superimposed on a contour map showing 10m wind-speed distributions. The wind-speed map represents the 20 year (1989–2009) averaged output of a regional atmospheric climate model (Reference Lenaerts and Van den BroekeLenaerts and Van den Broeke, 2012). (b) Scatter plot of the density vs the wind speed. Markers are as in Figures 6 and 7.
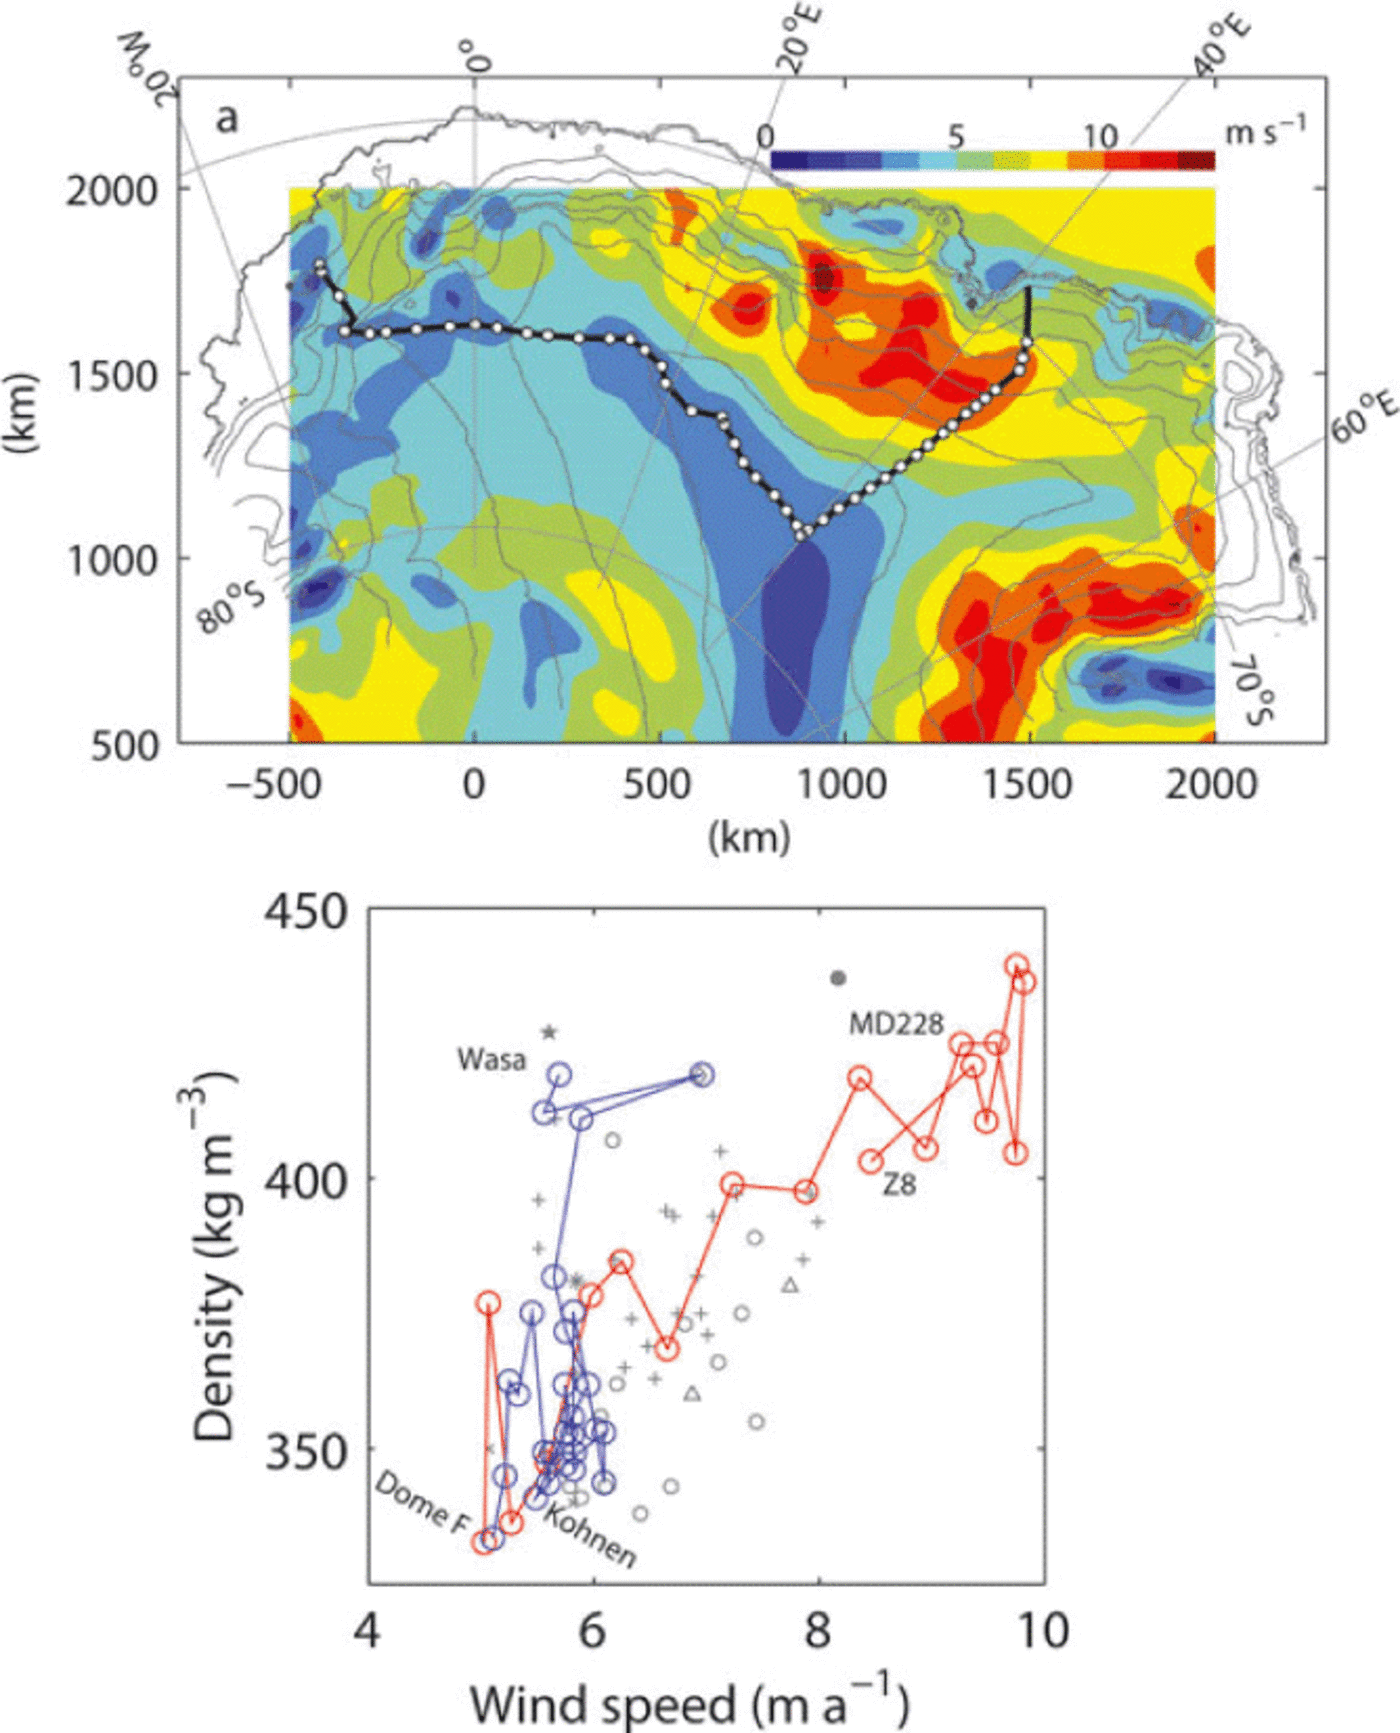
It has been recognized that the wind, as well as temperature, plays a critical role in snow densification in polar regions. Snow grains near the surface are rounded by the wind. This process enhances grain settling and packing, the dominant mechanisms in the initial stage of dry snow densification (e.g. Reference Anderson, Benson and KingeryAnderson and Benson, 1963;Reference Herron and LangwayHerron and Langway, 1980). Strong wind conditions cause moisture transfer within a snowpack, which facilitates wind slab formation over a depth-hoar layer (Reference Benson and OuraBenson, 1967). Moreover, snow density is affected by features such as sastrugi, dunes and glazed surfaces, all of which are formed through erosion and deposition processes driven by strong katabatic winds (e.g. Reference WatanabeWatanabe, 1978). The effects of the wind were also observed in the grain size and snow structure. The grain size increased and the fraction of compacted snow decreased from MD228 to Dome F (Fig. 5c and d). These variations can be explained by the degree of wind compaction, which was expected to decrease towards Dome F.
The influence of wind on surface snow density has been pointed out in previous studies in Antarctica. Based on firn- core analyses at widely spread sampling sites in Antarctica, Reference Craven and AllisonCraven and Allison (1998) concluded that a 5 ms-1 wind- speed increase and a 10°C temperature increase have equivalent effects on the density. Relying on the relationships between snow density and meteorological variables derived by Reference Craven and AllisonCraven and Allison (1998), Reference Van den BroekeVan den Broeke and others (1999) reconstructed a wind-speed pattern from firn density profiles in Dronning Maud Land. According to their analysis, the density at 1 m depth should increase by 8 kg m-3 for each wind-speed increase of 1 ms-1. This ratio is approximately half the value observed in this study (16.0 kg m-3 for every 1 ms-1) (Fig. 8b). In addition to the studies just cited, rapid density increases during sporadic strong wind events have been reported in the interior of the ice sheet (Reference Lacroix, Legresy, Remy, Blarel, Picard and BruckerLacroix and others, 2009;Reference BirnbaumBirnbaum and others, 2010).
At the four measurement sites located within 220 km of Wasa station, the density data deviated from the linear relationship with wind speed (Fig. 8b). These sites were located at low elevation, near the coast (Fig. 5a and b). A plausible reason for their difference could be that temperatures and accumulation rates are higher near the coast. Another possible interpretation is that sporadic wind events occur more frequently in coastal regions, enhancing the densification. Such short-term events would affect the annual mean wind speed only a little.
4.4. Parameterization
Reference Kaspers, Van de Wal, Van den Broeke, Schwander, Van Lipzig and BrenninkmeijerKaspers and others (2004) proposed the following parameterization of surface snow density p0 with respect to meteorological variables:
where T is the annual mean surface temperature, A is the accumulation rate and W is the annual mean wind speed. They calibrated the parameters a, α, β and ε by fitting the formula to density and meteorological datasets previously obtained at the locations indicated by blue markers in Figure 7 (Reference Kaspers, Van de Wal, Van den Broeke, Schwander, Van Lipzig and BrenninkmeijerKaspers and others, 2004, and references therein). The data used for their calibration included snow density, 10 m depth snow temperature and accumulation rate measured in the field, as well as the 10 m wind speed provided by a regional climate model. Despite the simplicity of this formula, the densities computed using Eqn (1) showed reasonable agreement with the measured values.
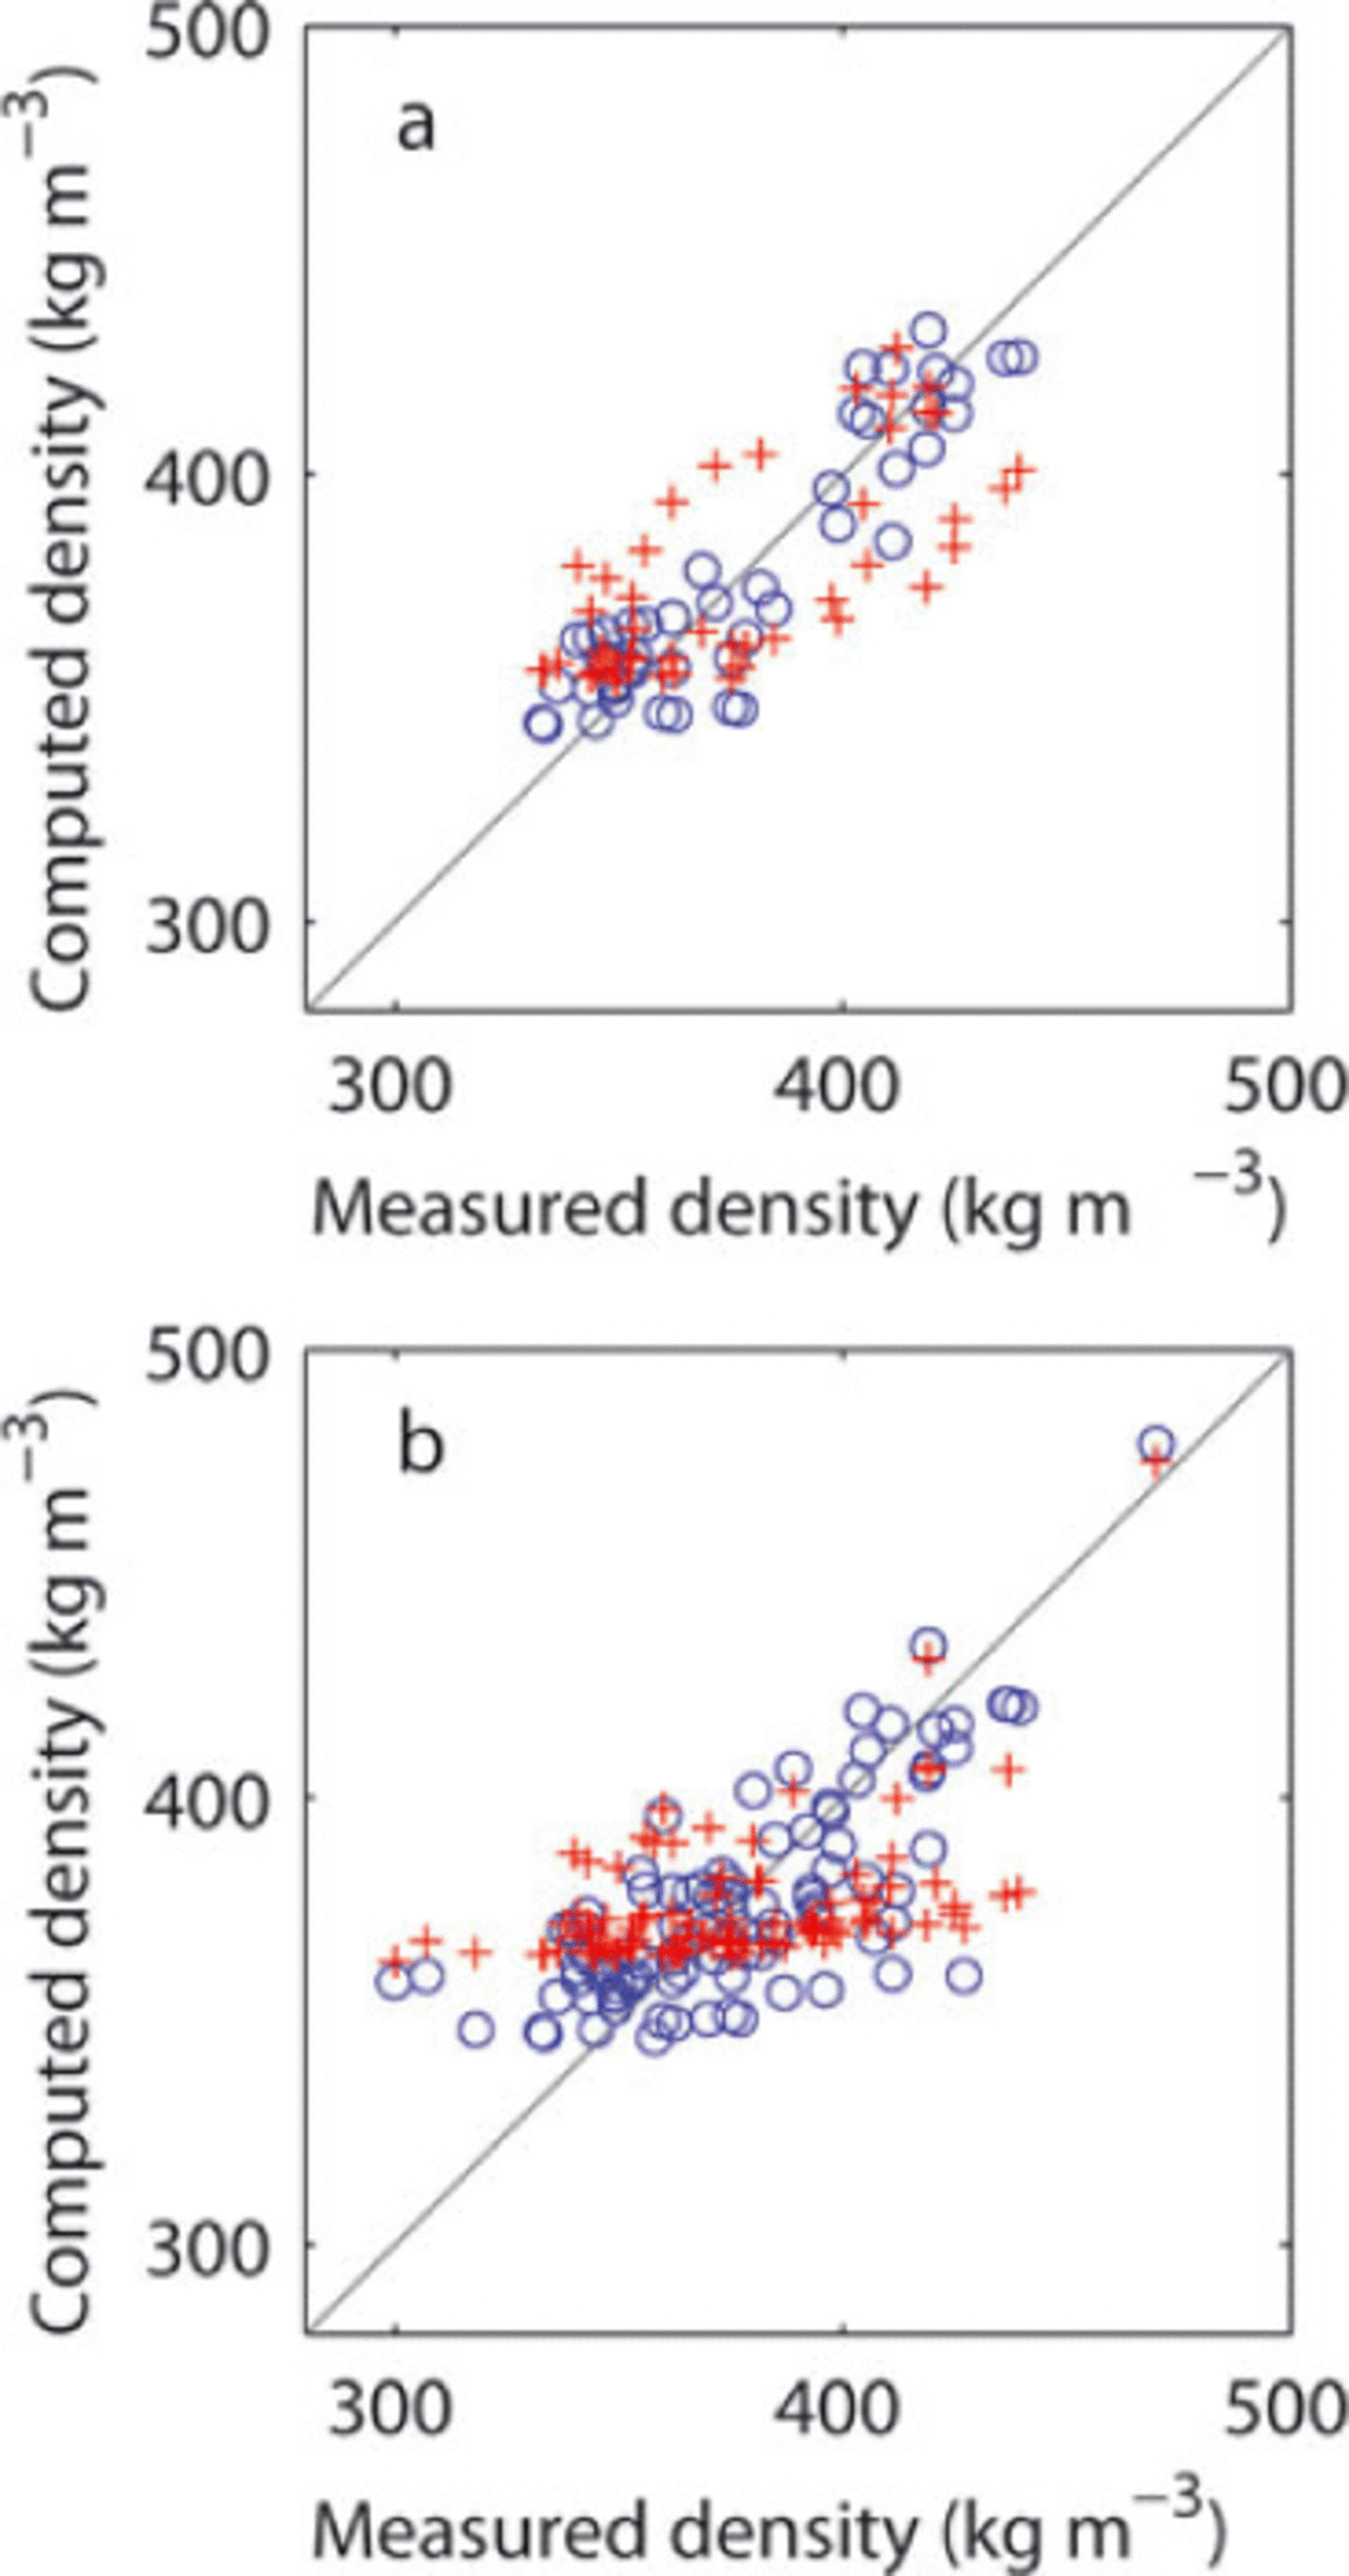
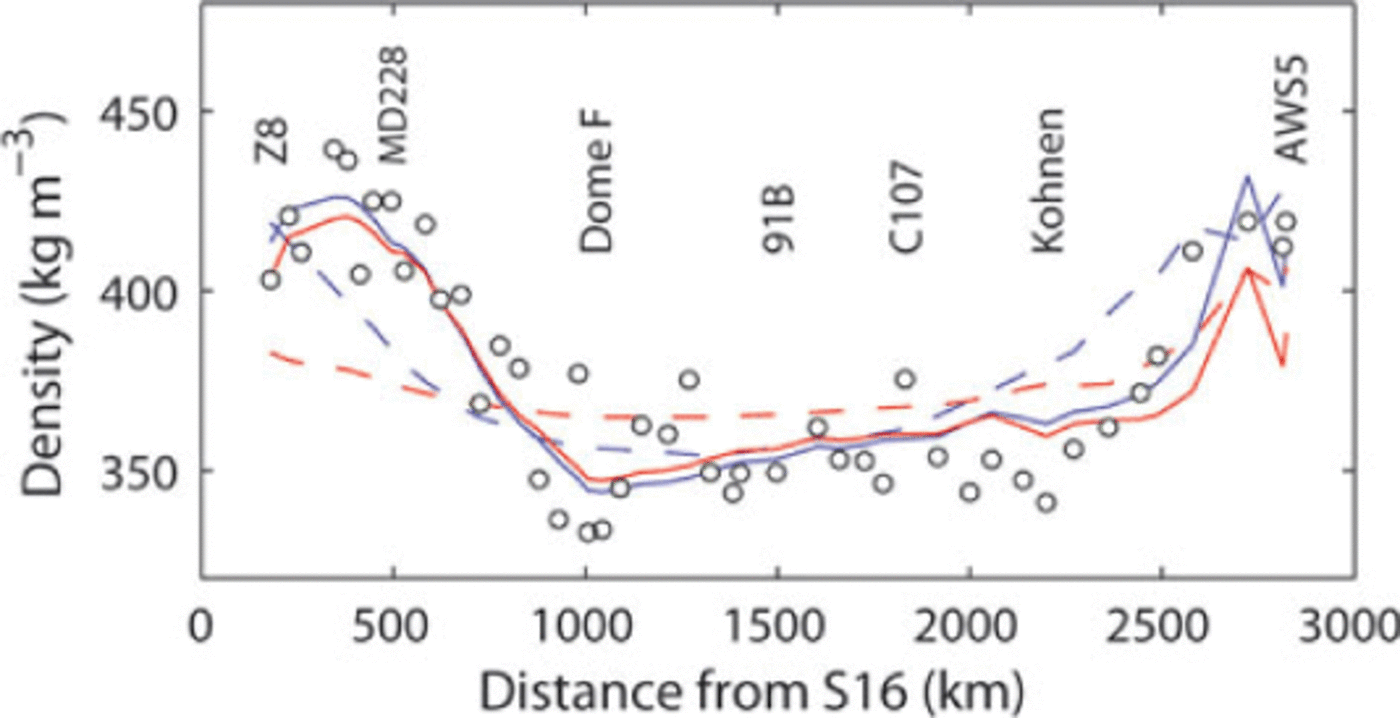
We calibrated Eqn (1) using our own snow densities and 10 m depth snow temperatures (this study; Reference Van den Broeke, Van As, Reijmer and Van de WalVan den Broeke and others, 2004), accumulation rates (Reference RotschkyRotschky and others, 2007;Reference Motoyama, Furukawa and NishioMotoyama and others, 2008;Reference FujitaFujita and others, 2011) and annual mean wind speed (Reference Lenaerts and Van den BroekeLenaerts and Van den Broeke, 2012), as described earlier in this section and shown in Figures 5f and 8a. Calibration parameters obtained by the least-squares method are listed in Table 2, along with correlation coefficients between the measured and modeled densities. The densities estimated using our own calibration of Eqn (1) correlate well with the field data, as indicated by the blue circles in Figure 9a (correlation coefficient r =0.91, p<10-6 and root-mean-square errori σ =13.1 kgm-3). The linear coefficient of wind speed was δ = 13.5 kg m-3 (m s-1)-1, nearly three times greater than the value (4.77 kg m-3 (m s-1)-1) reported by Reference Kaspers, Van de Wal, Van den Broeke, Schwander, Van Lipzig and BrenninkmeijerKaspers and others (2004). The regression analysis yielded a very small temperature coefficient (β = 0.543 kgm-3°C-1), indicating that the contribution of temperature to the density variation was small for the temperature range considered in our analysis (ΔT =32°C; Δρ = 17.4kgm-3). The importance of the wind speed was confirmed by a second regression analysis performed omitting the wind-speed term (Table 2). The densities estimated by this model (two variables) deviated more from the measurements (r =0.68;σ = 23.0 kg m-3) than the densities determined using Eqn (1) (three variables) (Fig. 9a). Figure 10 shows the performance of both regression analyses. The density variations from the inland plateau to the coastal regions are better reproduced by the model that includes the wind speed. Without the wind speed, the deviation from the observed data increases progressively from Dome F towards Wasa.
(a) Scatter plot of the densities measured in this study and those estimated from meteorological variables. (b) The same plot, but using a dataset including the densities reported by Kaspers and others (2004). The circles were estimated from the 10m depth snow temperature, accumulation rate and wind speed. The crosses show estimates from the 10m depth snow temperatures and accumulation rates only.
Fitting equations, correlation coefficients (r), p-values and root-mean-square errors (σ) obtained by multiple regression analysis of the density (ρ in kg m–3), 10m depth snow temperature (T in °C), accumulation rate (A in mm a–1) and wind speed (W in ms–1), performed with a dataset of size n

Snow density measured along the traverse route (o) and computed with a linear regression model. The regression coefficients in Eqn (1) were optimized for the data obtained in this study (blue solid line) and for those including previously reported data (blue dashed line). The red lines (solid and dashed) were obtained by omitting the wind-speed term from Eqn (1).
The major influence of the wind speed on the surface density was reported by Reference Endo and FujiwaraEndo and Fujiwara (1973) in data collected during their traverse expedition from Syowa to the South Pole in 1968/69. The mean density from the surface to 2 m depth correlated well with the surface slope along the route. Using a relationship between the slope and the annual mean wind speed, they derived a linear dependence of the density on the wind speed, with a value of 14 kg m-3 (m s-1)-1. Their coefficient agrees very well with the value obtained in this study. They also found that the density slightly increased as the temperature decreased, within regions where the mean wind speed was less than 10-11 m s-1 and the temperature ranged from -60 to -48°C. Reference Endo and FujiwaraEndo and Fujiwara (1973) argued that snowflakes are smaller in colder air conditions, which makes the initial snow density after deposition greater. Such an effect should be particularly visible inland, where temperatures and wind speeds are relatively low. A negative dependence of the density on temperature has also been reported in seasonal snow cover in the North American Arctic and Greenland (Reference Bilello and OuraBilello, 1967). The small temperature coefficient obtained in our work is consistent with these studies.
We performed additional regression analyses including the density and meteorological data compiled by Reference Kaspers, Van de Wal, Van den Broeke, Schwander, Van Lipzig and BrenninkmeijerKaspers and others (2004). However, the wind speeds in Kaspers’ original dataset were replaced with recent modeling results (Reference Lenaerts and Van den BroekeLenaerts and Van den Broeke, 2012). The parameters determined for a combined dataset (46 sites from this study and 49 sites compiled by Reference Kaspers, Van de Wal, Van den Broeke, Schwander, Van Lipzig and BrenninkmeijerKaspers and others, 2004) (Fig. 7) are listed in Table 2. The density is more accurately estimated when we include the wind speed as a predictor, as shown in Figure 9b (r =0.75 and σ = 20.7 kg m-3 for the three-variable model, while r =0.50 and σ = 27.1 kgm-3 for the two-variable model). Overall, the performance of the regression model worsened with the inclusion of Kaspers and others’ (1994) data (Fig. 10), which were collected from a wide area of Antarctica. It is more difficult to reproduce the clear change in the density from the coastal regions to the inland area. This result implies that the relative importance of the three predictor variables differs significantly in these regions, or that additional conditions with an impact on the density are coming into play. Thus, care should be taken when a linear regression model is applied to an extended region influenced by a broader range of meteorological and topographical conditions.
5. Conclusion
Density, structure and grain size were measured in the nearsurface snow layer at 46 locations along the route traversed in the Japanese-Swedish Antarctic Expedition 2007/08. The route spanned two coastal stations in East Antarctica, Syowa and Wasa. Its total length was ~-2800km, and its altitudinal range was 365-3800 m a.s.l. The mean density for the upper 1 (or 0.5) m layer varied from 333 to 439 kg m-3. In general, the snow had a lower density at higher elevations and in inland locations;this variation was related to meteorological variations between the coast and inland areas.
The elevation/temperature dependence of the density in the section between Dome F and Kohnen stations was significantly different from that in the section from the coastal region to Dome F. Although the density variation was fairly small from Dome F to Kohnen, the elevation dropped significantly from 3800 to 2890 m a.s.l. The traverse route between these two inland stations followed a ridge on the Antarctic plateau, where the wind speed was expected to be smaller than over other sections of the route. Our density data showed a strong, positive correlation with wind-speed distributions computed using a regional climate model (Reference Lenaerts and Van den BroekeLenaerts and Van den Broeke, 2012), suggesting the importance of wind in the nearsurface densification in this region. The grain size increased and the fraction of compacted snow decreased as we ascended from the coastal region to Dome F, also supporting the important effect of wind on snow metamorphism. Multiple regression analysis yielded a linear dependence of the density on the wind speed. The coefficient of this relationship is 13.5 kgm-3 (m s-1)-1, nearly three times greater than a previously reported value (Reference Kaspers, Van de Wal, Van den Broeke, Schwander, Van Lipzig and BrenninkmeijerKaspers and others, 2004). The strong influence of the wind on the density is consistent with field measurements by Reference Endo and FujiwaraEndo and Fujiwara (1973) during their traverse expedition to the South Pole. We conclude that wind-driven densification is a more important process than has previously been assumed in Antarctica.
Acknowledgements
We thank the members of the Japanese-Swedish Antarctic Expedition 2007/08 for help in the field. The field activity was part of the 48th and 49th Japanese Antarctic Research Expedition, and was supported by the National Institute of Polar Research, Tokyo, and the Swedish Polar Research Secretariat. The wind-speed data, computed using a regional climate model, were kindly provided by J.T.M. Lenaerts and M.R. van den Broeke;we gratefully acknowledge their contribution. The surface elevation and 10 m snow temperature data were provided by the US National Snow and Ice Data Center. We thank two anonymous reviewers for comments on the manuscript, and the scientific editor, P. Bartelt. This study was funded by the Japanese Ministry of Education, Science, Sports and Culture, Grant-in-Aid for Scientific Research (A), 20241007, 2008-2010.


