


1. Introduction
In Western democracies, female, lower-educated, poor, and ethnic minority citizens are less likely to be present in representative institutions, to have their perspectives listened to and taken seriously, and to get the policies they want (e.g., Young, Reference Young2000; Strolovitch, Reference Strolovitch2006; Wängnerud, Reference Wängnerud2009; Giger et al., Reference Giger, Rosset and Bernauer2012; Bovens and Wille, Reference Bovens and Wille2017). Political theorists and even international institutions such as the World Bank have argued that democratic innovations (DIs) can form a (partial) remedy to these various forms of political exclusion (Baiocchi and Ganuza, Reference Baiocchi and Ganuza2014). The implicit assumption is that citizens that tend to experience political exclusion indeed want more of these “institutions (…) designed to increase and deepen citizen participation in the political decision-making process” (Smith, Reference Smith2009, 1).
Various survey studies across Western democracies suggest that politically excluded citizens are indeed more likely to support direct and participatory forms of decision-making (e.g., Bowler et al., Reference Bowler, Donovan and Karp2007; Bengtsson and Mattila, Reference Bengtsson and Mattila2009; Schuck and De Vreese, Reference Schuck and De Vreese2015; for contradictory evidence, see Medvic, Reference Medvic2019). Some have argued that this is an expression of a “populist worldview” held by citizens who “are disillusioned with the rule of elected politicians” (Webb, Reference Webb2013, 768). Citizens that tend to be politically excluded would arguably prefer anything to existing representative institutions. In line with this “anti-establishment logic,” several studies show that some groups that have traditionally experienced political exclusion are equally supportive of participatory democracy as of “stealth” democracy, which emphasizes expert decision-making instead (Bengtsson and Mattila, Reference Bengtsson and Mattila2009).
Others suggest that rather than to expect that politically excluded citizens will prefer anything to the status quo, their support for a DI depends on the extent to which it is likely to equalize their chances of making their voices heard and getting what they want (Fung, Reference Fung2006; Smith, Reference Smith2009). This is in line with work in the field of social psychology that shows that people in general tend to favor decision-making processes that deliver favorable outcomes and allow them to exercise control over the process (see the overview in Bøggild and Petersen, Reference Bøggild, Petersen, Shackelford and Hansen2016). Higher support for DIs among politically excluded citizens, therefore, may not be the expression of an anti-establishment sentiment, but rather reflect an instrumental expectation that these innovations will compensate for the lack of control over political outcomes they are usually faced with (cf. Ceka and Magalhães, Reference Ceka, Magalhães, Ferrín and Kriesi2016). Citizens that usually cannot effectively voice their demands have more reason than their fellow citizens to support the implementation of specifically those DIs that indeed offer procedural control and favorable outcomes.
In this research note, we seek to adjudicate these competing explanations in the literature by empirically verifying to what extent the comparatively high support for DIs among this group of citizens reflects an anti-establishment or rather an instrumental logic. The former expects the higher support among citizens experiencing exclusion to be unconditional; the latter expects the relative difference in support to be significant only under the condition that a DI offers the politically excluded control over the process and/or provides them with an outcome they want.
Recent research in the field of DI confirms that citizens' support for DIs depends on both their design (Rojon et al., Reference Rojon, Rijken and Klandermans2019; Christensen, Reference Christensen2020) and the outcomes they deliver (Landwehr and Harms, Reference Landwehr and Harms2019; Werner, Reference Werner2019; van der Does and Kantorowicz, Reference van der Does and Kantorowicz2021). However, it has not yet empirically verified the expectation that procedural control and outcome favorability matter more among politically excluded citizens than among other citizens. It therefore does not allow one to understand to what extent the relatively high support for DIs among those at the margins of political decision-making is conditional upon DIs' procedural design and outcomes. We address this gap in the literature by means of a conjoint experiment on participatory budgeting administered among 3246 Dutch citizens. Based on a series of subgroup analyses, we do not find support for the anti-establishment logic and partial support for the instrumental logic. We show that measures of citizens' feelings of political exclusion help to explain some of the results that seem to contradict the instrumental logic.
2. Experiment and analysis
Our data come from an online survey experiment conducted among Dutch citizens on participatory budgeting at the local level. We embedded the experiment in three surveys administered in February and March 2019.Footnote 1 Table 1 provides further details on the surveys. We used sampling quotas based on sex and age (minimum age of 18 years). The analyses in the paper pool the responses to the three surveys in order to achieve a large enough sample size to conduct the subgroup analyses (see below).Footnote 2 The pooled sample is roughly representative of the Dutch population in terms of sex, ethnicity, and education (Table A1).
Overview of surveys

Note: the total N amounts to 38,952 observations, based on 3246 respondents that six times assessed two neighborhood budgets (i.e., 3246 × 6 × 2).
a “Middle-sized” = between 25,000 and 100,000 inhabitants; “small” = between 5000 and 25,000 inhabitants.
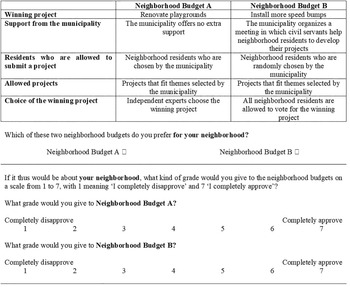
In the experiment, we first presented respondents with a hypothetical scenario about a so-called “neighborhood budget” (wijkbudget). This is a common term to refer to participatory budgeting at the neighborhood level in the Netherlands, and the scenario was inspired by recent experiences with such neighborhood budgets (NBs) in Dutch cities (Michels and De Graaf, Reference Michels and De Graaf2010; van der Does and Bos, Reference van der Does and Bos2021). We asked respondents to imagine that the municipality they live in will implement an NB in their neighborhood next year (Figures A2–3). We told respondents that it would allow residents to submit ideas for projects to improve the quality of life in their neighborhood and to decide which of these will be awarded €50,000 and subsequently executed. They were told that the municipality now needs to determine what such an NB will look like.
Following the logic of a conjoint analysis (Hainmueller et al., Reference Hainmueller, Hopkins and Yamamoto2014), respondents then six times performed a choice task. Each time, they were presented with two juxtaposed NBs. Figure 1 provides an example. Each NB consisted of five attributes, each displaying a randomly assigned level (for an overview of all possible levels, see Table A2).Footnote 3 We included attributes commonly encountered in the literature on DIs (Fung, Reference Fung2006; Smith, Reference Smith2009): how participants are selected, who sets the agenda, how decisions are made, what support is offered, and what the winning project is. To measure outcome favorability, we matched the displayed winning project to the respondent's evaluation of the project in another survey question (1: not at all preferred, 7: very much preferred). We treat scores above four as strong outcome favorability and all other scores as weak favorability. Underneath the two NBs, we asked respondents to (a) choose their preferred NB and (b) give an approval rating for each of the two NBs on a seven-point scale (1: completely disapprove; 7: completely approve).
Example of a choice task.

In the analyses, we rely on both objective and subjective measures of political exclusion. We use the former to test the expectations we derived from the wider literature on political exclusion linked to citizens' background characteristics; we use the latter to verify whether observed effects based on these objective measures are indeed the result of a feeling of exclusion. In terms of objective measures, we rely on three characteristics commonly associated with political exclusion: female (versus male), ethnic minority identification (versus majority identification), and lower level of completed education (versus higher vocational or university degree). In line with work on intersectionality (Wojciechowska, Reference Wojciechowska2019), we assume that the more of these characteristics respondents identify with, the more political exclusion they tend to experience. Hence, cross-group differences should be most (least) pronounced when we compare respondents that identify with all three (only one) characteristics to those that do not.
In terms of subjective measures, we use the answers to two survey items. One item functions as a proxy of voice in local politics (“Local politicians share my norms and values”), the other as a measure of influence on local politics (“An ordinary citizen like me cannot influence local politics”) (1: completely disagree; 7: completely agree) (cf. “external” and “internal” forms of exclusion in Young, Reference Young2000, 53–55).Footnote 4 We reversed the scores on the former item so that higher scores on both items indicate a stronger sense of political exclusion. For the subgroup analyses using these items, we grouped respondents with scores of 1–4 as citizens with a “weak” feeling of political exclusion and respondents with scores of 5–7 as citizens with a “strong” feeling of exclusion.
The analyses proceed in two steps. In the first step, we describe the average cross-group differences in approval ratings. This serves to establish to what degree we observe the expected differences in respondents' overall support for NBs. In the second step, we conduct a series of subgroup analyses to analyze to what degree we can explain cross-group differences based on the design and outcomes of the respective NBs, allowing us to verify the two competing explanatory logics. For these subgroup analyses, we use the forced choice as the dependent variable (for a justification, see the online Appendix). Following Leeper et al. (Reference Leeper, Hobolt and Tilley2020), we estimate the conditional marginal means rather than the average marginal component effects for all subgroup analyses.Footnote 5 This allows us to interpret the effects as the average marginal difference in the probability of choosing an NB. We used the cjoint and cregg packages to conduct the analyses (Hainmueller et al., Reference Hainmueller, Hopkins and Yamamoto2014; Leeper, Reference Leeper2018). The online Appendix provides further details on the study design, methods, and results.
3. Results
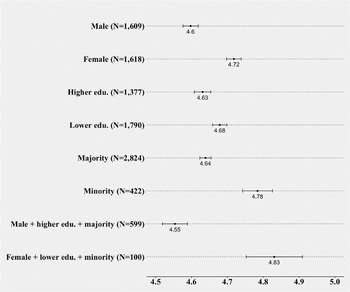
Figure 2 displays the average approval ratings for each group. Citizens seem to give relatively high ratings on average, with cross-group differences ranging between 0.05 and 0.28 on the seven-point rating scale. We find that citizens that identify with objective characteristics associated with political exclusion, on average, give significantly higher approval ratings. The difference is largest for the comparison between citizens identifying with all three characteristics and those citizens that do not, confirming our expectation based on the literature on intersectionality.
Cross-group differences in approval ratings. Shows the grand mean of respondents' approval ratings for each group with 95 percent confidence intervals.

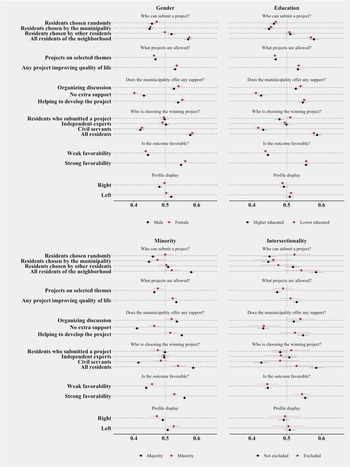
Figure 3 shows the results of the subgroup analyses for the objective measures of exclusion. The results contradict the anti-establishment logic: in all four comparisons, we observe that at least one of the attributes matters significantly for the marginal difference in the probability of choosing one of the NBs over the other (Figure A16). The effect sizes range from an average difference (Δ) between groups of 1.3 to 7.2 percentage points (pp) in the probability of choosing an NB. The observed significant differences provide partial support for the instrumental logic. We deal with each comparison in turn.
Results of subgroup analyses for objective measures of political exclusion. Shows the marginal means with 95 percent confidence intervals. “Excluded” (female, lower educated, minority) and “not excluded” (male, higher educated, majority) refer to intersections of the three characteristics. Figure A16 reports the difference in marginal means.

3.1 Gender
All observed significant differences are in line with the instrumental logic. Compared to men, women were more likely to choose NBs that offered more procedural control and favorable outcomes.Footnote 6 Specifically, they were less likely to choose NBs that only allowed representatives to submit a project (Δ – 2.1pp) and offered no extra support (Δ – 3.0pp); and they were more likely to choose NBs that included organized discussions (Δ + 1.5pp) and led to favorable outcomes (Δ + 1.3pp). Yet, contrary to the instrumental logic, the preference for such NBs among women did not derive from a stronger feeling of political exclusion: women did not feel significantly more excluded than men did (Figure A13).
3.2 Education
The one significant difference we find contradicts the instrumental logic: compared to higher-educated citizens, lower-educated citizens were significantly more likely (Δ + 3.1pp) to select NBs that allowed only residents that had submitted a project to make the final decision. We also observe that lower-educated citizens, on average, felt significantly more excluded from local politics—both in terms of lacking voice (Δ + 0.20) and influence (Δ + 0.41) (Figure A13). This casts further doubt on the expectation of an instrumental logic underlying the higher support for NBs among lower-educated citizens.
3.3 Ethnicity
Nearly all significant differences appear to disconfirm the instrumental logic: those belonging to an ethnic minority were generally less after procedural controlFootnote 7 or getting the outcomes they want (Δ + 1.8pp for weak favorability, Δ – 3.2pp for strong favorability). Yet, based on their reported feelings of exclusion, we reach a more mixed conclusion. Their feelings pulled in two directions: they felt significantly more politically excluded in terms of a lack of influence (Δ + 0.37) but also significantly less so in terms of lacking voice (Δ – 0.44) (Figure A13). The former further contradicts the instrumental logic: ethnic minorities felt more strongly that they could not influence politics and were less after the outcomes of NBs. The latter confirms it instead: a stronger feeling of having voice went hand in hand with a lesser concern for procedural control via NBs.
3.4 Intersectionality
The significant differences provide mixed support for the instrumental logic. In line with the respective logic, compared to other citizens, citizens identifying with all three objective measures of exclusion were significantly more likely to choose an NB that randomly selected who could submit a project (Δ + 7.2pp). Contrary to the same logic, the positive effect of allowing all residents to make the final decision was significantly smaller for citizens identifying with all three characteristics of exclusion (Δ – 5.6pp). On average, we did not observe significant differences in feelings of exclusion across the two groups (Figure A13). Overall, however, the results for this last subgroup analysis remain tentative as we have much less statistical power (see the wide confidence intervals in Figure 3 and the power analysis in the Appendix).
4. Discussion
Our results show that, on average, citizens identifying with objective measures of political exclusion give significantly more support to neighborhood-level participatory budgeting than do their fellow citizens. We find no evidence for the “anti-establishment” logic that predicted the overall higher support among these citizens to be unconditional. We find partial support for the “instrumental” logic that predicted that higher support among this group of citizens would be conditional upon NBs offering more (rather than less) procedural control and returning favorable outcomes. Our results provide mixed support for this logic among women, ethnic minorities, and citizens identifying with all three characteristics of exclusion. The findings did not provide support for this logic among lower-educated citizens.
Part of the explanation why we observe such limited support for the instrumental logic lies in citizens' feelings of being excluded. As we show in the online Appendix, citizens with a stronger sense of lacking influence on politics, on average, were less concerned with procedural control and getting what they wanted; citizens that felt more strongly that they lacked voice were generally more inclined to choose NBs that offered such control and favorable outcomes (Figures A14–15). This might explain why lower-educated citizens (who felt more strongly that they lacked influence than that they lacked voice compared to higher-educated citizens) were bothered less by decisions being taken by residents that had submitted a project. It might equally explain the little support the results provide for the instrumental logic among ethnic minorities who felt both less excluded in terms of voice and more excluded in terms of influence compared to citizens not identifying with an ethnic minority.
Still, this leaves us with the question why a perceived lack of influence tends to go hand in hand with less support for NBs that offer more procedural control and/or favorable outcomes. Part of the explanation seems to be that in our sample citizens with a strong sense of lacking influence, overall, tended to differentiate less between NBs based on their design features and outcomes (Figures A14). Another remaining question is why we observe gender differences while women did not feel more politically excluded. This might be due to our measurement instruments but could also reflect deeper differences between men and women in their respective inclinations toward participatory practices (cf. Eagly and Carli, Reference Eagly and Carli2003).
We leave these questions for future studies and acknowledge, furthermore, that our findings are limited to a single type of DI in a specific context. For example, political exclusion in other countries may be more or less pronounced and, consequently, lead to different effect sizes. Notwithstanding such limitations, we think our study has two important implications. First, we find no clear evidence for the anti-establishment logic. This suggests that design features and outcomes not only matter for the “average” citizen's support for DIs but also (and in some respects even more so) for the support of those that tend to be on the fringes of the political system. Second, when studying cross-group differences in support for DIs, it is crucial to verify assumptions about citizens' own experiences of political exclusion. Clearly, ascribed categories of exclusion can only get us so far in understanding these differences.
Supplementary material
The supplementary material for this article can be found at https://doi.org/10.1017/psrm.2022.3. To obtain replication material for this article, please visit: https://doi.org/10.7910/DVN/IZ1T9I
Acknowledgments
We would like to thank the participants at the CESPOL seminar for their valuable comments on earlier drafts of this article. This research has been supported with a grant from CID The Hague, sponsored by City of The Hague, Leiden University, Delft University of Technology and The Hague University of Applied Sciences. Ramon van der Does also received grants from the Fonds spéciaux pour la recherche – Université catholique de Louvain (ADi/DB/10256.2018) and from the F.R.S.-FNRS (FC27855).


 Open access