





Impact statement
As changing precipitation patterns continue to exacerbate flooding risks across the North American Great Lakes Basin, the adoption of Nature-based Solutions (NbS) to address gray infrastructure capacity needs and biodiversity loss is gaining traction. While the associated benefits are well-supported by existing research, challenges remain for coordinated regional adoption that operates at the watershed and ecosystem scales. In deindustrializing Southeast Michigan, an outdated and failing combined infrastructure system combined with sprawling urbanization patterns and a fragmented water governance system makes cross-sector collaboration urgent. This paper demonstrates a practical, transferable approach for scaling up fragmented green infrastructure projects toward a coordinated regional NbS portfolio. Building on a transdisciplinary research approach, the project cultivates new alliances, offers a nuanced interpretation of challenges and opportunities ahead, and develops new tools for public legibility and decision-making. The investigation mobilizes a research through design methodology that develops and tests a suite of collaborative planning tools to translate complex engineering models, historical and socio-spatial records, and ecological knowledge into shared boundary objects that can inform utilities, municipalities, watershed organizations, and community groups planning regional NbS installations. These tools make visible the hidden continuities between surface flooding, buried hydrology, and gray stormwater networks; clarify how authority, resources and responsibilities are distributed across the region; support context-specific siting and phasing of NbS over time; and foreground fish and wildlife habitat as a co-objective versus just a co-benefit. By challenging three persistent assumptions – that flooding is solely a crisis to be controlled, that urban nature is spatially uniform and neutral, and that nature can be manufactured as a finished product – this work reframes NbS as an ongoing, place-based process requiring stewardship, governance coordination, and explicit attention to equity and multispecies habitats. The approach is applicable to inland coastal urban regions worldwide where climate stress, infrastructural legacies, uneven coping capacities, and governance fragmentation converge.
Introduction
Sited at the heart of the North American Great Lakes Basin (GLB), the world’s largest freshwater system with roughly 20% of the planetary reserves, the state of Michigan stewards a 3,288-mile coastline with approximately 387 coastal communities (Michigan Department of Environment, Great Lakes and Energy, n.d.; National Oceanic and Atmospheric Administration, 2016). The Great Lakes are a dynamic system where water elevation changes follow decadal cycles (Norton, Reference Norton2024, 4). These are now compounded by increasing global air temperatures further altering lake surface temperatures (LST), changing the duration and extent of ice cover and snow melt, increasing the moisture-retention capacity of the air, and shifting precipitation patterns – resulting in an increased frequency of extreme rainfall events (Abdelhady et al., Reference Abdelhady, Fujisaki-Manome, Cannon, Gronewold and Wang2025; ELPC, 2025, 1). These shifts contribute to fluctuating lake water levels, increased stormwater runoff, and broader changes to water and terrestrial ecosystems (US Environmental Protection Agency, 2025a; US EPA, 2025b). With heavily developed waterfronts served by outdated infrastructures, Michigan’s coastal cities are contending with the hardships of severe and catastrophic urban flooding, further aggravated by cyclical high water levels in the GLB (Buckman et al., Reference Buckman, Arquero de Alarcón and Maigret2019).
With over 4.8 million residents, the inland coastal region of Southeast Michigan (SEMI) accounts for over 50% of the state’s population who either live on the Great Lakes shoreline or within its coastal watersheds (National Oceanic and Atmospheric Administration, 2016; SEMCOG, n.d.; U.S. Census Bureau, 2020a). In recent years, high-intensity storms routinely exceeded the design capacity of the regional combined wastewater and stormwater infrastructure, resulting in widespread property damage and severe public and environmental health risks (Larson et al., Reference Larson, Gronlund, Thompson, Sampson, Washington, Thorsby, Lyon and Miller2021; Sampson et al., Reference Sampson, White-Newsome, Gronlund, Leaphart, Miller, Steis Thorsby, Larson, Jackson, Ackerman, Washington and Thompson2021). Flooded basements, submerged highways, disruptions to urban operations, and combined sewer overflows have become common occurrences prompting three Federal Disaster Declarations for flooding or severe storm events in 2014, 2021 and 2023 (FEMA, n.d.). The region’s aging combined system – with pipes up to 100 years old in the older urban areas – cannot handle peak volumes under wet weather, and renovation needs are estimated at over $1 billion annually (Sabourin, Reference Sabourin2016, 309; DWSD, 2024).
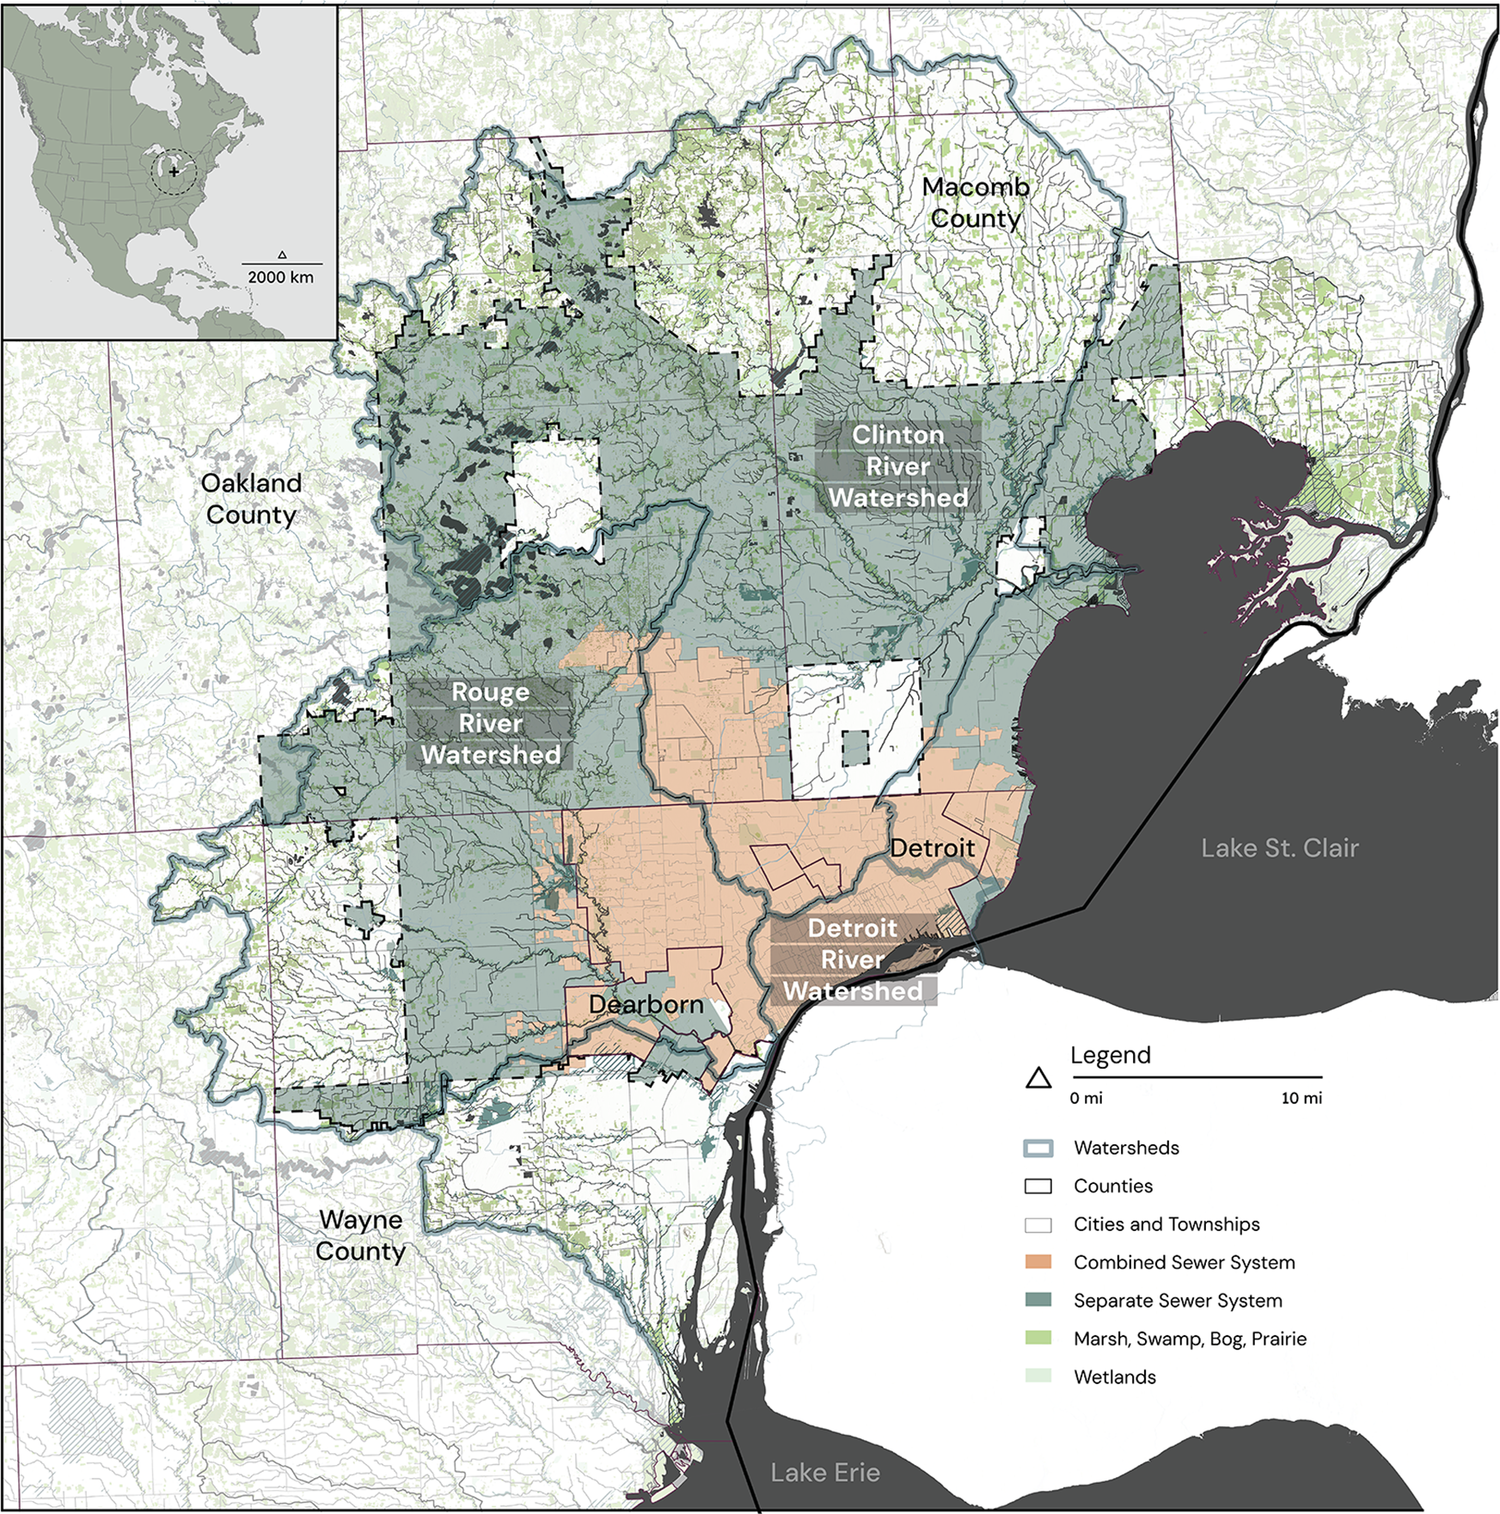
The Great Lakes Water Authority (GLWA) is the regional utility providing potable water supply, wastewater management, and systems operation (Sabourin, Reference Sabourin2016; GLWA, 2020). Specifically, GLWA provides wastewater services to approximately 2.4 million residents across nearly 946 square miles (GLWA, n.d.), spanning the Detroit, Rouge, and Clinton River watersheds and 78 cities and townships (GLWA, 2020; Figure 1). The centralized wastewater system converges into the largest single-site Water Resource Recovery Facility, located at the confluence of the Rouge and Detroit Rivers in Detroit. The heavily centralized combined wastewater system’s design confronts many operational challenges. In 2021, GLWA recorded the entry of 5.9 billion gallons of untreated sewage into the Detroit and Rouge Rivers in 41 combined system overflow (CSO) events due to lack of capacity under wet weather (Haapaniemi et al., Reference Haapaniemi, Doran, Strassberg, Isely, Nordman, Isely, Glupker, Viars, Dierks, Giese and Noye2023). While improvements to the vast and aging system continue, the limits of gray infrastructure expenditure to control stormwater and mitigate flooding risks are well documented (We the People of Detroit Community Research Collective, 2016). Yet, while the system design is highly centralized, the management and governance of stormwater is not. Varying capacities and responsibilities at municipal and regional levels contribute to siloed and fragmented approaches to coordination.
Map of study area (relative location in inset), outlining watersheds, rivers, streams, lakes, counties, townships and sewer system type in the Great Lakes Water Authority (GLWA)’s Wastewater Service Area, within Southeast Michigan. Source: Author’s map using watershed boundaries, lake, river, stream, wetland, marsh and swamp data from USGS (2022); township, county, and wastewater service area boundaries from SEMCOG (2018); US Census Bureau (2021); and GLWA (n.d.).

Figure 1. Long description
Map of Southeast Michigan, oriented north. Top-left inset shows a North American continental outline locating the Great Lakes region. Three counties are labeled: Macomb (north), Oakland (west), Wayne (south); cities of Detroit and Dearborn are marked centrally. Three watershed boundaries in bold blue: Clinton River (north-east), Rouge River (center-west) and Detroit River (center-south). Two fill colors indicate GLWA sewer system coverage: orange-peach for the Combined Sewer System and dark green for the Separate Sewer System. Light green patches indicate marshes, swamps, bogs and prairies; brighter green indicates wetlands. Lake St. Clair (east) and Lake Erie (south) appear as dark gray masses. Rivers and streams are thin dark lines. Legend in the lower-right identifies all seven map categories, with a north arrow and 0–10 mile scale bar.
In this context, the adoption of green storm water infrastructure projects (GSI) has been slowly gaining cultural acceptance and the buy-in of local governments in the region. Over the last decade, hundreds of GSI installations have been implemented in the region, addressing the wastewater regional infrastructure needs during wet weather. Of those, more than 300 GSI projects have been implemented in Detroit alone, including a wide range of types and performance capacities that manage in total some 600 million gallons (Detroit Stormwater Hub, n.d.). Although these interventions have become a critical regional strategy to advance flooding mitigation efforts, stormwater management through GSI projects remains fragmented across municipalities in the GLWA service area (Arquero de Alarcón and Maigret, Reference Arquero de Alarcón, Maigret, Ibañez, Lyster, Waldheim and White2017; Thorsby et al., Reference Thorsby, Miller and Treemore-Spears2020; Haapaniemi et al., Reference Haapaniemi, Doran, Strassberg, Isely, Nordman, Isely, Glupker, Viars, Dierks, Giese and Noye2023). Since the inception of its 2014 Green Infrastructure Plan, the Southeast Michigan Council of Governments (SEMCOG) has expanded its regional coordinating role through the GREEN (Growing our Resilience, Equity and Economy with Nature) Strategic Framework and Dashboard (SEMCOG, 2014, 2023). Other recent efforts include an ongoing Flood Risk Management Study for Southeast Michigan by the U.S. Army Corps of Engineers (USACE, 2022). This article emerges from a parallel two-year, interdisciplinary study funded by the National Fish and Wildlife Foundation’s Coastal Resilience Fund to develop a planning framework for regionally scaled Nature-based Solutions (NbS). The project devises an approach to NbS planning integrated with the gray infrastructure system across the GLWA service area through collaboration across technical, design, ecology and finance domains, as well as broad stakeholder engagement.
Building upon the International Union for the Conservation of Nature (IUCN)’s framework, we adopt the concept of NbS for its ability to operate as an umbrella term: “NbS refers to broad actions that protect, manage, and restore ecosystems to address major societal challenges while benefiting both human well-being and biodiversity” (IUCN, 2020). Under this framework, GSI interventions focus on stormwater management and flood mitigation at the site level and are primarily managed as a utility function. Instead, NbS operate at a landscape-scale, incorporating adaptive management over time and emphasizing inclusive governance and stakeholder empowerment (IUCN, 2020). The framework offers a holistic assessment that accounts for their hydrological performance but also for their ecological, social, and economic co-benefits (Sowińska-Świerkosz and García, Reference Sowińska-Świerkosz and García2022). This broader planning framework is especially relevant in Southeast Michigan, where stormwater management must account for uneven urban ecologies, fragmented governance, the legacies of infrastructural injustice and varying local capacities.
Advancing from isolated GSI projects toward integrated NbS requires challenging the persistent biases that govern planning decisions in the region. Our study highlights three dominant assumptions: the view of flood management as a control-oriented crisis response, the treatment of urban nature as spatially uniform across the vast regional landscapes and the treatment of nature as a deliverable, manufactured commodity. The following section contextualizes these three assumptions, followed by the examination of the mixed methods mobilized in the project. The findings section discusses the collaborative tools to enable a more contextually grounded, process-based, and publicly legible approach to NbS planning in Southeast Michigan, and the discussion section situates the transferability of the approach to other Great Lakes coastal regions.
The manufactured watershed: Assumptions surrounding urban flooding
Taming the waters: Urbanisms of control
Great Lakes Indigenous narratives emphasize the connection of land and water, with flooding as a natural and recurring event with simultaneously destructive and regenerative roles. The Ojibwe people of the Lake Superior Basin narrate stories of underwater panthers casting floods as powerful but cyclic events tied to the renewal of the land (Lemaître, Reference Lemaître2015). Iroquoian people tell stories of a submerged world where land emerged on the back of a giant turtle (Robinson, Reference Robinson2018) to show the inevitability of co-existence with water. These cosmologies embrace flooding as a cultural and spiritual planetary attribute, one speaking of human coexistence and adaptation to changing water cycles. When French settlers first accessed the region using canoes to navigate the marshy expanses along the Detroit River in the early 1700s (Boles, Reference Bolesn.d.), a slow but progressive transformation began. The colonization of the river shorelands in subsequent decades drained the marshy areas and established land property claims. During the nineteenth century, cartographers captured with precision the progressive making of a fixed coastline (Farmer, Reference Farmer1855).
By the early twentieth century, the transformation of the region’s hydrological landscape made way for the industrial ascent of Detroit. By the early twentieth century, its rapid urbanization led to the regularization of streams to operate as drainage ditches parallel to emerging roads (Napieralski and Welsh, Reference Napieralski and Welsh2016, 302). By the 1950s, 86% of Detroit’s stream network had been lost to burial (Napieralski and Welsh, Reference Napieralski and Welsh2016, 301) and replaced by engineered conveyance systems to maximize dry land for urban development (Rosenzweig et al., Reference Rosenzweig, McPhillips, Chang, Cheng, Welty, Matsler, Iwaniec and Davidson2018, 3), infrastructure and industrial production. The resulting terrain, marked by the channelization, draining, and burial of natural hydrology, was grounded in a paradigm of expediency and control. As water was removed from sight, flooding became an act of exceedance and therefore a crisis, neglecting its vital function to ecosystems (Poff et al., Reference Poff, Allan, Bain, Karr, Prestegaard, Richter, Sparks and Stromberg1997).
By the 1970s, Detroit’s image as the archetypal world auto metropolis started to shift, with the city declining due to decentralized manufacturing, automation, and labor restructuring (Darden, Reference Darden2023, 2–3; Phinney, Reference Phinney2018, 610–611). Detroit’s decline paralleled the region’s prosperity. The Detroit Water and Sewerage Department (DWSD), with a dwindling and impoverished customer base, struggled to maintain and operate the oldest portions of the combined system, many CSO outfalls and the wastewater treatment plant in the city of Detroit (DWSD, 2015). As Detroit emerged from the largest municipal bankruptcy in the US history in 2014 (Phinney, Reference Phinney2018, 616–617), the entire DWSD system was restructured, giving birth to GLWA and diluting the city of Detroit’s power within the utility (We the People of Detroit Community Research Collective, 2016; GLWA, 2018). Under this new structure, challenges persist, and flooding is widespread across the region under wet weather regimes.
One size [does not] fit all: The unevenness of urban nature
The term Nature-based Solutions (NbS) was first coined in 2008 as a portfolio of biodiversity projects linking environmental conservation with economic development goals (Sowińska-Świerkosz and García, Reference Sowińska-Świerkosz and García2022). Under the 2020 IUCN Standard, the term incorporates Green Stormwater Infrastructure (GSI), Low-Impact Development (LID), Ecosystem-based Adaptation (EbA), and Natural Flood Management (NFM) approaches and requires a net gain for biodiversity, ecosystem integrity and inclusive governance. IUCN’s framework for NbS offers a roadmap for climate adaptation grounded in ecological integrity, adaptability and participation (U.S. EPA, 2007; Prince George’s County DER, 1999; IUCN, 2020, 7).
To advance the adoption of NbS framework, we must contend with the uneven legacies of infrastructural urbanism in SEMI, long governed by the politics of expediency and austerity. These legacies are not only historical in their expression but also contemporary spatial, institutional, and territorial practices. The legacy of racial segregation and systemic disinvestment in Detroit is etched into its socio-spatial landscape. Redlining policies systematically directed disinvestment toward predominantly Black and low-income neighborhoods – the same areas often situated atop the city’s 294 km of buried streams (Napieralski and Welsh, Reference Napieralski and Welsh2016, 300–303). This intersection of ecological erasure and socio-spatial disenfranchisement has resulted in a contemporary landscape defined by suppressed hydrology and profound socio-environmental inequality.
Contemporary planning paradigms frequently re-identify these marginalized landscapes as “optimal” sites for green intervention. However, Gaber (Reference Gaber2021) cautions against large-scale GSI projects targeted at high-vacancy, predominantly low-income neighborhoods already burdened by chronic flooding and water-debt foreclosures – termed “blue-lining” (Safransky, Reference Safransky2014; Gaber, Reference Gaber2021). In this context, blue-lining perpetuates historical socio-spatial injustice, demonstrating how hydrological urgency, systemic disinvestment, and dispossession are bundled into a contemporary logic of urban redevelopment.
Treating urban renaturalization as a neutral redevelopment approach constitutes one axis of unevenness. Evidence from postindustrial areas such as Greenpoint, Brooklyn, demonstrates that green infrastructure can catalyze gentrification and the subsequent displacement of working-class residents (Curran and Hamilton, Reference Curran and Hamilton2012). In this dynamic, the scale of intervention becomes a critical determinant of socio-spatial impact. Curran and Hamilton (Reference Curran and Hamilton2012) contend that smaller, community-driven projects may successfully integrate ecological benefits without triggering the speculative pressures associated with massive capital investments (Curran and Hamilton, Reference Curran and Hamilton2012, Reference Curran and Hamilton2020). These concerns are acutely relevant in SEMI, where proposed retention landscapes frequently overlap with neighborhoods already grappling with water insecurity, service shutoffs, and property foreclosures – most notably in Detroit’s Brightmoor neighborhood within the Upper Rouge Tributary (Gaber, Reference Gaber2021).
Governance constitutes another axis of unevenness. The GLWA service area spans three counties with vastly divergent fiscal and political capacities – Detroit carries a median household income of $38,000 against Oakland County’s $81,587 (GLWA, 2020; U.S. Census Bureau, 2020b) – while its hybrid of combined and separate sewer systems distributes CSO burdens and liabilities unevenly across jurisdictions (Sabourin, Reference Sabourin2016; GLWA, 2020; Ignaczak, Reference Ignaczak2025). Parallel to these institutional disparities is the unevenness of the natural and engineered environment. The efficacy of NbS installations is inherently site-contingent. A century of intensive industrialization and water pollution in SEMI has severely compromised watershed health, creating management challenges that are most acute within the micro-watersheds of buried streams (Napieralski and Welsh, Reference Napieralski and Welsh2016). Given that flow regimes are inherently contextual (Poff et al., Reference Poff, Allan, Bain, Karr, Prestegaard, Richter, Sparks and Stromberg1997), any systemic intervention must be calibrated to the specific spatial and temporal dynamics of its unique hydrological position.
Nature manufactured: The technocratic reduction
NbS are frequently championed for their promised synthesis of cultural, economic, and socio-ecological co-benefits, embedded within an interconnected framework (IUCN, 2020; World Bank, 2021). In practice, not all co-benefits are equally privileged, with co-benefits such as biodiversity sidelined in favor of cost efficiency (Seddon et al., Reference Seddon, Chausson, Berry, Girardin, Smith and Turner2020). Furthermore, static representations reinforce the assumption that saplings will immediately provide canopy cover, bioswales will instantaneously filter runoff, and daylighted streams will spontaneously emerge as wildlife corridors (World Bank, 2021). Underlying these projections is the flawed premise that nature can be manufactured as a finished product, with the speed, precision, and performance criteria of manufactured final outputs (Gandy, Reference Gandy2015).
Ecological processes, however, inherently resist such linear logics, refusing to synchronize with the political and economic temporalities of urban territories. Water regimes – variable in magnitude, frequency, and duration – refuse the strict templates imposed by static infrastructural frameworks (Poff et al., Reference Poff, Allan, Bain, Karr, Prestegaard, Richter, Sparks and Stromberg1997). This multifaceted agency of water, through precipitation, infiltration, evaporation, and lateral flow, is often reduced to the singular category of “flooding” only when it transgresses human-drawn boundaries (Junk et al., Reference Junk, Bayley, Sparks and Dodge1989). Designing interventions within a single temporal frame further erases the fluid complexity of water’s other states, such as moisture, groundwater, mist, snowmelt, clouds, and rain (Mathur and da Cunha, Reference Mathur, da Cunha and Mossop2018).
This instrumentalization of urban nature risks reducing complex ecological processes to programmable service units. While the IUCN framework for NbS explicitly addresses biodiversity and includes non-human agents as beneficiaries (IUCN, 2020), these actors are often treated as compliant substrates within a predominantly anthropogenic agenda. As Gandy (Reference Gandy2018) warns, this approach produces a “calculative ecology” in which biodiversity and resilience are commodified. The coevolutionary agencies of flora, fauna, and microorganisms, compounded by climate uncertainty, generate hybrid emergent ecologies that resist stabilization as fixed infrastructure (Tsing, Reference Tsing2015). When a manufacturing logic is applied to the living world, non-human actors may instead produce unintended outcomes, such as ecological homogenization, the proliferation of invasive species, or outright erasure, which ultimately undermine the very biodiversity GSI aspires to encourage (Gandy, Reference Gandy2018).
Methods
This investigation adopts a transdisciplinary design research (TDR) methodology (Lang et al., Reference Lang, Wiek, Bergmann, Stauffacher, Martens, Moll, Swilling and Thomas2012) to integrate multi-disciplinary scientific data with the situated expertise of non-academic stakeholders toward shared tools for decision-making. This approach is distinguished by the co-development of research outputs through iterative knowledge exchange among disciplines, practitioners, and communities, which positions non-academic engagement as central, and not supplementary, to the research process (Nassauer, Reference Nassauer2023). The core academic team spanned the disciplines of engineering, architecture and urban design, ecology, and finance, in collaboration with an environmental engineering firm. Central to this effort were research through design (RTD) methods (Cortesão and Lenzholzer, Reference Cortesão and Lenzholzer2022), wherein the prototyping and iterative refinement of visual planning tools served as a mode of knowledge production. This process-oriented approach to regional NbS planning allowed the team to synthesize siloed datasets into integrated propositions. This ensured outputs that were theoretically grounded, scientifically robust, and socially actionable, calibrated to regional operational needs and integrating the practical expertise of regional stakeholders.
Research findings were advanced and validated through a Partner Advisory Group (PAG) of 99 participants from 36 organizations, including federal, state and municipal agencies, non-profits and community groups. Nine quarterly workshops provided a capacity-building platform for the integration of stakeholder knowledge, iterative questioning, and refinement. The PAG co-evaluated project outputs, providing the feedback necessary to bridge jurisdictional fragmentation and increase the legibility of planning frameworks and applied tools. Engagement with the PAG mobilized multiple qualitative methods including a structured SWOT Analysis conducted at the first meeting, structured feedback worksheets at subsequent meetings, expert presentations with moderated thematic breakout sessions, site visits to relevant local sites, and a visioning charrette where participants discussed and refined prototypical NbS scenarios. Feedback from these engagements informed the iterative development of the project’s outputs.
The RTD process was informed by five data streams: (1) hydrological and infrastructural modeling for flood analysis, using the Stormwater Management Model (SWMM), the Rainwater Model (RWM), the GLWA Combined Sewer System model (CSS), a Blue Spot topographic model visualized surface flow and pooling vulnerabilities; (2) spatial and historical mapping, including the digitization and orthorectification of historical maps (e.g., Farmer, Reference Farmer1855) to identify “erased” streams, layering these with current socioeconomic and property data; (3) ecological assessment through 22 qualitative interviews with 15 conservation organizations’ experts who identified 60 priority species (whose habitat and trophic requirements were further defined through a targeted literature review); (4) precedent and typological studies of built GSI/NbS projects analyzing spatial and operational characteristics was reconciled with IUCN NbS principles to derive context-sensitive regional prototypes; and (5) financial and risk analysis developed through case studies to model revenue-generating co-located assets and explore regional risk-pooling as a shared NbS financing mechanism (Rohde et al., Reference Rohde, Maharani, Wolf and Adriaens2026).
Synthesizing these five data streams into a shared decision-making framework required outputs legible across professional languages that do not speak to each other by default. The resultant toolkit was, therefore, designed as a suite of multimodal boundary objects (Star and Griesemer, Reference Star and Griesemer1989): artifacts maintaining a common identity across communities while remaining flexible enough to serve the distinct needs of each group. This included an ArcGIS Online platform with layered site assessment for thematic socio-political and system-flow cartographies; a regional transect to establish ecological and infrastructural continuities across urban–rural gradients; an actor network diagram mapping stakeholders and assets; and physical planning cards. Together, these boundary objects shape workflows and collaborative decision-making tools toward a relational framework for regional NbS planning. By integrating a rich set of visual outputs, the project shifts the focus from isolated flood mitigation through gray-infrastructure control to a systemic, multi-actor process for socioecological stewardship.
Findings: Devising integrated tools for regional NbS collaborative planning
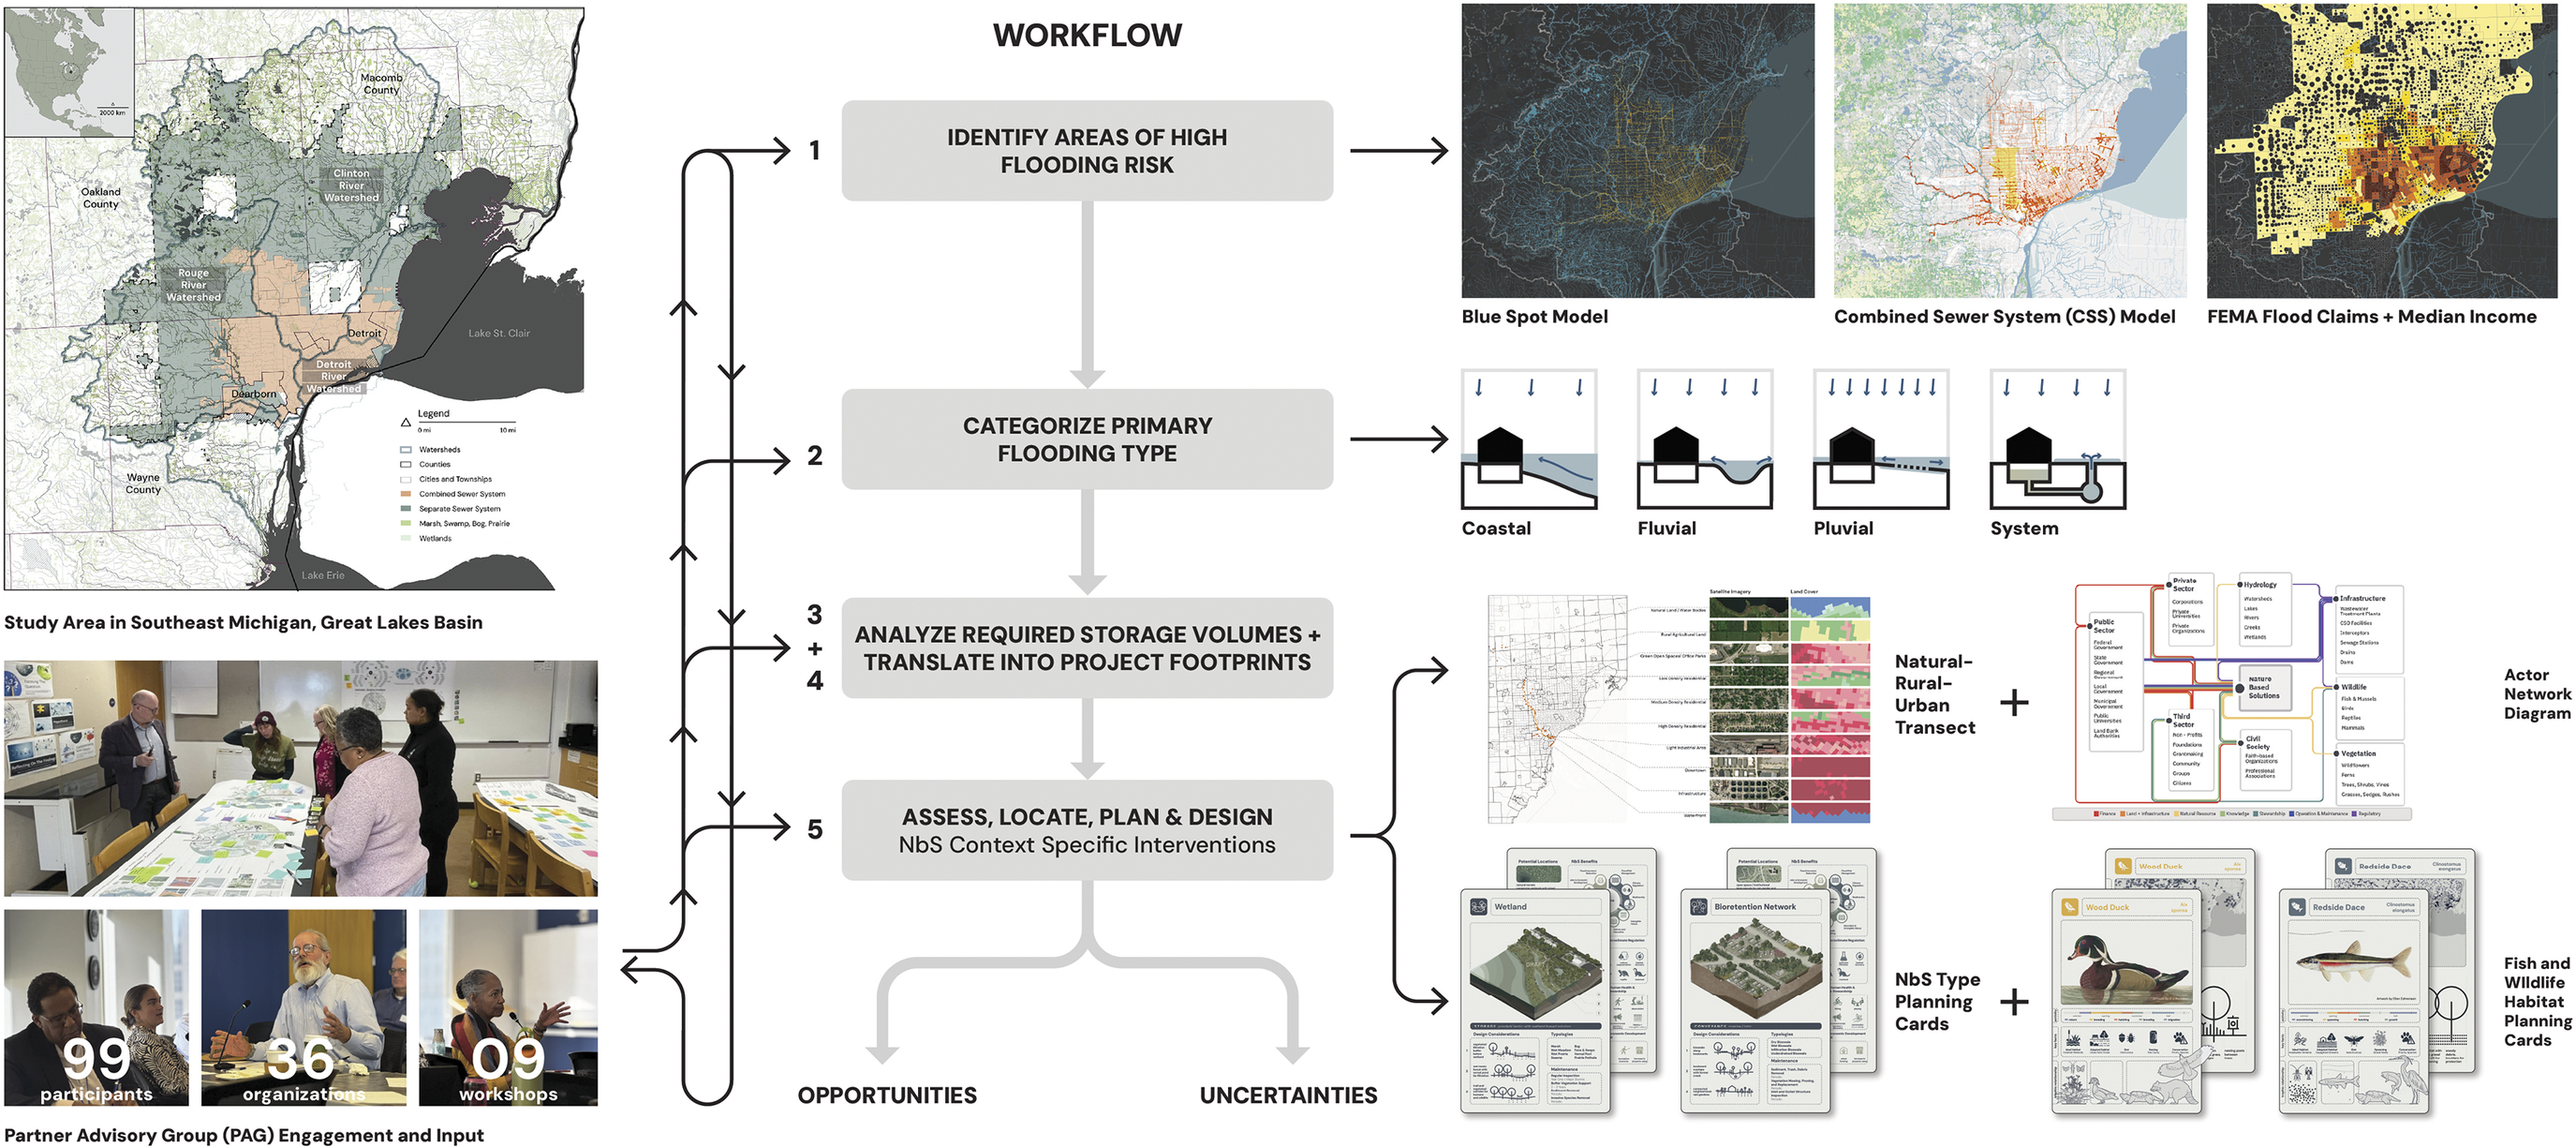
This study employs a series of integrated tools for regional NbS collaborative planning, informed by the team’s interdisciplinary research and the PAG inputs. This approach supports robust stakeholder engagement during early-stage decision-making across sites and scales. The NbS siting assessment workflow diagram (Figure 2) integrates tools, comprising an ArcGIS Online visualization platform, actor-network mapping, transect land-use assessments, and NbS prototype and wildlife habitat planning cards. While these tools are common in planning, their value here lies in the specific knowledge they foreground. By design, they challenge the tacit assumptions regarding urban flooding and NbS described in the previous section and that frequently surfaced during partner engagements.
Research and design workflow for NbS stormwater intervention in SEMI, comprising five sequential steps that are informed by Partner Advisory Group (PAG) engagements in iterative sessions that create a feedback loop. Steps include (1) identifying areas of high flooding risk; (2) categorizing primary flooding type; (3–4) analyzing required storage volumes and translating them into project footprints; and (5) assessing, locating, planning, and designing context-specific NbS interventions. Embedded graphics represent analytical outputs and planning tools developed across each step (see Figures 3–7).
Source: Author; embedded datasets from USGS (2022) and Southeast Michigan Council of Governments (SEMCOG); planning cards developed by the project team.

Figure 2. Long description
Composite figure with three vertical zones. Left zone: a regional map thumbnail above workshop photographs showing participants around tables with maps and sticky notes; below, statistics read “99 participants,” “36 organizations,” “9 workshops,” labeled “Partner Advisory Group (PAG) Engagement and Input.” Center zone: a vertical flowchart of five gray rounded-rectangle steps with downward arrows – (1) Identify Areas of High Flooding Risk; (2) Categorize Primary Flooding Type; (3 + 4) Analyze Required Storage Volumes and Translate into Project Footprints; (5) Assess, Locate, Plan and Design NbS Context Specific Interventions – with a leftward feedback arrow from base to Step 1; “Opportunities” and “Uncertainties” appear at the base. Right zone: thumbnail outputs per step – three risk maps (Step 1); four flood-type diagrams labeled Coastal, Fluvial, Pluvial, System (Step 2); transect and actor network diagrams, NbS type cards and fish and wildlife cards (Step 5).
One strength of these tools lies in the use of diverse representational techniques in the translation of technical data. Rather than being designed top-down, each tool was co-created through a two-tiered process of internal team meetings and PAG breakout sessions. The resulting visual diversity bridged technical engineering priorities and community-based needs, functioning as sites of intersection where different languages could meet. Consequently, these tools carry the “traces of multiple viewpoints,” making them inherently intersectional and usable across diverse institutional contexts (Star and Griesemer, Reference Star and Griesemer1989, 408).
Reframing flooding: From control to coexistence
“The control of nature is a phrase conceived in arrogance,” wrote ecologist Rachel Carson (Reference Carson1962, 297). Decades of rapid urbanization in SEMI have institutionalized an antagonistic relationship between land and water, where flooding is cast as a nuisance to be piped and buried rather than a condition to be lived alongside. This reliance on massive underground networks has detached water from the everyday urban experience, creating a system so expansive and intricate that it often defies its own modeling. Input from PAG members noted the impact of a century of urbanization in the reformulation of entire watershed boundaries, rendering surface hydrology datasets for these watersheds inaccurate. This demanded verification of existing watershed boundaries and surface elevations, which, if unchecked, risk producing inaccurate models. The redrawing of existing natural and operative watershed boundaries and surface elevations also necessitates acknowledging the entanglements of comprehending, representing, and modeling urban water systems.
The team’s SWMM, RWM, CSS, and Blue Spot models provide the technical foundation for mapping fluvial, pluvial and system flooding across the region. When layered with Federal Emergency Management Agency (FEMA) Flood Insurance Rate Maps (FIRMs), these cartographic registrations offer a rigorous but partial spatial account of risk. While they reveal where water accumulates and the system stresses, they do not expose the underlying conditions – such as social inequities, pre-existing urban fabric or uneven municipal data – that shape flooding experiences on the ground. The logic of these models remains rooted in traditional paradigms of stormwater management through volume control. However, PAG discussions repeatedly surfaced flooding as a multi-dimensional condition with implications that transcend volume control alone. As a non-profit program manager noted: “Solve our flow problems – storm water flow, cash flow. Drop the fee schedule silos between sanitary and storm. Both systems need to fund, finance, and implement NbS to the flooding problem.”
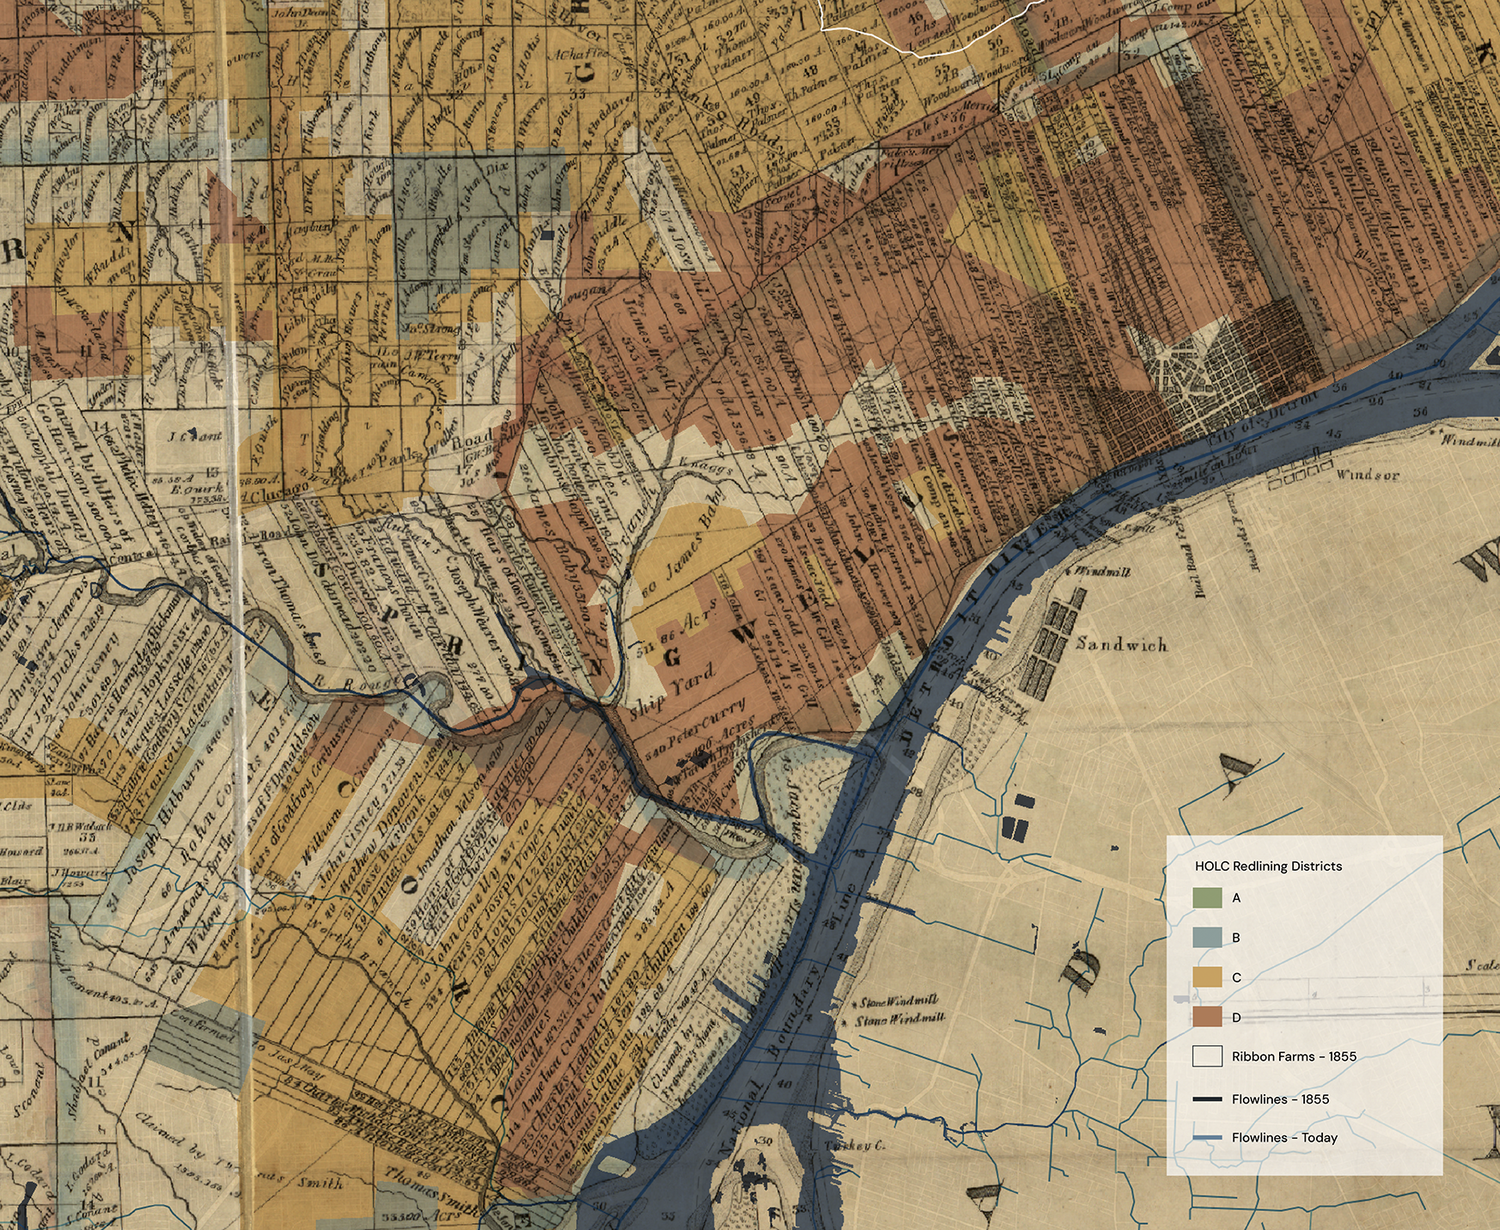
To address this, we developed an ArcGIS Online platform to “anatomize” the stormwater system, exposing hidden correlations between surface land uses and subsurface infrastructure, such as major interceptors and combined sewer overflows (CSOs). Further layers reveal larger pluvial flooding vulnerability as a function of both history and suppressed hydrology. By overlaying historical county maps of buried streams (Farmer, Reference Farmer1855) with Home Owners Loan Corporation (HOLC) redlining maps (Nelson et al., Reference Nelson, Winling, Marciano, Connolly and Lee2023), we add nuance to NbS siting (Figure 3). The overlap between flood-prone areas and those contending with the legacy of socio-spatial inequality challenges us to plan in ways that avoid repeating historical trends. These maps situate flooding not only in hydrological terms but in relation to the layered power structures and vulnerabilities of those who live with it. This reframing was echoed by community advocates in the PAG, who insisted that NbS planning in the region cannot proceed without confronting systemic biases and historic racism. One community and grassroots leader urged the team to “move at the speed of trust with [the] community… bring community along the phases of the project; make it celebratory.”
Layered map outlining early urban plats in Detroit through Farmer’s Map of 1855, overlaid with streamlines from the 1900s as well as Home Owner’s Loan Corporation (HOLC) “Redlining” Maps of Detroit from 1939. Redlining refers to the racially discriminatory US federal practice of grading urban neighborhoods A–D by “mortgage risk,” systematically denying credit and investment to Black and immigrant communities.
Source: Author’s map traced over Farmer (Reference Farmer1855); using flowlines circa 1900 and current waterbodies with data from USGS (2022); HOLC boundaries from Mapping Inequality: Redlining in New Deal America from Nelson et al. (Reference Nelson, Winling, Marciano, Connolly and Lee2023).

Figure 3. Long description
A composite map centered on the Detroit and Rouge River intersection. The base layer is a sepia-toned 1855 historical plat map showing individual land parcels with handwritten owner names and parcel dimensions. Overlaid in blue are two sets of flowlines: darker lines indicate historical stream channels from approximately 1900; lighter blue lines show current waterbodies and drainage. The Detroit River runs diagonally from upper-left to lower-right; the settlements of Sandwich and Windsor are visible on the opposite Canadian bank. A third overlay applies transparent color fills for 1939 HOLC mortgage risk grades: green (Grade A) and blue-gray (Grade B) appear as small patches at the outer edges; gold/amber (Grade C) is distributed across the mid-urban zone; red-brown (Grade D) dominates the central urban core closest to the river. A legend in the lower-right corner identifies five categories: Redlining Districts (grades A–D), Ribbon Farms 1855, Flowlines 1900s and Flowlines Today.
It is this demand for building a participatory process and shared accountability that gives the cartographic work high stakes. These maps do more than un-obscure. They leverage their operative power (Corner, Reference Corner and Cosgrove1999; Velikov and Thün, Reference Velikov, Thün, Ibañez, Lyster, Waldheim and White2017) to reveal hidden socio-political and ecological systems, imagining alternate methods of coexistence, and addressing water abundance without sacrificing the communities that host it.
Urban nature is neither uniform nor neutral
While the reintroduction of nature into cities is intuitively appealing, uncritical implementation often reinforces existing spatial inequities or generates new ones (Gandy, Reference Gandy2015). The IUCN (2020) provides safeguards to ensure equitable access to land and resources, yet these principles can become diluted when transposed across global/local contexts. In SEMI, NbS must contend not only with the legacies of hydrological transformation and socio-spatial injustice but also with the learned failures of preceding green infrastructure projects.
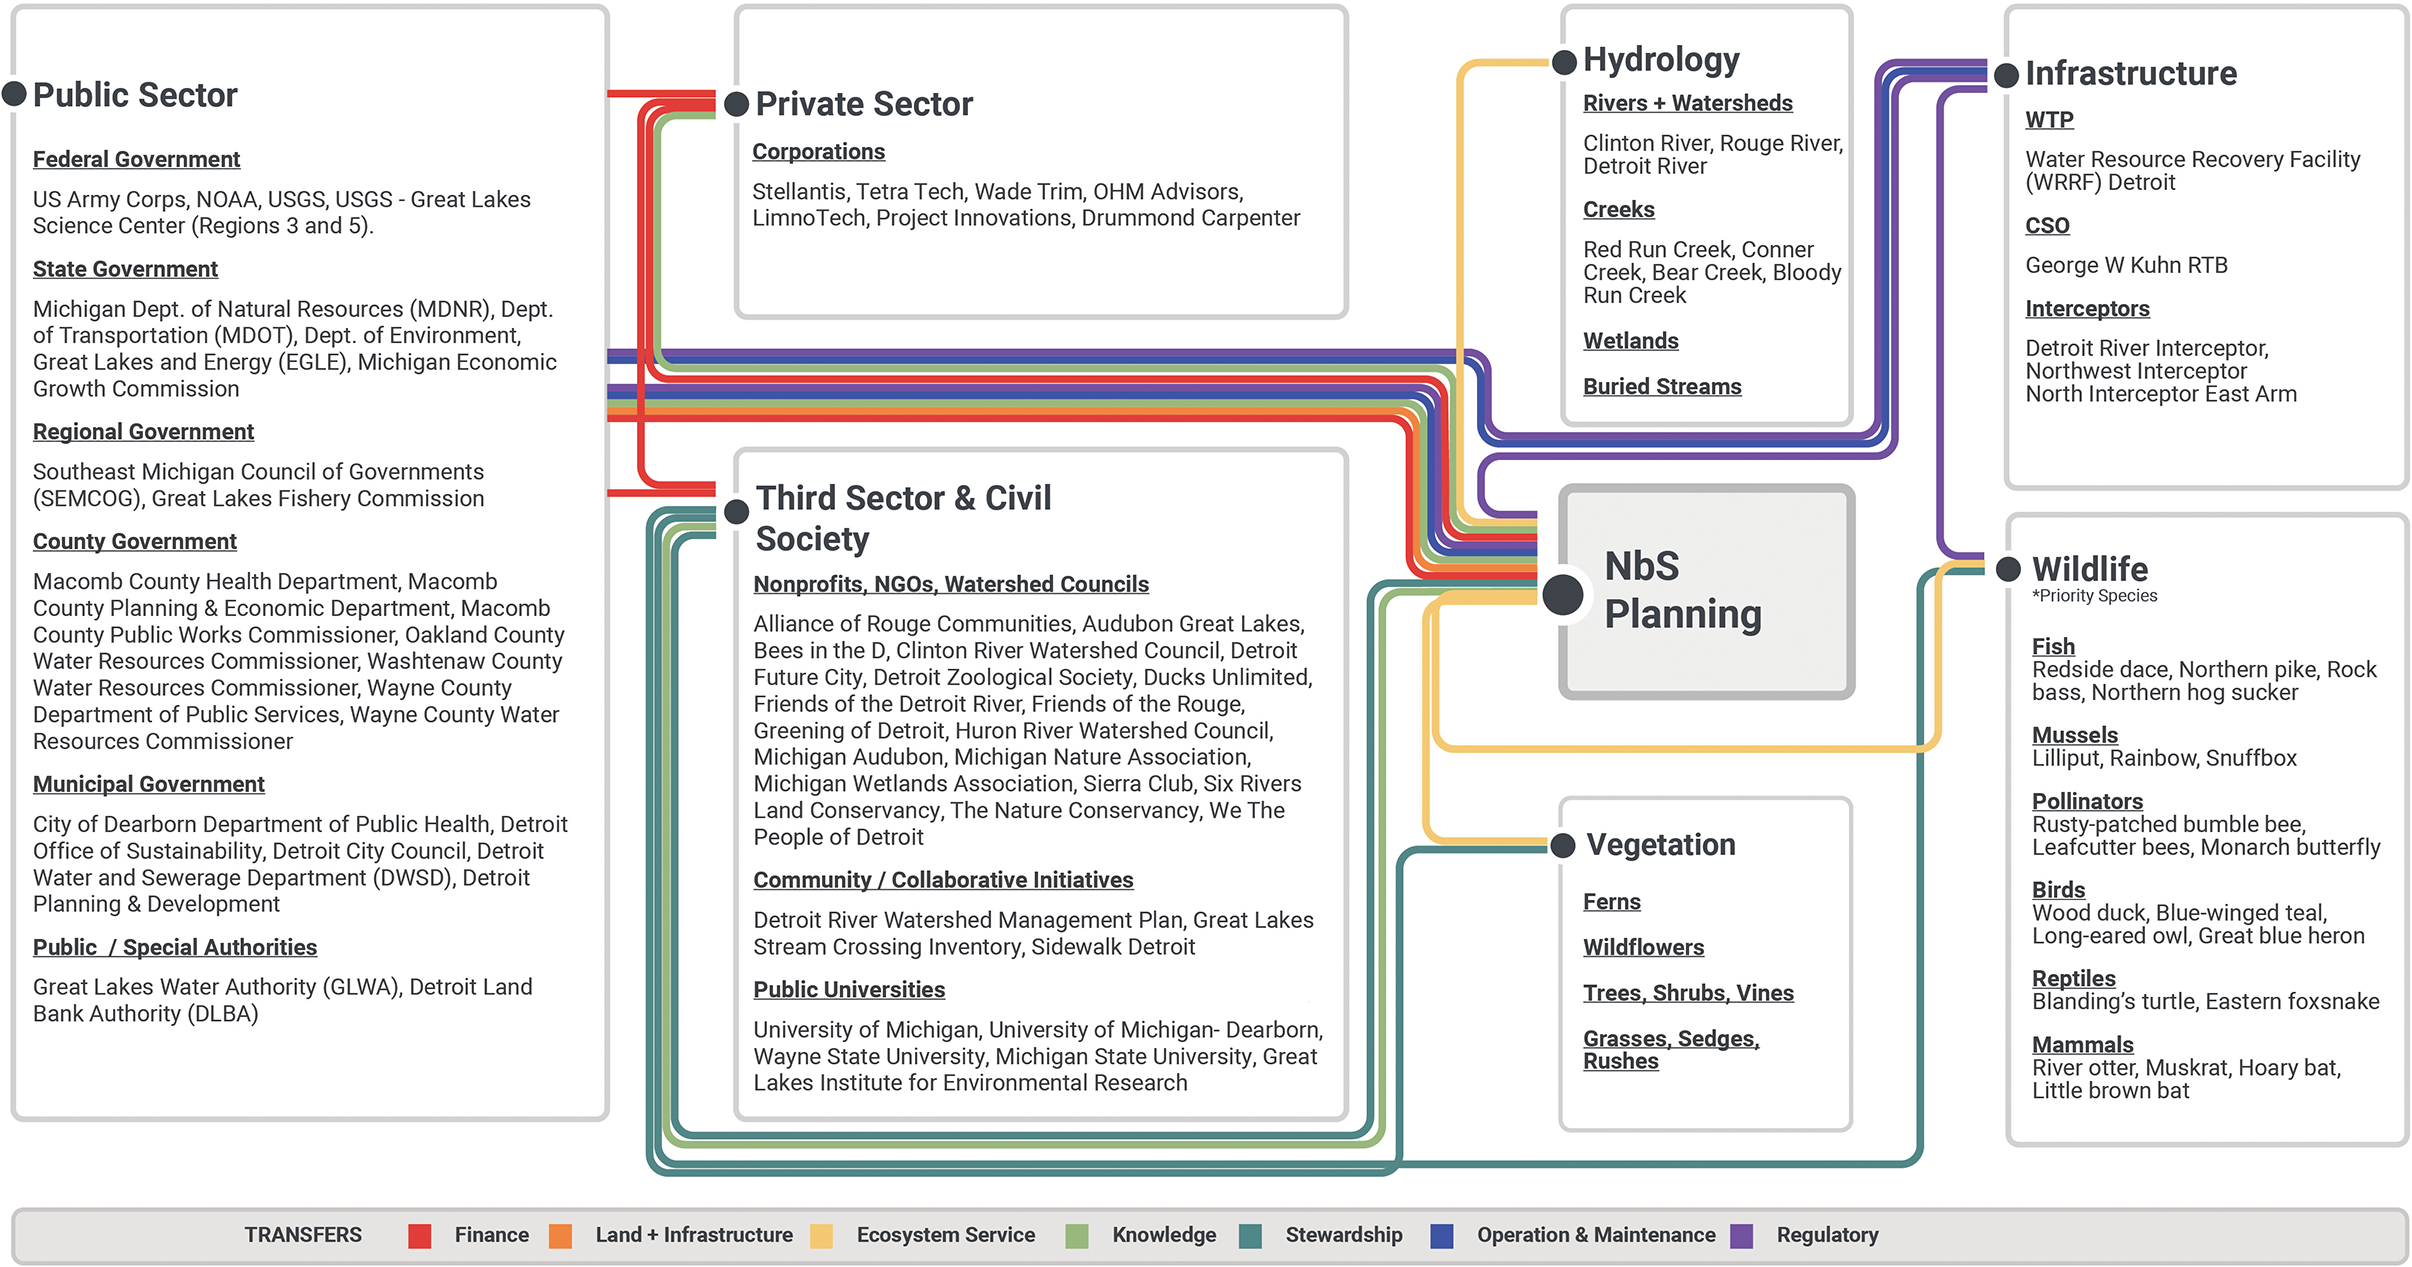
To expose these dynamics, an actor-network inspired diagram (Figure 4) maps the regional agents involved in NbS siting, planning, and implementation. Tracing the uneven distribution of power and transfer of resources across government levels, utilities, private organizations, non-profits, community members, and indigenous groups, the diagram challenges the preconception of “spatial neutrality.” Crucially, it includes non-human agencies, represented by hydrological entities and regional wildlife, as active participants in the network. By visualizing the exchange of resources – stewardship, knowledge, land and infrastructure, natural resources, financing, maintenance and operation – the diagram acknowledges existing power asymmetries while inviting redistribution.
An actor network diagram of the project outlining human actors organized across various public and private sectors and civil society, components within the gray infrastructure system, hydrological entities, wildlife and vegetation. By tracing various transfers between these bodies, the larger network of interactions in order to undertake Nature-based Solutions is identified.
Source: Author.

Figure 4. Long description
An actor network diagram. Eight labeled boxes around the margins: Public Sector (left, Federal, State, Regional, County, Municipal Government tiers); Private Sector (upper center-left); Third Sector and Civil Society (lower center, non-profits, NGOs, watershed councils, community initiatives, universities); Hydrology (upper right, rivers, creeks, wetlands, buried streams); Infrastructure (far right, water treatment, CSO, interceptors); Wildlife (right, priority fish, mussels, pollinators, birds, reptiles, mammals); Vegetation (lower right, ferns, wildflowers, trees/shrubs/vines, grasses/sedges/rushes). Central gray box labeled “NbS Planning” at the visual focus. Color-coded lines connect each box to the central node; lines from Third Sector and Civil Society are most numerous. Legend identifies seven transfer types: Finance (red), Land and Infrastructure (orange), Ecosystem Service (yellow), Knowledge (green), Stewardship (teal), Operation and Management (blue) and Regulatory (purple).
The actor network diagram was iteratively developed through PAG input. During the visioning charrette, participants annotated the team’s draft products extensively, spotlighting actors and their relationship with other diagram components that the initial version had not yet identified. Additionally, PAG members raised concerns about system terminology and impacts, such as distinguishing between watershed and sewersheds while also stressing the reframing of an upstream-downstream binary that failed to accurately represent the diversity of regional conditions. Challenging the binary, the discussion hinted at the need to better represent the gradient of spatial conditions addressing density ranges, more diverse urban morpho-typologies and a more granular range of socioenvironmental conditions.
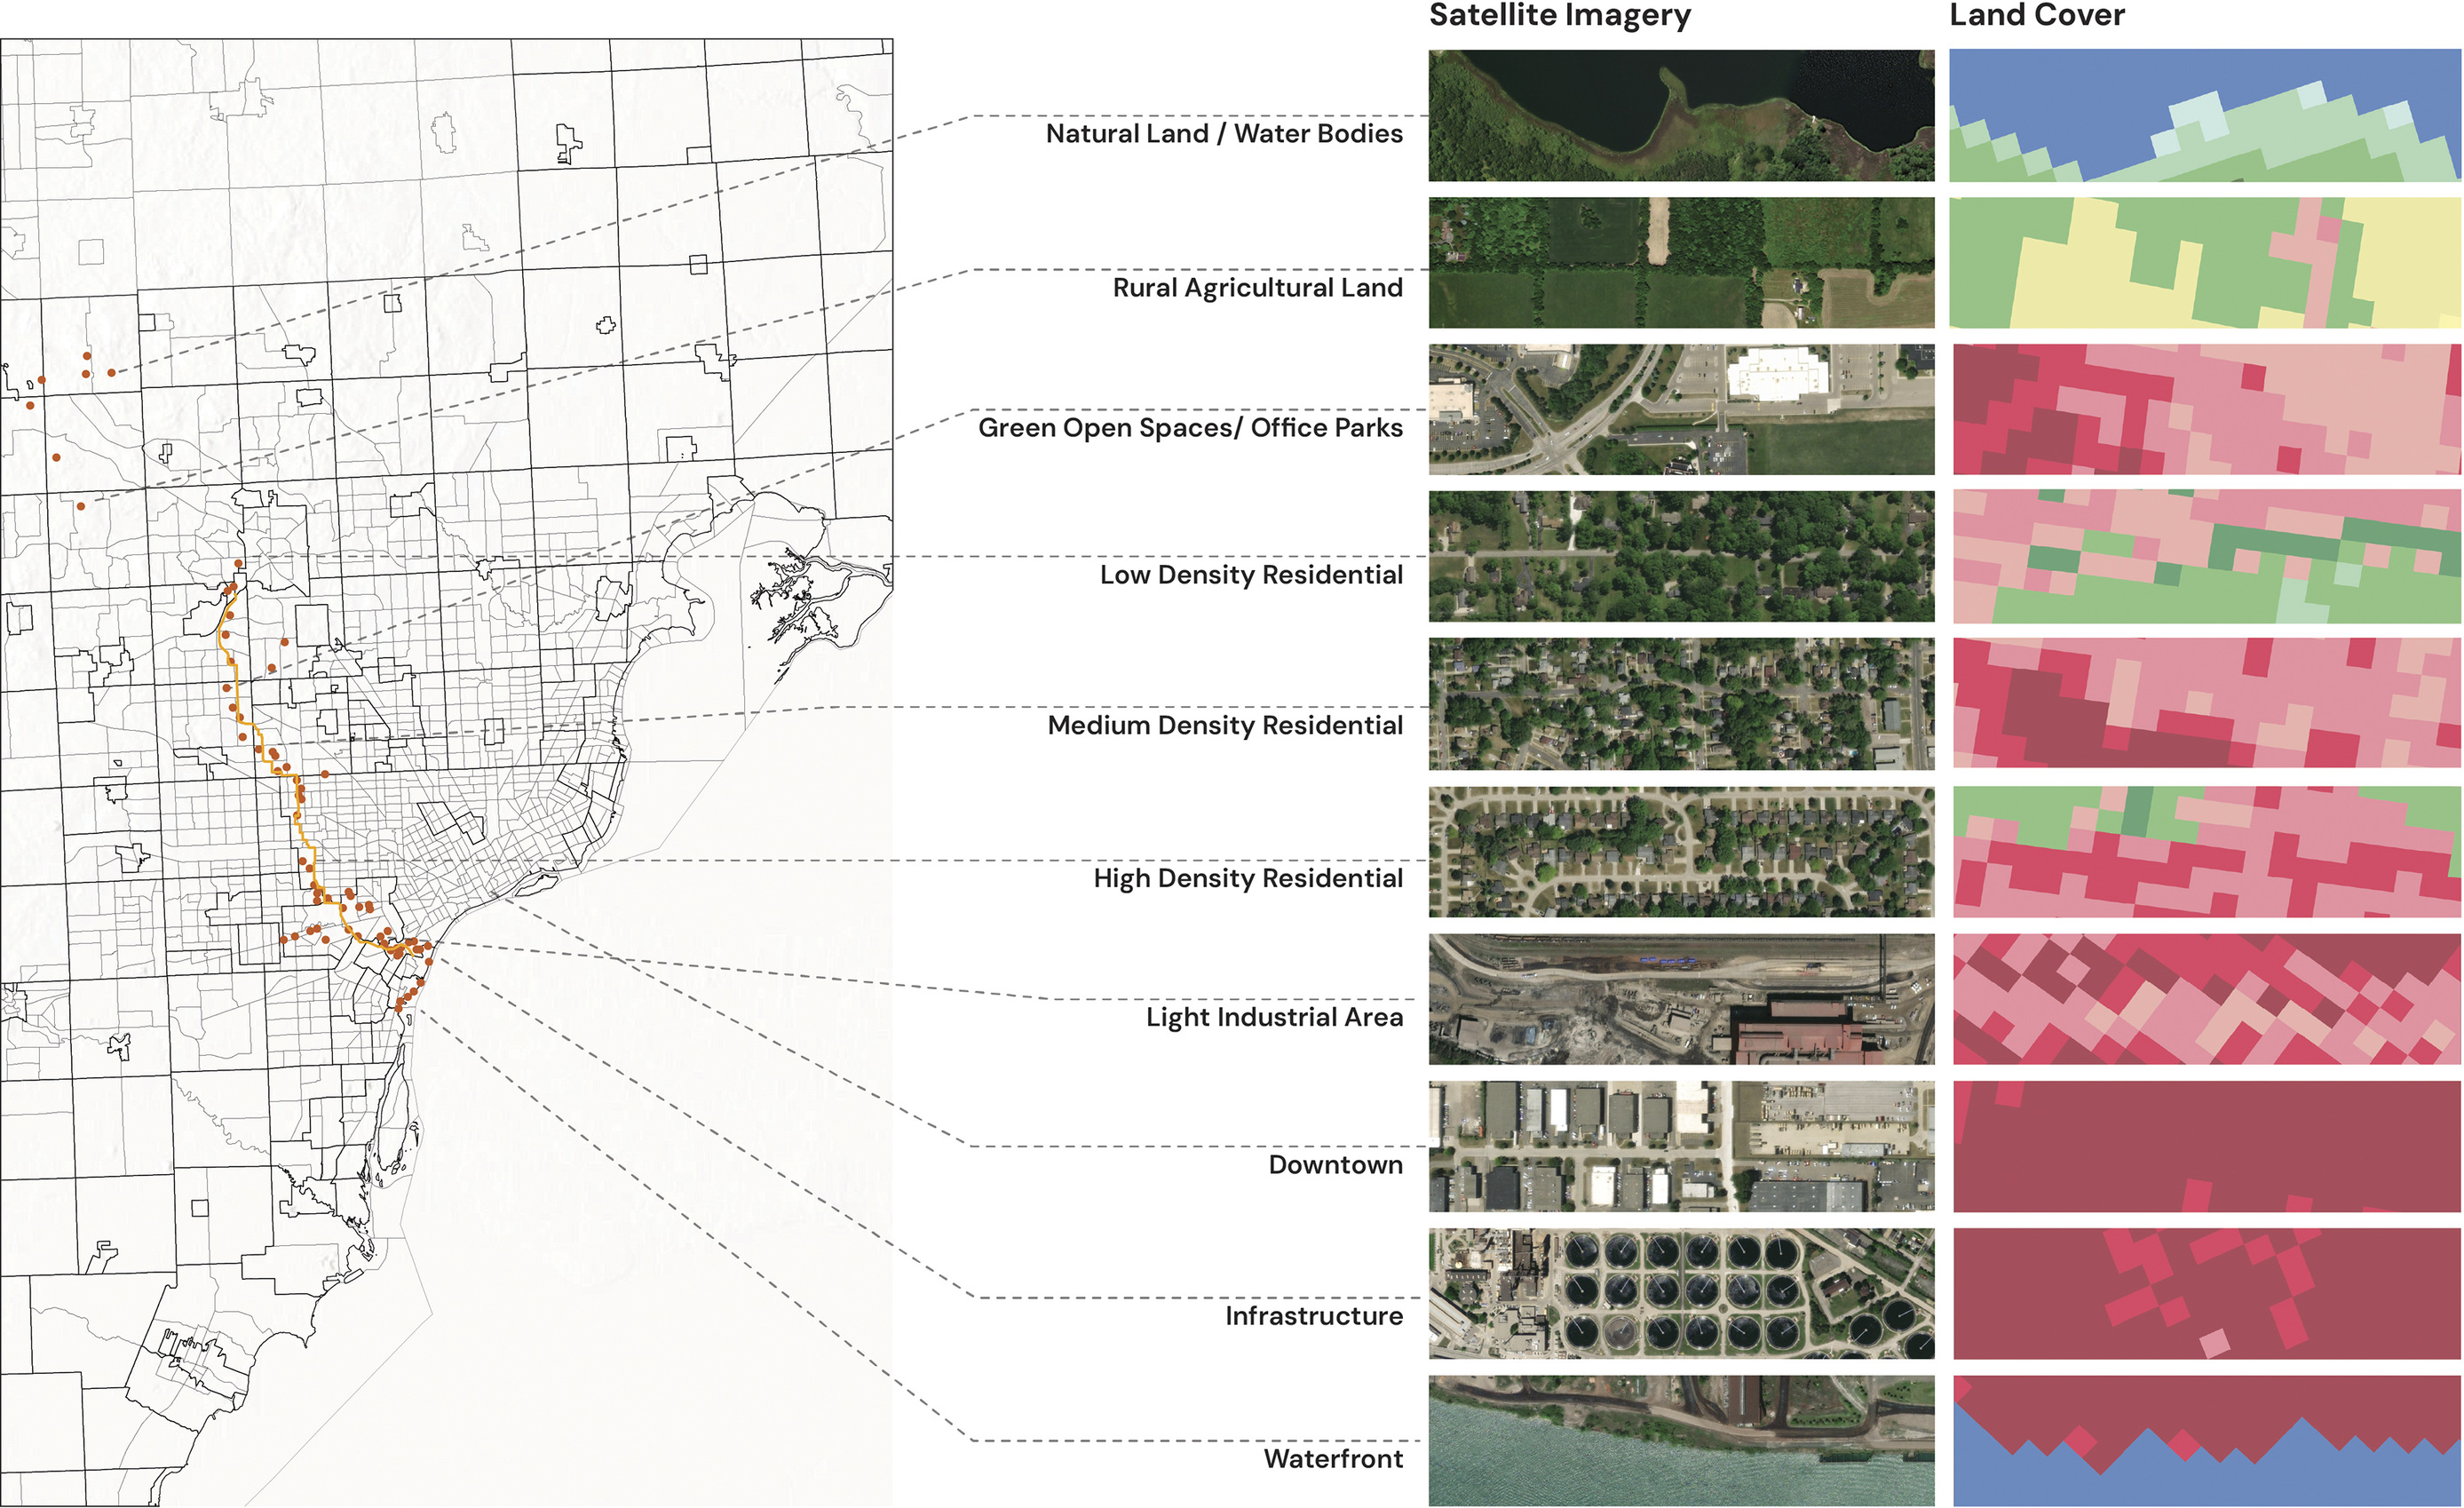
The careful examination of this input instigated the conceptualization of a regional transect drawing (Figure 5) to complement the variation across actors and to provide a comprehensive reading of the region’s diverse ecological, hydrological, and infrastructural conditions. This approach contextualizes sites within broader systems rather than treating parcels as uniformly suitable for NbS and acknowledges that applicability is contingent upon local conditions and specific stormwater needs. Evolving from Patrick Geddes’ Valley Section (Reference Geddes1915) and its more recent reinterpretation at Transect Urbanism (Duany and Falk, Reference Duany and Falk2021), the natural-rural-urban transect samples variable conditions: watersheds, topography, urban intensity, vacancy, imperviousness, landcover, land use, wildlife ranges, former streams and wetlands, and soil hydrologic groups. Following the path of major interceptors to illustrate the landscapes of stormwater, Figure 5 depicts the transect along the Detroit River Interceptor (DRI) toward the Water Resource Recovery Facility (WRRF), revealing the diverse conditions water must navigate before reaching the confluence of the Detroit and Rouge Rivers.
Natural-rural-urban transect along the Detroit River Interceptor (DRI) outlining spatial conditions across Southeast Michigan including satellite imagery and land cover dataset.
Source: Author’s illustration using satellite imagery from Esri (n.d.) and national land cover data (NLCD) from USGS (2024).

Figure 5. Long description
Two-panel figure. Left: black-and-white outline map of Greater Southeast Michigan with thin municipal and county boundary lines. A diagonal corridor of orange sample-site dots marks the Detroit River Interceptor transect from north-west to south-east. Right: 10 horizontally stacked pairs of image strips connected to the map by dashed gray leader lines. Each pair is labeled from top to bottom: Natural Land/Water Bodies, Rural Agricultural Land, Green Open Spaces/Office Parks, Low Density Residential, Medium Density Residential, High Density Residential, Light Industrial Area, Downtown, Infrastructure and Waterfront. The left strip of each pair shows a satellite image; the right strip shows the corresponding NLCD classification raster. In the rasters, pink-magenta tones indicate built surfaces; green indicates vegetation; blue indicates open water. The proportion of pink increases progressively toward the more urbanized land-use categories.
Manufacturing urban nature: From product to process
While a manufactured-product assumption frames NbS as deliverables with fixed endpoints, the tools in this section acknowledge ecological systems as process-based. Urban nature unfolds over time and requires continuous stewardship; it cannot be designed to a state of completion. To communicate this dynamic condition of NbS, we developed three engaged planning tools: prototypical NbS phasing strategies, NbS prototype cards, and, fish and wildlife habitat planning cards.
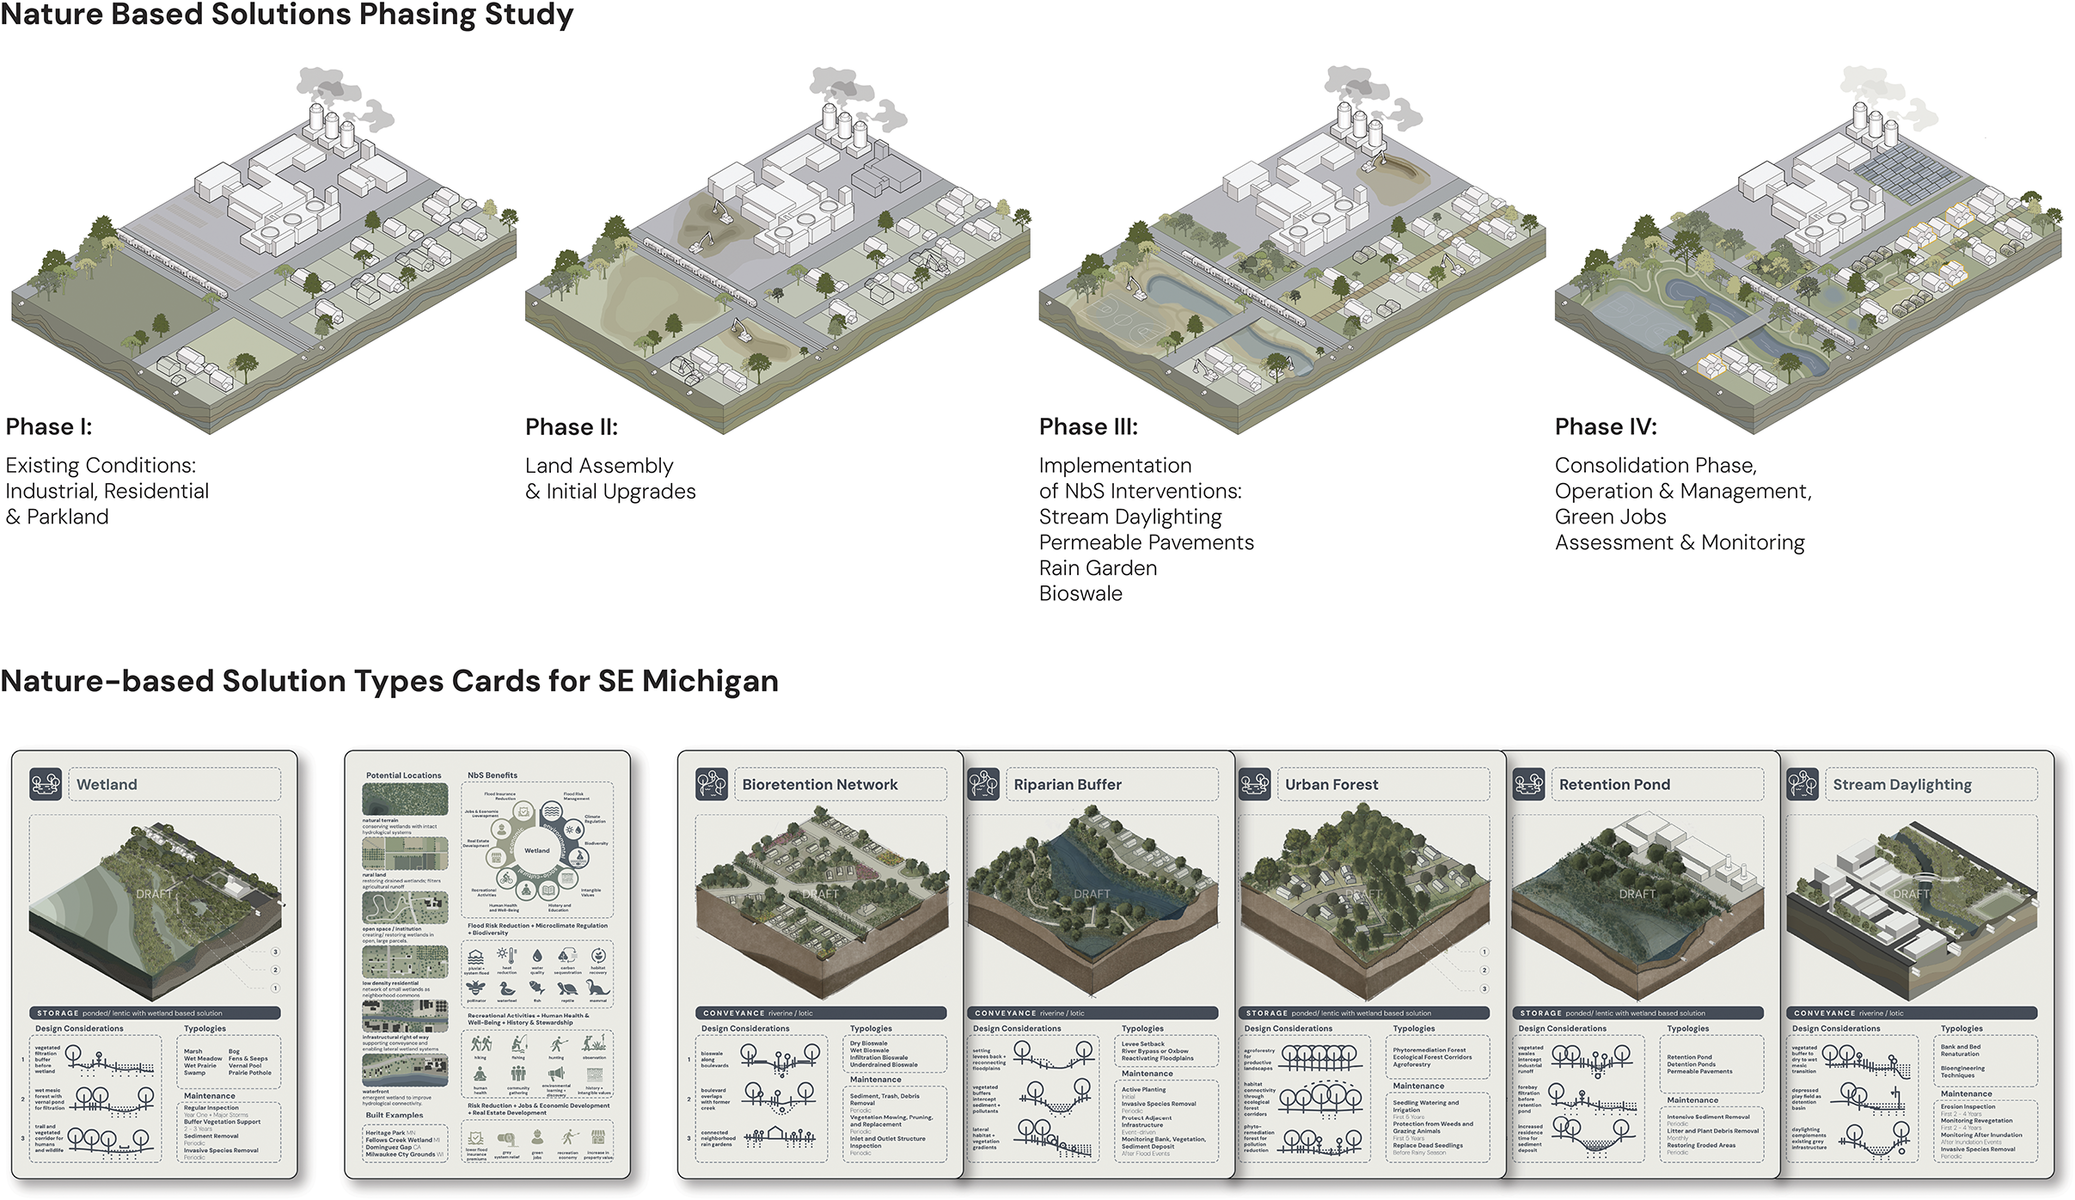
The phasing strategies (Figure 6, top) visualize NbS implementation as an incremental process, rather than a final product. Drawing from precedent studies and moving away from the polished imagery of standard catalogs, these drawings embrace nature’s dynamic attributes, illustrating the multi-year transformation from site preparation and plant and habitat establishment to the maturation of complex ecologies and co-located practices such as urban farming. The legibility of these outputs invites stakeholders to imagine long-term project participation, presenting “completion” as a condition always contingent upon future stewardship, maintenance and community agency.
Nature-based solutions phasing study depicting four prototypical phasing strategies (top, left to right): Phase I: Existing Conditions; Phase II: Land Assembly and Initial Upgrades; Phase III: Implementation of NbS Interventions; and Phase IV: Consolidation, Operation and Management; alongside NbS prototype cards for Southeast Michigan (bottom), each documenting an NbS typology across isometric prototype views, design considerations, sub-typologies, maintenance requirements, potential locations for implementation, expected benefits, and built examples.
Source: Author.

Figure 6. Long description
The top section, titled Nature Based Solutions Phasing Study, contains four isometric diagrams.
Phase I Existing Conditions Industrial, Residential and Parkland. Shows a grey industrial complex at the top, a residential street in the middle, and a green field at the bottom.
Phase I I Land Assembly and Initial Upgrades. Shows the green field being excavated and the industrial area beginning to transition.
Phase I I I Implementation of N b S Interventions. Features stream daylighting, permeable pavements, rain gardens, and bioswales. The excavated area now contains a water body and new vegetation.
Phase I V Consolidation Phase, Operation and Management, Green Jobs, Assessment and Monitoring. Shows a fully integrated green landscape with dense trees, solar panels on industrial roofs, and a mature wetland system.
The bottom section, titled Nature-based Solution Types Cards for S E Michigan, features seven informational cards.
Card 1 Wetland. Shows a cross-section of a marshy area. Categories include Storage, Design Considerations, Typologies like Marsh and Bog, and Maintenance.
Card 2 Potential Locations and N b S Benefits. A text-heavy card with a central radial diagram showing benefits like Flood Risk Reduction and Biodiversity.
Card 3 Bioretention Network. Shows an isometric view of a residential block with integrated rain gardens. Categories include Conveyance, Design Considerations, and Typologies like Dry Bioswale.
Card 4 Riparian Buffer. Shows a river corridor with dense bank vegetation. Categories include Conveyance and Maintenance like Invasive Species Removal.
Card 5 Urban Forest. Shows a dense cluster of trees within a neighborhood. Categories include Storage and Typologies like Agroforestry.
Card 6 Retention Pond. Shows a large permanent pool of water. Categories include Storage and Maintenance like Sediment Removal.
Card 7 Stream Daylighting. Shows an open water channel running through an urban grid. Categories include Conveyance and Typologies like Bank and Bed Renaturalization.
Complementing this, the NbS prototype cards (Figure 6, bottom) draw on precedents and the IUCN’s NbS guidelines to provide typological and context-sensitive design guidance. While the phasing strategies address temporal evolution, these cards address typological specificity, translating generic NbS types – such as bioretention networks, urban forests or stream daylighting – across the specific spatial logics of the SEMI regional transect. By situating global NbS categories within the region’s unique social and economic attributes, the cards distribute technical expertise through accessible means, including maintenance recommendations and expected benefits for each NbS type. These enable agencies and community members to engage in NbS discussion, design, and stewardship without requiring specialized knowledge.
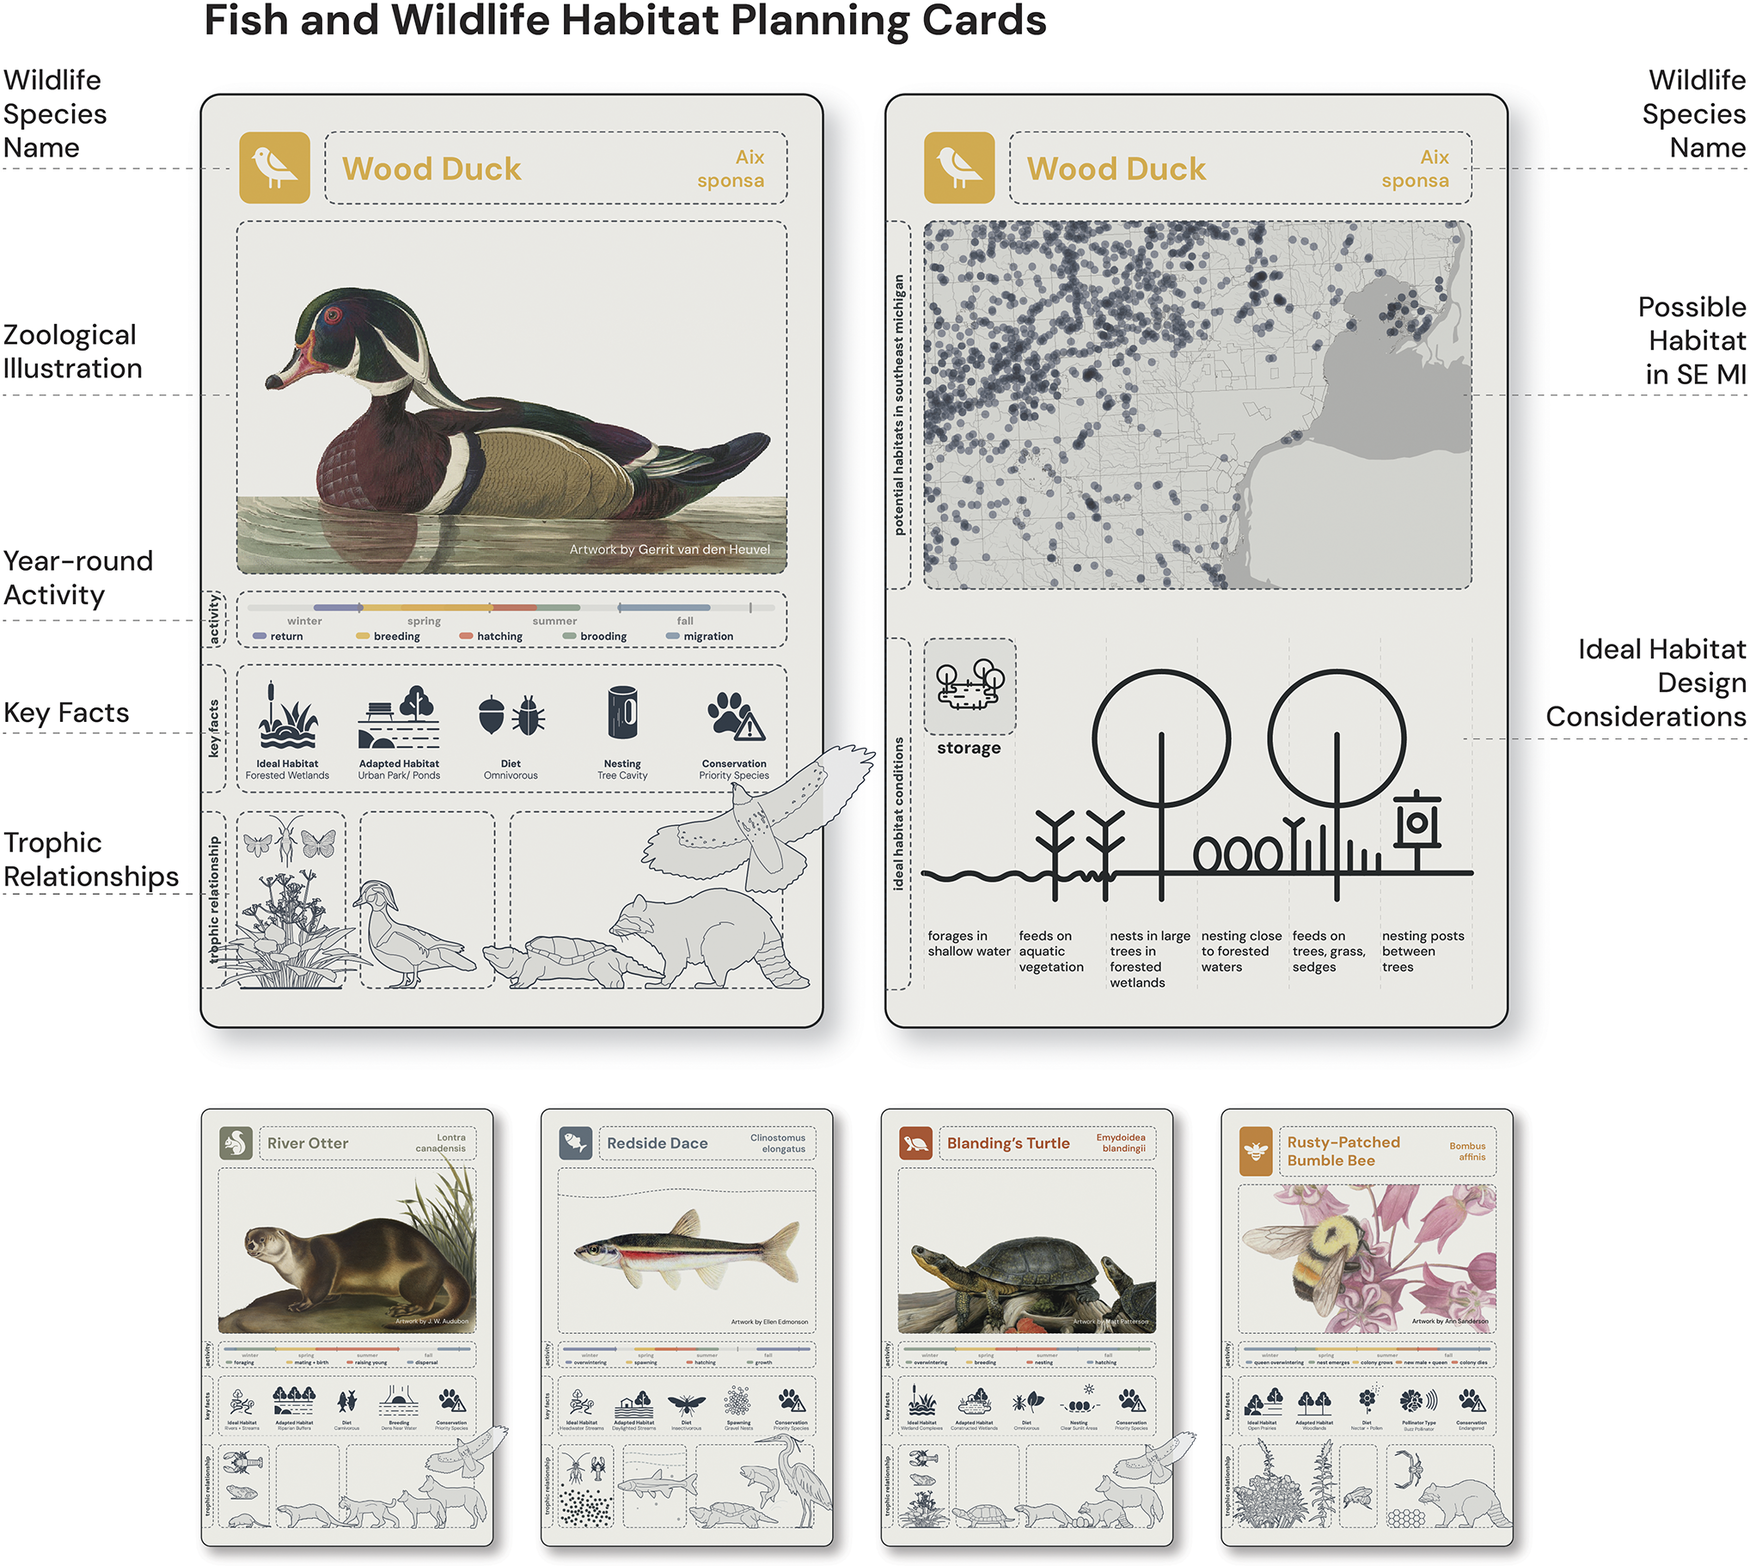
Finally, the fish and wildlife habitat planning cards (Figure 7) introduce a multispecies perspective into the planning process, establishing biodiversity as an explicit performance target and design opportunity. Informed by our team’s qualitative interviews of regional experts, the cards highlight priority species and detail year-round habitat needs, diet, conservation status, and trophic relations. The reverse side maps where these species may exist to identify opportunities for restoring connectivity within fragmented urban habitats. The cards inform the design parameters for species to thrive in NbS projects and reveal the intricate interdependencies underpinning ecological viability. For instance, stream daylighting may restore flow and enable the return of the red-side dace, yet the species cannot thrive without low-hanging riparian vegetation for feeding, subsurface gravel for spawning, a specific water temperature range, insect populations as prey, and balanced predator populations like turtles or trout. By framing ecological health as interdependent relations, the cards invite alternative land management approaches.
Fish and wildlife habitat planning cards (top cards depicting front and back of a Wood Duck card and bottom row depicting front of four other fish and wildlife species cards: River Otter, Redside Dace, Blanding’s Turtle, and Rusty-Patched Bumble Bee). Each card features a zoological illustration, year-round activity timeline, key facts, trophic relationships, a map of potential habitats in SEMI and a set of ideal habitat design conditions.
Source: Author’s illustration with datasets from USGS (2022); SEMCOG (2018); graphical assets from Dimensions (n.d.), Adobe Stock (n.d.); and illustrations of the Wood Duck by Gerrit van den Heuvel, River Otter by John James Audubon, Redside Dace by Ellen Edmonson, Blanding’s Turtle by Matt Patterson, and Rusty Patched Bumblebee by Ann Sanderson.

Figure 7. Long description
The layout features two large cards at the top and four smaller cards at the bottom.
Top Left Card (Wood Duck Front):
- Header: Wood Duck and scientific name Aix sponsa.
- Center: A zoological illustration of a male Wood Duck on water.
- Year-round Activity: A timeline showing return in winter, breeding and hatching in spring, brooding in summer, and migration in fall.
- Key Facts: Icons for Ideal Habitat (Forested Wetlands), Adapted Habitat (Urban Park/Ponds), Diet (Omnivorous), Nesting (Tree Cavity), and Conservation (Priority Species).
- Trophic Relationships: Line drawings of insects, plants, a turtle, and a raccoon.
Top Right Card (Wood Duck Back):
- Map: Potential habitats in S E M I (Southeast Michigan) indicated by dark blue clusters.
- Ideal Habitat Design Considerations: A diagram showing storage, foraging in shallow water, feeding on aquatic vegetation, nesting in large trees in forested wetlands, nesting close to forested waters, feeding on trees, grass, and sedges, and nesting posts between trees.
Bottom Row (Four Species Cards):
1. River Otter (Lontra canadensis): Features a brown otter illustration, habitat facts for rivers and streams, and a diet of fish and crustaceans.
2. Redside Dace (Clinostomus elongatus): Features a silver and red fish illustration, habitat facts for headwater streams, and a diet of insects.
3. Blanding’s Turtle (Emydoidea blandingii): Features a turtle illustration, habitat facts for wetland complexes, and a diet of crustaceans and insects.
4. Rusty-Patched Bumble Bee (Bombus affinis): Features a bee on a flower, habitat facts for open prairies, and a diet of nectar and pollen.
The habitat cards were consistently well-received across PAG engagements, cited in the majority of individual feedback worksheets as highly actionable. PAG members working on environmental programs were particularly supportive, describing them as “fantastic to help educate community [sic] on benefits of NbS” and calling for their development across all components of the study. This approach allows a multi-species approach to negotiating hydrological variability, co-benefits, and maintenance responsibilities, where siting decisions may enhance or constrain community benefits as well as environmental health.
Discussion
This study proposes a regional, relational NbS planning framework that reorients traditional planning approaches away from paradigms of control, spatial neutrality, and manufactured nature toward those of coexistence, context-specificity, and incremental processes. It centers on two primary dimensions: the system-level realities made legible through regional scaling of NbS and the function of shared tools as boundary objects for cross-institutional collaboration.
Regional scaling and systemic realities
A SEMI-grounded regional lens reveals three systemic realities often obscured in site-level planning. First is the challenge of data unevenness. Across SEMI’s 78 municipalities, datasets – such as drainage, infrastructure inventories, and vacancy records – vary substantially, directly impacting what can be visualized and consequently, what can be planned. Our ArcGIS Online interface functions as a platform for plural evidence, exposing these gaps and making the case for increased data-sharing and the integration of situated community knowledge. This layered approach re-politicizes flood risk, framing it as a phenomenon shaped by – and capable of reshaping – history, demographics, and governance.
Second is jurisdictional fragmentation. While Water Resource Commissioners, watershed councils, and regional utilities (GLWA and DWSD) share responsibility for stormwater management, their mandates and fiscal capacities are uneven and siloed. By pairing the actor-network diagram with the regional transect, this study reframes fragmentation as a condition to be mapped and acknowledged. Regional NbS planning must, therefore, account for local socioeconomic vulnerabilities, such as the risks of environmental gentrification, blue-lining, and the uneven capacity for long-term maintenance, operation, and management.
The third is scalar mismatch. While an NbS installation is locally sited, its hydrological and ecological effects – such as redirecting stormwater volumes and reintroducing a particular species – ripple across a combined system serving millions. The NbS prototype cards in our toolkit attempt to bridge this gap by situating local interventions within the broader spatial conditions of the watershed. The impacts on the combined sewer system behavior, watershed processes and habitat continuities do not adhere to jurisdictional boundaries. We acknowledge that tools alone cannot resolve the challenge of fragmented governance. The implementation of regional NbS will ultimately require novel institutional and financial arrangements, such as regional compacts, risk-pooling portfolios and watershed-scale financing.
Planning and design tools as boundary objects
The tools developed in this study synthesize engineering, ecology, design, planning and finance inputs, and were further shaped by PAG members, functioning as boundary objects that facilitate cooperation across heterogeneous groups. The iterative engagement with the PAG demonstrated how different actors activate these tools based on distinct institutional priorities. Conservation-oriented groups and watershed councils (e.g., Friends of the Rouge) prioritized the habitat cards for education. Advocacy and grassroots groups (e.g., We the People of Detroit) focused on the mapping interface as a vehicle for data access and documenting the lived experiences of those most impacted by flooding. Regional authorities (e.g., Water Resource Commissioners and public utilities) considered the use of the tools to inform the prioritization of possible interventions within existing planning and funding cycles. With this broad range of possible uses in mind as learned through PAG engagement, ensuring wide access through physical and digital outputs became a priority. Similarly, making the card set easy to adopt and grow in response to developing needs informed their conceptualization and design, with PAG members suggesting that the design of a board game could mobilize the cards together for future participatory planning processes.
These varied orientations confirm that a tool’s utility is contingent upon the user’s end goals. However, these boundary objects also possess inherent limits. As Shaw et al. (Reference Shaw, Steelman and Bullock2022, 108) suggest, these tools are only as effective as the diversity of knowledge they capture. While our toolkit successfully translates technical and institutional data across disciplines, the full integration of community-held expertise remains an ongoing process, requiring additional datasets. Future projects must prioritize participatory mapping, weighting residents’ lived experience of flooding alongside high-resolution hydrological modeling.
Transferability in and beyond Southeast Michigan
With climate-related hazards accelerating the need for cost-effective adaptation strategies in deindustrializing coastal urban regions face significant obstacles in the adoption of NbS at scale. The conditions defining SEMI – fragmented governance, socio-spatial inequality, contested postindustrial vacancy, and a regional utility serving municipalities of vastly variable fiscal capacities – offer lessons to coastal cities with legacies of industrial urbanism. The transdisciplinary framework developed here is, therefore, transferable, not as a fixed set of tools, but a methodology: synthesizing heterogeneous datasets into shared boundary objects, co-developing them with a multi-institutional advisory group, and tailoring outputs to local data availability and stakeholder priorities.
Within SEMI, study team members engaging in different roles on concurrent planning efforts are furthering the tools’ analytic capacities and sharing data points: the SEMCOG Regional Flooding & Infrastructure Resilience Study, GLWA and U.S. Army Corps of Engineers Southeast Michigan Flood Study, and DWSD’s East Side Stormwater Resiliency Planning Study. Community organizations in Detroit have engaged directly with the ArcGIS Online platform in collaborative siting sessions. Interest in the habitat planning cards for environmental education is supporting development of the complete 60-species set for broad distribution. Most significant, perhaps, has been a new initiative emerging from the project and spanning engaged partners to create a regional consortium for information-sharing, project planning, and support, linking financial opportunities to projects, provisionally named the Southeast Michigan Water-Fish-Wildlife Action Collaborative. This ecosystem of initiatives demonstrates the flexibility of the tools and the adaptability of the core practices advanced in the project. To facilitate broad appropriation, the tools prioritize flexibility and scalability, enabling diverse stakeholders to tailor the functionality to their specific jurisdictional needs and governance structures.
Conclusion
The socio-hydrological conditions of Southeast Michigan reflect challenges common to deindustrializing coastal regions globally. This study offers a transferable model for climate adaptation through shared regional visioning and the co-development of Nature-based Solutions (NbS) planning workflows.
By mobilizing diverse visualization techniques, the study produced a suite of multimodal boundary objects flexible enough to adapt to local needs and the diverse perspectives of multiple stakeholders while maintaining a common identity to anchor collective decision-making. In this framework, the act of designing – prototyping, testing, and refining visual artifacts – is not merely a means of communication but a primary mode of inquiry. By treating the development of tools as a generative research process, the team was able to synthesize complex, often siloed data into integrated spatial propositions. This iterative process allowed for the continuous evaluation of how different types of knowledge interacted, ensuring that the final outputs are both theoretically grounded and practically calibrated to the real-world complexities of regional collaboration. The resulting tools – comprising an ArcGIS Online map, actor-network diagram, and planning cards – are already seeing application in concurrent regional initiatives, including the SEMCOG Regional Flooding Study and collaborative siting sessions with Detroit-based community organizations. Ongoing efforts include finalizing a 60-species habitat card set and developing the regional data-sharing consortium.
While these instruments do not resolve the region’s planning challenges, they provide the necessary legibility to inform future NbS siting and coordination. Their primary contribution is the reframing of urban flooding and nature: revealing flooding as an unevenly distributed condition shaped by historical exclusion; understanding urban nature as not neutral but entangled in power asymmetries; and conceptualizing NbS not as products but as a process requiring sustained stewardship. The planning tools bridge jurisdictional fragmentation and allow stakeholders to move beyond localized control paradigms, identifying how upstream NbS can mitigate downstream flooding while fostering interdependency between human and non-human actors. Ultimately, the transdisciplinary methodology itself constitutes a core contribution. By convening agencies, stewards, and experts across jurisdictional boundaries, the project has addressed the very fragmentation that the tools seek to unsettle, establishing a shared planning community and equipping regional actors with a collective framework to address climate adaptation in future collaborations.
Open peer review
To view the open peer review materials for this article, please visit http://doi.org/10.1017/cft.2026.10036.
Supplementary material
The supplementary material for this article can be found at http://doi.org/10.1017/cft.2026.10036.
Data availability statement
All relevant data supporting the findings of this study are available from the authors upon request.
Acknowledgments
The authors acknowledge all members of the “NFWF-NCRF Integrating Nature-Based Solutions (NBS) into a Comprehensive Stormwater Strategy for Southeast Michigan” project for their contributions: project manager Curt Wolf, Professor Glen T. Daigger, Professor Peter Adriaens, and graduate student research assistants Gustave Rohde and Nabilla Ainundhiya Maharani at the University of Michigan; Professor Carol Miller and Research Associate Lara Treemore-Spears at Wayne State University; Professor Dana Infante and graduate student research assistant Justin Miller at Michigan State University; and Tim Dekker P.E. and Carrie Turner P.E. at LimnoTech, Inc. Environmental and Water Resources Engineering (https://www.limno.com/). Special gratitude to the Project Advisory Group (PAG) members for their continued input and contributions to research development and to the National Fish and Wildlife Foundation (NFWF) for their support of the project.
Author contribution
Conceptualization, writing, and data collection: K.V., M.A.A., M.E.A.; Mapping, and visualization: M.E.A.; Methodology: K.V., M.A.A., M.E.A.; Review, editing, and approval: K.V., M.A.A., G.T.; Supervision: K.V., M.A.A.
Financial support
This research project was supported by a 2023 National Coastal Resilience Fund (NCRF) by the United States National Fish and Wildlife Foundation (NFWF) (Award ID 80237) and the University of Michigan’s A. Alfred Taubman College of Architecture and Urban Planning.
Competing interests
The authors declare no conflict of interest.
Inclusivity statement
This research was conducted in partnership with a Partner Advisory Group (PAG) comprising 99 participants from 36 organizations, including federal, state, and municipal agencies, non-profits, watershed councils, and community advocacy groups. The PAG was intentionally structured to ensure a broad, cross-sectoral representation of both historical stakeholders and emerging partners actively deploying Green Stormwater Infrastructure (GSI) solutions to flooding in the region. PAG members voluntarily participated across nine quarterly workshops over a two-year study period. These sessions featured progress presentations, structured SWOT analyses, moderated breakout discussions, expert presentations, site visits, and a visioning charrette.
PAG members contributed to enhancing the legibility and precision of the visualization outputs, engaging critically with issues of public data access, asymmetries in the representation of distinct regional conditions, and the legacy of environmental [in]justice. Ultimately, their input iteratively helped refine each planning tool discussed in this paper, positioning community knowledge as constitutive of, rather than supplementary to, the research process.
The fish and wildlife habitat cards were built upon interviews with 22 experts from local and regional government and environmental organizations and subsequently integrated comprehensive PAG feedback. Driven by stakeholder interest, additional efforts are underway to fully develop and broadly distribute the 60 priority species habitat cards with the support of regional organizations. Similarly, the group’s emphasis on prioritizing Green Stormwater Infrastructure (GSI) operation and maintenance within resilient Nature-based Solutions (NbS) planning informed a parallel, ongoing grant-funded initiative.
Collectively, these strategies and tools directly align with community aspirations for equitable data access, environmental justice, and expanded neighborhood-scale agency in regional NbS planning.


 Open access


Comments
No accompanying comment.