

INTRODUCTION
According to the Intergovernmental Panel on Climate Change (IPCC), the annual global temperature will increase by 1·8–6·4°C by 2100 [1]. With the increase in temperature, rainfall in most areas around the world will increase, which will lead to intense climate variability in the future [1]. Climate variability can have profound effects on human health [Reference McMichael, Woodruff and Hales2–Reference Cann4]. For example, heat waves and cold spells have significantly increased the mortality rate in the older population in The Netherlands [Reference Huynen5]. The El-Nino phenomena attributable to climate anomalies have been linked to outbreaks of malaria in Asia, Africa and South America [Reference Githeko6]. Health effects, such as thermal stress and infectious diseases, can be seen during extreme weather events such as periods of high temperature and rainfall [Reference McMichael, Woodruff and Hales2].
Diarrhoeal disease is the one of the leading causes of childhood mortality in developing countries and is responsible for about 1·5 million children's deaths worldwide each year [7]. Unsafe water, poor sanitation and hygiene, and malnutrition are major risk factors for diarrhoeal disease. In Bangladesh, the health impacts of diarrhoeal disease account for 20% of all infant deaths [8]. Several studies have examined the risk factors for diarrhoeal disease in Bangladesh including contaminated drinking water, poor personal hygiene, flooding, and socioeconomic factors [Reference Hoque9–Reference Wu11]. Meteorological factors, such as temperature and rainfall, also impact on the incidence of diarrhoeal disease in Bangladesh. For example, one study reported rainfall and ambient temperature to be positively associated with diarrhoeal diseases in Dhaka [Reference Hashizume12]; another study found that diarrhoea caused by rotavirus was positively associated with high temperatures while inversely related to relative humidity in Dhaka [Reference Hashizume13]. However, there has not been an epidemiological study conducted in Bangladesh that has investigated the impact of weather events, particularly, extreme weather events including temperature and rainfall extremes, on childhood diarrhoea in rural Bangladesh.
Utilizing the unique childhood diarrhoea dataset collected at the International Centre for Diarrhoeal Disease Research in Bangladesh (icddr,b) from 2000 to 2006, we investigated the relationship between childhood diarrhoea and weather patterns in Matlab, Bangladesh at the bari level (a bari is a patrilinearly related cluster of households). The objective of this study was to determine whether increases in temperature and rainfall lead to increases in childhood diarrhoea, and how extreme weather events (hot days and days with heavy rain) affect the prevalence of childhood diarrhoea in rural areas.
METHODS
Study area
The study was conducted in 142 villages of Matlab, Bangladesh (Fig. 1), which is ∼50 km southeast of Dhaka. Each village is composed of a number of baris. Nearly 220 000 people live in ∼10 000 baris in the study area. Matlab is a typical rural area and most people earn their livelihoods in subsistence farming and fishing [Reference Wu10, Reference Wu11].
The study area, Matlab, Bangladesh. The green dots represent baris, and the yellow line represents the flood-control embankment. In the west of the flood-control embankment, the area is protected from floods.

Diarrhoea and climate data
We obtained community-based diarrhoea data for children (<5 years) from 2000 to 2006 from icddr,b. A diarrhoea case is defined as ⩾3 liquid stools during a 24-h period. As described previously [Reference Wu11], community health research workers from icddr,b visited each household once each month and asked parents whether their children had demonstrated symptoms of diarrhoeal diseases in past 24 h. The number of children and the size of the population in each bari were also recorded. In addition, data about whether a household was in a flood-controlled area and socioeconomic status (SES) or wealth were collected as described previously [Reference Wu10, Reference Wu11]. The flood-control data are binary data, which is based on whether a bari is protected by a flood-control embankment in Matlab. The SES data are categorical, which include five classes and are numbered from 1 (low status) to 5 (high status) [Reference Emch14].
Daily temperature data for Dhaka were obtained from the National Climatic Data Center of the USA, which include four measurements of temperature (°C) each day. We used the mean of the four measurements as the daily temperature. The daily rainfall data (in mm) were obtained from the National Water Resources Database (NWRD) maintained by the Water Resources Planning Organization (WARPO) in Bangladesh. We calculated the average temperature for 7 days, 15 days, and 1 month immediately before a visit for disease surveillance. Using the same approach, we calculated the average rainfall in 7 days, 15 days, and 1 month before a surveillance visit. We used the average rainfall instead of the total rainfall because the impacts of these average rainfall variables are comparable.
Definition of extreme weather events
To examine the relationship between childhood diarrhoea and extreme weather events, we defined hot days and days with heavy rainfall using historical data. We used 30 years of daily temperature data (1982–2011) as a reference and defined the 90th percentile of the distribution as the threshold to define hot days. If the daily temperature was above this threshold, it was defined as a hot day. Then we calculated the number of hot days in 7 days, 15 days, and 1 month immediately before a surveillance visit. The days with heavy rainfall (heavy-rain days) were defined using a similar approach. We used 11 years' daily rainfall data (1998–2008) as the reference and the 90th percentile as the threshold to define days with heavy rainfall. Then we calculated the number of days with heavy rainfall in the 7 days, 15 days, and 1 month before a surveillance visit.
Statistical analysis
To examine the trend of three time serial variables (i.e. cases of childhood diarrhoea, monthly average temperature, monthly average rainfall in 7 years), a seasonal-trend decomposition analysis was conducted on these variables using the STL function in R package and each variable was decomposed into three components, i.e. trend, seasonal component and residual component [Reference Cleveland15].
Simple logistic regression models were used to pre-examine the relationships between childhood diarrhoea, and temperature and rainfall, next multivariable logistic regression models were used to examine these relationships adjusting for the number of children, flood-control status, and SES. In both simple and multivariable logistic regression models diarrhoea case is the dependent variable, which has two values (1, bari having diarrhoea cases; 0, bari having no diarrhoea cases). The independent variables include two groups of variables for temperature and rainfall. As described above, there are six variables derived from temperature, which are the average temperature in 7 days, 15 days and 1 month immediately before a surveillance visit (Tm7, Tm15 and TmM), the number of hot days in 7 days, 15 days and 1 month immediately before a visit (NHD7, NHD15 and NHDM). There are also six variables derived from rainfall, including the average rainfall in 7 days, 15 days and 1 month immediately before a visit (Rm7, Rm15 and RmM), the number of heavy-rain days in 7 days, 15 days and 1 month immediately before a visit (NHR7, NHR15 and NHRM). In the multivariable regression analysis, each of these variables and three other control variables (number of children, flood-control status, SES) were included in models as independent variables. In the logistic models, we rounded the average temperature and rainfall data into integers, therefore, these variables were used as discrete variables instead of continuous variables. We did not check the assumption of linearity for weather variables because this is unnecessary in logistic regression analysis [Reference Bewick, Cheek and Ball16].
In addition, we built a forward stepwise logistic regression model to screen important risk factors and examine confounding effects between temperature and rainfall. Considering collinearity (tested by Spearman rank correlation) of these variables, we selected four variables from 12 variables as representative, which included Tm15, NHD15, Rm15 and NHR15 and three control variables. Forward selection procedures were used to remove insignificant variables from the model. We set the significance level at 0·05 as the cut-off for a variable entering and remaining in the model. Considering biologically plausible interactions, we tested interaction effects between average temperature in 15 days and average rainfall in 15 days. To test this possibility, we put an interaction term, namely Tm15*Rm15, into the model. The fit of the model was assessed by several goodness-of-fit indices, including log-likelihood and Akaike's Information Criterion (AIC).
Odds ratios (ORs) were calculated to indicate the association between childhood diarrhoea and these independent variables. We also calculated the increase in diarrhoea risk associated with the change of a certain factor in one unit using (OR – 1) × 100% and expressed it as a percentage [Reference LaValley17]. All statistical analyses were conducted using SAS 9.3 (SAS Inc., USA).
RESULTS
Description of the data
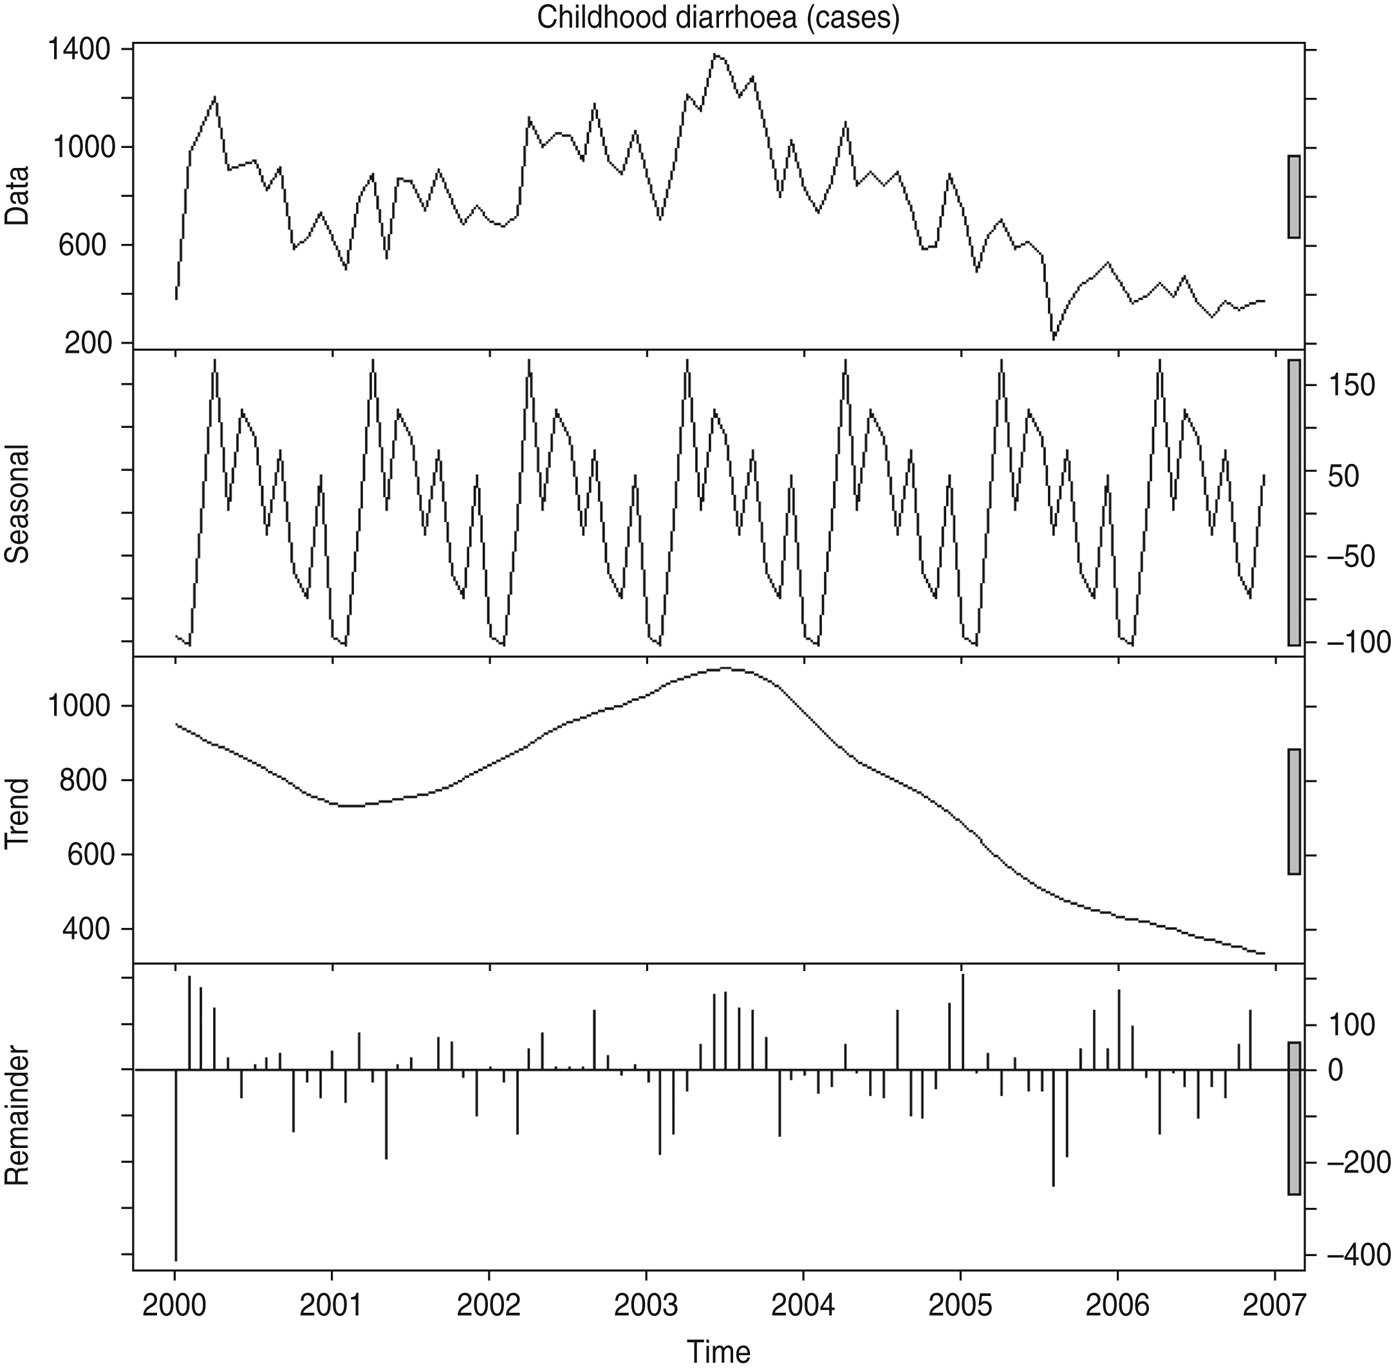
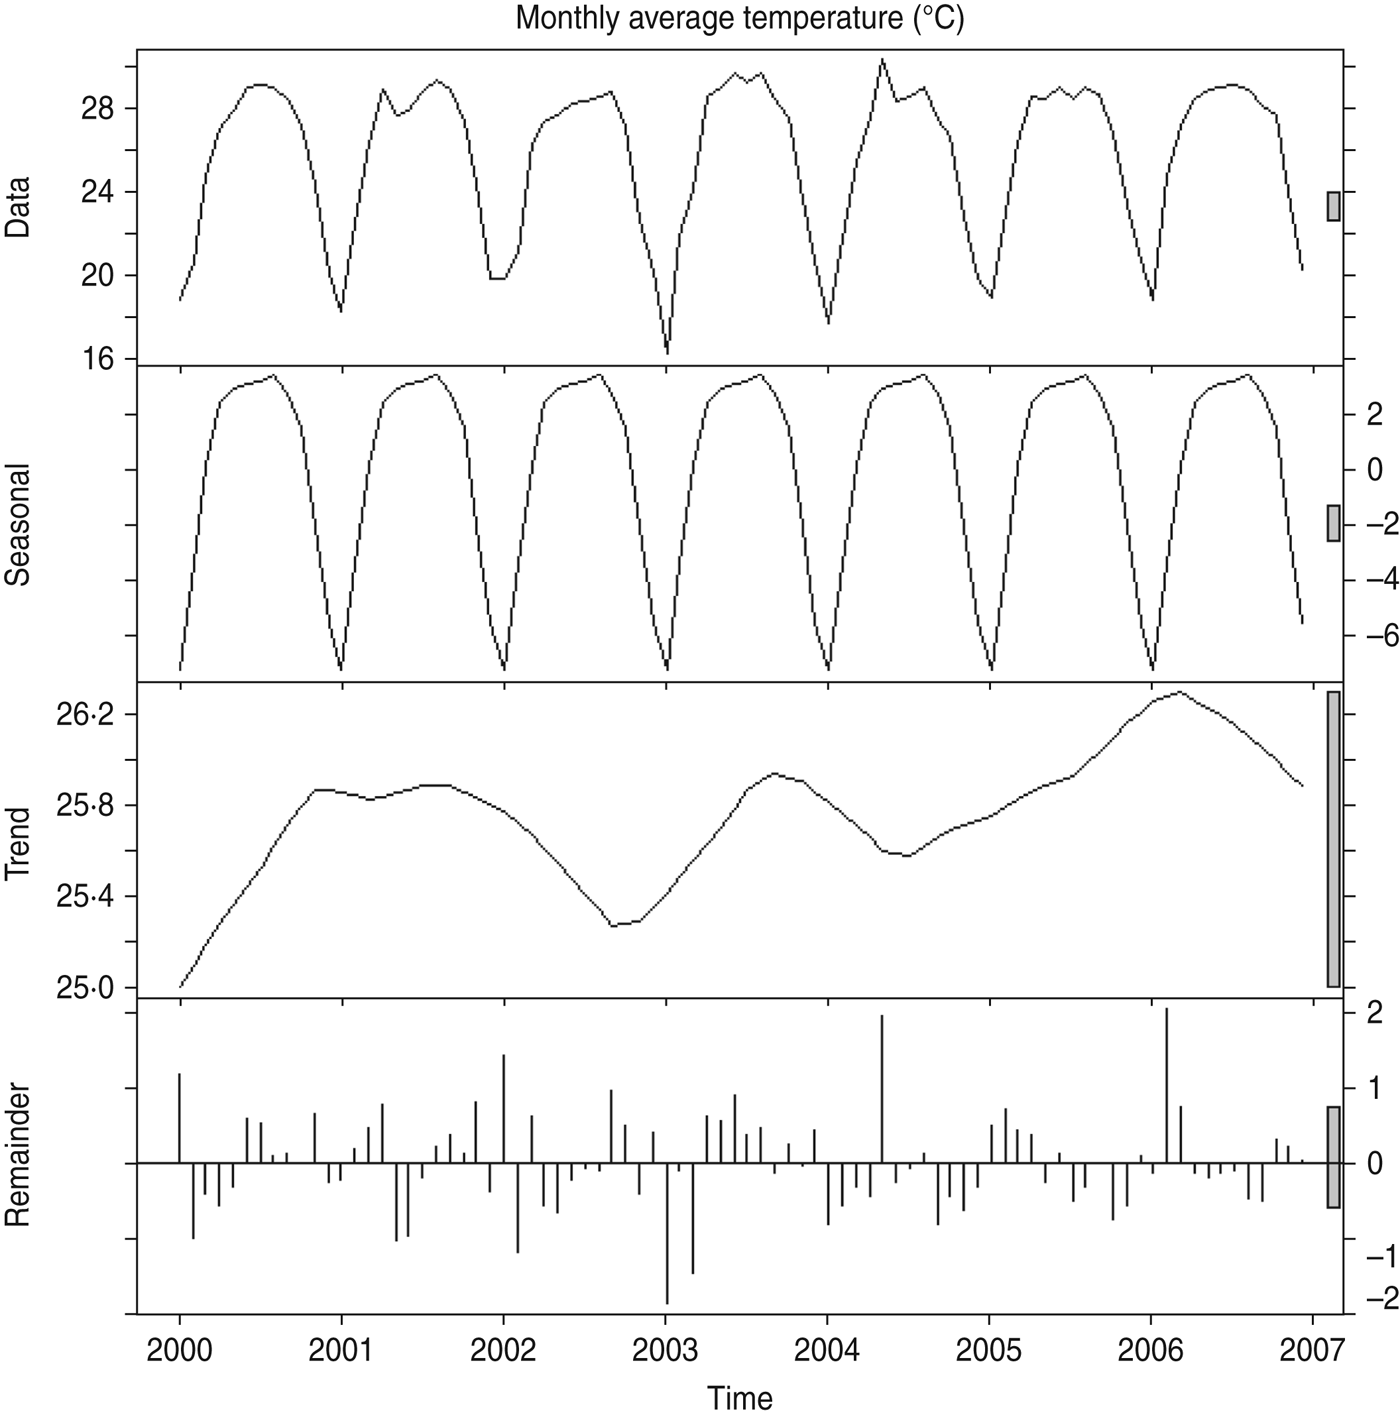
The seasonal-trend decompositions of daily diarrhoea cases, monthly average temperature and monthly average rainfall are illustrated in Figures 2–4, respectively. The number of childhood diarrhoea cases in each month was calculated based on one visit each month, which ranged from 219 to 1378 cases (mean 768 cases). A seasonal peak in cases was more likely to appear in March and April for the entire study period (2000–2006), and there was a decreasing trend in the number of cases from June 2003 to December 2006. The prevalence of childhood diarrhoea (monthly cases/total number of children) ranged from 0·23 to 1·33 cases/child per month, with a mean of 0·75 case/child per month. During 2000–2006, there were 16 551 diarrhoea cases reported in the flood-protected area, while the number of cases was 2·9 times higher in the unprotected area. The monthly average temperature has clear seasonal patterns. In each year, the average temperature is lowest in January, and highest in June, July and August with slight variations. The monthly average temperature ranged from 16·2°C to 30·4°C (mean 25·8°C). The monthly average rainfall also shows a clear seasonal pattern. There is little rainfall from November to March; however, the highest rainfall month varies in different years. The highest rainfall month was June from 2001 to 2003, May in 2000, July in 2005 and September in 2004 and 2006. The monthly average rainfall ranged from 0 mm to 23·5 mm (mean 5·7 mm).
Associations between childhood diarrhoea and meteorological factors based on univariable models
The results of the simple regression models show that 12 meteorological factors are all positively associated with childhood diarrhoea (OR > 1·00, P < 0·01) (Table 1). The results show that the ORs for the average temperature (Tm7, Tm15, TmM) and rainfall (Rm7, Rm15, RmM) variables ranged from 1·002–1·012 and 1·003–1·009, respectively. The results also show that a 1-day increase in the number of hot days and heavy-rain days is associated with an increase in the risk of childhood diarrhoea by 1–3% and 1·3–5·3%, respectively.
The association between childhood diarrhoea and temperature and rainfall variables in Matlab, Bangladesh during 2000–2006, analyzed by univariable logistic regression models (measurement unit: bari)
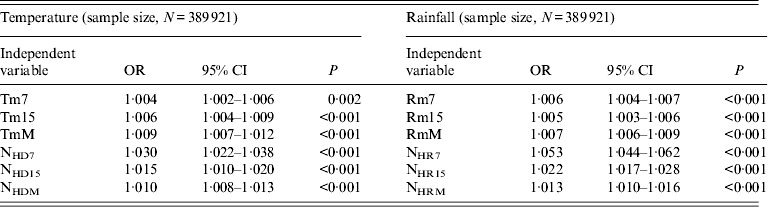
OR, Odds ratio; CI, confidence interval.
Associations between childhood diarrhoea and meteorological factors based on multivariable models
When the effects of the number of children, flood-control status, and SES are controlled in the models, the associations between childhood diarrhoea and temperature variables remain significant (P < 0·05) with OR values of 1·003 [95% confidence interval (CI) 1·000–1·006], 1·005 (95% CI 1·002–1·008), and 1·008 (95% CI 1·005–1·011), respectively, suggesting that a higher average temperature is related to a higher risk of childhood diarrhoea. The positive associations between the number of hot days and childhood diarrhoea also held (P < 0·001). The OR values for these three hot-days variable are 1·018 (95% CI 1·012–1·024), 1·022 (95% CI 1·016–1·028) and 1·013 (95% CI 1·010–1·016), respectively (Table 2).
The association between childhood diarrhoea and temperature variables in Matlab, Bangladesh during 2000–2006, analysed multivariable logistic regression models (measurement unit: bari)
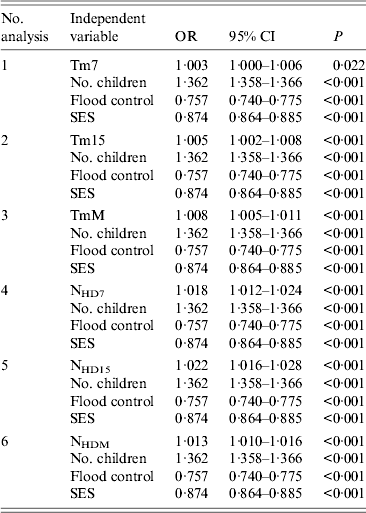
OR, Odds ratio; CI, confidence interval; SES, socioeconomic status.
Sample size: N = 382 834.
After adjusting for the number of children, flood-control status, and SES, similar results were obtained for rainfall variables. The OR values for these three average rainfall variables (Rm7, Rm15, RmM) were 1·005 (95% CI 1·003–1·006), 1·004 (95% CI 1·002–1·006) and 1·007 (95% CI 1·005–1·009), respectively. For the three heavy-rain-day variables, the OR values and their 95% CIs are virtually the same as those obtained by the simple logistic regression models (Table 3).
The association between childhood diarrhoea and rainfall variables in Matlab, Bangladesh during 2000–2006, analysed multivariable logistic regression models (measurement unit: bari)
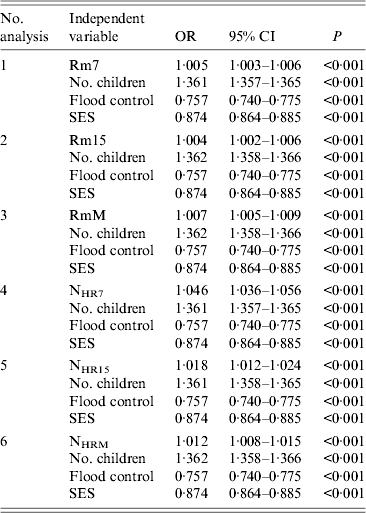
OR, Odds ratio; CI, confidence interval; SES, socioeconomic status.
Sample size: N = 382 834.
Associations between childhood diarrhoea and meteorological factors based on multivariable stepwise models
Forward stepwise logistic regression analysis was conducted to examine the impacts of multiple variables on childhood diarrhoea. In the final model, seven variables had effects on the disease (Table 4). The number of heavy-rain days (NHR15) and the number of hot days (NHD15) had positive effects on the risk of diarrhoea, of which the ORs were 1·031 (95% CI 1·019–1·044, P < 0·001) and 1·018 (95% CI 1·011–1·025, P < 0·001), respectively. The average rainfall (Rm15) and the average temperature (Tm15) had very weak and negative effects on childhood diarrhoea. The ORs for both variables were 0·996 and their 95% CIs were 0·991–1·000 and 0·992–1·000, respectively. Compared to the above analyses when rainfall and temperature variables were put in models separately, the effects of Tm15 and Rm15 changed from positive to negative. This result indicates that for every 1°C increase in Tm15, the odds of a bari having a case of diarrhoea increases by 0·996 when controlling for NHR15, Rm15, NHD15, number of children, flood control, and SES. Similarly, a 1-mm increase in Rm15 will increase the odds of a bari having a case of diarrhoea by 0·996 when controlling the remaining six variables. The test of interaction effects showed that the effect of the interaction term (Rm15*Tm15) on childhood diarrhoea is not significant (P = 0·7059).
The stepwise logistic regression analysis of the association between childhood diarrhoea, and temperature and rainfall variables in Matlab, Bangladesh during 2000–2006 (measurement unit: bari)
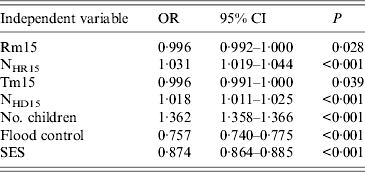
OR, Odds ratio; CI, confidence interval; SES, socioeconomic status.
Sample size: N = 382 834.
The effects of the number children in a bari, flood-control embankment, and SES are the same as that shown in the above analyses, namely, a bari with more children has a higher risk of diarrhoea than a bari with fewer children; a bari in a flood-protected area has a lower risk of diarrhoea than a bari in an unprotected area; and a bari with better SES has a lower risk of diarrhoea than a bari with poor SES.
DISCUSSION
There is growing concern that future climate change will increase the prevalence of waterborne diseases [Reference Rose18]. Our study shows that increases in rainfall and temperature are positively associated with the risk of childhood diarrhoea. Although impacts of meteorological factors such as temperature, rainfall, and El Nino events on diarrhoeal diseases have been investigated in several areas, e.g. Dhaka, Lima, and some Pacific islands [Reference Hashizume12, Reference Checkley19, Reference Singh20], this 7-year study in rural Bangladesh provides new evidence that meteorological factors are potential risk factors for the prevalence of diarrhoeal diseases in children aged <5 years.
High temperature exerts effects on diarrhoeal disease in many ways. First, high temperature increases the exposure to bacterial and parasitic pathogens [Reference Xu21] because most diarrhoeal pathogens grow faster and survive longer in higher temperatures, which increases the chance to contaminate food and water [Reference Rose18]. For example, cholera and Salmonella proliferate more rapidly at higher temperatures [Reference McMichael, Woodruff and Hales2]. In addition, high temperatures may lead to an increased consumption of water, which promotes diarrhoeal disease transmission [Reference Chou22]. High temperatures can also cause dehydration, heat cramps, and heat exhaustion [Reference Kovats and Hajat23, Reference Jardine24], which can weaken children's immune response to microbial infections [Reference Chou22, Reference Jin25]. The positive association between diarrhoea cases and temperature is consistent with studies in Peru, Fiji, and Dhaka, where a 1°C increase in temperature may cause an increase in diarrhoea cases by 8%, 3%, and 6%, respectively [Reference Hashizume12, Reference Checkley19, Reference Singh20]. The effect of the increase in temperature on diarrhoea in this study is relatively mild, suggesting the different effects of temperature vary in different regions and on different types of diarrhoeal diseases [Reference Kolstad and Johansson26].
The impact of heavy rainfall on diarrhoeal disease have been well documented [Reference Hashizume12, Reference Singh20, Reference Curriero27]. Rainfall can exacerbate faecal contamination in water bodies and prompt the microbial transport from contaminated areas to uncontaminated areas, thus increasing the incidence of diarrhoeal disease. For example, a study on microbial quality in a watershed found that heavy precipitation led to sharp increases of E. coli concentrations [Reference Wu, Rees and Dorner28]. A recent study on tubewell water quality in rural Bangladesh also found that there was a positive correlation between rainfall and the frequency of E. coli in ground water [Reference van Geen29]. In addition, heavy rainfall may cause floods, another risk factor associated with diarrhoeal diseases in Bangladesh [Reference Schwartz30]. Flood events are often preceded by heavy rain. During heavy rain, pathogens from latrines or other sources are flushed to water bodies and then dispersed. As a result, people in flood-prone areas are more likely to be exposed to contaminated water. Although a number of studies have examined the association between the increases in temperature or rainfall and diarrhoeal disease, the association between diarrhoeal disease and the number of extreme weather events has rarely been investigated.
It is possible that the positive associations between childhood diarrhoea and the average temperature variables are the confounding effects of the number of hot days. As shown by the results of the stepwise model, the OR direction of Tm15 changes from positive to negative. Similarly, the positive associations for the average rainfall variables might be the confounding effects of the number of heavy-rain days. The negative associations for Tm 15 and Rm15 in the multivariable stepwise model suggest that the increase in the average temperature or rainfall might protect children against diarrhoeal disease, which is unexpected. It also suggests that the effects of average temperature and rainfall factors on childhood diarrhoea are complicated, which needs further investigation.
Our results suggest that meteorological factors have mild effects on childhood diarrhoea, which may be because other factors, such as water, sanitation, personal hygiene and nutrition, play a dominant role in the occurrence of diarrhoeal disease. With efforts to improve water quality, sanitation, hygiene, and nutrition, the incidence of childhood diarrhoea is decreasing, as indicated by the number of diarrhoea cases since 2003 in our study, although the specific reason is not yet clear. However, future climate change may render a higher frequency of extreme weather events, such as hot days and heavy rainfall, thus bringing a considerable increase in diarrhoea cases. As projected in six regions (South America, North Africa, Middle East, equatorial Africa, southern Africa, Southeast Asia) under different scenarios, the increase of diarrhoea risk would be 8–11% by 2010–2039 and 22–29% by 2070–2099, respectively [Reference Kolstad and Johansson26]. Given that Bangladesh has a dense population, climate factors will have an increasing influence on diarrhoeal disease. To mitigate the adverse health effects of climate variability, a few recommendations are listed below for researchers and policy makers: (1) strengthen disease surveillance systems at regional and community level and improve understanding of the link between diarrhoeal disease and climate factors; (2) improve weather forecasting capacity at regional level and develop extreme weather-event early-warning systems; and (3) be aware of the potential health impacts of climate variability and change, specifically, pay attention to the potential contamination of household drinking water and children's hygiene during extreme weather events.
This study has several limitations. First, we only analysed diarrhoeal disease data in 7 years and rainfall data in 11 years. A longer time period is necessary to fully understand the health effects of climate variability. Second, we did not consider temporal autocorrelation of diarrhoeal disease data in our model. Since temperature and rainfall have clear seasonality, it is possible that the association between diarrhoea and climate factors is a confounding effect of season, although this possibility is very low because the numbers of diarrhoea cases does not vary much by month. Third, our definitions for hot days and heavy-rain days are arbitrary. It is likely that the choice of different definitions will obtain different results about the association between diarrhoea and climate factors. Currently, there are no universally accepted definitions for hot days or heavy-rain days. In general, researchers use the 90, 95, or 97·5 percentiles of historical data as the threshold to define weather extremes. In this study, we chose 90% as the threshold because there would have been too few extreme weather events included under a higher threshold and it would have been difficult to statistically assess the impact of extreme weather events if the number of extreme weather events was very low. Finally, we only considered the short time lags (7 days, 15 days, 1 month) between extreme events and resulting diarrhoeal disease cases. It cannot be ruled out that extreme events can lead to diarrhoeal disease at a longer time lag. For example, it was reported that there was a strong association between heavy rainfall and waterborne disease outbreaks in a 2-month time lag, particularly for groundwater contamination [Reference Curriero27]. Given that the diarrhoea cases we examined in this study are mostly acute diarrhoea, it is reasonable to assume that the effect of extreme weather events is stronger if the time lag is shorter.
In summary, this study corroborates that meteorological factors are significantly associated with the risk of childhood diarrhoeal disease in rural Bangladesh. The extreme events indexed by the number of hot days and heavy-rain days have stronger effects on the prevalence of childhood diarrhoea. Since climate variability will exist over a long period and increase in intensity, its impact on childhood diarrhoeal disease will be more prominent. Pre-emptive actions to curb the health effects of climate change in developing counties, especially in rural areas, are necessary.
Seasonal-trend decomposition analysis of childhood diarrhoea cases in Matlab, Bangladesh during 2000–2006. The data were decomposed into three components (seasonal, trend, remainder) using the STL function in R package.
Seasonal-trend decomposition analysis of the monthly average temperature in Matlab, Bangladesh during 2000–2006. The data were decomposed into three components (seasonal, trend, remainder) using the STL function in R package.
Seasonal-trend decomposition analysis of the monthly average rainfall in Matlab, Bangladesh during 2000–2006. The data were decomposed into three components (seasonal, trend, remainder) using the STL function in R package.

ACKNOWLEDGEMENTS
This study was conducted with the support of core donors, which provide unrestricted support to icddr,b for its operations and research. Current donors providing unrestricted support include: the Australian International Development Agency (AusAID), the Government of the People's Republic of Bangladesh, the Canadian International Development Agency (CIDA), the Swedish International Development Cooperative Agency (Sida), and the Department for International Development, UK (DFID).
DECLARATION OF INTEREST
None.


