


A workday can be both energizing and depleting (Parker et al., Reference Parker, Dawson, van den Broeck, Sonnentag and Neal2021). How employees invest their personal energy resources at work (state work engagement) and restore them at the end of the workday (daily off-job recovery) is central to sustaining employee wellbeing (EWB) (Meijman & Mulder, Reference Meijman, Mulder, Drenth, Thierry and de Wolff1998; Quinn et al., Reference Quinn, Spreitzer and Lam2012). We hereby understand EWB as the way people experience feeling good and/or experience fulfillment and purpose during their workday on a day-to-day basis (Sonnentag, Reference Sonnentag2015). Sustaining EWB is an essential topic today for individuals, organizations, and societies alike (Diener et al., Reference Diener, Thapa and Tay2020; Madrid et al., Reference Madrid, Patterson, Birdi, Leiva and Kausel2014; United Nations, 2015).
Previous research has shown that leadership is an impactful social influence at work (Antonakis & Day, Reference Antonakis and Day2017; Schippers & Hogenes, Reference Schippers and Hogenes2011; Yukl, Reference Yukl2013). As such, leadership can either energize or de-energize people to engage in work-related tasks (Bakker & De Vries, Reference Bakker and de Vries2021; Schippers & Hogenes, Reference Schippers and Hogenes2011), and is therefore thought to either bolster or hamper EWB. Correspondingly, one of the best researched leadership-employee related relationships is arguably the positive one between transformational leadership and work engagement (Decuypere & Schaufeli, Reference Decuypere and Schaufeli2020; Reference Decuypere and Schaufeli2021). More specifically, a substantial body of cross-sectional research has shown that employees who work for transformational leaders feel more energized and engaged (Arnold, Reference Arnold2017), and that this positive energy shapes the perception of resources to cope with their work tasks (Bakker et al., Reference Bakker, Demerouti and Sanz-Vergel2023). This research body suggests that transformational leadership bolsters work engagement, often understood as a facet of EWB (Decuypere & Schaufeli, Reference Decuypere and Schaufeli2020).
However, research also suggests that it is this energizing effect of transformational leader behaviors that relate to the overconsumption of personal energy resources via impaired off-job recovery processes (Baethge et al., Reference Baethge, Junker and Rigotti2021; Stein et al., Reference Stein, Schümann and Vincent-Höper2021; Syrek & Antoni, Reference Syrek and Antoni2014). Specifically, leaders’ high performance expectations (Syrek & Antoni, Reference Syrek and Antoni2014), implicit extra role efforts (Stein et al., Reference Stein, Schümann and Vincent-Höper2021), and inspirational elements that invoke self-sacrificing behaviors in employees (Nielsen & Daniels, Reference Nielsen and Daniels2016) have been suggested to relate to prolonged physical activation (Baethge et al., Reference Baethge, Junker and Rigotti2021) and prolonged mental representation of stressful work experiences (Syrek & Antoni, Reference Syrek and Antoni2014) which would constitute negative work-nonwork spillover processes and hamper EWB over time. This challenges existing assumptions regarding favorable EWB effects of transformational leadership (e.g., Arnold, Reference Arnold2017; Nielsen & Taris, Reference Nielsen and Taris2019; Teetzen et al., Reference Teetzen, Bürkner, Gregersen and Vincent-Höper2022). If supported, these potential “dark sides” of transformational leadership would imply the need to recalibrate behaviors that relate to daily personal energy resource investment at work so that daily negative effects for work-nonwork processes can be avoided. This would also have implications for transformational leadership training so that it does in fact have positive outcomes for EWB, which until now receives only limited support (Nielsen & Taris, Reference Nielsen and Taris2019).
Yet, how this energizing effect relates to the subsequent off-job recovery, on a day-to-day basis, remains a black box. In fact, research on the relationship between leadership and employee recovery is scarce (Chan et al., Reference Chan, Howard, Eva and Tse2022; Kelemen et al., Reference Kelemen, Matthews and Breevaart2020; Sonnentag et al., Reference Sonnentag, Cheng and Parker2022). Moreover, necessary within-person studies are widely lacking, although studying the effect of stable leadership perceptions on transient states such as daily work engagement, daily perception of job characteristics, daily work-nonwork spillover processes and daily recovery warrants such a methodology (Ohly et al., 2010; Sonnentag et al., Reference Sonnentag, Cheng and Parker2022). In fact, the predominance of cross-sectional research is concerning, because in general, the most common occupational health theories (e.g., Bakker et al., Reference Bakker, Demerouti and Sanz-Vergel2023; Hobfoll et al., Reference Hobfoll, Halbesleben, Neveu and Westman2018) imply a shorter dynamic temporal lens and within-person effects (Cham et al., 2021; Kelemen et al., Reference Kelemen, Matthews and Breevaart2020; Sonnentag et al., Reference Sonnentag, Cheng and Parker2022), which calls for diary studies when studying leadership-EWB relationships (Czakert & Berger, Reference Czakert and Berger2023). The main goal of this study was thus to extend previous research by integrating an energy-enriching (resource-based) and an energy-depleting (demand-based) pathway to highlight a potential double-edged sword effect of the transformational leadership-work engagement relationship on off-work recovery in a daily diary study design. We build our hypotheses development on the job demands-resource-recovery (JD-R-R) theoretical model (Bennett et al., Reference Bennett, Bakker and Field2018; Kinnunen et al., Reference Kinnunen, Feldt, Siltaloppi and Sonnentag2011), which states that EWB is a function of the interplay of demands, resources, spillover, and recovery processes. Regarding the energy-enriching pathway, we assume that transformational leaders influence employees’ state work engagement, a personal high-arousal affective energy resource, which relates to increased daily role clarity – a contextual resource – and thereby facilitates daily positive work-nonwork spillover and off-work recovery processes (Fredrickson, Reference Fredrickson2001; Nielsen et al., Reference Nielsen, Randall, Yarker and Brenner2008; Xanthopoulou et al., Reference Xanthopoulou, Bakker, Demerouti and Schaufeli2007, Reference Xanthopoulou, Bakker, Demerouti and Schaufeli2009). In contrast, regarding the energy-depleting pathway, we assume that transformational leaders’ energizing effect could also potentially overtax their followers’ energy system (i.e., increase daily state work engagement that relates to increased daily workload), thereby increase negative work-nonwork spillover and reduce positive work-nonwork spillover, and ultimately detrimentally impact daily off-work recovery processes (Chawla et al., Reference Chawla, MacGowan, Gabriel and Podsakoff2020; Hobfoll et al., Reference Hobfoll, Halbesleben, Neveu and Westman2018; Ilies et al., Reference Ilies, Schwind, Wagner, Johnson, DeRue and Ilgen2007; Quinn et al., Reference Quinn, Spreitzer and Lam2012; Rodell & Judge, Reference Rodell and Judge2009; Story & Repetti, Reference Story and Repetti2006; ten Brummelhuis & Bakker, Reference ten Brummelhuis and Bakker2012; Zohar et al., Reference Zohar, Tzischinski and Epstein2003). In total, the energy-enriching resource-based pathway would bolster EWB, whereas the energy-depleting demand-based pathway would hamper EWB the next day.
In doing so, this study makes five main contributions. Firstly, we add to the few daily diary research that focuses on leadership, work-nonwork spillover and off-work recovery (Bennett et al., Reference Bennett, Bakker and Field2018) to provide a more nuanced understanding of the transformational leadership-EWB relationship. In general, leadership research has been insufficiently integrated into work-nonwork research in general (Sonnentag et al., Reference Sonnentag, Cheng and Parker2022) and specifically into recovery research (Chan et al., Reference Chan, Howard, Eva and Tse2022).
Secondly, we extend the JD-R-R model by addressing leadership as a factor that influences state work engagement (Breevaart & Bakker, Reference Breevaart and Bakker2018; Tims et al., Reference Tims, Bakker and Xanthopoulou2011) and thereby the perception of job demands and resources (Bakker et al., Reference Bakker, Demerouti and Sanz-Vergel2023). By that means, we add to the limited research that investigates work engagement as a predictor rather than outcome of job characteristics (Lesener et al., Reference Lesener, Gusy and Wolter2019). This is important because it helps to understand better the causal direction and the dynamic nature of the relationships between these variables, which have been mostly studied in the opposite direction. In doing so, the study can provide a more comprehensive and nuanced picture of the reciprocal and dynamic processes involved in work engagement and its consequences, theorized in the demand-resource theories (Bakker & De Vries, Reference Bakker and de Vries2021; Hobfoll et al., Reference Hobfoll, Halbesleben, Neveu and Westman2018). Investigating this relationship adds necessary partial support for the notion of gain and loss-cycles (Bakker et al., Reference Bakker, Demerouti and Sanz-Vergel2023). It also tests the extended leadership-job demand-resource-recovery model (Czakert & Berger, Reference Czakert and Berger2023), that sees leadership as a contextual macro-factor that influences more transient factors. Consequently, this study does not focus on explaining mechanisms that link transformational leadership to work engagement but complements this research by explaining what follows this already well-researched link on a day-to-day basis.
Thirdly, building on affect-driven theories (Cropanzano et al., Reference Cropanzano, Dasborough and Weiss2017) and the idea of finiteness of human energy resources (Quinn et al., Reference Quinn, Spreitzer and Lam2012), we shed more light on the role of balancing personal energy resources (which we refer to as constituting the indirect link between state work engagement and subsequent off-job recovery) on a day-to-day basis.
Fourthly, we enrich the picture of transformational leadership and work engagement by the notion of potential “dark sides”, emphasizing an adequate balance and boundary of energizing leader behaviors and engagement levels as well an awareness of potentially detrimental health effects.
Fifthly, by comparing both resource- as well as demands-based pathways, we contribute to the few dual-pathway research that finally aims to identify not only demands for work-nonwork processes, but also positive resource-enriching pathways.
The Central Role of Energy Resource Balancing for EWB
EWB can be understood as a multifaceted individual-level construct that can manifest in different ways, such as in emotions and affect, physical health, cognitive functioning, and social relationships (Arnold, Reference Arnold2017). However, according to Quinn et al. (Reference Quinn, Spreitzer and Lam2012), the central element of EWB is human energy. The psychological element of human energy, namely energetic activation (Quinn et al., Reference Quinn, Spreitzer and Lam2012), may be measured best as emotional experiences in a two-dimensional space across the emotional affective circumplex (Crain et al., Reference Crain, Brossoit and Fisher2018; Russell, Reference Russell1980), with one dimension representing the level of arousal (or activation) and the other dimension representing the valence (or positivity-negativity) of the emotion. In this sense, the psychological form of energy can be experienced through high arousal positive emotions, such as vigor, or its antithesis, emotional exhaustion (Crain et al., Reference Crain, Brossoit and Fisher2018). High arousal negative emotions, in turn, relate to negative EWB (Sonnentag et al., Reference Sonnentag, Tay and Nesher Shoshan2023). Positive energetic activation thus refers to people’s perception that they are energized (Quinn et al., Reference Quinn, Spreitzer and Lam2012). Emerging research fields and theories all emphasize the role of energy as a scarce resource central to EWB that needs to be managed in a balanced and regenerative way, allowing for replenishment and recovery (Crain et al., Reference Crain, Brossoit and Fisher2018; Hobfoll et al., Reference Hobfoll, Halbesleben, Neveu and Westman2018; Maslach & Leiter, Reference Maslach and Leiter2016; Meijman & Mulder, Reference Meijman, Mulder, Drenth, Thierry and de Wolff1998). From a temporal perspective, it is important to note that vacation-to-vacation recovery is not sufficient, as the effects of vacations vanish quickly (Sonnentag, Reference Sonnentag2003). Rather, daily recovery processes are crucial to maintain EWB (Demerouti et al., Reference Demerouti, Bakker, Geurts, Taris, Sonnentag, Perrewé and Ganster2009; Sonnentag, Reference Sonnentag2003).
Despite its acknowledged importance, recent reports and research suggest that a proper balancing of personal energy is at significant risk, and that bolstering EWB and/or buffering ill-being is becoming increasingly difficult (Adecco, 2022; Gallup, 2021; Kniffin et al., Reference Kniffin, Narayanan, Anseel, Antonakis, Ashford, Bakker, Bamberger, Bapuji, Bhave, Choi, Creary, Demerouti, Flynn, Gelfand, Greer, Johns, Kesebir, Klein, Lee and Vugt2021; Rudolph et al., Reference Rudolph, Allan, Clark, Hertel, Hirschi, Kunze, Shockley, Shoss, Sonnentag and Zacher2021; Sonnentag et al., Reference Sonnentag, Cheng and Parker2022). Reasons for this may be the accelerating flexibilization of work arrangements that has increased the permeability of boundaries between work and nonwork (McKinsey & Company, 2021), which makes the occurrence of spillover effects from work to nonwork and impaired recovery processes more likely (Sonnentag et al., Reference Sonnentag, Cheng and Parker2022). Work-nonwork spillover effects refer to the idea that experiences at work can transmit to the nonwork domain (Geurts et al., Reference Geurts, Taris, Kompier, Dikkers, van Hooff and Kinnunen2005; Hanson et al., Reference Hanson, Hammer and Colton2006). While positive work-nonwork spillover would set beneficial conditions for off-job recovery, negative work-nonwork spillover (e.g., prolonged negative load reactions) would make off-job recovery more difficult (Demerouti et al., Reference Demerouti, Bakker, Sanz-Vergel, Major and Burke2013; ten Brummelhuis & Bakker, Reference ten Brummelhuis and Bakker2012). Indeed, a recent report shows that employees nowadays seem to have more trouble to recover from work (e.g., Adecco, 2022), i.e., to unwind and restore their resources after work (Sonnentag & Fritz, Reference Sonnentag and Fritz2007), and a growing body of research shows that the difficulty of effectively restoring energy resources off-work largely affects EWB on a daily basis (Meijman & Mulder, Reference Meijman, Mulder, Drenth, Thierry and de Wolff1998; Parker et al., Reference Parker, Dawson, van den Broeck, Sonnentag and Neal2021; Sonnentag et al., Reference Sonnentag, Cheng and Parker2022). Recovery experiences were also considered as energy resources themselves (Halbesleben et al., Reference Halbesleben, Neveu, Paustian-Underdahl and Westman2014).
In this sense, on the one hand, personal energy as a positive affect state (feeling good and/or fulfilled) can be seen as EWB itself (Quinn et al., Reference Quinn, Spreitzer and Lam2012). On the other hand, personal energy can also be referred to as a resource for EWB, as positive emotions have shown to be linked to other resources influencing EWB (Diener et al., Reference Diener, Thapa and Tay2020). In the present manuscript, we refer to both perspectives to show how the daily investment of personal energy resources at work (state work engagement) and the daily restoration of personal energy resources (off-job recovery) interact via different sets of job characteristics and spillover effects and ultimately affect EWB.
Transformational Leadership and its Effects on Daily EWB: The Resource-based Pathway
We argue that transformational leadership can offset dynamic upward spirals, also known as “gain cycles” in job-demands resource theory (Bakker et al., Reference Bakker, Demerouti and Sanz-Vergel2023), that enrich daily personal energy resources and thereby bolster EWB. Resources can be broadly defined as “anything perceived by the individual to help attain his or her goals” (Halbesleben et al., Reference Halbesleben, Neveu, Paustian-Underdahl and Westman2014, p. 1338) and may be found at contextual or personal level (ten Brummelhuis & Bakker, Reference ten Brummelhuis and Bakker2012). Building on the resource-based pathway inherent to the JD-R-R model (Kinnunen et al., Reference Kinnunen, Feldt, Siltaloppi and Sonnentag2011), we understand transformational leadership as a rather stable contextual macro-resource that mobilizes daily personal energy resources (i.e., state work engagement), which increase daily contextual resources (i.e., daily role clarity), daily positive affective spillover and daily recovery experiences, and thereby ultimately promote EWB the next day in a serial mediation path.
Transformational leadership, the most researched positive leadership style (Antonakis, Reference Antonakis, Day and Antonakis2012; Decuypere & Schaufeli, Reference Decuypere and Schaufeli2020), is a multifaceted construct that aims at transforming employee’s mindsets to spur work engagement and ultimately performance. Transformational leaders provide employees with idealized influence, individualized consideration, intellectual stimulation, and inspirational motivation (Bass, Reference Bass1985). Previous research has shown that transformational leaders affect their employee’s daily work engagement (Breevaart & Bakker, Reference Breevaart and Bakker2018; Tims et al., Reference Tims, Bakker and Xanthopoulou2011) and positive emotions at work (Bono et al., Reference Bono, Foldes, Vinson and Muros2007) directly, and it was proposed that they may do so via emotional contagion, social learning and/or social exchange processes (Decuypere & Schaufeli, Reference Decuypere and Schaufeli2020). This suggests that transformational leaders do not need to interact directly daily with their employees to elicit their positive effects on state work engagement solely in an immediate way (daily specific leader behaviors), but that transformational leaders rather have broad positive effects that translate into state work engagement (Bono et al., Reference Bono, Foldes, Vinson and Muros2007). Transformational leaders are therefore considered energizing, as they mobilize employee’s energy resources (Cropanzano et al., Reference Cropanzano, Dasborough and Weiss2017; Schippers & Hogenes, Reference Schippers and Hogenes2011). As a macro-resource, transformational leadership is a rather stable resource that is unlikely to fluctuate daily (Breevaart & Zacher, Reference Breevaart and Zacher2019). This does not neglect the fact that leader-employee interactions may differ from day to day (Kelemen et al., Reference Kelemen, Matthews and Breevaart2020), but rather that variations in the perception of transformational leadership remain relatively stable over time (Bakker & De Vries, Reference Bakker and de Vries2021).
It has been suggested that on days employees feel more engaged with their work they use their positive momentary affective state to broaden their momentary thought-action repertoires which influences their perception of contextual resources (Fredrickson, Reference Fredrickson2001; Xanthopoulou et al., Reference Xanthopoulou, Bakker, Demerouti and Schaufeli2007). Although often considered as outcome rather than resource in itself (Kahn, Reference Kahn1990; Xanthopoulou et al., Reference Xanthopoulou, Bakker, Demerouti and Schaufeli2009), daily work engagement as a positive motivational-affective state (Macey & Schneider, Reference Macey and Schneider2008; Xanthopoulou et al., Reference Xanthopoulou, Bakker, Demerouti and Schaufeli2009) therefore represents an important personal energy resource for employees. Such personal resources predict contextual resources (Xanthopoulou et al., Reference Xanthopoulou, Bakker, Demerouti and Schaufeli2007). In fact, research has shown that this energizing effect of being engaged at work builds not only other personal resources, such as self-efficacy (Salanova et al., Reference Salanova, Bakker and Llorens2006), but also increases the perception of contextual resources, such as role clarity (Nielsen et al., Reference Nielsen, Randall, Yarker and Brenner2008; Xanthopoulou et al., Reference Xanthopoulou, Bakker, Demerouti and Schaufeli2009). This is also in line with the assumption of reciprocity inherent to the job-demands resources model (Bakker & Demerouti, Reference Bakker, Demerouti, Chen and Cooper2014; Bakker et al., Reference Bakker, Demerouti and Sanz-Vergel2023; Lesener et al., Reference Lesener, Gusy and Wolter2019), which posits that not only resources and demands affect work engagement, but also that on days workers feel engaged, they are more likely to recognize, seek, and build more easily additional resources (Bakker et al., Reference Bakker, Demerouti and Sanz-Vergel2023; Hobfoll et al., Reference Hobfoll, Halbesleben, Neveu and Westman2018; Xanthopoulou et al., Reference Xanthopoulou, Bakker, Demerouti and Schaufeli2009). In this vein, Venz et al. (Reference Venz, Pundt and Sonnentag2018) suggested trainings at individual level to increase daily role clarity.
We focus on role clarity –employees’ clear understanding of responsibilities and expectations (Kauppila, Reference Kauppila2014)– because it is of particular importance for employees in the modern working world characterized by rather high levels of autonomy but that often lack a clear sense of tasks and performance expectations (Venz et al., Reference Venz, Pundt and Sonnentag2018). Moreover, organizational health experts suggest that especially in contemporary uncertain times and virtual work settings, promoting role clarity is of paramount importance to sustain EWB (Kniffin et al., Reference Kniffin, Narayanan, Anseel, Antonakis, Ashford, Bakker, Bamberger, Bapuji, Bhave, Choi, Creary, Demerouti, Flynn, Gelfand, Greer, Johns, Kesebir, Klein, Lee and Vugt2021). We assume that daily role clarity is not only provided by the organization or by the supervisor, but rather perceived bottom-up by the engaged individual employee (Kauppila, Reference Kauppila2014). We further assume that daily role clarity relates to daily positive affective spillover processes (Romeo et al., Reference Romeo, Berger, Yepes-Baldó and Ramos2014), because on days when tasks and expectations are clear, employees accomplish task goals better and make their work more enjoyable, which raises their affective mood that might spill over to the nonwork domain (Rodríguez-Muñoz et al., Reference Rodríguez-Muñoz, Sanz-Vergel, Demerouti and Bakker2014). While a meta-analysis showed that contextual resources generally improve recovery processes (Bennett et al., Reference Bennett, Bakker and Field2018), we argue that it is this effect of daily role clarity on positive affective spillover (being in a positive mood at the end of the workday) as a personal energy resource that facilitates daily recovery processes (Gallegos et al., Reference Gallegos, Berger, Guardia-Olmos and Escartín2021; Sonnentag & Binnewies, Reference Sonnentag and Binnewies2013). Similarly, we hypothesize that daily role clarity reduces the negative spillover effect of lack of energy or negative emotions (Romeo et al., Reference Romeo, Berger, Yepes-Baldó and Ramos2014) which would impair daily recovery processes (Gallegos et al., Reference Gallegos, Berger, Guardia-Olmos and Escartín2021; Geurts et al., Reference Geurts, Taris, Kompier, Dikkers, van Hooff and Kinnunen2005). In other words, the contextual resource of daily role clarity enhances personal resources that are functional in the nonwork domain (Kempen et al., Reference Kempen, Roewekaemper, Hattrup and Mueller2019; ten Brummelhuis & Bakker, Reference ten Brummelhuis and Bakker2012). Daily recovery processes, in turn, are enabled through experiences of mastery, control, psychological detachment, and/or relaxation. These processes are fundamental to restore daily personal energy resource losses (Bakker et al., Reference Bakker, Sanz-Vergel, Rodríguez-Muñoz and Oerlemans2015; Meijman & Mulder, Reference Meijman, Mulder, Drenth, Thierry and de Wolff1998). Previous research has shown that positive affective spillover is positively linked to all of these recovery experiences (e.g., Bennett et al., Reference Bennett, Bakker and Field2018; Fredrickson & Levenson, Reference Fredrickson and Levenson1998; Kempen et al., Reference Kempen, Roewekaemper, Hattrup and Mueller2019). For instance, on days employees experience more positive affective spillover, they may perceive to have more personal resources available for learning (mastery) and decision making (control) during nonwork time. Moreover, regarding the reduction of daily negative work-nonwork spillover, employees would ruminate less about stressful work events and would therefore more easily psychologically detach and relax (Kinnunen et al., Reference Kinnunen, Feldt, Siltaloppi and Sonnentag2011).
We therefore propose that transformational leadership enriches daily personal energy resources and thereby bolsters EWB.
Hypothesis 1a: Transformational leadership predicts daily positive EWB via daily work engagement, daily role clarity, increased daily positive work-nonwork spillover, and daily recovery processes.
Hypothesis 1b: Transformational leadership predicts daily positive EWB via daily work engagement, daily role clarity, decreased daily negative work-nonwork spillover, and daily recovery processes.
Transformational Leadership and its Effects on Daily EWB: The Demands-based Pathway
Moving away from the resource-based pathway and focusing on the hypothesized demands-based pathway, we also argue that the transformational leadership-work engagement relationship as a demand can offset demand-based downward spirals (Bakker et al., Reference Bakker, Demerouti and Sanz-Vergel2023) that deplete personal energy resources and thus affect daily off-job recovery and EWB adversely, and that these effects can coexist. Demands can broadly be defined as physical, emotional, social, or organizational aspects of the social context that require sustained psychophysiological effort (Demerouti et al., Reference Demerouti, Bakker, Nachreiner and Schaufeli2001). They can be categorized into challenging demands and hindrance demands (Podsakoff et al., Reference Podsakoff, Freiburger, Podsakoff and Rosen2023 ). Typical challenging demands are workload and time pressure, whereas hindrance demands may be role conflict (Bennett et al., Reference Bennett, Bakker and Field2018), job insecurity, constraints, and interpersonal conflicts (Tadić et al., Reference Tadić, Bakker and Oerlemans2015). The distinction seems relevant because challenge demands are, unlike hindrance demands, not solely perceived as stressful, personal resource-depleting, and impairing goal attainment, but also have positive effects on goal attainment and thus may boost personal resources, such as increased levels of energy, self-efficacy, and learning (Tadić et al., Reference Tadić, Bakker and Oerlemans2015). Following this, a meta-analysis (Crawford et al., Reference Crawford, LePine and Rich2010) showed that challenge demands are positively associated with work engagement. From a daily perspective, it therefore seems plausible to assume that employees might choose to work on the most challenging tasks when they feel particularly energetic, i.e., work engaged (Sonnentag, Reference Sonnentag2015). Indeed, this motivational element of challenging demands was also associated with higher positive affect (Tadić Vujčić et al., Reference Tadić Vujčić, Oerlemans and Bakker2017).
However, the same meta-analysis found that both challenging and hindering demands are positively associated with burnout (Crawford et al., Reference Crawford, LePine and Rich2010), suggesting that all kinds of demands deplete personal energy resources. Moreover, recent research emerged that opened discussions around potential “dark sides” of transformational leadership and work engagement (Baethge et al., Reference Baethge, Junker and Rigotti2021; Bennett et al., Reference Bennett, Bakker and Field2018; Schaufeli et al., Reference Schaufeli, Leiter and Maslach2009; Rantanen et al., Reference Rantanen, Kinnunen and Pulkkinen2013; Syrek & Antoni, Reference Syrek and Antoni2014), which are strongly related to over-engagement and increased tackling of challenging demands. Related to this, a meta-analysis showed that work engagement shares considerable overlap with some workaholism dimensions that are working excessively and working compulsorily (Di Stefano & Gaudino, Reference Di Stefano and Gaudiino2019). In sum, transformational leaders’ energizing effect could potentially overtax their followers’ energy system, i.e., increase over-engagement, increase daily challenging demands, and thereby detrimentally impact recovery processes (Quinn et al., Reference Quinn, Spreitzer and Lam2012). From a dynamic recovery perspective, these relationships between transformational leadership, work engagement, and challenging demands are particularly concerning, as meta-analytical evidence shows that challenging demands impair recovery processes even more than hindrance demands (Bennett et al., Reference Bennett, Bakker and Field2018). This would also question the favorable connotation of challenge demands as “positive events/conditions” (Podsakoff et al., Reference Podsakoff, Freiburger, Podsakoff and Rosen2023, p. 170).
We argue that high workload and related overload is of particular importance for negative spillover effects and impaired recovery processes (Geurts et al., Reference Geurts, Taris, Kompier, Dikkers, van Hooff and Kinnunen2005; Nixon et al., Reference Nixon, Mazzola, Bauer, Krueger and Spector2011; Steed et al., Reference Steed, Swider, Keem and Liu2021). Workload can be defined as the intensity or the extent of work assigned to an employee in a specific time frame (Inegbedion et al., Reference Inegbedion, Inegbedion, Peter and Harry2020). We focus on this demand because nowadays, overload is “widespread and chronic” (Kelly & Moen, Reference Kelly and Moen2020a, p. 48, particularly in emerging remote work settings characterized by higher work intensification, working at high speed to meet tight deadlines, and overwork (Kelly & Moen, Reference Kelly and Moen2020b; Zappalà et al., Reference Zappalà, Swanzy and Toscano2022). The recent research landscape shows inconsistent patterns of findings for daily within-individual variations of workload and relations to daily recovery experiences (Sonnentag et al., Reference Sonnentag, Cheng and Parker2022). Whereas some studies found that on days with high workload individuals experienced less recovery (Chawla et al., Reference Chawla, MacGowan, Gabriel and Podsakoff2020; Germeys & De Gieter, Reference Germeys and De Gieter2017; Sonnentag & Fritz, Reference Sonnentag and Fritz2007), others did not find such a relationship (Lanaj et al., Reference Lanaj, Gabriel and Chawla2021; Smit, Reference Smit2016). We argue that although high workload might be accompanied by high energetic activation in the short term, negative spillover processes might be the linking pin between daily workload and daily recovery (ten Brummelhuis & Bakker, Reference ten Brummelhuis and Bakker2012): On days when facing high workload, increased negative spillover processes, and decreased positive spillover respectively, impair recovery processes and decrease EWB. This is supported by previous research that links workload to negative work-nonwork spillover (Bowling et al., Reference Bowling, Alarcon, Bragg and Hartman2015), and research that has shown that on days when tackling challenge stressors, employees typically experience a higher level of activated negative affect during work (Ilies et al., Reference Ilies, Schwind, Wagner, Johnson, DeRue and Ilgen2007; Rodell & Judge, Reference Rodell and Judge2009), at the end of the workday (Story & Repetti, Reference Story and Repetti2006; Zohar et al., Reference Zohar, Tzischinski and Epstein2003), and after work (Ilies et al., Reference Ilies, Schwind, Wagner, Johnson, DeRue and Ilgen2007). Regarding recovery experiences, Chawla et al. (Reference Chawla, MacGowan, Gabriel and Podsakoff2020) found that challenging demands perceived as sources of strain limit their beneficial outcomes to the work domain and impair off-job recovery. Negative spillover in form of ruminating about work-related tasks (Syrek & Antoni, Reference Syrek and Antoni2014), boundaryless working hours (Vieten et al., Reference Vieten, Wöhrmann and Michel2022) and depleted personal energy resources in general (Meijman & Mulder, Reference Meijman, Mulder, Drenth, Thierry and de Wolff1998) impair off-job recovery processes. More specifically, Bennett et al. (Reference Bennett, Bakker and Field2018) could show that negative spillover resulting from job demands impairs psychological detachment, relaxation, and control, but not significantly mastery.
We therefore propose that transformational leadership depletes personal energy resources and thereby impairs EWB.
Hypothesis 2a: Transformational leadership predicts daily negative EWB via increased state work engagement, increased daily workload, increased daily negative work-nonwork spillover, and decreased off-work recovery processes.
Hypothesis 2b: Transformational leadership predicts daily negative EWB via increased state work engagement, increased daily workload, decreased positive work-nonwork spillover, and decreased off-work recovery processes.
Finally, we assume that, due to the coexistence of both pathways, the main effect between transformational leadership and EWB is not significant. This is also in line with the notion that for many leadership-EWB interventions, nonsignificant results appeared (Nielsen & Taris, Reference Nielsen and Taris2019). Moreover, it complements previous research that highlighted differential effects of transformational leadership on EWB and argued that effects related to overload and energy resource depletion explain the low coefficients found in previous research (Franke & Felfe, Reference Franke and Felfe2011). Building on this, we suggest that the indirect energy-resource depleting pathway cancels potential positive effects of transformational leadership on EWB.
Hypothesis 3: The main effect between transformational leadership and EWB is not significant.
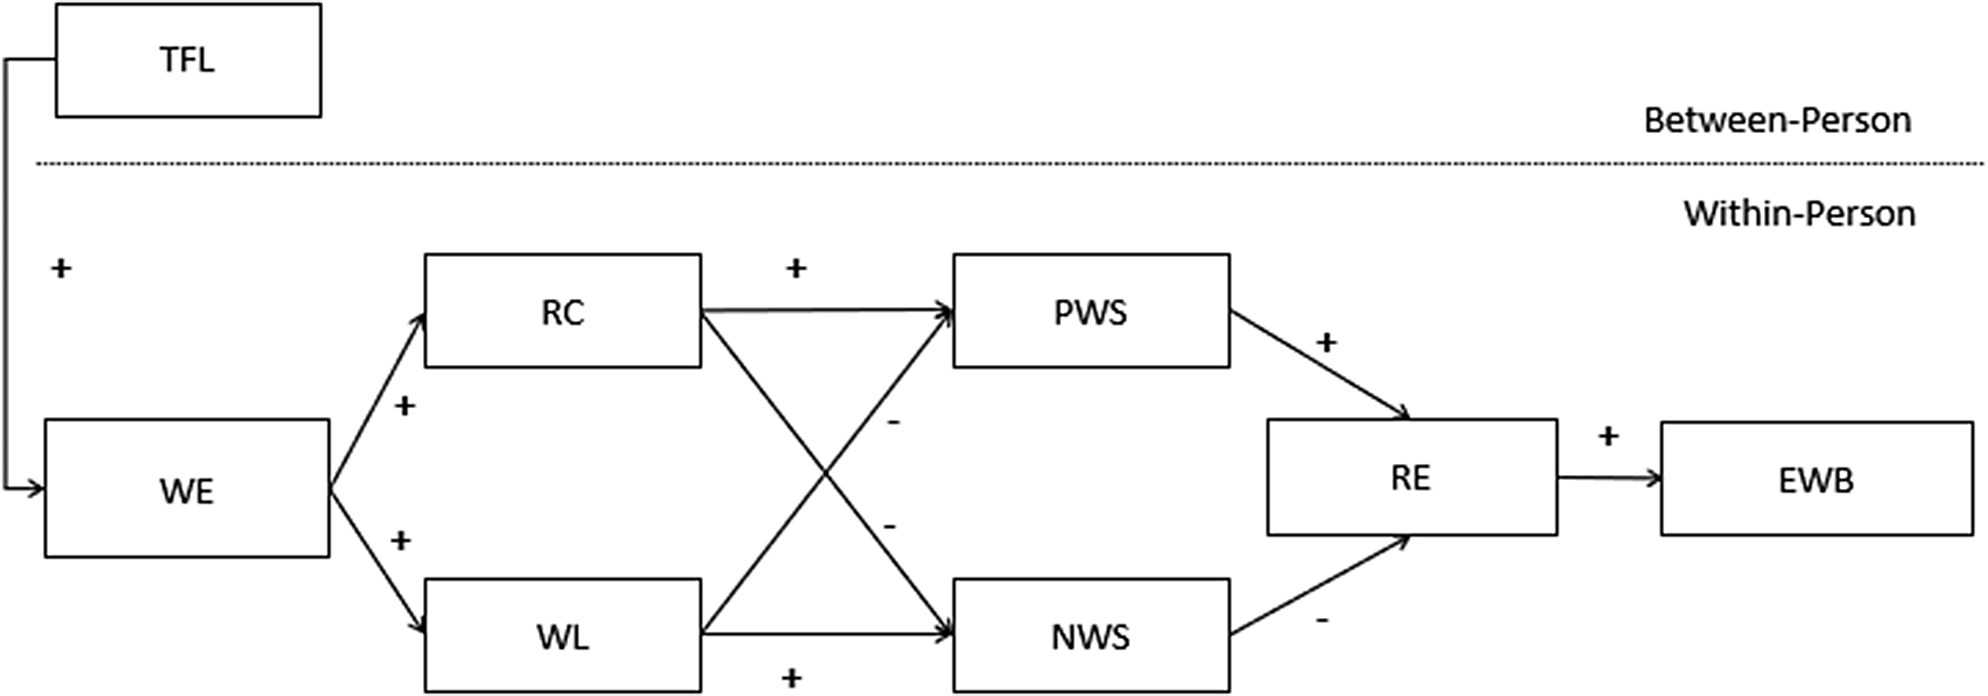
Figure 1 illustrates the hypothesized model.
Hypothesized Model.
Note. TFL = Transformational leadership; WE = Daily work engagement; RC = daily role clarity; WL = daily workload; PWS = daily positive work-nonwork spillover; NWS = daily negative work-nonwork spillover; RE = daily recovery; EWB = Daily employee wellbeing.
Method
Sample
This study was approved by the Institutional Review Board (IRB00003099). A quantitative interval-contingent daily diary study design (Ohly & Gochmann, Reference Ohly, Gochmann, Schyns, Hall and Neves2017) was used to capture within-person effects over time, which is suitable to assess leadership-follower outcome mechanisms (Kelemen et al., Reference Kelemen, Matthews and Breevaart2020). An initial sample of 108 full-time employees in Spain was recruited via informal and professional networks of master students at the University of Barcelona in April 2021. Additionally, participants were recruited via advertising the study on LinkedIn, using the snowball sampling method (Biernacki & Waldorf, Reference Biernacki and Waldorf1981). All questionnaires were implemented in and distributed through Qualtrics.
The announcement of the study including detailed information on study objective, data collection procedures, ethics, and data protection issues, along with an e-mail assuring confidentiality and voluntary participation, was sent to all partners. No incentives were offered to participants to reduce potential rise of arbitrary response options that would affect data quality (Gabriel et al., Reference Gabriel, Podsakoff, Beal, Scott, Sonnentag, Trougakos and Butts2019).
Data collection was administered in multiple phases. The invitation included an informed consent button that led participants to an initial baseline survey, which included sociodemographic variables as well as the measurement for transformational leadership. This baseline survey was filled in the week prior to day-level data collection. Informed consent was obtained from all individual participants included in the study.
Common diary study-related risks such as respondent fatigue, over disclosure and raised awareness of negative aspects (Bartlett & Milligan, Reference Bartlett and Milligan2015) were kept in mind when designing informed consent and the study methodology. For example, online survey completion of the daily measures took about five minutes not to compromise response rates and data quality and to mitigate the risk of respondent fatigue (Ohly & Gochmann, Reference Ohly, Gochmann, Schyns, Hall and Neves2017). The individual survey links were sent twice daily, in the morning at 9 am and at 7 pm from Monday to Friday over two consecutive workweeks. We chose a two-week period, which is consistent with Wheeler and Reis’s (Reference Wheeler and Reis1991) suggestion and recent recommendations (Gabriel et al., Reference Gabriel, Podsakoff, Beal, Scott, Sonnentag, Trougakos and Butts2019) that two weeks represent a generalizable sample of individuals’ lives. The links were configurated with an appropriate expiration date to ensure that only data entries at the same day are possible.
To ensure proximity to the individual’s actual experience, work-related experiences were asked in the evening survey after work, and non-work-related aspects were asked the following morning. By combining retrospective reconstructing methods (Kahneman et al., Reference Kahneman, Krueger, Schkade, Schwarz and Stone2004) with state investigations in the morning survey, we not only reduced participants burden to answer on another timepoint (e.g., before going to bed), but we also assured that the entire potential recovery experience timeframe can be evaluated by the individual. Previous diary studies asked about recovery processes at time points where these processes were supposed to be experienced (Blanco-Donoso et al., Reference Blanco-Donoso, Garrosa, Demerouti and Moreno-Jiménez2017), which not only does not capture the entire potential recovery timeframe but also risks impairing actual recovery experiences (Bolger & Laurenceau, Reference Bolger and Laurenceau2013).
Before analyzing the data, we excluded data from participants who completed less than 30%, i.e., three or less daily workday questionnaires (see Barnes et al., Reference Barnes, Lucianetti, Bhave and Christian2015, for a similar procedure). Our final sample consisted of N = 844 observations (Level 1) of N = 88 Spanish employees (Level 2) from a wide variety of occupations in the service sector, including, for instance, the IT sector, health sector, public administration, architecture, sales, and human resources. On average, these participants filled out M = 17.06 (Mdn = 18) of the 20 daily questionnaires, with a minimum of seven filled out daily questionnaires. This sample size is similar to that of conventional diary studies published in top-tier journals (Gabriel et al., Reference Gabriel, Podsakoff, Beal, Scott, Sonnentag, Trougakos and Butts2019). Most of the sample was female (75%), one person self-labelled as “other”. Average age was M = 31.7 years (SD = 8.9 years) and ranged between 21 and 61 years. 92% of the participants worked from home for at least some time, while the remaining 8% worked from the employer’s premises. As for parental and caring responsibilities, 13.6% had one dependent co-living child, 3.4% two dependent co-living children, and 5.7% self-defined as informal caregivers (i.e., people providing care at least on a weekly basis for older family members or people in their social network). 20.5% of the participants occupied managerial positions.
Measures
For most of the scales in use, validated versions in Spanish language already existed. To assess daily positive spillover and daily role clarity, we translated existing scales into Spanish following the guidelines of the International Test Commission (2017) for translating and adapting tests, including forward and backward translation procedures in duplicate. All scales of the daily measures were adapted to the temporal diary design of the study (e.g., “Today, …”).
General Questionnaire
Stable measures related to transformational leadership were introduced by the following statement, “Please indicate to what extent the following statements apply to your direct supervisor (the person to whom you report directly and who supervises your work on a regular basis).”
We measured transformational leadership, based on the full range leadership model (Bass, Reference Bass1985), using the Spanish version of the Human System Audit Short-Scale of transformational leadership which has shown to be unidimensional (Berger et al., Reference Berger, Yepes i Baldó, Gómez Benito, de Quijano de Arana and Brodbeck2011), since it is shorter than the Multifactor Leadership Questionnaire MLQ–5X–Short (Avolio & Bass, Reference Avolio and Bass2004) and an easy to apply instrument (Berger et al., Reference Berger, Yepes i Baldó, Gómez Benito, de Quijano de Arana and Brodbeck2011). The scale consists of eight items (e.g., “My leader promotes the use of intelligence as a means of overcoming obstacles”) that measure transformational leadership using a five-point Likert scale ranging from strongly agree (1) to strongly disagree (5). Previous research has provided empirical evidence for the construct validity of this measure (Berger et al., Reference Berger, Yepes i Baldó, Gómez Benito, de Quijano de Arana and Brodbeck2011, Reference Berger, Romeo, Guardia, Yepes and Soria2012) in diverse languages. Cronbach’s alpha was. 88.
As conceptualized before, the reason to operationalize transformational leadership as a stable trait-like measure is threefold: (a) The construct is originally conceptualized as a leadership style or profile variable that is stable within employees and therefore does not warrant a repeated measurement approach (Avolio & Bass, Reference Avolio and Bass2004), (b) existing literature posited leadership as a rather stable upper-level macro-variable that influences more volatile resources and demands (Bakker & De Vries, Reference Bakker and de Vries2021; ten Brummelhuis & Bakker, Reference ten Brummelhuis and Bakker2012), (c) we assume this perception will not change over the course of two workweeks since most employees do not interact with their supervisor on a daily basis (Breevaart & Zacher, Reference Breevaart and Zacher2019; Dolce et al., Reference Dolce, Vayre, Molino and Ghislieri2020; Kacmar et al., Reference Kacmar, Witt, Zivnuska and Gully2003; Lundqvist et al., Reference Lundqvist, Reineholm, Ståhl and Wallo2022; Wang et al., Reference Wang, Liu and Lee2021).
Daily Questionnaires
Participants could respond on a five-point Likert scale ranging from strongly agree (1) to strongly disagree (5). In the evening, daily workload was assessed by measuring three items for daily quantitative workload, based on the Spanish validated Psychosocial Factors Questionnaire 75 (PSF–75; Madrid et al., Reference Madrid, Vasquez and Patterson2020). An example item for workload is “Today, I had to do a lot of things at work”.
Daily role clarity was assessed with three items from Edwards et al. (Reference Edwards, Webster, van Laar and Easton2008) translated into Spanish. An example item is “Today, I knew how to go about getting my job done”.
Daily work engagement was measured using three items from the Spanish Version of the Utrecht Work Engagement Scale (UWES) by Schaufeli and Bakker (Reference Schaufeli and Bakker2003) to measure vigor, dedication, and absorption (Breevaart et al., Reference Breevaart, Bakker, Demerouti and Hetland2012; Schaufeli & Bakker, Reference Schaufeli, Bakker, Bakker and Leiter2010; Sonnentag, Reference Sonnentag2003; Xanthopoulou et al., Reference Xanthopoulou, Bakker, Demerouti and Schaufeli2009). An example item for vigor is “Today, I felt full of energy at my work”.
In the morning survey, participants were first asked to reflect on potential spillover processes and recovery process from the previous day. We used four items (one for each of the four recovery dimensions “psychological detachment”, “relaxation”, “mastery”, “control”) from the Spanish version of the state recovery scale (Bakker et al., Reference Bakker, Sanz-Vergel, Rodríguez-Muñoz and Oerlemans2015; Sanz-Vergel et al., Reference Sanz-Vergel, Sebastián, Rodríguez-Muñoz, Garrosa, Moreno-Jiménez and Sonnentag2010). One example item is “Yesterday, after my workday, I completely forgot about work.” (Psychological detachment).
We assessed positive affect spillover from work to nonwork by using and translating three items from the Multidimensional Scale of Perceived Work-Family Positive Spillover developed by Hanson et al. (Reference Hanson, Hammer and Colton2006). One example item is “Yesterday being happy at work improved my mood at home”.
We assessed negative spillover from work to nonwork by using three items from the Spanish validated version of the Survey Work/home Interaction Nijmegen (SWING; Geurts et al., Reference Geurts, Taris, Kompier, Dikkers, van Hooff and Kinnunen2005; Romeo et al., Reference Romeo, Berger, Yepes-Baldó and Ramos2014). One example item is “Yesterday, my work obligations made it difficult for me to feel relaxed at home”.
To assess momentary EWB (“Please indicate the option that best reflects how you feel now:”), we used three items for high-arousal positive affect (motivated, firm, enthusiastic) and three items for high-arousal negative affect (irritable, aggressive, nervous) from the Spanish validated version of PANAS by López-Gómez et al. (Reference López-Gómez, Hervás and Vázquez2015).
It is rational to adopt a dynamic daily perspective when researching the present processes of interest for two main reasons. Firstly, all daily variables are thought to fluctuate on a day-to-day basis. Affective concepts such as state work engagement, daily spillover and daily EWB, as well as daily recovery are highly dynamic concepts at the within-person level (Sonnentag et al., Reference Sonnentag, Cheng and Parker2022). Although the dynamic of role clarity has not been researched yet, extant diary studies have shown that not only personal, but also contextual demands such as role conflict and workload fluctuate considerably within individuals on a daily basis (Bakker & Xanthopoulou, Reference Bakker and Xanthopoulou2009; Breevaart & Bakker, Reference Breevaart and Bakker2018; Ouweneel et al., Reference Ouweneel, Le Blanc, Schaufeli and van Wijhe2012; Sonnentag, Reference Sonnentag2003).
Data Analysis
As described in the sample description subsection, and common for daily diary studies (Gabriel et al., Reference Gabriel, Podsakoff, Beal, Scott, Sonnentag, Trougakos and Butts2019), missingness (both monotonic and intermittent) is an issue in the current study. For that reason, using an imputation procedure for keeping the maximum information might be of practical utility. Amongst the different options to impute longitudinally, the so-called copy mean procedure was carried out given its proved efficiency over other alternatives (Genolini et al., Reference Genolini, Écochard and Jacqmin-Gadda2013). To illustrate this imputation routine, let’s suppose two individuals with missing observations in a three-wave design, Individual 1 missed to answer in Moment 2, whereas Individual 2 only answered at Occasions 1 and 2. The first case is an example of intermittent missing data, and the second example illustrates monotonic missing data type. Copy mean procedure carries out two types of data imputation techniques depending on the missingness kind (see Genolini et al., Reference Genolini, Alacoque, Sentenac and Arnaud2015, for further details). Specifically, when having intermittent missing data this procedure adds a variation in linear interpolated data ensuring thus that the average shape is kept in the imputed individual trajectory. Similarly, in the case of monotonic missing data, last occurrence carried forward procedure is slightly modified to keep average pattern in the individual trajectory.
Given the multilevel, nested structure of the data, we employed multilevel path analysis to test our hypotheses with the open-source packages lavaan in R (Rosseel, Reference Rosseel2012). Leadership was included as upper-level predictor at between-person level, daily variables and processes at within-person level. We applied a two-level random effects analysis with maximum likelihood estimator for estimating the different effects of the path model.
Results
Descriptives and Reliability
The descriptive statistics including minimum, maximum, global mean scores and standard deviations are shown in Table 1. As can be seen, on average, the sample showed relatively high average levels of personal energy and contextual resources, with TFL (M = 2.09); daily work engagement (WE), M = 2.32; daily role clarity (RC), M = 1.89; daily positive work-nonwork spillover (PWS), M = 2.48; daily recovery (RE), M = 2.26; and daily positive affect (PA), M = 2.39; compared to demands.
Descriptive Statistics of Study Variables (N = 844 Observations at Level 1; N = 88 Persons at Level 2)

Note. TFL = Transformational leadership; WE = Daily work engagement; RC = Daily role clarity; WL = Daily workload; PWS = Daily positive work-nonwork spillover; NWS = Daily negative work-nonwork spillover; RE = Daily recovery; PA = Daily positive affect; NA = Daily negative affect.
Table 2 and 3 show the correlations between study variables at between-person and within-person level respectively. Gender and age showed no significant correlations with any of the study variables. Accordingly, and not to over-complexify the model, we chose to not enter gender nor age as variables in our models.
Correlations at the Between-person Level of Study Variables (N = 844 Observations at Level 1; N = 88 Persons at Level 2)

Note. TFL = Transformational leadership; WE = Daily work engagement; RC = Daily role clarity; WL = Daily workload; PWS = Daily positive work-nonwork spillover; NWS = Daily negative work-nonwork spillover; RE = Daily recovery; PA = Daily positive affect; NA = Daily negative affect.
a = Point-biserial correlation.
** = Correlation is significant at the. 01 level (2-tailed). * = Correlation is significant at the. 05 level (2-tailed).
Correlations at the Within-person Level of Study Variables (N = 844 Observations at Level 1; N = 88 Persons at Level 2)

Note. TFL = Transformational leadership; WE = Daily work engagement; RC = Daily role clarity; WL = Daily workload; PWS = Daily positive work-nonwork spillover; NWS = Daily negative work-nonwork spillover; RE = Daily recovery; PA = Daily positive affect; NA = Daily negative affect.
** = Correlation is significant at the. 01 level (2-tailed). * = Correlation is significant at the. 05 level (2-tailed).
We conducted a series of multilevel confirmatory factor analyses with the lavaan package in R (Rosseel, Reference Rosseel2012) to discriminate the within-person variables to be included in the study (e.g., daily work engagement, daily role clarity, daily workload, daily positive work-nonwork spillover, daily negative work-nonwork spillover, daily recovery, daily employee wellbeing). Before testing the hypotheses, we examined the partitioning of variance in individual outcomes across levels. Moreover, we followed Bolger and Laurenceau (Reference Bolger and Laurenceau2013) and tested reliability by calculating the reliability measure RC and longitudinal intra-class coefficients (ICC) of the daily measures. RC assesses whether there are reliable within-person differences in change over time. For calculating the longitudinal ICC, the individual is the cluster in which multiple observations are grouped. It indicates the proportion of the total variance in the observed measures that is accounted for by the clustering. Based on these results, we can conclude that it is possible to reliably distinguish people in terms of their patterns of change over time (Bolger & Laurenceau, Reference Bolger and Laurenceau2013). As shown in Table 4, RC ranged between. 58–.86, and longitudinal ICC ranged between. 62–.84. These results indicate that there were significant between- and within-person effects for each of the dependent variables, rendering it appropriate to employ multilevel modeling (Bolger & Laurenceau, Reference Bolger and Laurenceau2013).
Reliability Indicators for Daily Variables (N = 844 Observations at Level 1; N = 88 Persons at Level 2)

TFL = Transformational leadership; WE = Daily work engagement; RC = Daily role clarity; WL = Daily workload; PWS = Daily positive work-nonwork spillover; NWS = Daily negative work-nonwork spillover; RE = Daily recovery; PA = Daily positive affect; NA = Daily negative affect.
Hypotheses Testing
Table 5 shows the results of the multilevel path modeling analyses including unstandardized coefficient estimates (b) with standard errors (SE), standardized coefficient estimates (β) and beta 95% confidence intervals for 10,000 bootstrap samples. Figure 2 illustrates the empirical multilevel path model.
Results of the Multilevel Path Modeling Analyses Including Unstandardized Coefficient Estimates (b) With Standard Errors (b_SE), Standardized Coefficient Estimates (beta) and beta 95% Confidence Intervals

Note. N = 844 daily observations nested within 88 persons; WE = Daily work engagement; RC = Daily role clarity; WL = Daily workload; PWS = Daily positive work-nonwork spillover; NWS = Daily negative work-nonwork spillover; RE = Daily recovery; PA = Daily positive affect; NA = Daily negative affect; indPA = Main effect of TFL on daily positive affect; indNA = Main effect of TFL on daily negative NA.
* p < .05. ** p < .01.
Results of Multilevel Path Modeling Analyses Predicting Employee well-being.
Note. N = 844 daily observations nested within 88 persons; WE = Daily work engagement; RC = Daily role clarity; WL = Daily workload; PWS = Daily positive work-nonwork spillover; NWS = Daily negative work-nonwork spillover; RE = Daily recovery; PA = Daily positive affect; NA = Daily negative affect.
* p < .05. ** p < .01.
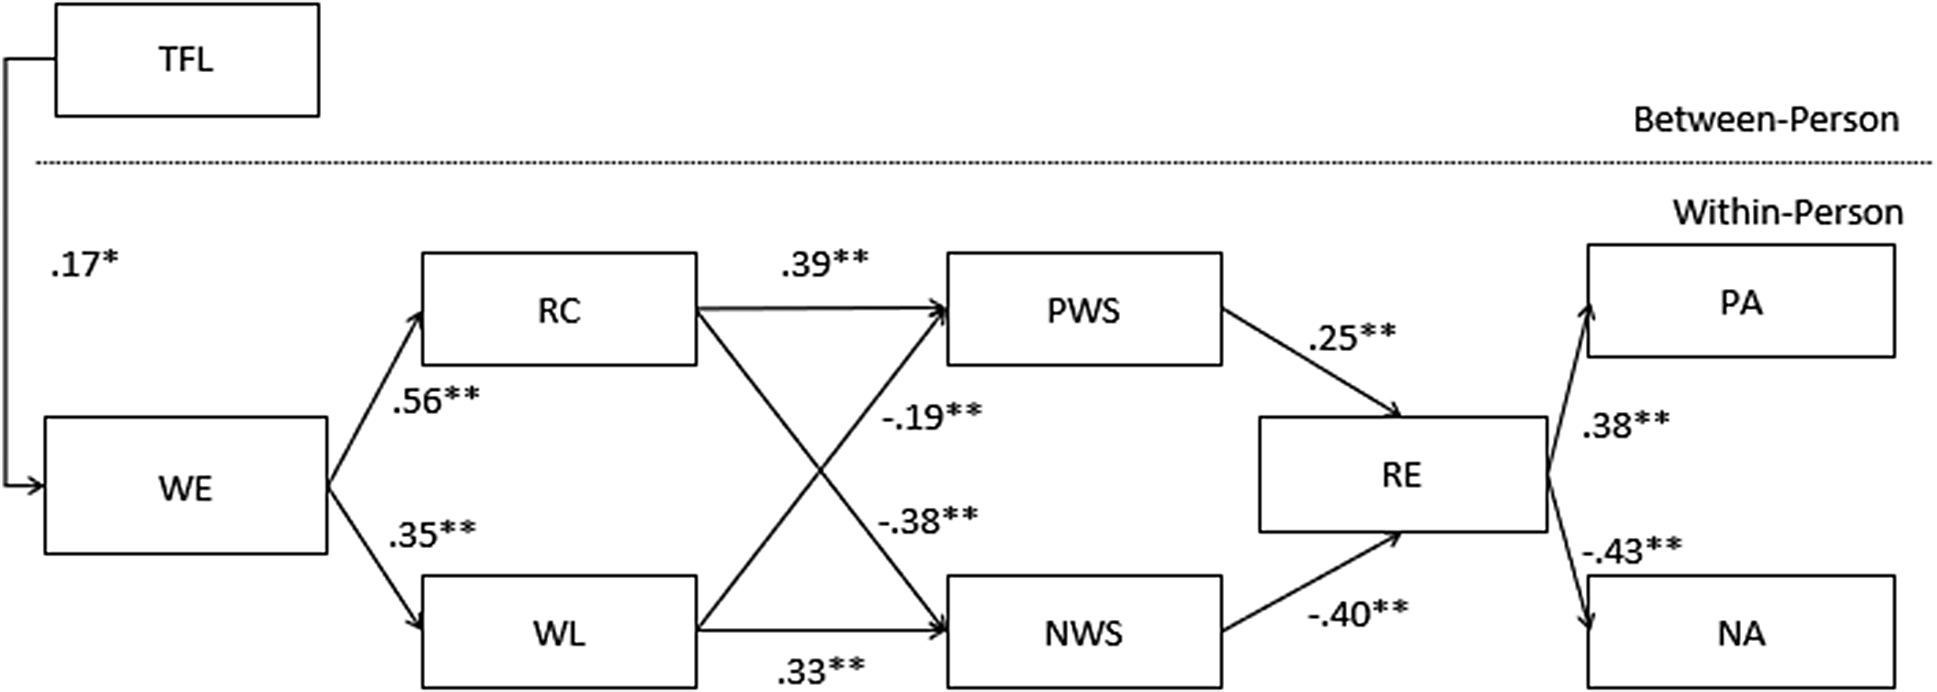
According to Hypotheses 1a and 1b, transformational leadership predicts a positive personal energy path via daily work engagement, which predicts daily role clarity, daily positive spillover, daily recovery, and ultimately daily EWB. As expected, transformational leadership increased daily work engagement, b = .17, p < .05, beta 95% CI [0.11., 0.20]. Daily work engagement predicted daily role clarity, b = .56, p < .01, beta 95% CI [0.27, 0.60]); daily role clarity predicted positive work-nonwork spillover, b = .39, p < .01, beta 95% CI [0.20, 0.61]; and daily negative work-nonwork spillover, b = –.38, p < .01, beta 95% CI [–0.43, –0.28]; daily positive work-nonwork spillover predicted daily recovery, b = .25, p < .01, beta 95% CI [0.19, 0.30]; daily negative work-nonwork spillover predicted daily recovery, b = –.40, p < .01, beta 95% CI [–0.41, –0.29]; and daily recovery predicted EWB, b = .38, p < .01, beta 95% CI [0.34, 0.44] for positive affect; b = –.43, p < .01, beta 95% CI [–0.47, –0.36] for negative affect. This suggests that transformational leaders increase the work engagement of their employees and that these, on a day-to-day basis, shape the perceptions of daily role clarity, which leads to positive affect spillover and increases daily recovery. These processes lead to increased positive affect and decreased negative affect the next morning (i.e., EWB). Thus, Hypotheses 1a and 1b were supported.
According to Hypotheses 2a and 2b, transformational leadership predicts a negative personal energy path via increased daily work engagement, increased daily workload, increased daily negative work-nonwork spillover, decreased daily recovery, and ultimately decreased EWB. Daily work engagement predicted daily workload, b = .35, p < .01, beta 95% CI [0.20, 0.61]; daily workload predicted negative work-nonwork spillover, b = .33, p < .01, beta 95% CI [0.30, 0.41]; and daily positive work-nonwork spillover, b = –.16, p < .01, beta 95% CI [–0.21, –0.11]. Thus, Hypotheses 2a and 2b were also supported.
The main effect between transformational leadership and EWB was not significant (p >. 05), thus hypothesis H 3 was supported. When splitting the model according to the two pathways into two separate models, we could detect both a significant main effect between transformational leadership and positive EWB (i.e., b = .004, p < .05, for positive affect), as well as between transformational leadership and negative EWB (i.e., b = –.002, p < .05).
Discussion
The main goal of the study was to show how the energizing effect of transformational leadership influences daily processes of balancing personal energy (state work engagement and subsequent off-job recovery), in both positive and negative ways. We hypothesized that transformational leadership mobilizes daily personal energy resource investments at work (i.e., state work engagement), which offset positive resource gain processes through self-initiated changes at work. These processes may result in clear and pleasurable work experiences on a day-to-day basis, which spill over to the nonwork domain and facilitate necessary recovery experiences. This pathway facilitates a balancing of personal energy resources and thus bolsters EWB. We also hypothesized that the energizing effect of transformational leadership (i.e., the transformational leadership-work engagement relationship) might offset negative resource loss processes through workload: Tackling higher daily workload might result in energy depletion and detrimentally influence the daily off-work recovery processes. This pathway might impede the necessary balancing of personal energy resources and thereby hamper EWB.
We tested these conjectures by using a two-week diary study with employees, so we could assess daily variations of EWB, personal and contextual resources at work, as well as spillover and recovery experiences. For both pathways, we found support in our analyses. Our results highlight substantial within-person variations of our variables (ICCs ranged between. 62 and. 84.), which could potentially be explained by the transformational leadership-work engagement relationship. Focusing on daily role clarity as a contextual resource that is highly relevant for current work contexts, it is worthy to highlight that, to our best knowledge, daily variations of role clarity have not been investigated yet, although our results show that these are substantial (ICC =. 75). This is in line with extant diary studies which have shown that not only personal, but also contextual resources such as role conflict fluctuate considerably within individuals daily (Bakker & Xanthopoulou, Reference Bakker and Xanthopoulou2009; Breevaart & Bakker, Reference Breevaart and Bakker2018; Ouweneel et al., Reference Ouweneel, Le Blanc, Schaufeli and van Wijhe2012; Sonnentag, Reference Sonnentag2003). In line with Sonnentag’ s study (2003), off-work recovery processes on the previous day influence daily EWB the next day.
Our results mostly align with previous research works. In line with established transformational leadership theory (Bass, Reference Bass1985), previous reviews (Decuypere & Schaufeli, Reference Decuypere and Schaufeli2021), and empirical findings (Breevaart & Bakker, Reference Breevaart and Bakker2018), transformational leadership as a contextual macro-resource predicted daily work engagement as a personal energy resource. This location of leadership at macro-level suggests that it might indeed be useful to consider leadership as a stand-alone factor in the JD-R-R model (Kinnunen et al., Reference Kinnunen, Feldt, Siltaloppi and Sonnentag2011), which shapes not only contextual but also personal resources and demands (Berger et al., Reference Berger, Czakert, Leuteritz and Leiva2019; Schaufeli, Reference Schaufeli2015). Thus, our results add to the existing assumptio7n that transformational leaders may be called “energizers” (Schippers & Hogenes, Reference Schippers and Hogenes2011, p. 194) and affect work engagement, when seen as a volatile personal energy resource, directly.
Extending this, in line with the assumption of dynamic relations between work engagement and job resources, and challenging job demands respectively (Bakker et al., Reference Bakker, Demerouti and Sanz-Vergel2023; Lesener et al., Reference Lesener, Gusy and Wolter2019; Xanthopoulou et al., Reference Xanthopoulou, Bakker, Demerouti and Schaufeli2009), our results show that daily work engagement affects both daily resources and daily challenging demands. Thus, partially supporting the idea of resource gain cycles (Bakker et al., Reference Bakker, Demerouti and Sanz-Vergel2023; Fredrickson, Reference Fredrickson2001) daily work engagement predicted daily role clarity. Regarding Hypotheses 1a and 1b, the findings regarding the daily role clarity-positive spillover-daily recovery relationship indicate that employees use their energy resources to engage in clarification measures of their role to make the workday more pleasurable. The pleasurable experience at work transmits to the nonwork domain and facilitates recovery processes after the workday, which affects EWB the next morning.
Yet, regarding Hypotheses 2a and 2b, and adding to the detrimental effects of challenging demands on recovery discussed in previous research (Bennett et al., Reference Bennett, Bakker and Field2018; Kelly & Moen, Reference Kelly and Moen2020a), we also show that the transformational leadership-daily work engagement relationship predicts high levels of daily workload, which result in increased negative work-nonwork spillover and decreased positive work-nonwork spillover, impaired daily recovery processes and thus impede a necessary balancing of personal energy resources. We therefore demonstrate that tackling high levels of daily workload, as opposed to moderate levels, rather represent hindrance instead of challenging demands (Podsakoff et al., Reference Podsakoff, Freiburger, Podsakoff and Rosen2023). This is in line with previous research that noted potential dark sides of the transformational leadership-work engagement relationship (e.g., Baethge et al., Reference Baethge, Junker and Rigotti2021; Di Stefano & Gaudino, Reference Di Stefano and Gaudiino2019). The results indicate that work engagement might indeed be related to working excessively (although not specifically measured with our measurement instruments) and thus, on a day-to-day basis, may be confounded with negative exploitative work-related behaviors related to workaholism (Di Stefano & Gaudino, Reference Di Stefano and Gaudiino2019). Noteworthy, the regression coefficient 95% CIs of the daily work engagement-daily workload relationship and the one between daily work engagement and daily role clarity are similar.
Like previous research (Moen et al., Reference Moen, Kelly, Fan, Lee, Almeida, Kossek and Buxton2016; Munir et al., Reference Munir, Nielsen, Garde, Albertsen and Carneiro2012), and regarding Hypothesis 3, we were unable to detect a main effect between transformational leadership and daily EWB when considering the two investigated pathways. The fact that splitting the integrative model into two separate models according to the hypothesized positive and negative pathways generated significant results for the relationship between transformational leadership and EWB indicates that the effect of one of the two pathways cannibalizes the effect of the other.
Here, extending the JD-R-R model, we positioned positive leadership as a potential contextual macro resource, but also demand, that affects volatile resources and demands and thereby employees’ daily recovery and EWB. Our findings regarding the role of spillover effects are in line with the propositions of ten Brummelhuis and Bakker (Reference ten Brummelhuis and Bakker2012), which posit that it is the personal energy resource, or lack thereof, that determines how work experiences affect recovery off-work. Our findings related to the work engagement-role clarity and work engagement-workload relationships are also partially consistent with the assumptions of reciprocity inherent to the job demands-resource model (Bakker et al., Reference Bakker, Demerouti and Sanz-Vergel2023; Lesener et al., Reference Lesener, Gusy and Wolter2019). Reciprocity means here that not only resources and demands predict work engagement, but also that work engagement predicts resources and demands vice versa. Notably, the present study only tested the latter set of relationships, and not bidirectional processes that may unfold over time. Moreover, our study adds insight to the link between state work engagement and challenging demands, as we show that this linkage might indeed overtax the personal energy system of the employees (Quinn et al., Reference Quinn, Spreitzer and Lam2012). Also, by showing how volatile personal resources are linked to volatile contextual resources and demands, we complement research that linked stable personal resources to resources and demands (Xanthopoulou et al., Reference Xanthopoulou, Bakker, Demerouti and Schaufeli2007).
We also bridge the gap between stress-related (i.e., demand-based) work nonwork and recovery research on the one hand and motivational-related (i.e., resource-based) transformational leadership research on the other hand. Notably, transformational leadership has been almost unanimously theorized as being beneficial for EWB, based on an overwhelming predominance of cross-sectional research (Arnold, Reference Arnold2017), or on evidence related to emotions expressed at work (Bono et al., Reference Bono, Foldes, Vinson and Muros2007). Even more, despite scarce empirical evidence, it was argued that leaders that provide necessary resources would facilitate employees’ recovery (Chan et al., Reference Chan, Howard, Eva and Tse2022). However, transformational leadership focuses in essence on leadership effectiveness (Inceoglu et al., 2018), and therefore rather on optimizing performance and psychological wellbeing indicators that are closely related to performance, such as work engagement. Yet, our findings suggest that transformational leaders might also induce excessive work-behaviors related to over-engagement and workaholism, which impair important daily recovery processes and thus hamper EWB over time. We therefore hope to spark a theoretical debate about the trade-offs of energizing leadership behaviors regarding employee’s recovery and EWB over time. Although we agree that work engagement is per definition not workaholism (Bakker et al., Reference Bakker, Schaufeli, Leiter and Taris2008), our energy-depleting pathway results indicate that the widely assessed work engagement scale (UWES) might indeed also measure elements of over-engagement related to workaholism, as it related to daily workload that negatively related to favorable spillover processes and undermined daily off-job recovery. Additionally, reflecting on our findings, we echo the recent theorizing that work engagement might not be the antithesis of burnout (Maslach & Leiter, Reference Maslach and Leiter2016), but propose that high levels of work engagement and related high-performance work behaviors may eventually turn into burnout through the overconsumption of personal energy (Bakker & De Vries, Reference Bakker and de Vries2021; Leon et al., Reference Leon, Halbesleben and Paustian-Underdahl2015). One explanatory factor of this shift might be the failed balancing and restoration of personal energy resources through recovery (Bennett et al., Reference Bennett, Bakker and Field2018; Sonnentag et al., Reference Sonnentag, Cheng and Parker2022).
Practically, our findings suggest that transformational leaders should be aware that a sole motivational focus on energizing individuals at work may impair EWB over time. Adequate energizing leader behaviors/communications that do not lead to over-engagement is key. While moderate workload may be considered a positive stressor that may lead to accomplishment and personal development, excessive workload is not (Podsakoff et al., Reference Podsakoff, Freiburger, Podsakoff and Rosen2023). Therefore, managing adequate workload and bearing in mind individual recovery processes, both during and off-work, on a day-to-day-basis is essential. The transformational leadership element of individual consideration should address individual needs of personal energy restoration. Providing daily role clarity through work (re-)design measures, complementary to the here investigated bottom-up approach of daily role clarity, may present a powerful resource to facilitate recovery processes. One final practical implication of this research could be human resource training and development interventions at both leader and employee level on how to balance personal energy resources and how to reduce negative spillover effects from work to nonwork. For example, leaders might learn about employee profiles that might be particularly prone to excessive work behaviors (Kossek et al., Reference Kossek, Ruderman, Braddy and Hannum2012; Parker et al., Reference Parker, Dawson, van den Broeck, Sonnentag and Neal2021) and how to engage in adequate energy-related role-modeling and communications, whereas employees may learn new ways to create transition rituals and to separate work and nonwork domains.
One key limitation of the present research is the sole reliance on self-reported data, which raises the risk of common method bias. However, our use of a quantitative daily diary design over the course of two subsequent working weeks does mitigate this issue (Beal, Reference Beal2015). Moreover, the person-centric approach and investigation of personal psychological energy constructs might justify the use of self-reports as the best possible data source (Bolger & Laurenceau, Reference Bolger and Laurenceau2013). In any case, future research might include data from leader-follower dyads and/or more objective data of workload, such as electronic automated data of working hours. Also, objective data of physical arousal measured by a heart rate monitor on a fit-bit or similar wearables might provide further insight into how personal energy spills over from work to the nonwork domain in form of prolonged activation (Baethge et al., Reference Baethge, Junker and Rigotti2021).
Another limitation might be our restricted sample. Nonetheless, our sample size at the between-person level is with N = 88 higher than expert recommendations on multilevel analyses and indicates robust data quality (Gabriel et al., Reference Gabriel, Podsakoff, Beal, Scott, Sonnentag, Trougakos and Butts2019). However, as the sample size was too small, we were unable to study potential differences between occupational sectors. Additionally, the sample was unbalanced with 75% of the participants being female, as opposed to 47.1% of women in the Spanish labor force (The World Bank, 2023). Future research should therefore replicate the findings with a more diverse sample size to ensure generalizability of the findings.
Another limitation concerns the large proportion of participants that worked in remote or hybrid work settings, which may affect their perception of transformational leadership. Even though almost all of the participants worked at least sometimes remotely from home (n = 92%), the sample size did not allow us to compare effects for different subsamples, or to narrow our research focus down to employees working from home exclusively. However, we assume that the perception of transformational leadership, and especially the studied relationships, are unlikely to change significantly regarding work localities. Indeed, recent research suggests that the role of leadership for EWB is not diminished by physical distance through remote work settings (Dolce et al., Reference Dolce, Vayre, Molino and Ghislieri2020; Lundqvist et al., Reference Lundqvist, Reineholm, Ståhl and Wallo2022). Even more so, the result of a recent cross-sectional study suggests that the absence of leadership might be particularly harmful in remote work conditions (e.g., Wang et al., Reference Wang, Liu and Lee2021). This indicates that the role of leadership for EWB is unlikely to diminish in the future working world, characterized by more flexible work arrangements (Sonnentag et al., Reference Sonnentag, Cheng and Parker2022). Despite this, our conceptualization of leadership as a rather stable contextual macro-factor did not take into account the potential variations of leadership behaviors over time, so that daily changes or inconsistencies of such behaviors were not considered in the present study. Yet, as discussed further above, research found that daily interactions with direct supervisors are rare across a variety of occupations (Breevaart & Zacher, Reference Breevaart and Zacher2019). Moreover, a bigger sample size would have enabled more complex analyses, including potential moderating functions between work stress and recovery processes, which we were unable to conduct with the present data. For example, existing human resource practices or key personal resources such as emotional intelligence might moderate the relationship between high workload and negative spillover (Bakker & De Vries, Reference Bakker and de Vries2021; Bakker et al., Reference Bakker, Demerouti and Sanz-Vergel2023). Additionally, employee characteristics such as, e.g., high promotion focus, high intrinsic motivation, and high need for leadership, as well as organizational context such as high uncertainty might accentuate the transformational leadership-state work engagement relationship (Decuypere & Schaufeli, Reference Decuypere and Schaufeli2021).
Regarding the relationship between state work engagement and daily role clarity, we may have inferred proactive measures undertaken by the employees to justify this process (Sonnentag, Reference Sonnentag2003). However, our operationalization measures did not explicitly take this into account. Future research should therefore measure such job crafting techniques for daily role clarity explicitly.
Regarding the relationship between work-nonwork spillover and recovery, also reverse or moderating processes may be possible that we did not test. Specifically, recovery can also be seen as antecedent to work-life conflict or enrichment when the latter are seen as outcomes rather than daily spillover processes (Demerouti et al., Reference Demerouti, Bakker, Geurts, Taris, Sonnentag, Perrewé and Ganster2009). For instance, people that lack off-job recovery experiences over time may likely face difficulties in managing work and nonwork roles (Demerouti et al., Reference Demerouti, Bakker, Geurts, Taris, Sonnentag, Perrewé and Ganster2009). Moreover, Moreno-Jiménez et al. (Reference Moreno-Jiménez, Mayo, Sanz-Vergel, Geurts, Rodríguez-Muñoz and Garrosa2009) showed how recovery moderates the effect of work-nonwork conflict on EWB. Consequently, it can be assumed that the relationship between work-nonwork spillover and recovery is more complex than modeled in the present study (Demerouti et al., Reference Demerouti, Bakker, Sanz-Vergel, Major and Burke2013). Nonetheless, we argue that the idea of daily positive and negative work-nonwork spillover temporally preceding recovery experiences is in line with previous research and fits the here adopted short-term perspective (Demerouti et al., Reference Demerouti, Bakker, Geurts, Taris, Sonnentag, Perrewé and Ganster2009; Geurts et al., Reference Geurts, Taris, Kompier, Dikkers, van Hooff and Kinnunen2005; ten Brummelhuis & Bakker, Reference ten Brummelhuis and Bakker2012).
Ultimately, our measure of EWB only included high arousal positive and negative well-being items. Although we argue that these items refer to high positive and high negative energetic activation and therefore describe EWB facets highly relevant for occupational behavior (Sonnentag et al., Reference Sonnentag, Tay and Nesher Shoshan2023; Warr, Reference Warr1990), we acknowledge that for a more comprehensive picture of EWB, future research should also include low arousal positive and negative items to investigate potential differential effects of recovery on EWB (Bennett et al., Reference Bennett, Bakker and Field2018; Sonnentag, Reference Sonnentag2003). For example, the most immediate links from recovery to EWB might address vigor-related well-being items and its opposite, i.e., exhaustion-related well-being items (Bennett et al., Reference Bennett, Bakker and Field2018). Yet, regarding the latter, we linked recovery to anxiety-related well-being items to show that recovery not only predicts vigor or exhaustion, but also high arousal negative EWB.
This study showed that the energizing effect of transformational leadership leads to both favorable and unfavorable pathways for off-work recovery processes on a day-to-day basis. Favorably, employees might mobilize their personal energy resources to increase role clarity, which leads to pleasant workday experiences that facilitate positive spillover and off-work recovery processes. Unfavorably, employees might tackle higher workloads on days they feel energized, leading to negative spillover and impaired off-work recovery processes. Off-work recovery processes on the previous day influence daily EWB the next day. In summary, these dark sides of the energizing transformational leadership influence require leader behaviors that focus on the adequate balancing of daily personal energy resource investment at work.
Authorship credit
Jan Philipp Czakert: Conceptualization, methodology, writing- original draft preparation, writing - review & editing, formal analysis. David Leiva: Data curation, software, formal analysis, validation. Rita Gisela Berger: Supervision, conceptualization, writing- reviewing and editing.
Data sharing
The datasets generated during and/or analyzed during the current study are available from the corresponding author upon reasonable request.
Funding statement
This research received no specific grant from any funding agency, commercial or not-for-profit sectors.
Competing of Interest
None.


 Open access