


Nomenclature
- $A$
$A$
-
function defined by Eq. 18
-
$b$
-
parameter in time complexity model
-
$B$
-
function defined by Eq. 8
-
${C_P}$
-
pressure coefficient
-
${C_{{p_{max}}}}$
-
post-normal shock stagnation pressure coefficient
-
${C_D}$
-
drag coefficient
-
$d$
-
Base diameter of body
-
$D$
-
function defined by Eqs. 20 and 19
-
$FR$
-
fineness ratio,
$FR = l/d$
-
$K$
-
traditional hypersonic similarity parameter,
$K = \theta {M_\infty }$
-
${K_{VD}}$
-
Van Dyke modified hypersonic similarity parameter,
${K_{VD}} = \theta \sqrt {M_\infty ^2 - 1} $
-
${K_{DJ}}$
-
DeJarnette modified hypersonic similarity parameter,
${K_{DJ}} = \sqrt {M_\infty ^2 - 1} {\rm{sin}}{\theta _c}$
-
${K_{FR}}$
-
hypersonic similarity parameter based of fineness ratio,
${K_{FR}} = {M_\infty }/FR$
-
$L$
-
characteristic length of body
-
$l$
-
length of body
-
$m$
-
parameter in time complexity model
-
$M$
-
Mach number
-
${M_m}$
-
matching point Mach number defined by Eq. 21
-
$n$
-
number of elements in mesh
-
${p_i}$
-
static pressure at station/region ‘
$i$
’ -
$r$
-
radius of revolution
-
$R$
-
radius of curvature
-
$Re$
-
Reynolds number
-
$s$
-
coordinates along a streamline
-
${v_{max}}$
-
theoretical velocity achievable under fixed reservoir conditions
-
${v_r}$
-
radial component of velocity in a conical flow
-
$z$
-
longitudinal body coordinates
- FAAT
-
Fast Aerodynamics Analysis Tool
- FOSE
-
First-Order Shock-Expansion method
- HEAT-3D
-
Hypersonic Engineering model for rapid AeroThermal analysis of 3D bodies
- MNT
-
modified Newtonian theory
- NT
-
Newtonian theory
- ODE
-
ordinary differential equation
- ROM
-
reduced-order model
- (S)-HABP
-
(Supersonic)-Hypersonic Arbitrary Body Programme
- SOSE
-
Second-Order Shock-Expansion method
- TC
-
tangent-cone method
- TW
-
tangent-wedge method
- UT
-
Van Dyke unified theory


Greek Symbol
-
$\alpha$
-
Angle-of-attack or geometrical angle used to parameterise hyperplane geometry
-
$\gamma $
-
ratio of specific heats; equal to
$1.4$
, unless stated otherwise -
$\delta $
-
flow inclination angle
-
$\eta $
-
function defined by Eq. 6
-
$\theta $
-
local inclination angle relative to freestream velocity, or independent variable in the Taylor-Maccoll equation.
-
$\lambda $
-
function defined by Eq. 9
-
$\mu $
-
Mach angle,
$\mu = {\rm{si}}{{\rm{n}}^{ - 1}}\left( {\frac{1}{M}} \right)$
-
${\rm{\Omega }}$
-
function defined by Eq. 10


Subscripts
-
${{}_\infty }$
-
freestream conditions
-
${{}_c}$
-
quantities evaluated at surface of a cone
-
${{}_N}$
-
nose
-
${{}_{max}}$
-
maximum wedge or cone angle to sustain attached shocks
-
${{}_{cp}}$
-
centre of pressure
-
${{}_m}$
-
matching point


1.0 Introduction
Future hypersonic and supersonic aerospace missions aim to revolutionise global transportation and space exploration, enabling rapid intercontinental travel, novel satellite deployment and scientific exploration. While engineers rely on wind tunnel data and computational fluid dynamics (CFD) simulations for high-speed vehicle design, the computational expense of high-fidelity CFD remains a challenge for design optimisation and rapid aerothermal predictions. Institutions are exploring unconventional shapes through computational campaigns, which pose challenges for traditional numerical methods due to demanding the repeated solution of the fluid equations. To address this, substituting full-order CFD simulations with reduced-order models (ROMs) emerges as a promising solution. ROMs capture high-level flow physics efficiently, simplifying analysis and allowing engineers to rapidly explore a broader range of design concepts. Leveraging the computational speed and accuracy of ROMs, researchers can accelerate vehicle performance investigations and aerothermal predictions across the flight envelope, potentially revolutionising hypersonic and supersonic aerospace systems and missions and conducting rapid innovation in global transportation and space exploration.
Following the conclusion of the Apollo-Soyuz programme, the development of innovative space transportation designs became the main focus of NASA’s human spaceflight programme, necessitating complex simulations and wind tunnel testing. Recognising the need for rapid simulation tools, the McDonnell Douglas Corporation developed a programme capable of rapidly analysing hypersonic bodies known as the Hypersonic Arbitrary-Body Programme (HABP) [Reference Gentry, Smyth and Oliver7], later upgraded to enhance its supersonic application capabilities (S-HABP). The aerodynamic subroutines formed the programme’s core, addressing various aspects of multidisciplinary vehicle analysis, encompassing streamline, inviscid and viscous pressure and heating calculations. The programme’s distinctive advantage lies in its comprehensive suite of aerodynamic tools, offering the means to examine diverse aerothermal aspects of hypersonic design problems. However, the HABP’s effectiveness depended on user expertise in high-speed aerodynamics and their interpretation of how to apply the programme to a given situation. The programme requires segmenting the airframe into distinct regions expected to experience different aerodynamic phenomena, demanding an astute selection of methods. This intricate user-dependent nature raises questions about the programme’s modern applicability.
Though advancements are being made in developing algorithms for the autonomous selection of adequate aerodynamic methods, an early milestone emerged in 2017 through Lobbia’s Fast Aerodynamics Analysis Tool (FAAT) software [Reference Lobbia13]. FAAT computes the pressure distribution across a body’s surface by applying inviscid flow techniques along surface streamlines and interpolating between them. A substantial feature of FAAT lies in its automatic method selection based on streamline inclination. This smoothly accommodates abrupt changes in element inclination, mitigating the limitations of various ROMs. Similarly, it establishes a separate threshold for convex turns, setting aerodynamic properties equal to freestream conditions if the limit is exceeded. However, unlike HABP, FAAT is confined to three aerothermal methods: tangent-cone, shock-expansion and modified Newtonian theory. Furthermore, it assumes perfect gases and isentropic flows to compute thermodynamic flow properties on the vehicle surface, limiting the analysis of blunt bodies.
The Department of Aeronautics at Imperial College London has undertaken extensive research on deployable aerodecelerators, resulting in the development of the Hypersonic Engineering model for rapid AeroThermal analysis of 3D bodies (HEAT-3D) [Reference Gramola, Bruce and Santer8]. HEAT-3D was tailored for Imperial College’s aeroshell concept, HATHOR [Reference Gramola, Bruce and Santer9], aiding its design and optimisation. Although initially crafted for parametrised aeroshells like nose-cone aeroshells in re-entry vehicles, HEAT-3D’s scope is being expanded. Nonetheless, HEAT-3D does have limitations. One major limitation is that it is designed exclusively for parameterisable aeroshells, hindering its application to arbitrary geometries. Furthermore, it only supports the modified Newtonian method for analysis, which yields simplified thermodynamic analysis that affects the accuracy of boundary layer edge properties and thermal calculations. However, the tool possesses several desirable capabilities that enable it to capture low-level flow phenomena, such as boundary layer growth, entropy layer swallowing, and non-adiabatic wall simulations, improving thermal calculations.
The HABP, HEAT-3D and FAAT algorithms have practically implemented ROM-based aerothermal analysis of hypersonic bodies on aerothermodynamics programmes. However, little importance has been placed on investigating the range of applicability and limitations of the aerothermal ROMs supplied, requiring the user to have this knowledge. Although supersonic and hypersonic aerodynamics share common physics, distinct ROMs are often limited to specific flow regimes, with their accuracy limits not widely understood. Computational assessments of these widely used ROMs are also absent in existing literature. Therefore, this study aims to comprehensively investigate and assess promising supersonic and hypersonic ROMs, defining their range of applicability, limitations and computational complexities.
This paper is organised as follows. A brief review of the considered ROMs and their known performance is presented in Section 2. The validation of the subroutines and overall algorithm implementation of the most intricate ROM considered is presented in Section 3. In Section 4, results from a thorough aerodynamic analysis across various geometries over a wide range of Mach numbers, including flat plates, sharp cones and authentic vehicle designs is presented. Computational complexity is explored in Section 5, considering mesh convergence, time complexity and direct comparison with CFD simulations. Finally, Section 6 summarises the novel findings and contribution of the paper.
2.0 Review of reduced-order methodologies
This study focuses on surface inclination methods, the most basic family of high-speed ROMs. These methods are based on a steady-state finite element analysis, where the surface is discretised into panels, or the consequent surface streamlines are computed and discretised into finite elements. The only quantities required to compute the flow properties are the freestream conditions and the inclination angle of the element or the change in flow deflection angle from one element to the following. These methods are associated with quick execution times while maintaining reasonable accuracy. However, due to their simplicity, they lack generalisability and become ineffective if the limitations of the ROM are not well known. On the other hand, the generalisability of these simplistic methods can be enhanced by considering exact and numerical relations, like the oblique shock or Prandtl-Meyer relations. When considering this family of ROMs, the orientation of the surface element must be considered, as methods are undefined in specific regions. Regions of the surface that see the incident flow directly are labelled as impact regions. In contrast, regions shielded or surrounded by other elements are known as shadow regions.
A brief review of the considered ROMs is discussed in the following pages.
2.1 Newtonian theory
This method only requires the local inclination of the surface to approximate the pressure coefficient ( ${C_P}$
). This methodology is known as Newtonian theory (NT), or Newton’s sine-squared law, represented by Equation (1). The derivation of this equation are provided by Anderson [Reference Anderson1]. This technique is only valid to determine
${C_P}$
). This methodology is known as Newtonian theory (NT), or Newton’s sine-squared law, represented by Equation (1). The derivation of this equation are provided by Anderson [Reference Anderson1]. This technique is only valid to determine ${C_P}$
over impact regions and suggests a
${C_P}$
over impact regions and suggests a ${C_P}$
of zero for shadow regions.
${C_P}$
of zero for shadow regions.
 \begin{align}{C_P} = \frac{2}{{\gamma M_\infty ^2}}\left( {\frac{{{p_1}}}{{{p_\infty }}} - 1} \right) = 2{\rm{si}}{{\rm{n}}^2}\left( \theta \right)\end{align}
where $\gamma $
is the ratio of specific heats,
$\gamma $
is the ratio of specific heats, ${M_\infty }$
is the freestream Mach number,
${M_\infty }$
is the freestream Mach number, ${p_1}$
and
${p_1}$
and ${p_\infty }$
are the static pressures at the surface of the element and at freestream, respectively, and
${p_\infty }$
are the static pressures at the surface of the element and at freestream, respectively, and $\theta $
is the inclination of the element being considered.
$\theta $
is the inclination of the element being considered.
The simplicity of this technique is appealing for rapid and seamless prediction of ${C_P}$
, as a single computation is required to determine the pressure coefficient of an element. However, the simplicity of this method is not always beneficial as it lacks dependencies on Mach number
${C_P}$
, as a single computation is required to determine the pressure coefficient of an element. However, the simplicity of this method is not always beneficial as it lacks dependencies on Mach number $\left( M \right)$
and gas properties.
$\left( M \right)$
and gas properties.
2.2 Modified newtonian theory
Newton’s sine-squared law assumes that the shock wave coincides with the body’s surface, a phenomenon seen at extreme Mach numbers and incidence angles. Broadly speaking, if a detached shock occurs, the assumptions behind NT are no longer valid and lead to overestimations of ${C_P}$
. A minor adjustment can be applied to Equation (1), where the coefficient is scaled to introduce the pressure loss associated with a bow shock. This improvement is known as modified Newtonian theory (MNT) and is commonly used to model blunt bodies and noses. In the MNT, the pressure coefficient is written as
${C_P}$
. A minor adjustment can be applied to Equation (1), where the coefficient is scaled to introduce the pressure loss associated with a bow shock. This improvement is known as modified Newtonian theory (MNT) and is commonly used to model blunt bodies and noses. In the MNT, the pressure coefficient is written as
 \begin{align}{C_p} = {C_{{p_{max}}}}{\rm{si}}{{\rm{n}}^2}\theta \end{align}
with
 \begin{align}{C_{{p_{max}}}} = \frac{2}{{\gamma M_\infty ^2}}\left[ {{{\left\{ {\frac{{{{(\gamma + 1)}^2}M_\infty ^2}}{{4\gamma M_\infty ^2 - 2\left( {\gamma - 1} \right)}}} \right\}}^{\gamma /\left( {\gamma - 1} \right)}}\left\{ {\frac{{1 - \gamma + 2\gamma M_\infty ^2}}{{\gamma + 1}}} \right\} - 1} \right]\end{align}
where all symbols have their usual meaning, and ${C_{P,max}}$
, corresponds to the stagnation pressure coefficient behind a normal shock wave, which approximates the shock structure immediately ahead of the stagnation point, where
${C_{P,max}}$
, corresponds to the stagnation pressure coefficient behind a normal shock wave, which approximates the shock structure immediately ahead of the stagnation point, where $\theta = {90^ \circ }$
.
$\theta = {90^ \circ }$
.
This modification introduced $M$
and
$M$
and $\gamma $
dependencies, broadening its applicability range. Note that as
$\gamma $
dependencies, broadening its applicability range. Note that as $M \to \infty $
and
$M \to \infty $
and $\gamma \to 1$
, Eq. 2 collapses to Eq. 1, Newton’s Sine-squared law. However, this method still fails to appropriately approximate
$\gamma \to 1$
, Eq. 2 collapses to Eq. 1, Newton’s Sine-squared law. However, this method still fails to appropriately approximate ${C_P}$
over shadow regions, as it is still set to zero and in low inclination regions, where an attached shock is expected.
${C_P}$
over shadow regions, as it is still set to zero and in low inclination regions, where an attached shock is expected.
2.3 Van-Dyke unified theory
This method was based on the hypersonic small disturbance theory by Van Dyke [Reference Sreekanth18], also known as the linearised method. Van Dyke’s unified theory (UT) is formulated as a function of a modified hypersonic similarity parameter $\left( {{K_{VD}}} \right)$
, no longer equal to the product of
$\left( {{K_{VD}}} \right)$
, no longer equal to the product of ${M_\infty }$
and
${M_\infty }$
and $\theta $
. The UT method is based on linearising oblique shock relations and the Prandtl-Meyer function. Equation (3) is the product of the linearisation of the oblique shock relations, providing the pressure coefficient over an impact surface element.
$\theta $
. The UT method is based on linearising oblique shock relations and the Prandtl-Meyer function. Equation (3) is the product of the linearisation of the oblique shock relations, providing the pressure coefficient over an impact surface element.
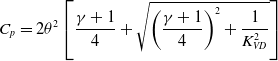 \begin{align}{C_p} = 2{\theta ^2}\left[ {\frac{{\gamma + 1}}{4} + \sqrt {{{\left( {\frac{{\gamma + 1}}{4}} \right)}^2} + \frac{1}{{K_{VD}^2}}} } \right]\end{align}
where ${K_{VD}} = \theta \sqrt {{M^2} - 1} $
. A similar linearisation can be applied to the Prandtl-Meyer function to approximate
${K_{VD}} = \theta \sqrt {{M^2} - 1} $
. A similar linearisation can be applied to the Prandtl-Meyer function to approximate ${C_P}$
over expansion surfaces, resulting in Equation (4)
${C_P}$
over expansion surfaces, resulting in Equation (4)
 \begin{align}{C_p} = \frac{{2{\theta ^2}}}{{\gamma K_{VD}^2}}\left[ {{{\left( {1 - \frac{{\gamma - 1}}{2}{K_{VD}}} \right)}^{\frac{{2\gamma }}{{\gamma - 1}}}} - 1} \right]\end{align}
where all symbols have their usual meaning. This paper only includes the pertinent equations required to apply the methodology. Shapiro [Reference Shapiro16] gives the derivations of the equations above. In contrast to NT and MNT, this methodology is able to determine ${C_P}$
in shadow regions. However, the applicability range of UT is not widely known, with literature commonly suggesting a use restricted to applications where
${C_P}$
in shadow regions. However, the applicability range of UT is not widely known, with literature commonly suggesting a use restricted to applications where ${K_{VD}}$
is small.
${K_{VD}}$
is small.
2.4 Tangent-cone and tangent-wedge methods
The tangent-cone and tangent-wedge methods are engineering-level approaches for analysing high-speed systems. Unlike previous theoretical approaches based on simplified flow physics, these methods aim to approximate complex physics using well-established principles.
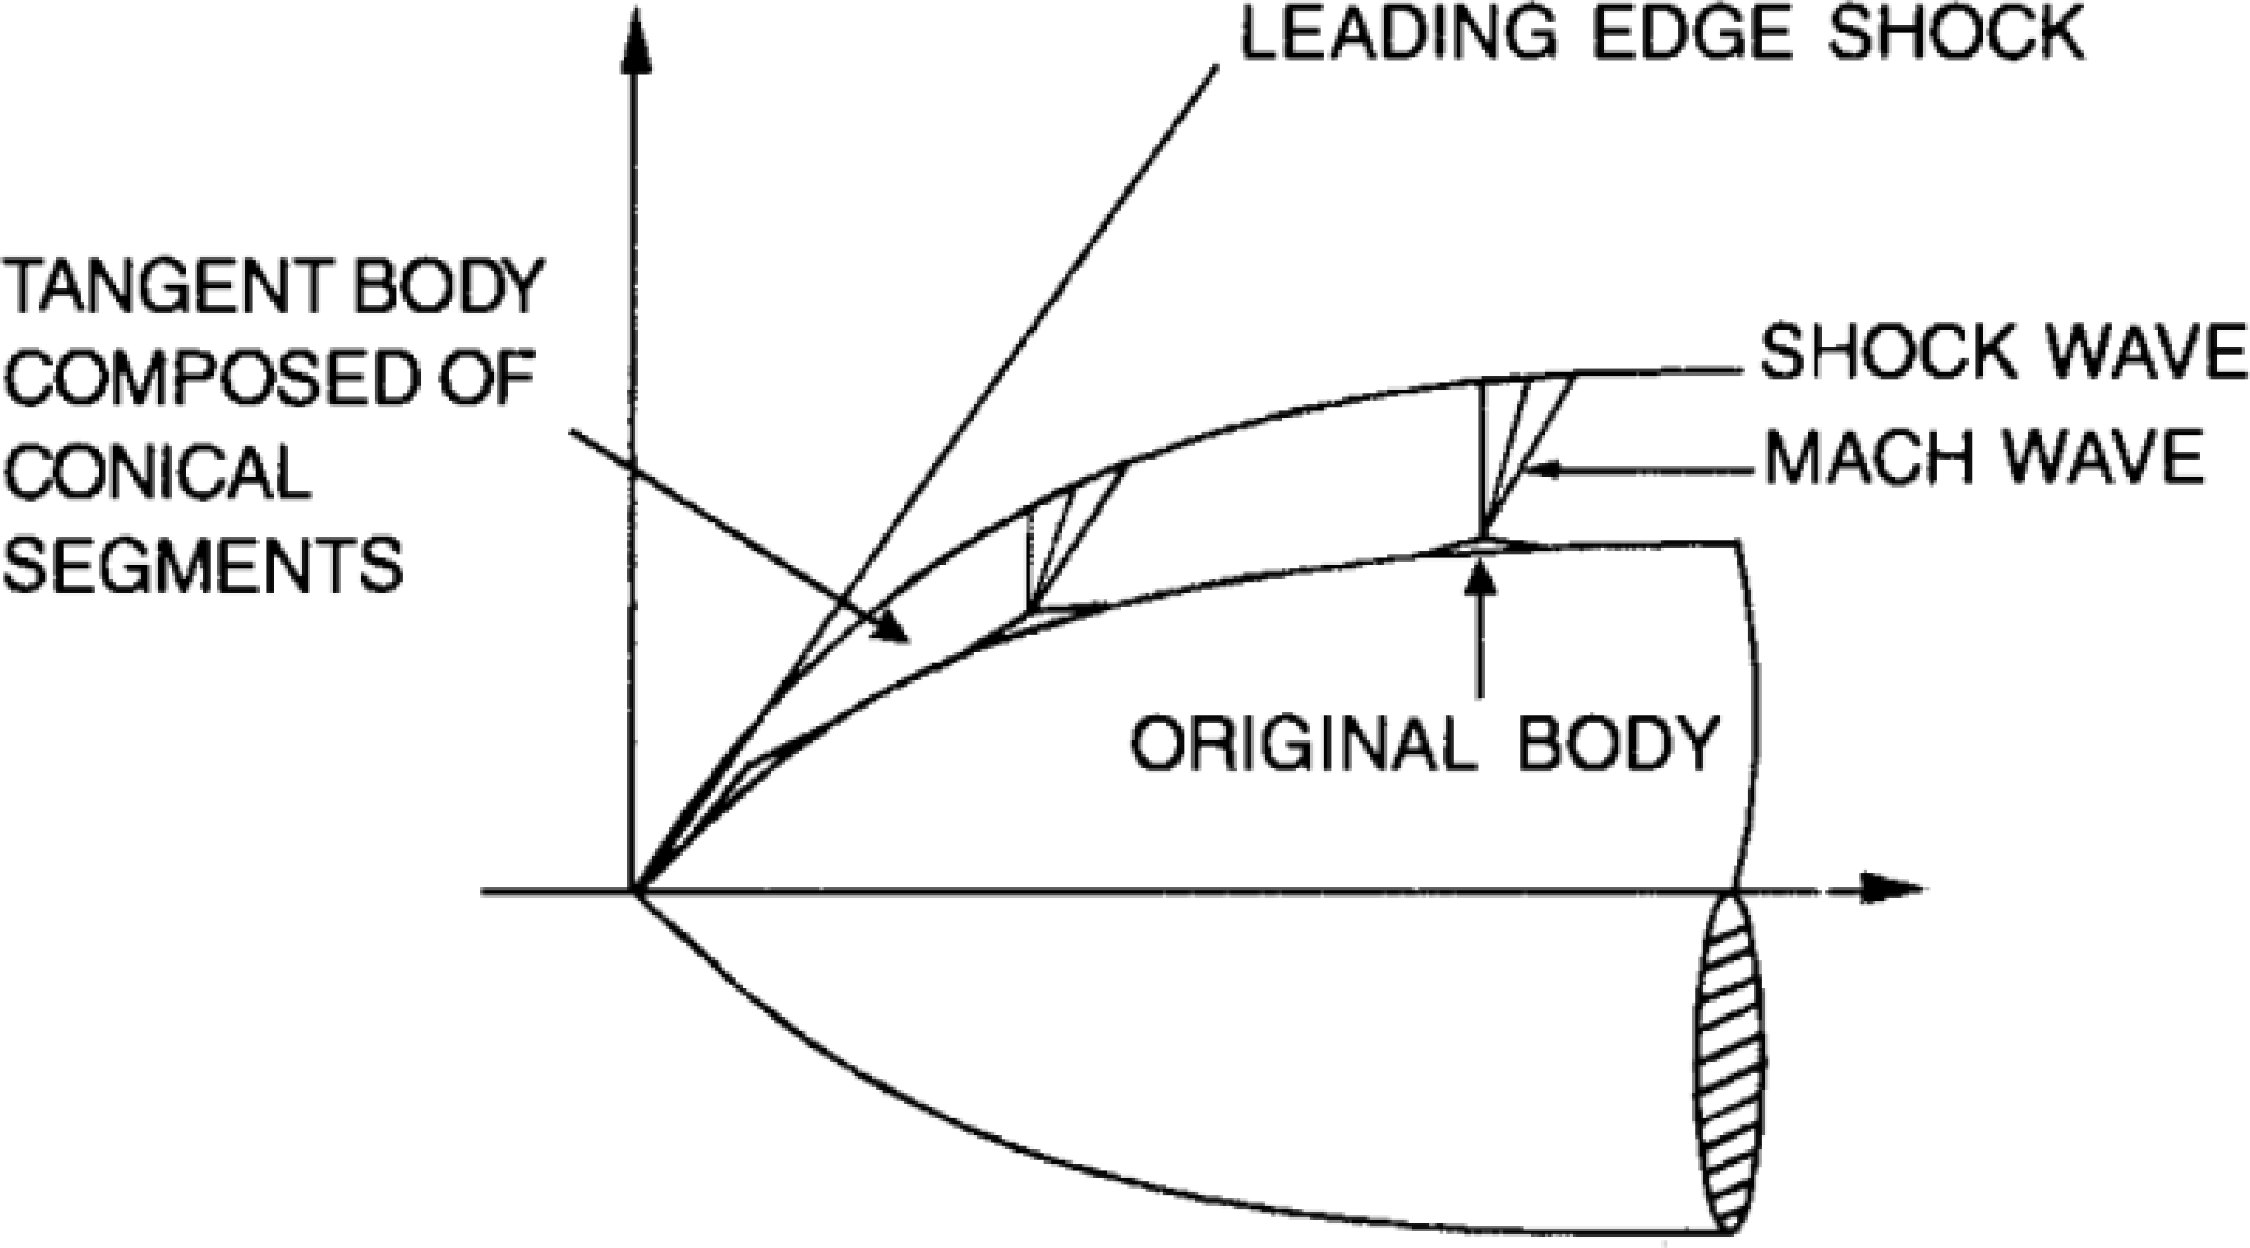
The methodologies involve approximating arbitrary geometries as a series of osculating frustums or wedges. The flow physics experienced at a given station can be approximated as the flow over a cone or a wedge, with the semi-vertex angle of the cone or wedge corresponding to the local inclination of the segment. Pressure and flow properties at the station of interest are determined using the Taylor-Maccoll equation for frustums and the oblique shock relations for wedges. The geometry resulting from using frustums and wedges to approximate three-dimensional and two-dimensional bodies is known as tangent-body approximations and is illustrated by Fig. 1.
Schematic representation of tangent-body approximations.

In addition to their aerodynamic characteristics, these approaches leverage oblique shock relations and the Taylor-Maccoll equation to develop equations for predicting thermodynamic flow properties. These equations facilitate the prediction of changes in flow properties such as density, temperature and entropy, a capability that was lacking in prior methodologies. However, these methods are limited to impact regions, as cones and wedges cannot have a negative angle, forcing zero ${C_P}$
in shadow regions. A common improvement to these methods involves applying the Prandtl-Meyer relations to compute property variations over a convex corner. This improvement relies on knowing the properties of the previous element, which may not be feasible if an unordered mesh approach is used to define the vehicle’s surface.
${C_P}$
in shadow regions. A common improvement to these methods involves applying the Prandtl-Meyer relations to compute property variations over a convex corner. This improvement relies on knowing the properties of the previous element, which may not be feasible if an unordered mesh approach is used to define the vehicle’s surface.
2.5 The generalised shock-expansion method
Also known as the first-order shock-expansion (FOSE) method, this technique was proposed by Eggers, Savin and Syverston [Reference Eggers, Savin and Syvertson5] as a generalised methodology based on the Prandtl-Meyer relation and the oblique shock equations of Rankine and Hugoniot. In contrast to the previous methods, the FOSE method can only be applied along streamlines, approximating its aerodynamic and thermodynamic properties. The implementation of the method consists of two simple steps. Firstly, a tangent body discretisation to the streamlines is applied, see Fig. 2, where each streamline element is associated with an inclination angle. Secondly, the change in flow deflection angle in going from one element to another dictates the changes in flow properties, as the Prandtl-Meyer or oblique shock relations are used depending on whether the change in inclination is negative or positive.
Geometry used by the generalised shock-expansion method [Reference Eggers and Savin4].
The generalised, or first-order, shock-expansion (FOSE) method assumes that shock-wave-Mach-wave interactions are negligible. This phenomenon refers to the interaction of disturbances, or Mach waves, originating from the surface of the vehicles with the leading shock wave causing the Mach waves to be reflected to the surface and alter surface pressures. Hence, the pressure along each element remains constant.
This technique is advantageous as it effectively considers changes in entropy caused by powerful shock waves. However, a known limitation of the FOSE technique is its failure when the fineness ratio based hypersonic similarity parameter $\left( {{K_{FR}}} \right)$
is in the vicinity of unity [Reference Syvertson and Dennis19]. Furthermore, this algorithm’s pre and post-processing stages are more complex, as a streamline tracing algorithm is required to generate the streamline data, and an efficient grid interpolation algorithm is required to interpolate properties between streamlines. This is associated with a higher computational cost and increased execution times.
$\left( {{K_{FR}}} \right)$
is in the vicinity of unity [Reference Syvertson and Dennis19]. Furthermore, this algorithm’s pre and post-processing stages are more complex, as a streamline tracing algorithm is required to generate the streamline data, and an efficient grid interpolation algorithm is required to interpolate properties between streamlines. This is associated with a higher computational cost and increased execution times.
2.6 The second-order shock-expansion method
Syverston and Denis developed the second order shock-expansion (SOSE) method [Reference Syvertson and Dennis19] as an improvement over the generalised shock-expansion theory. This ROM aims to address the limitations of its predecessor by considering shock-wave-Mach-wave interactions. The SOSE procedure follows the exact implementation of the FOSE technique. In the previous method, the pressure along each frustum was assumed to be constant. However, by considering Mach wave reflections, the SOSE method suggests an exponential pressure variation along each conical frustum presented by Equation (5)
 \begin{align}p = {p_c} - \left( {{p_c} - {p_2}} \right){e^{ - \eta }}\end{align}
with
 \begin{align}\eta = {\left( {\frac{{\partial p}}{{\partial s}}} \right)_2}\frac{{\left( {x - {x_2}} \right)}}{{\left( {{p_c} - {p_2}} \right){\rm{cos}}{\delta _2}}}\end{align}
where ${p_2}$
and
${p_2}$
and ${\delta _2}$
are the pressure downstream of the juncture and the flow deflection angle of the frustum, respectively, and
${\delta _2}$
are the pressure downstream of the juncture and the flow deflection angle of the frustum, respectively, and ${p_c}$
is the surface pressure over a pointed cone with vertex semi-angle equal to the inclination of the considered frustum. The expression developed by Syverston and Dennis to compute the pressure gradient immediately downstream of the juncture between adjacent frustums follows
${p_c}$
is the surface pressure over a pointed cone with vertex semi-angle equal to the inclination of the considered frustum. The expression developed by Syverston and Dennis to compute the pressure gradient immediately downstream of the juncture between adjacent frustums follows
 \begin{align}{\left( {\frac{{\partial p}}{{\partial s}}} \right)_2} = \frac{{{B_2}}}{r}\left( {\frac{{{{\rm{\Omega }}_1}}}{{{{\rm{\Omega }}_2}}}{\rm{sin}}{\delta _1} - {\rm{sin}}{\delta _2}} \right) + \frac{{{B_2}}}{{{B_1}}}\frac{{{{\rm{\Omega }}_1}}}{{{{\rm{\Omega }}_2}}}{\left( {\frac{{\partial p}}{{\partial s}}} \right)_1}\end{align}
with
 \begin{align}{B_i} = \frac{{\gamma {p_i}M_i^2}}{{2\left( {M_i^2 - 1} \right)}}\end{align}
 \begin{align}{\lambda _i} = \frac{{2\gamma {p_i}}}{{{\rm{sin}}2{\mu _i}}}\end{align}
 \begin{align}{{\rm{\Omega }}_i} = \frac{1}{{{M_i}}}{\left[ {\frac{{1 + \frac{{\gamma - 1}}{2}M_i^2}}{{\frac{{\gamma + 1}}{2}}}} \right]^{\frac{{\gamma + 1}}{{2\left( {\gamma - 1} \right)}}}}\end{align}
All symbols have their usual meaning and $\mu $
is the Mach angle. The subscript ‘’ represents the quantity analysed at position ‘’ of the frustum of interest. Fig. 3 illustrates the numbering convention used by the SOSE method. Note that the pressure gradient at position one is zero for the first juncture since the pressure along the first conical frustum is constant, as it is assumed to behave like a sharp cone. The pressure gradient at position three can be determined by Equation (11), the analytical differentiation of Equation (5).
$\mu $
is the Mach angle. The subscript ‘’ represents the quantity analysed at position ‘’ of the frustum of interest. Fig. 3 illustrates the numbering convention used by the SOSE method. Note that the pressure gradient at position one is zero for the first juncture since the pressure along the first conical frustum is constant, as it is assumed to behave like a sharp cone. The pressure gradient at position three can be determined by Equation (11), the analytical differentiation of Equation (5).
 \begin{align}{\left( {\frac{{\partial p}}{{\partial s}}} \right)_3} = \frac{{{p_c} - {p_3}}}{{{p_c} - {p_2}}}{\left( {\frac{{\partial p}}{{\partial s}}} \right)_2}\end{align}
Numbering convention used by the second-order shock-expansion method [Reference Syvertson and Dennis19].

2.7 DeJarnette’s approximate expression
As an attempt to predict the pressure distribution over slender axisymmetric bodies at an incidence angle, DeJarnette and Ford [Reference DeJarnette, Ford and Young3] developed an expression to compute the pressure coefficient at the surface of sharp cones at lower supersonic speeds that did not require the numerical solution of the Taylor-Maccoll equation. The surface pressure is provided by an elegant equation rather than numerically solving for the entire flow field between the shock wave and cone surface. Following Van Dyke’s rationale, the hypersonic similarity parameter $\left( K \right)$
is adjusted to include low-supersonic phenomena. The pressure coefficient at the surface of a sharp cone can be computed using Equation (12)
$\left( K \right)$
is adjusted to include low-supersonic phenomena. The pressure coefficient at the surface of a sharp cone can be computed using Equation (12)
 \begin{align}{C_p} = {\rm{si}}{{\rm{n}}^2}{\theta _c}\left[ {1 + \frac{{\left( {\gamma + 1} \right)K_{DJ}^2 + 2}}{{\left( {\gamma - 1} \right)K_{DJ}^2 + 2}}{\rm{ln}}\left( {\frac{{\gamma + 1}}{2} + \frac{1}{{K_{DJ}^2}}} \right)} \right]\end{align}
where $K_{DJ}^2 = \left( {M_\infty ^2 - 1} \right){\rm{si}}{{\rm{n}}^2}{\theta _c}$
and
$K_{DJ}^2 = \left( {M_\infty ^2 - 1} \right){\rm{si}}{{\rm{n}}^2}{\theta _c}$
and ${\theta _c}$
is the cone semi-vertex angle.
${\theta _c}$
is the cone semi-vertex angle.
2.8 The matching point – adapting methods to blunt noses
The methodologies presented have been developed for applications where the leading edge of the body is sharp and sustains an attached shock. This section investigates two corrections that will adjust the proposed methods to accurately simulate the aerodynamics of blunt-nosed slender bodies.
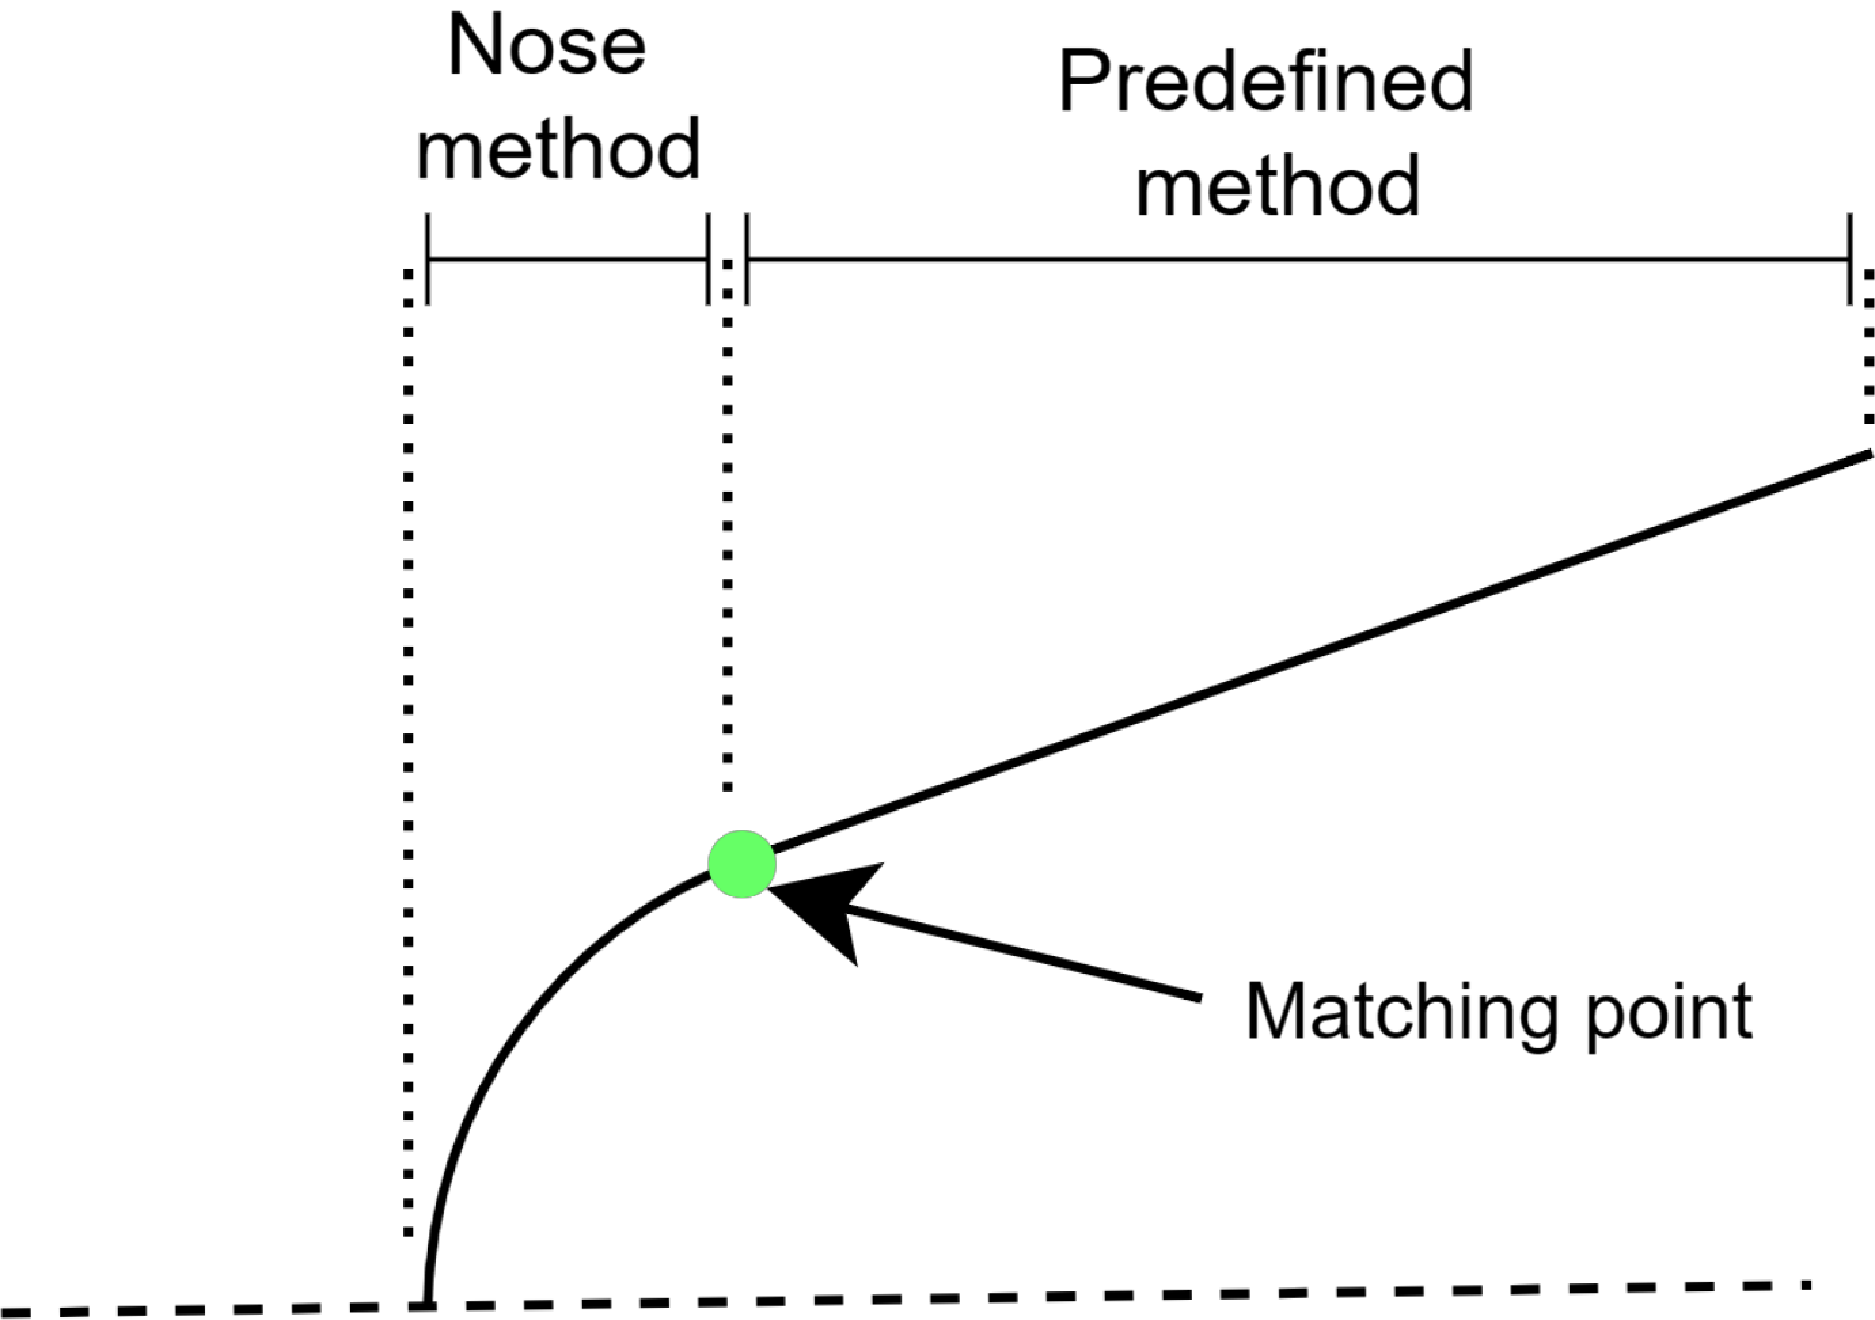
Jackson [Reference Jackson, Sawyer and Smith11] pioneered the matching point method to overcome the sharp leading-edge limitation. This procedure consists of applying an arbitrary method in the stagnation region of the body, in this report the method applied to this region of the body is referred to as the nose method, up to a point known as the matching point, after which a different method is used to analyse the rest of the body, this report will reference this method as the body method. These two regions and the matching point are depicted in Fig. 4. The determination of the matching point significantly impacts the accuracy of some techniques, like the SOSE method. Significant effort has been directed towards accurately determining the optimal location of the matching point.
Schematic representation of the matching point in a blunt cone showing where nose and predefined methods are applied.
2.8.1 Jackson’s modifications
The modified Newtonian theory (MNT) is known to accurately predict pressure distributions over blunt bodies at hypersonic speeds. Therefore, Jackson applied the MNT as the nose method up to the matching point. Jackson’s approach [Reference Jackson, Sawyer and Smith11] defined the optimal matching point as the location where the local inclination of the body was the same as the maximum wedge angle for an attached shock wave. Although this implementation of the matching point delivered accurate pressure distributions for bodies at hypersonic speeds, this approach needs to be revised at low-supersonic velocities.
2.8.2 DeJarnette and ford’s modification
DeJarnette and Ford [Reference DeJarnette, Ford and Young3] identified that Jackson’s method lost accuracy when the Mach number was below 5. They studied the flow over a sphere at ${M_\infty }$
less than 3.5, where differences between experimental data and Jackson’s approach were observed. Hence, DeJarnette and Ford [Reference DeJarnette, Ford and Young3] proposed an empirical relation for predicting the pressure around a sphere at Mach numbers lower than 10 based on experimental results. Their relationship to approximate the pressure around the nose has the form of Equation (13), where the value of
${M_\infty }$
less than 3.5, where differences between experimental data and Jackson’s approach were observed. Hence, DeJarnette and Ford [Reference DeJarnette, Ford and Young3] proposed an empirical relation for predicting the pressure around a sphere at Mach numbers lower than 10 based on experimental results. Their relationship to approximate the pressure around the nose has the form of Equation (13), where the value of ${C_{{p_{max}}}}$
is calculated using Eq. 3. The parameters A and D are a function of
${C_{{p_{max}}}}$
is calculated using Eq. 3. The parameters A and D are a function of ${M_\infty }$
and defined in the Appendix. The performance of this methodology is compared against Jackson’s approach and experimental data [Reference Jackson, Sawyer and Smith11] and illustrated in Fig. 5.
${M_\infty }$
and defined in the Appendix. The performance of this methodology is compared against Jackson’s approach and experimental data [Reference Jackson, Sawyer and Smith11] and illustrated in Fig. 5.
 \begin{align}{C_p} = {C_{{p_{max}}}}\left( {1 - D{\rm{co}}{{\rm{s}}^A}\theta } \right)\end{align}
Pressure distribution over a sphere at ${M_\infty } = 1.9$
.
${M_\infty } = 1.9$
.

After improving the method used to determine the pressure over the blunt nose, DeJarnette and Ford modified the location of the matching point. They developed a second empirical correlation that related the freestream Mach number with the surface Mach number expected at the matching point. The local Mach number over the nose can be determined using Equation (13) and the isentropic flow relations. Therefore, the empirical correlation for pressure will be used until the Mach number on the sphere’s surface exceeds the value suggested by Equation (21), which is defined for the range $1.5 \le {M_\infty } \le 10$
.
$1.5 \le {M_\infty } \le 10$
.
3.0 Validation of subroutines
3.1 Taylor-Maccoll subroutine
The numerical procedure used to solve the Taylor-Maccoll equation, Equation (14), follows the approach suggested by Anderson [Reference Anderson1] with modification to improve the numeric stability of the solution. This section focuses on validating the Taylor-Maccoll subroutine and performing a trade-off analysis between different ordinary differential equation (ODE) solvers and maximum solver step size to minimise the execution time while maintaining accurate results. The performance of the solvers is measured by considering their accuracy, run time and numerical stability, recognising that some solvers yield accurate solutions in certain conditions and extremely inaccurate solutions in others, see Fig. 6.
 \begin{align}\frac{{\gamma - 1}}{2}\left[ {v_{max}^2 - v_r^2 - {{\left( {\frac{{d{v_r}}}{{d\theta }}} \right)}^2}} \right]\left[ {2{v_r} + \frac{{d{v_r}}}{{d\theta }}{\rm{cot}}\theta + \frac{{{d^2}{v_r}}}{{d{\theta ^2}}}} \right] - \frac{{d{v_r}}}{{d\theta }}\left[ {{v_r}\frac{{d{v_r}}}{{d\theta }} + \frac{{d{v_r}}}{{d\theta }}\frac{{{d^2}{v_r}}}{{d{\theta ^2}}}} \right] = 0\end{align}
The parameter ${v_{max}}$
represents the theoretical velocity achievable under fixed reservoir conditions, while
${v_{max}}$
represents the theoretical velocity achievable under fixed reservoir conditions, while ${v_r}$
denotes the radial velocity within the flow field. The variable
${v_r}$
denotes the radial velocity within the flow field. The variable $\theta $
serves as the independent variable governing the inclination of a ray emanating from the vertex of the cone. For a comprehensive elucidation of the Taylor-Maccoll equation, refer to Anderson [Reference Anderson1].
$\theta $
serves as the independent variable governing the inclination of a ray emanating from the vertex of the cone. For a comprehensive elucidation of the Taylor-Maccoll equation, refer to Anderson [Reference Anderson1].
The dataset used to validate this subroutine is extracted from Kopal [Reference Kopal12], which agrees with the universally accepted NASA conical shock tables [Reference Sims17]. The subroutine was validated against 192 different combinations of cone angles and freestream Mach numbers. As the execution time of the subroutine is problem-specific, the execution time is measured as the average run time of the 192 problems and is illustrated by Table 1. To assess the precision and robustness of the solvers, we utilise the Euclidean L2 Norm to measure the disparity between our proposed solvers and Kopal’s outcomes. This metric reflects the collective error in degrees of the resultant shock angle for all Mach numbers specified in Kopal’s table.
Performance of Taylor-Maccoll subroutine using different ODE parameters and semi-vertex cone angles

Performance of Taylor-Maccoll solver subroutine.

The study determined that the 4th-order Runge-Kutta integration scheme provided accurate and predictable results. However, significant errors were observed for small ${\theta _c}$
when the solver’s maximum step was not specified. To address this, different maximum integration steps were investigated to find a value that produced accurate solutions. It was found that the maximum step size has little impact on the solution when
${\theta _c}$
when the solver’s maximum step was not specified. To address this, different maximum integration steps were investigated to find a value that produced accurate solutions. It was found that the maximum step size has little impact on the solution when ${\theta _c}$
is larger than 10
${\theta _c}$
is larger than 10 ${{}^ \circ }$
. However, significantly reducing the maximum step size decreased the error for small cone angles at the expense of execution time. The relationship between maximum step size, error,
${{}^ \circ }$
. However, significantly reducing the maximum step size decreased the error for small cone angles at the expense of execution time. The relationship between maximum step size, error, ${\theta _c}$
, and run time is presented in Table 1. To maintain accuracy and fast execution times, the subroutine automatically switches the solver’s maximum step size depending on the element’s inclination. A value of 0.002 is chosen when the target
${\theta _c}$
, and run time is presented in Table 1. To maintain accuracy and fast execution times, the subroutine automatically switches the solver’s maximum step size depending on the element’s inclination. A value of 0.002 is chosen when the target ${\theta _c}$
is less than 10
${\theta _c}$
is less than 10 ${{}^ \circ }$
, while for larger angles, the maximum step size remains undefined. This optimisation significantly improved the subroutine’s run time. The performance and accuracy of the final version are illustrated in Fig. 6b, where the precision of the computed surface
${{}^ \circ }$
, while for larger angles, the maximum step size remains undefined. This optimisation significantly improved the subroutine’s run time. The performance and accuracy of the final version are illustrated in Fig. 6b, where the precision of the computed surface ${C_P}$
is accurate within 0.6
${C_P}$
is accurate within 0.6 ${\rm{\% }}$
.
${\rm{\% }}$
.
3.2 Second-order shock-expansion routine
The validation of the SOSE comes in two parts. Firstly, non-lifting sharp leading edge convex bodies are compared with standard values obtained by the methods of characteristic provided by Ehret [Reference Ehret6]. Sharp tangent ogives at two values of $K$
will be inspected. For axisymmetric bodies,
$K$
will be inspected. For axisymmetric bodies, $K$
is defined as the ratio of freestream Mach number to the fineness ratio
$K$
is defined as the ratio of freestream Mach number to the fineness ratio $\left( {FR} \right)$
of the body, equal to characteristic length
$\left( {FR} \right)$
of the body, equal to characteristic length $\left( c \right)$
over base diameter. Secondly, the improved implementation is validated against blunt-nosed cones extracted from the further work by DeJarnette and Ford [Reference DeJarnette, Ford and Young3], which was achieved experimentally. It is important to note that the SOSE methodology was developed for bodies with traditional hypersonic similarity parameters,
$\left( c \right)$
over base diameter. Secondly, the improved implementation is validated against blunt-nosed cones extracted from the further work by DeJarnette and Ford [Reference DeJarnette, Ford and Young3], which was achieved experimentally. It is important to note that the SOSE methodology was developed for bodies with traditional hypersonic similarity parameters, $K$
, in the proximity of unity. Therefore, test cases where this condition is satisfied will be considered for validation.
$K$
, in the proximity of unity. Therefore, test cases where this condition is satisfied will be considered for validation.
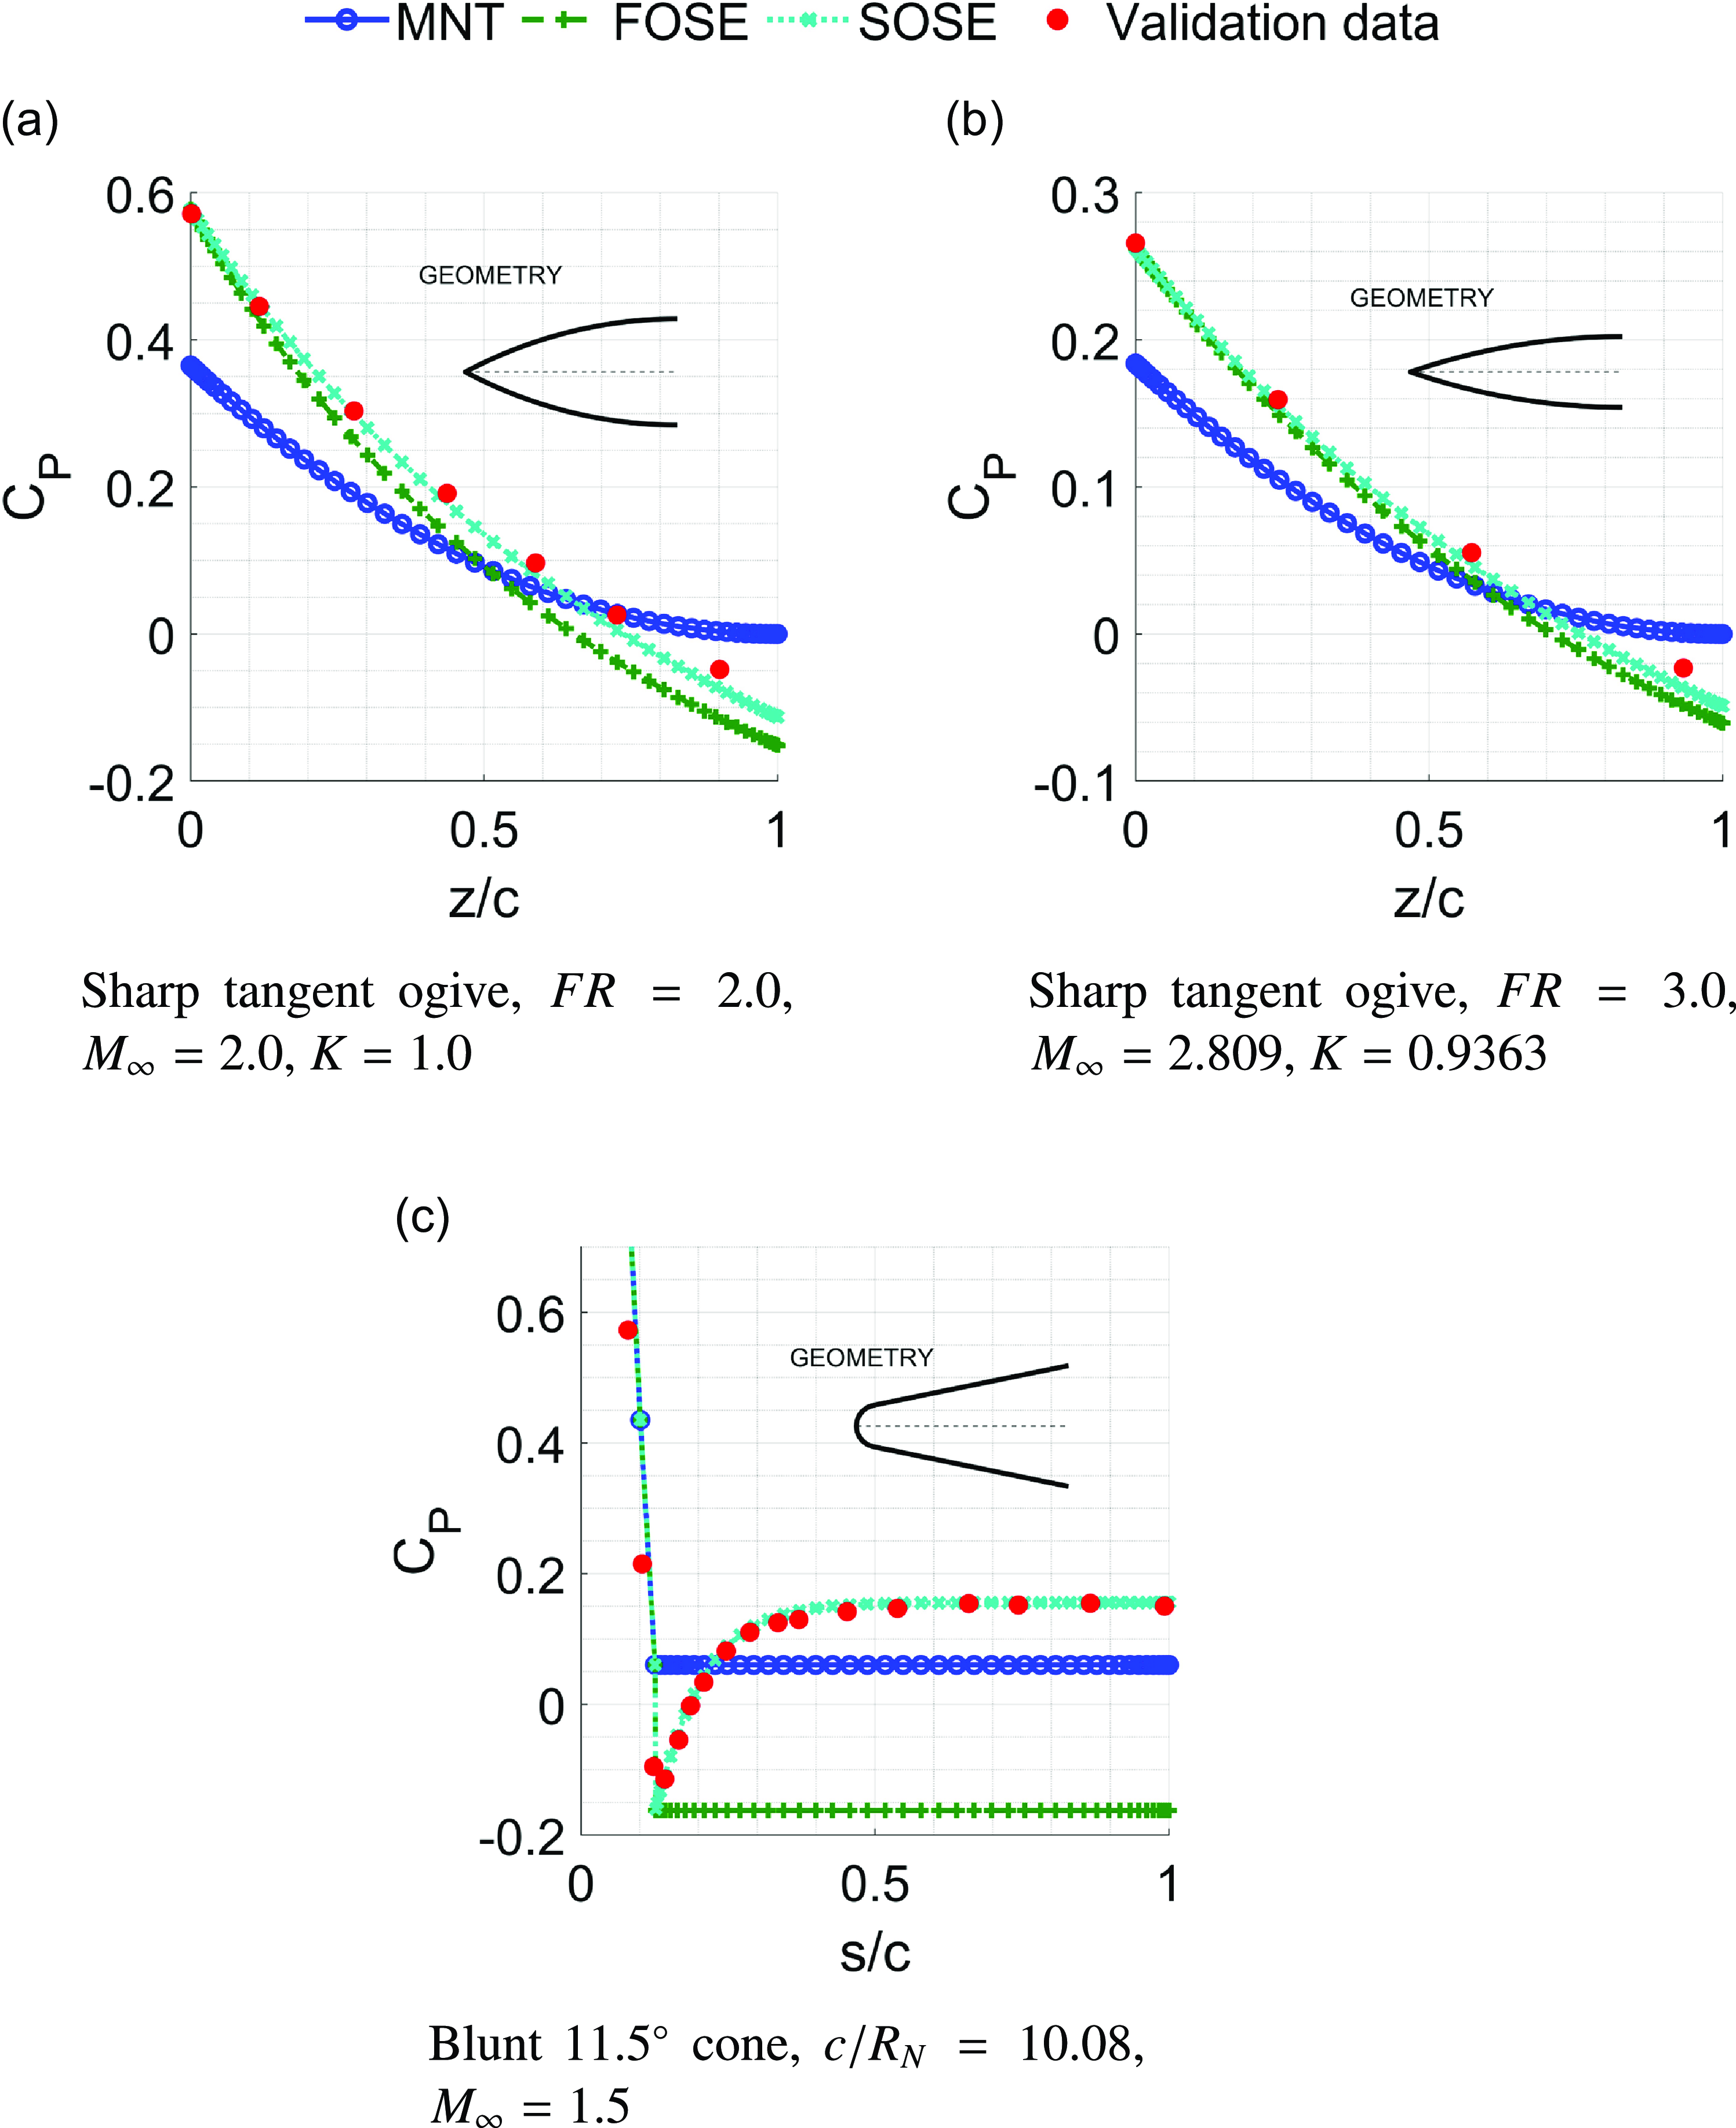
Three test cases were used to validate the implementation of the SOSE method, Fig. 7 depicts the pressure distribution over two sharp tangent ogives and a blunt one. It is clear that the SOSE method is superior to the MNT method and surpasses the accuracy of the results provided by the FOSE, as expected. The SOSE method provided exceptional results for these three test cases, and we can safely conclude that the method has been correctly implemented.
Validation cases for SOSE routine. Validation data in Figs a) and b) were obtained from the method of characteristics and Fig. c) corresponds to experimental trials. The x-axis of Figs a) and b) are the non-dimensionalised longitudinal coordinates of the body. The x-axis of Fig. c) is the non-dimensionalised coordinates over the body meridian or surface.
4.0 Analysis of aerodynamic performance of methodologies
The assessment methodology involves a comprehensive examination of the fundamental assumptions underlying reduced order models (ROMs) by subjecting them to various test cases using simplified geometries, such as flat plates and sharp cones, spanning a wide range of Mach numbers. Additionally, in order to gauge the suitability of these methods for designing actual vehicles, more complex shapes like tangent ogives and hyperplane geometries are employed to emulate real-world scenarios.
A diverse set of metrics is employed to accurately quantify the accuracy of the ROMs depending on the test case. For simple cases, the error in ${C_P}$
is used, while more complex cases call for the evaluation of parameters like
${C_P}$
is used, while more complex cases call for the evaluation of parameters like ${C_D}$
,
${C_D}$
, ${C_L}$
, and stability characteristics like the centre of pressure. These metrics play a crucial role in assessing the accuracy of ROMs over complex geometries, particularly if intended to be used for preliminary design.
${C_L}$
, and stability characteristics like the centre of pressure. These metrics play a crucial role in assessing the accuracy of ROMs over complex geometries, particularly if intended to be used for preliminary design.
Industry readily uses Newtonian and MNT to characterise the aerodynamic environment of hypersonic vehicles. This practice suggests that the precision of these methods within the hypersonic regime is deemed satisfactory for industrial applications. Therefore, this study assumes that methodologies providing results accurate within 20% are considered acceptable. This particular accuracy threshold is chosen based on the behaviour of Newtonian theory-based ROMs, where Newtonian results gradually approach a 20% accuracy, as illustrated in Fig. 8a.
Parametric investigation of the accuracy of Newtonian-based methods over a semi-infinite plate at an incidence, compared to exact (oblique-shock) solution for perfect gas, $\gamma = 1.4$

4.1 The flat plate
The highly idealised flat plate geometry was used to explore the limitations of ROMs across a wide range of inclination angles. The Newtonian and modified Newtonian theories (NT and MNT) and the Van Dyke unified theory (UT) are considered and validated using oblique shock and Prandtl-Meyer relations, which provide analytical results for two-dimensional plates. For increased reliability, the pressure is adjusted to post-normal shock stagnation pressure in cases of detached shocks and to freestream pressure in cases of inviscid separation in the shadow region of the plate.
4.1.1 Newtonian-based methods
To satisfy the total normal momentum transfer assumption, Newtonian-based theories are based on the assumption of Mach number tending to infinity and reasonably large panel inclination angle. However, a threshold determining when ${M_\infty }$
is sufficiently large or when the inclination angle,
${M_\infty }$
is sufficiently large or when the inclination angle, $\theta $
, is sufficiently large does not exist. Determining these thresholds requires a parametric investigation of the two-dimensional space spanned by
$\theta $
, is sufficiently large does not exist. Determining these thresholds requires a parametric investigation of the two-dimensional space spanned by ${M_\infty }$
and
${M_\infty }$
and $\theta $
.
$\theta $
.
The accuracy of the Newtonian and MNT methodologies is assessed regarding the ${C_P}$
on the impact face of the plate. Also note that Newtonian suggests zero
${C_P}$
on the impact face of the plate. Also note that Newtonian suggests zero ${C_P}$
over shadow regions, which leads to a 100% error. This assumption is only valid at high Mach numbers, as high-speed flows more readily experience inviscid separation. However, flows can turn convex corners at low speeds, yielding Newtonian theory-based methods impractical for shadow regions.
${C_P}$
over shadow regions, which leads to a 100% error. This assumption is only valid at high Mach numbers, as high-speed flows more readily experience inviscid separation. However, flows can turn convex corners at low speeds, yielding Newtonian theory-based methods impractical for shadow regions.
Figures 8a and 8b show the error contours of the Newtonian and MNT methods, respectively. These figures show that the accuracy of these methods is predominantly dominated by the inclination angle $\theta $
rather than the freestream Mach number
$\theta $
rather than the freestream Mach number ${M_\infty }$
. Notably, both methods experience decreased accuracy around the 45
${M_\infty }$
. Notably, both methods experience decreased accuracy around the 45 ${{}^ \circ }$
region, in line with previous findings(3). At low inclination angles (below 45
${{}^ \circ }$
region, in line with previous findings(3). At low inclination angles (below 45 ${{}^ \circ }$
), the MNT method fails to satisfy the 20% accuracy margin, reflecting its innapplicability for applications with attached shocks, which are expected at small
${{}^ \circ }$
), the MNT method fails to satisfy the 20% accuracy margin, reflecting its innapplicability for applications with attached shocks, which are expected at small $\theta $
. In contrast, the Newtonian method remains accurate within 20%. However, parametrically defining a precise 20% accuracy contour for the Newtonian method based on
$\theta $
. In contrast, the Newtonian method remains accurate within 20%. However, parametrically defining a precise 20% accuracy contour for the Newtonian method based on $\theta $
and
$\theta $
and ${M_\infty }$
proves challenging, necessitating a visual inspection of Fig. 8a to assess the accuracy of the result. When the element’s inclination exceeds 45
${M_\infty }$
proves challenging, necessitating a visual inspection of Fig. 8a to assess the accuracy of the result. When the element’s inclination exceeds 45 ${{}^ \circ }$
, the error contours become less dependent on
${{}^ \circ }$
, the error contours become less dependent on ${M_\infty }$
, allowing for the definition of a reliable range of
${M_\infty }$
, allowing for the definition of a reliable range of $\theta $
that ensures results are accurate within 20% for both methods. Specifically, MNT yields errors within 20% for angles larger than 59
$\theta $
that ensures results are accurate within 20% for both methods. Specifically, MNT yields errors within 20% for angles larger than 59 ${{}^ \circ }$
(indicated by the red dashed line in Fig. 8b). In comparison, Newtonian guarantees accurate results within 20% for angles between 55
${{}^ \circ }$
(indicated by the red dashed line in Fig. 8b). In comparison, Newtonian guarantees accurate results within 20% for angles between 55 ${{}^ \circ }$
and 76
${{}^ \circ }$
and 76 ${{}^ \circ }$
for any
${{}^ \circ }$
for any ${M_\infty }$
.
${M_\infty }$
.
4.1.2 Van Dyke unified theory
The Van Dyke unified theory (UT) uses linearised oblique shock and Prandtl-Meyer relations to predict ${C_P}$
on compression and expansion regions. It was designed for applications with small values of the modified hypersonic similarity parameter
${C_P}$
on compression and expansion regions. It was designed for applications with small values of the modified hypersonic similarity parameter ${K_{VD}}$
but lacks a precise threshold value. The flat plate serves as a suitable test case, as the lower surface is an impact surface using the linearised oblique shock relation Equation (3), and the upper surface is a shadow region requiring the linearised Prandtl-Meyer equation Equation (4).
${K_{VD}}$
but lacks a precise threshold value. The flat plate serves as a suitable test case, as the lower surface is an impact surface using the linearised oblique shock relation Equation (3), and the upper surface is a shadow region requiring the linearised Prandtl-Meyer equation Equation (4).
Figures 9a and 9b illustrate the UT method’s error contours for the compression and expansion faces of the plate, respectively. The expansion linearisation contributes the most to the error as the error becomes radially unbounded, with errors rapidly increasing and exceeding 1000%, especially when the flow undergoes inviscid separation, identifiable at $\theta \gt {\theta _{{\rm{inv}},{\rm{sep}}}}$
using Equation (15) and depicted in Fig. 9b as a magenta line. This behaviour is not observed for the linearised oblique shock relation, as it remains highly accurate at modest
$\theta \gt {\theta _{{\rm{inv}},{\rm{sep}}}}$
using Equation (15) and depicted in Fig. 9b as a magenta line. This behaviour is not observed for the linearised oblique shock relation, as it remains highly accurate at modest $\theta $
. At large angles of attack, inaccuracies arise due to the shock transitioning from attached to detached, as the method cannot identify this point.
$\theta $
. At large angles of attack, inaccuracies arise due to the shock transitioning from attached to detached, as the method cannot identify this point.
 \begin{align}{\theta _{inv,sep}} = \frac{\pi }{2}\left( {\sqrt {\frac{{\gamma + 1}}{{\gamma - 1}}} - 1} \right) - \sqrt {\frac{{\gamma + 1}}{{\gamma - 1}}} {\rm{ta}}{{\rm{n}}^{ - 1}}\left( {\sqrt {\frac{{\gamma - 1}}{{\gamma + 1}}\left( {{M^2} - 1} \right)} } \right) + {\rm{ta}}{{\rm{n}}^{ - 1}}\left( {\sqrt {{M^2} - 1} } \right)\end{align}
Parametric investigation of the accuracy of Van Dyke unified theory over a semi-infinite plate at angle-of-attack.

Parametrically defining the 20% error contour for compression regions is straightforward, as the accuracy weakly depends on ${M_\infty }$
and only exhibits strong dependencies in the 1.5 to 3 Mach range. Above Mach 3, results within 20% are guaranteed for
${M_\infty }$
and only exhibits strong dependencies in the 1.5 to 3 Mach range. Above Mach 3, results within 20% are guaranteed for $\theta $
less than 46.7
$\theta $
less than 46.7 ${{}^ \circ }$
with an exponential variation in the 1.5 to 3
${{}^ \circ }$
with an exponential variation in the 1.5 to 3 $M$
range. On the other hand, defining the contour for shadow regions is more complex due to its dependencies on both
$M$
range. On the other hand, defining the contour for shadow regions is more complex due to its dependencies on both ${M_\infty }$
and
${M_\infty }$
and $\theta $
. The accuracy of the UT method is evaluated using the modified hypersonic similarity parameter,
$\theta $
. The accuracy of the UT method is evaluated using the modified hypersonic similarity parameter, ${K_{VD}}$
, which shares a reciprocal structure with the contour pattern in Fig. 9b. The study’s conclusion indicates that UT is appropriate for expansion regions when the computed
${K_{VD}}$
, which shares a reciprocal structure with the contour pattern in Fig. 9b. The study’s conclusion indicates that UT is appropriate for expansion regions when the computed ${K_{VD}}$
value is less than 8.929.
${K_{VD}}$
value is less than 8.929.
4.2 Non-inclined sharp cone
The study progresses towards authentic vehicle design by considering the sharp cone geometry. The parametric investigation covers a two-dimensional space spanned by ${M_\infty }$
and the semi-vertex cone angle,
${M_\infty }$
and the semi-vertex cone angle, ${\theta _c}$
, ranging from 1.2 to 30 for
${\theta _c}$
, ranging from 1.2 to 30 for $M$
and from 3
$M$
and from 3 ${{}^ \circ }$
to 57
${{}^ \circ }$
to 57 ${{}^ \circ }$
for
${{}^ \circ }$
for ${\theta _c}$
. The investigated limits of
${\theta _c}$
. The investigated limits of ${\theta _c}$
are justified by the asymptotic behaviour of conical shocks, where below 3
${\theta _c}$
are justified by the asymptotic behaviour of conical shocks, where below 3 ${{}^ \circ }$
, the flow properties remain unaffected, and the maximum cone angle to sustain an attached shock as
${{}^ \circ }$
, the flow properties remain unaffected, and the maximum cone angle to sustain an attached shock as ${M_\infty }$
tends to infinity is 57.67
${M_\infty }$
tends to infinity is 57.67 ${{}^ \circ }$
.
${{}^ \circ }$
.
In this investigation, the Newtonian, UT, tangent-wedge methods and DeJarnette approximate expression are assessed against data generated by the Taylor-Maccoll subroutine, resulting in the error contours shown in Fig. 10. Detached shock regions are expected at large ${\theta _c}$
. As the maximum cone angle
${\theta _c}$
. As the maximum cone angle ${\theta _{c,max}}$
is a function of
${\theta _{c,max}}$
is a function of ${M_\infty }$
, the empirical relation proposed by Shanbhag [Reference Shanbhag15] is used to approximate where regions with detached shocks can be expected and indicated by the dashed region. The study disregards these regions.
${M_\infty }$
, the empirical relation proposed by Shanbhag [Reference Shanbhag15] is used to approximate where regions with detached shocks can be expected and indicated by the dashed region. The study disregards these regions.
Parametric investigation of method’s accuracy over sharp cones relative to Taylor-Maccoll theory. a) Newtonian theory method; b) DeJarnette approximate expression; c) Van Dyke unified theory; d) tangent-wedge method.

Fig. 10a shows that the Newtonian method accurately predicts ${C_P}$
at relatively low Mach numbers and across a larger portion of the considered space compared to the initial flat plate study. In addition, the accuracy is no longer strongly dependent on the surface inclination angle. The improved accuracy is attributed to the relaxation phenomena of three-dimensional shocks. The three-dimensional nature of sharp cones leads to weaker shocks than that sustained by a wedge of equivalent angle, leading to reduced surface pressures. The combination of reduced surface pressures and the under-predictive nature of the Newtonian method yields an extended applicability range when investigating three-dimensional bodies.
${C_P}$
at relatively low Mach numbers and across a larger portion of the considered space compared to the initial flat plate study. In addition, the accuracy is no longer strongly dependent on the surface inclination angle. The improved accuracy is attributed to the relaxation phenomena of three-dimensional shocks. The three-dimensional nature of sharp cones leads to weaker shocks than that sustained by a wedge of equivalent angle, leading to reduced surface pressures. The combination of reduced surface pressures and the under-predictive nature of the Newtonian method yields an extended applicability range when investigating three-dimensional bodies.
Fig. 10b shows that the approximate expression developed by DeJarnette is highly accurate in predicting the pressure of the surface of cones without requiring the numerical solution of the Taylor-Maccoll equation. This technique provides results accurate within 2% for most of the space studied while yielding estimates accurate within 10% in the remaining regions. The exceptional precision of this technique can revolutionise ROM-based CFD analysis by eliminating the necessity for numerically solving the Taylor-Maccoll equation. Methods reliant on such numerical solutions, like SOSE, FOSE and tangent-cone techniques, can leverage this heightened accuracy of this ROM to significantly reduce execution times or employ more elements in the mesh at the expense of little execution time.
Tangent ogive parameterised geometry [Reference Crowell2], where ${z_0}$
is the centre of the sphere defining the spherical nose cap and
${z_0}$
is the centre of the sphere defining the spherical nose cap and ${z_a}$
is the displacement of the leading edge caused by adding the spherical nose cap.
${z_a}$
is the displacement of the leading edge caused by adding the spherical nose cap.

Figs. 10c and 10d illustrate how the tangent-wedge and Van Dyke unified theory are firmly related. As expected, the tangent-wedge method extends the 20% error contour suggested by the unified Van Dyke theory. The increased accuracy at larger inclination angles is due to the tangent-wedge method making use of the complete oblique shock and Prandtl-Meyer relations, while the UT relies on linearised versions, resulting in decreased accuracy. Given their formulation under the two-dimensional restricted flow assumption, the error associated with these two methods comes from the overshoot in predicted ${C_P}$
.
${C_P}$
.
4.3 Non-inclined sharp tangent ogives
The tangent ogive is crucial in supersonic and hypersonic applications, commonly seen in the nose segment of high-speed systems like supersonic aircraft and projectiles. Its geometry can be characterised by the nose radius $\left( {{R_N}} \right)$
, characteristic length
$\left( {{R_N}} \right)$
, characteristic length $\left( L \right)$
, and fineness ratio
$\left( L \right)$
, and fineness ratio $\left( {FR} \right)$
defined as
$\left( {FR} \right)$
defined as $L/2R$
. Fig. 11 visualises the parameterised geometry. Pressure distributions over non-inclined tangent ogives were assessed using two data-sets. Syverstson and Dennis [Reference Syvertson and Dennis19] provide experimental surface pressure data for tangent ogives with
$L/2R$
. Fig. 11 visualises the parameterised geometry. Pressure distributions over non-inclined tangent ogives were assessed using two data-sets. Syverstson and Dennis [Reference Syvertson and Dennis19] provide experimental surface pressure data for tangent ogives with $FR$
of 3 and 5 at Mach numbers from 3.00 to 5.05. On the other hand, Ehret [Reference Ehret6] uses numerical inviscid method of characteristics for tangent ogives with
$FR$
of 3 and 5 at Mach numbers from 3.00 to 5.05. On the other hand, Ehret [Reference Ehret6] uses numerical inviscid method of characteristics for tangent ogives with $FR$
of 6, 3, 2 and 1.5 at
$FR$
of 6, 3, 2 and 1.5 at ${M_\infty }$
from 1.50 to 6.00. The assessment of methodologies concentrates on integral properties of the pressure distribution, such as drag coefficient
${M_\infty }$
from 1.50 to 6.00. The assessment of methodologies concentrates on integral properties of the pressure distribution, such as drag coefficient $\left( {{C_D}} \right)$
and the location of the longitudinal centre of pressure
$\left( {{C_D}} \right)$
and the location of the longitudinal centre of pressure $\left( {{z_{cp}}} \right)$
. These metrics are considered due to their essential role in preliminary vehicle design stages and are correlated against
$\left( {{z_{cp}}} \right)$
. These metrics are considered due to their essential role in preliminary vehicle design stages and are correlated against ${M_\infty }$
and
${M_\infty }$
and $FR$
.
$FR$
.
4.3.1 Drag coefficient
Fig. 12 depicts the parametric investigation and quantifies the accuracy of the methods by comparing the cross-sectional ${C_D}$
. Fig. 12a shows the correlation of accuracy with the hypersonic similarity parameter based on nose fineness ratio
${C_D}$
. Fig. 12a shows the correlation of accuracy with the hypersonic similarity parameter based on nose fineness ratio $\left( {{K_{FR}}} \right)$
, defined as the ratio of
$\left( {{K_{FR}}} \right)$
, defined as the ratio of ${M_\infty }$
and nose fineness ratio
${M_\infty }$
and nose fineness ratio $\left( {FR} \right)$
. This metric captures the trend but fails to identify regions of method failure due to the non-uniqueness of
$\left( {FR} \right)$
. This metric captures the trend but fails to identify regions of method failure due to the non-uniqueness of ${K_{FR}}$
, as multiple combinations of
${K_{FR}}$
, as multiple combinations of ${M_\infty }$
and
${M_\infty }$
and $FR$
yield the same value.
$FR$
yield the same value. ${M_\infty }$
and
${M_\infty }$
and $FR$
are decoupled to investigate accuracy further, and Fig. 12b and 12c illustrate error evolution with Mach number for ogives with FR equal to 3 and 5, respectively.
$FR$
are decoupled to investigate accuracy further, and Fig. 12b and 12c illustrate error evolution with Mach number for ogives with FR equal to 3 and 5, respectively.
Parametric investigation of the accuracy of methods over tangent ogives relative to computational results from Ehret [Reference Ehret6] and experimental data from Syvertson and Dennis [Reference Syvertson and Dennis19]. a) ${C_D}$
error vs
${C_D}$
error vs ${K_{FR}}$
; b)
${K_{FR}}$
; b) ${C_D}$
error vs
${C_D}$
error vs ${M_\infty }$
for
${M_\infty }$
for $FR = 3$
; c)
$FR = 3$
; c) ${C_D}$
error vs
${C_D}$
error vs ${M_\infty }$
for
${M_\infty }$
for $FR = 5$
; d)
$FR = 5$
; d) ${C_D}$
error vs
${C_D}$
error vs $FR$
for
$FR$
for ${M_\infty } = 3$
.
${M_\infty } = 3$
.

From Figs. 12b and 12c, illustrating the error evolution with ${M_\infty }$
for ogives with FR equal to 3 and 5, Newtonian, MNT, FOSE and SOSE methods tend to underestimate
${M_\infty }$
for ogives with FR equal to 3 and 5, Newtonian, MNT, FOSE and SOSE methods tend to underestimate ${C_D}$
, while the tangent-cone, UT, tangent-wedge methods and DeJarnette’s approximate expression overestimate it. The accuracy of the UT and tangent-wedge methods is not visible in the figures, as their accuracy is consistently above 40% due to their two-dimensional formulation. However, all methods exhibit the same trend, with error monotonically decreasing as
${C_D}$
, while the tangent-cone, UT, tangent-wedge methods and DeJarnette’s approximate expression overestimate it. The accuracy of the UT and tangent-wedge methods is not visible in the figures, as their accuracy is consistently above 40% due to their two-dimensional formulation. However, all methods exhibit the same trend, with error monotonically decreasing as ${M_\infty }$
increases, where Newtonian and MNT experience a more subtle reduction. At Mach numbers below 2, error rapidly increases for all methods with FR of 3 due to the increasing influence of shock-wave-Mach-wave interaction. Additionally, Fig. 12d shows that the methodologies have reduced applicability for smaller base radii, where Newtonian-based methods exceed the 20% accuracy margin.
${M_\infty }$
increases, where Newtonian and MNT experience a more subtle reduction. At Mach numbers below 2, error rapidly increases for all methods with FR of 3 due to the increasing influence of shock-wave-Mach-wave interaction. Additionally, Fig. 12d shows that the methodologies have reduced applicability for smaller base radii, where Newtonian-based methods exceed the 20% accuracy margin.
The tangent-cone method provides accurate results within 20% for all test cases and within 10% for ${M_\infty }$
larger than 2. DeJarnette’s approximate expression follows a similar trend but with a slight increase in error, remaining within the accuracy margins for
${M_\infty }$
larger than 2. DeJarnette’s approximate expression follows a similar trend but with a slight increase in error, remaining within the accuracy margins for ${M_\infty }$
above 2. The excellent predictive properties of conical-based methods over convex bodies are due to the embedded centrifugal correction passively implemented by these methods, thoroughly investigated in Ref. (Reference Anderson1).
${M_\infty }$
above 2. The excellent predictive properties of conical-based methods over convex bodies are due to the embedded centrifugal correction passively implemented by these methods, thoroughly investigated in Ref. (Reference Anderson1).
The SOSE and FOSE methods generally provide the most accurate results, with maximum errors of 10 and 20%, respectively. While initially designed for near-unity ${K_{FR}}$
cases, the SOSE method demonstrates excellent accuracy across a wide range of
${K_{FR}}$
cases, the SOSE method demonstrates excellent accuracy across a wide range of ${K_{FR}}$
. This study emphasises the predictive accuracy of approximate methods at low Mach numbers. Inspecting the low Mach number region, the FOSE method is known to fail, providing results with errors exceeding 40% in
${K_{FR}}$
. This study emphasises the predictive accuracy of approximate methods at low Mach numbers. Inspecting the low Mach number region, the FOSE method is known to fail, providing results with errors exceeding 40% in ${C_D}$
, while the tangent-cone method becomes more accurate than the FOSE, matching the SOSE method’s accuracy. The error’s origin is attributed to growing shock-wave-Mach-wave interactions. This becomes evident after examining the actual
${C_D}$
, while the tangent-cone method becomes more accurate than the FOSE, matching the SOSE method’s accuracy. The error’s origin is attributed to growing shock-wave-Mach-wave interactions. This becomes evident after examining the actual ${C_P}$
distributions over a tangent ogive at Mach 1.5 and FR 3, shown in Fig. 13a, where both, FOSE and SOSE are observed to underestimate
${C_P}$
distributions over a tangent ogive at Mach 1.5 and FR 3, shown in Fig. 13a, where both, FOSE and SOSE are observed to underestimate ${C_P}$
, with the correction applied by the SOSE becoming critical at lower Mach numbers, highlighting the significance of shock-wave-Mach-wave interactions at low speeds.
${C_P}$
, with the correction applied by the SOSE becoming critical at lower Mach numbers, highlighting the significance of shock-wave-Mach-wave interactions at low speeds. ${C_P}$
distribution over multiple tangent-ogives with
${C_P}$
distribution over multiple tangent-ogives with $FR = 3$
. At base of the ogive
$FR = 3$
. At base of the ogive $z/L = 1$
.
$z/L = 1$
.

Close inspection of Fig. 13 reveals that the pressure distribution suggested by the SOSE converges to the FOSE prediction as ${M_\infty }$
increases. This convergence is a known behaviour of the SOSE method, occurring at large values of
${M_\infty }$
increases. This convergence is a known behaviour of the SOSE method, occurring at large values of ${K_{FR}}$
for all geometries due to the nature of high-speed flows and perturbations’ behaviour. While
${K_{FR}}$
for all geometries due to the nature of high-speed flows and perturbations’ behaviour. While ${K_{FR}}$
is commonly used to correlate errors between FOSE and SOSE methods, the error has a stronger correlation with
${K_{FR}}$
is commonly used to correlate errors between FOSE and SOSE methods, the error has a stronger correlation with ${M_\infty }$
, indicating that flow speed has a larger impact on Mach wave coalescence than the structure of the leading shock, dictated by the slenderness of the body. Figures 14a and 14b depict error evolution between SOSE and FOSE methods concerning
${M_\infty }$
, indicating that flow speed has a larger impact on Mach wave coalescence than the structure of the leading shock, dictated by the slenderness of the body. Figures 14a and 14b depict error evolution between SOSE and FOSE methods concerning ${M_\infty }$
and
${M_\infty }$
and ${K_{FR}}$
. Minor discontinuities, implying slight dependencies on
${K_{FR}}$
. Minor discontinuities, implying slight dependencies on $FR$
, are overshadowed by a consistent overall asymptotic trend represented by the red line. This reinforces the novel finding that
$FR$
, are overshadowed by a consistent overall asymptotic trend represented by the red line. This reinforces the novel finding that ${M_\infty }$
predominantly governs Mach wave coalescence, overruling shock structure. Discontinuities around
${M_\infty }$
predominantly governs Mach wave coalescence, overruling shock structure. Discontinuities around ${K_{FR}}$
equal to one should be disregarded, as the FOSE fails under these conditions, causing the spike in Fig.14a. The spike observed at
${K_{FR}}$
equal to one should be disregarded, as the FOSE fails under these conditions, causing the spike in Fig.14a. The spike observed at ${M_\infty } = 3$
in Fig. 14b is caused by the known singularity of the FOSE method in cases where
${M_\infty } = 3$
in Fig. 14b is caused by the known singularity of the FOSE method in cases where ${K_{FR}}$
is close to unity, which leads to a degradation in performance.
${K_{FR}}$
is close to unity, which leads to a degradation in performance.
Relative percentage error between SOSE and FOSE methods as; a) a function of ${K_{FR}}$
and b) a function of
${K_{FR}}$
and b) a function of ${M_\infty }$
. Red line represents a fitted curved as a function of
${M_\infty }$
. Red line represents a fitted curved as a function of ${K_{FR}}$
.
${K_{FR}}$
.

4.3.2 Centre of pressure
Figure 13 is used to investigate the effect of ${M_\infty }$
on the
${M_\infty }$
on the ${C_P}$
distribution over a tangent-ogive with
${C_P}$
distribution over a tangent-ogive with $FR = 3$
. At high
$FR = 3$
. At high ${M_\infty }$
, all methods suggest similar distributions, but as
${M_\infty }$
, all methods suggest similar distributions, but as ${M_\infty }$
decreases, the distributions diverge for two reasons. Firstly, Newtonian theory-derived methods, tangent-cone methods, and DeJarnette’s approximate expression cannot predict negative
${M_\infty }$
decreases, the distributions diverge for two reasons. Firstly, Newtonian theory-derived methods, tangent-cone methods, and DeJarnette’s approximate expression cannot predict negative ${C_P}$
as they are designed for impact surfaces only. Flow-over ogives at low supersonic velocities experiences an overexpansion towards the trailing edge, resulting in negative
${C_P}$
as they are designed for impact surfaces only. Flow-over ogives at low supersonic velocities experiences an overexpansion towards the trailing edge, resulting in negative ${C_P}$
. Secondly, Newtonian-based theories tend to underestimate
${C_P}$
. Secondly, Newtonian-based theories tend to underestimate ${C_P}$
at low
${C_P}$
at low ${M_\infty }$
due to the inaccurate infinite Mach number limit assumption. This behaviour is visible towards the leading edge of the ogives. In addition, these figures show multiple
${M_\infty }$
due to the inaccurate infinite Mach number limit assumption. This behaviour is visible towards the leading edge of the ogives. In addition, these figures show multiple ${C_P}$
distribution structure trends, which are crucial for determining the position of the centre of pressure, which affects the static stability of the geometry. Figure 15 illustrates the movement of the longitudinal centre of pressure with
${C_P}$
distribution structure trends, which are crucial for determining the position of the centre of pressure, which affects the static stability of the geometry. Figure 15 illustrates the movement of the longitudinal centre of pressure with ${M_\infty }$
for ogives with
${M_\infty }$
for ogives with $FR$
equal to 3 and 5, showing an upstream movement as
$FR$
equal to 3 and 5, showing an upstream movement as ${M_\infty }$
increases due to the overexpansion region at the trailing edge.
${M_\infty }$
increases due to the overexpansion region at the trailing edge.
Movement and error of longitudinal centre of pressure, ${z_{cp}}$
, with respect to Mach number and fineness ratio. Square markers represent experimental data from Ref. (Reference Syvertson and Dennis19) and triangular markers represent computational data from reference [Reference Ehret6]. a)
${z_{cp}}$
, with respect to Mach number and fineness ratio. Square markers represent experimental data from Ref. (Reference Syvertson and Dennis19) and triangular markers represent computational data from reference [Reference Ehret6]. a) ${z_{cp}}$
vs
${z_{cp}}$
vs $M$
for
$M$
for $FR = 3$
; b)
$FR = 3$
; b) ${z_{cp}}$
error vs
${z_{cp}}$
error vs $M$
for
$M$
for $FR = 3$
; c)
$FR = 3$
; c) ${z_{cp}}$
vs
${z_{cp}}$
vs $M$
for
$M$
for $FR = 5$
; d)
$FR = 5$
; d) ${z_{cp}}$
error vs
${z_{cp}}$
error vs $M$
for
$M$
for $FR = 5$
.
$FR = 5$
.

Figures 15b and 15d show the impact of different ${C_P}$
distribution structures on the centre of pressure. The tangent-cone method and DeJarnette’s approximate expression overestimate the centre of pressure, while the SOSE and FOSE methods tend to underestimate it. The Newtonian theory-derived methods overestimate the centre of pressure. Despite the variations in pressure distributions, all methods provide results accurately within 10%. The accuracy of the methodologies has an overall monotonically decreasing trend with
${C_P}$
distribution structures on the centre of pressure. The tangent-cone method and DeJarnette’s approximate expression overestimate the centre of pressure, while the SOSE and FOSE methods tend to underestimate it. The Newtonian theory-derived methods overestimate the centre of pressure. Despite the variations in pressure distributions, all methods provide results accurately within 10%. The accuracy of the methodologies has an overall monotonically decreasing trend with ${M_\infty }$
, with fluctuations and noise attributed to using different datasets and extracting data from digital plots, introducing errors.
${M_\infty }$
, with fluctuations and noise attributed to using different datasets and extracting data from digital plots, introducing errors.
4.4 Hyperplane geometry
The NASA X-43 X-plane was an experimental unmanned hypersonic aircraft designed to test multiple aspects of hypersonic flight. This vehicle contains all the geometric characteristics of high-speed systems. These include blunt leading edges with a small radius of curvature, allowing the study to explore the algorithmic and methodological transition from blunt nose methods to body methods. On the top surface, the blunt nose transitions to a single inclined ramp, allowing the study to assess the shock-wave-Mach-wave interactions, as the nose will generate expansion waves. The lower surface is more complex than the upper surface, as it is formed by a double compression ramp, transitioning to a flat surface and progressing to an expansion ramp. This surface will show how methodologies act when multiple embedded supersonic phenomena are present along a streamline, as the combination of embedded shock waves and expansion fans has yet to be investigated. The geometry described above is illustrated by Fig. 16. It is pertinent to note that the X-43 originally featured an intake below the section labeled as ${z_4}$
in Fig. 16. However, due to the complex shock-shock interactions and shock reflection phenomena in intakes, the intake was removed, and the focus shifted to external aerodynamics. For the two-dimensional geometry with the intake, refer to Navo and Bergada [Reference Navó and Bergada14].
${z_4}$
in Fig. 16. However, due to the complex shock-shock interactions and shock reflection phenomena in intakes, the intake was removed, and the focus shifted to external aerodynamics. For the two-dimensional geometry with the intake, refer to Navo and Bergada [Reference Navó and Bergada14].
X-43-like hyperplane parameterised geometry [Reference Navó and Bergada14].

The study aims to investigate the aerodynamic performance of the methods on an X-43-like geometry and the algorithmic and methodological transition from blunt nose methods to body methods. The first set of test cases focuses on analysing a two-dimensional sharp leading-edge configuration to explore the accuracy of the methods. Followed by a two-dimensional blunt leading-edge configuration to assess the algorithmic transition of methods. The two-dimensional analysis is chosen due to the X-43 fuselage’s central region resembling an extruded two-dimensional curve, see Fig. 16, with tapering towards the span-wise end. Given the X-43’s limited span, notable wingtip effects are anticipated but are disregarded in this study.
4.4.1 Computational study
A preliminary two-dimensional, Reynolds-averaged Navier-Stokes (RANS) CFD investigation is conducted using STAR-CCM to establish a validation dataset. In contrast to the work of Navo and Bergada [Reference Navó and Bergada14], which emphasises high-fidelity CFD simulations aimed at capturing the variations in mass flow rates into the scramjet as a function of angle-of-attack, this study does not prioritise the development of efficient and optimised meshes. Such optimisation would necessitate a separate systematic inquiry and exploration. Consequently, the computational model employed here concentrates on accurately representing surface quantities, with less emphasis on areas of lesser significance like the wake and downstream far-field. It is noteworthy that residual values are monitored, ideally maintaining them below $1 \times {10^{ - 3}}$
for acceptability.
$1 \times {10^{ - 3}}$
for acceptability.
The computational setup features a rectangular domain, with the inlet positioned 1.5 chord lengths ahead of the leading edge and the outlet at five chord lengths from the trailing edge. Meshing employs prism layers for boundary layers and polygonal meshes for the rest of the domain, totaling approximately 270 thousand cells. The gas is assumed to be ideal, and a K- ${\rm{\Omega }}$
turbulence model is employed owing to its superior performance in capturing near-wall behaviour. Furthermore, viscous physics are favored over inviscid, primarily due to poor residual convergence observed at the trailing edge and wake regions where inviscid separation manifests.
${\rm{\Omega }}$
turbulence model is employed owing to its superior performance in capturing near-wall behaviour. Furthermore, viscous physics are favored over inviscid, primarily due to poor residual convergence observed at the trailing edge and wake regions where inviscid separation manifests.
Results from this computational model align with analytical calculations and findings by Navo and Bergada [Reference Navó and Bergada14]. The accuracy of the CFD model in comparison to analytical calculations is evaluated in Fig. 17, where the CFD results coincide with those of the tangent-wedge method, corresponding to the analytical inviscid calculations. However, as Mach numbers increase, viscous effects become more pronounced, leading to discrepancies between the proposed CFD results and the inviscid analytical predictions. A comprehensive exposition of the complete STAR-CCM computational model is beyond the scope of this paper.
Pressure distribution over hyperplane geometry for cases A, B and C.

Three test cases are considered in this study, corresponding to the different stages of the X-43A Mach 7 mission. Firstly, a low supersonic scenario representing the aerial launch of the vehicle is considered and followed by the cruise altitude and speed of the Lockheed Martin SR71, progressing to a typical hypersonic cruise speed and altitude. Table 2 outlines the characteristics of the five test cases, while Table 6 provides a more detailed overview of the freestream flow conditions. Higher Mach numbers were omitted due to the escalating thermo-chemical effects of the gas on the aerodynamic coefficients. For instance, the hypersonic cruise test cases yield a post-normal static temperature of 2371 K, nearing the dissociation temperature of O ${{}_2}$
(refer to Table 6). This is also why a hypersonic cruise test case for the blunt nose configuration was neglected. The ideal gas law assumed in the computational model did not provide converged results in the simulations due to these effects.
${{}_2}$
(refer to Table 6). This is also why a hypersonic cruise test case for the blunt nose configuration was neglected. The ideal gas law assumed in the computational model did not provide converged results in the simulations due to these effects.
Hyperplane simulations characteristics

4.4.2 Performance with a sharp leading edge
For the sharp leading edge configuration, the leading edge nose radius ( ${R_N}$
is Fig. 16) is assumed to be equal to zero. Figures 17a, 17b and 17c present the
${R_N}$
is Fig. 16) is assumed to be equal to zero. Figures 17a, 17b and 17c present the ${C_P}$
distribution over the body’s airframe for cases A, B and C, respectively. The complete freestream conditions can be seen in Table 6. The upper and lower distributions correspond to the distributions on the right and left-hand sides of the black vertical line.
${C_P}$
distribution over the body’s airframe for cases A, B and C, respectively. The complete freestream conditions can be seen in Table 6. The upper and lower distributions correspond to the distributions on the right and left-hand sides of the black vertical line.
Due to the simulations’ two-dimensional nature, the methodologies formulated under the two-dimensional confined flow assumption provide the most accurate results. The FOSE and tangent-wedge techniques closely replicate Mach 1.5 CFD results for most surfaces. Divergence in ${C_P}$
distributions arises in the tangent body method family, notably over the trailing-edge expansion ramp, due to the original methods assuming zero
${C_P}$
distributions arises in the tangent body method family, notably over the trailing-edge expansion ramp, due to the original methods assuming zero ${C_P}$
in shadow regions. However, as explained in Sec. 2.4, adapting the tangent-wedge method with the Prandtl-Meyer relation rectifies this, significantly enhancing accuracy and aerodynamic coefficient calculations. These advanced ROM techniques maintain impressive accuracy, providing
${C_P}$
in shadow regions. However, as explained in Sec. 2.4, adapting the tangent-wedge method with the Prandtl-Meyer relation rectifies this, significantly enhancing accuracy and aerodynamic coefficient calculations. These advanced ROM techniques maintain impressive accuracy, providing ${C_D}$
and
${C_D}$
and ${C_L}$
results within 15 and 30%. The
${C_L}$
results within 15 and 30%. The ${C_D}$
error varies asymptotically with the Mach number, whereas the error in
${C_D}$
error varies asymptotically with the Mach number, whereas the error in ${C_L}$
exponentially increases. The latter trend is disregarded as performance degradation and is attributed to numerical error as
${C_L}$
exponentially increases. The latter trend is disregarded as performance degradation and is attributed to numerical error as ${C_L}$
approaches zero at the hypersonic cruise conditions, making percentage error extremely sensitive to computational truncation errors.
${C_L}$
approaches zero at the hypersonic cruise conditions, making percentage error extremely sensitive to computational truncation errors.
Van Dyke’s unified theory (UT) offers a distinctive advantage over other methods. It can accurately predict surface ${C_P}$
while avoiding the computations of the oblique shock relations, like the tangent-wedge and FOSE methodologies. Distinguished by its procedure, UT simplifies calculations by disregarding local variations in the Mach number. Instead, it relies solely on the freestream Mach number and inclination angles. As illustrated in Fig. 22a, the pressure distribution over the double compression ramp at Mach 1.5 conditions is effectively identical to the results suggested by the tangent-wedge and FOSE techniques. The remarkable accuracy of the unified theory stems from its precise linearised expressions for the oblique shock relations and the Prandtl-Meyer function. While it may underestimate the
${C_P}$
while avoiding the computations of the oblique shock relations, like the tangent-wedge and FOSE methodologies. Distinguished by its procedure, UT simplifies calculations by disregarding local variations in the Mach number. Instead, it relies solely on the freestream Mach number and inclination angles. As illustrated in Fig. 22a, the pressure distribution over the double compression ramp at Mach 1.5 conditions is effectively identical to the results suggested by the tangent-wedge and FOSE techniques. The remarkable accuracy of the unified theory stems from its precise linearised expressions for the oblique shock relations and the Prandtl-Meyer function. While it may underestimate the ${C_P}$
in the first compression ramp, it can predict a
${C_P}$
in the first compression ramp, it can predict a ${C_P}$
with the correct magnitude even after an embedded supersonic event has occurred without necessitating knowledge of the Mach number following the initial oblique shock. This adaptability becomes particularly pronounced at higher Mach numbers, where UT converges closely with the FOSE and tangent-wedge methods, as demonstrated in Fig. 22b.
${C_P}$
with the correct magnitude even after an embedded supersonic event has occurred without necessitating knowledge of the Mach number following the initial oblique shock. This adaptability becomes particularly pronounced at higher Mach numbers, where UT converges closely with the FOSE and tangent-wedge methods, as demonstrated in Fig. 22b.
In contrast, the Newtonian, MNT, tangent-cone and SOSE methods and DeJarnette’s approximate expression consistently underestimate ${C_P}$
over most surfaces. The accuracy degradation of the latter three methods is attributed to their three-dimensional nature, which leads to diminished surface pressures. Furthermore, Newtonian-derived theories prove inadequate in capturing the intricate physics of the flow, primarily because of the small inclination angles involved, causing the fundamental assumptions of Newtonian theory to falter. Consequently, these methodologies are characterised by significant errors in aerodynamic coefficients, yielding errors in
${C_P}$
over most surfaces. The accuracy degradation of the latter three methods is attributed to their three-dimensional nature, which leads to diminished surface pressures. Furthermore, Newtonian-derived theories prove inadequate in capturing the intricate physics of the flow, primarily because of the small inclination angles involved, causing the fundamental assumptions of Newtonian theory to falter. Consequently, these methodologies are characterised by significant errors in aerodynamic coefficients, yielding errors in ${C_D}$
and
${C_D}$
and ${C_L}$
no less than 80 and 100%, respectively.
${C_L}$
no less than 80 and 100%, respectively.
Low errors in aerodynamic coefficients alone do not guarantee method accuracy. Accuracy assessment requires considering the structure of the pressure distribution as well, illustrated in Fig. 17. Take the SOSE methodology as an example: It yields ${C_D}$
and
${C_D}$
and ${C_L}$
values accurate within roughly 20 and 50%, respectively, similar to the tangent-wedge and FOSE results. However, SOSE is inaccurate for this application because it incorrectly assumes three-dimensional flow physics when the flow is two-dimensional. While its pressure distribution trends match, magnitudes significantly differ. Thus, SOSE is not considered accurate in this application.
${C_L}$
values accurate within roughly 20 and 50%, respectively, similar to the tangent-wedge and FOSE results. However, SOSE is inaccurate for this application because it incorrectly assumes three-dimensional flow physics when the flow is two-dimensional. While its pressure distribution trends match, magnitudes significantly differ. Thus, SOSE is not considered accurate in this application.
The evolution of ${C_L}$
and
${C_L}$
and ${C_D}$
, along with their corresponding errors, as a function of
${C_D}$
, along with their corresponding errors, as a function of ${M_\infty }$
, is depicted in Figure 18. This figure underscores that the most accurate methods uphold the physics of the problems, as evidenced by the Mach independence principle. Evidenced by
${M_\infty }$
, is depicted in Figure 18. This figure underscores that the most accurate methods uphold the physics of the problems, as evidenced by the Mach independence principle. Evidenced by ${C_D}$
asymptotically approaching a constant value as
${C_D}$
asymptotically approaching a constant value as ${M_\infty }$
increases.
${M_\infty }$
increases.
Evolution of drag and lift coefficient, and associated error, with Mach number for Hyperplane geometry cases A, B and C.

4.4.3 Importance of nose bluntness
The accuracy of the transition from nose methods to the body methodologies is considered by cases D and E. Figure 19 shows the pressure distribution over the upper surface of the geometry. The logarithm of the x-axis has been used to emphasise the pressure distribution at the leading edge of the geometry.
Pressure distribution over hyperplane geometry for cases D and E.

The method used to predict the pressure distribution over the blunt nose was DeJarnette and Ford’s empirical blunt nose relation. This equation was developed for three-dimensional leading edges. However, the method’s results collapse reasonably well with the pressure distribution suggested by the two-dimensional CFD simulation over a wide range of conditions.
Presently, two types of transitions are employed, and they can be identified by how they predict the properties of the element following the Matching Point, see Fig. 4. Firstly, the properties of this element can be determined by using the properties of the previous element, the matching point, which yields a continuous pressure distribution. The FOSE and SOSE methodologies use this type of transition. On the other hand, the nose region can be decoupled from the body region, yielding a discontinuous distribution. Clear examples of these methods are the tangent-wedge and linearised methods seen in Fig. 19b. This discontinuity can be overcome by using blending functions, Gramola, Bruce and Santer [Reference Gramola, Bruce and Santer8] use a similar technique to blend stagnation point and acreage heating together. The discontinuity observed at the transition region correlates strongly with the Mach number, as it is smoothed naturally at the Mach 3.3 cruise condition, see Fig. 19c.
Fig. 19 shows most methodologies behaving identically to the sharp leading edge scenario, except for the FOSE technique. The FOSE method aggressively underpredicts the pressure coefficient over all the surfaces. The reduced surface pressure over all the surfaces is directly associated with the over-expansion of the flow at the nose region. The error introduced at the nose propagates downstream. It is important to note that the SOSE suggests recompression of the flow in the nose region. This recompression is caused by the shock-wave-Mach-wave interaction of the expansion waves and the body shock, highlighting this phenomenon’s importance at low-supersonic velocities. However, as proved in the previous section, shock-wave-Mach-wave interactions become less vital at higher Mach numbers, as the flow does not recompress after the nose region, see Fig. 19c.
5.0 Analysis of computational performance of methodologies
This section focuses on the computational aspects of the proposed methodologies, addressing the computational cost and optimisation of the techniques. Instead of computing aerodynamic and thermodynamic properties for each mesh element, each streamline mesh is preprocessed and simplified by identifying adjacent regions with the same inclination angle and combining them into a single element. This process is analogous to adaptive mesh refinement used in modern CFD software. The computational assessment includes modelling tangent-ogives and the HATHOR [Reference Gramola, Bruce and Santer8] aeroshell, with the former selected for its varying local inclination angles and the latter to investigate the impact of the implemented adaptive mesh refinement capabilities.
5.1 Mesh convergence
The tangent-ogive test case has an FR of 3, and ${M_\infty } = 6$
is selected due to the high reliability of the SOSE and FOSE methods under these conditions. For the HATHOR test case,
${M_\infty } = 6$
is selected due to the high reliability of the SOSE and FOSE methods under these conditions. For the HATHOR test case, ${M_\infty } = 3$
is selected due to the fact that this paper focuses on the lower supersonic regime and recompression effects of Mach-wave-shock-wave interactions are negligible at
${M_\infty } = 3$
is selected due to the fact that this paper focuses on the lower supersonic regime and recompression effects of Mach-wave-shock-wave interactions are negligible at ${M_\infty }$
larger than 3. This trend is evidenced by examining Figures 17a and 17b, where recompression becomes discernible solely in the
${M_\infty }$
larger than 3. This trend is evidenced by examining Figures 17a and 17b, where recompression becomes discernible solely in the ${M_\infty } = 1.5$
scenario, further validating the selection rationale for
${M_\infty } = 1.5$
scenario, further validating the selection rationale for ${M_\infty } = 3$
. The accuracy of the results is assessed using the Euclidean norm (L2-norm) of the differences in
${M_\infty } = 3$
. The accuracy of the results is assessed using the Euclidean norm (L2-norm) of the differences in ${C_P}$
distributions, computed by Equation (16). It is important to note that the L2 norm error is taken with respect to the same ten longitudinal positions for each mesh, as finer meshes will provide a larger error due to mesh size,
${C_P}$
distributions, computed by Equation (16). It is important to note that the L2 norm error is taken with respect to the same ten longitudinal positions for each mesh, as finer meshes will provide a larger error due to mesh size, $n$
in Equation (16), being larger and increasing the sum of the squared differences.
$n$
in Equation (16), being larger and increasing the sum of the squared differences.
Figure 20a shows the mesh convergence study for the tangent-ogive test case, where the error decreases as the mesh size increases, as expected in such studies. Unlike supersonic CFD simulations, which require hundreds of thousands of points for accuracy [Reference Innocenzi, Gramola, Fisher, Quinn, Bruce and Navarro-Martinez10], ROMs yield converged results with just a few dozen points per streamline. Multiple methodologies provide converged results for meshes with approximately 20 elements. However, the HATHOR aeroshell mesh convergence study produces different results. Figure 21a indicates that increasing mesh points has minimal impact on the error compared to the tangent-ogive case. The simulation using ROMs achieves convergence with as few as ten points per streamline but exhibits a high error due to ROMs’ limitations in capturing subsonic phenomena. Additionally, all methods yield similar results, as the algorithms treat most of HATHOR’s surface as a blunt nose and apply the same nose method, resulting in the same ${C_P}$
distribution.
${C_P}$
distribution.
 \begin{align}\left| {\left| {{C_{P,true}}(z) - {C_P}(z)} \right|} \right| = \sqrt {\mathop \sum \limits_{i = 1}^n {{\left( {{C_{P,true}}\left( {{z_i}} \right) - {C_P}\left( {{z_i}} \right)} \right)}^2}} \end{align}
Computational performance of methodologies for a tangent-ogive with $FR = 3$
.
$FR = 3$
.

Computational performance of methodologies for HATHOR.

5.2 Time complexity
Computational performance analysis goes beyond mesh convergence and accuracy metrics. Execution times and their scaling with the number of elements in the mesh must be investigated. The total execution times of the methodologies are presented in Fig. 20b and Fig. 21b, and their growth rates are modelled using either linear or logarithmic power laws, as suggested by Equation (17). Empirical tests reveal that the FOSE, tangent-wedge, tangent-cone, and SOSE methodologies exhibit linear time growth ( ${\mathcal{O}}\left( n \right)$
) with
${\mathcal{O}}\left( n \right)$
) with $m \approx 1$
, while the NT, MNT, DeJarnette’s approximate expression and UT methods follow logarithmic time growth (
$m \approx 1$
, while the NT, MNT, DeJarnette’s approximate expression and UT methods follow logarithmic time growth ( ${\mathcal{O}}\left( {{\rm{log}}\left( n \right)} \right)$
), making their execution exceptionally efficient. These results are consistent for both the ogive and HATHOR geometries, with the values of
${\mathcal{O}}\left( {{\rm{log}}\left( n \right)} \right)$
), making their execution exceptionally efficient. These results are consistent for both the ogive and HATHOR geometries, with the values of $m$
and
$m$
and $b$
illustrated in Table 7.
$b$
illustrated in Table 7.
 \begin{align}{t_{linear}}\left( n \right) = {10^b}{n^m}{t_{logarithmic}}\left( n \right) = {10^b}log{(n)^m}\end{align}
To assess the algorithms’ adaptive mesh refinement capabilities, we compare Fig. 20b and Fig. 21b. While the inclination of the log-log line is similar, the lower vertical shift (constant execution time) for HATHOR indicates faster execution for the same number of mesh elements. This outcome aligns with our expectations, considering HATHOR’s nose-cone geometry with regions of constant inclination. As a result, the algorithms’ adaptive mesh refinement capabilities are successfully verified.
The discontinuity observed at $n \approx 20$
in Fig. 21b and Fig. 21c, arises from the geometry generation process. The coarsely defined geometry mesh fails to capture the shoulder radius adequately, leading the algorithms to identify HATHOR’s surface as a blunt nose and apply only nose methods instead of a combination of nose and body methods. As the number of points increases, the shoulder curvature is captured more accurately, allowing the flow to accelerate beyond
$n \approx 20$
in Fig. 21b and Fig. 21c, arises from the geometry generation process. The coarsely defined geometry mesh fails to capture the shoulder radius adequately, leading the algorithms to identify HATHOR’s surface as a blunt nose and apply only nose methods instead of a combination of nose and body methods. As the number of points increases, the shoulder curvature is captured more accurately, allowing the flow to accelerate beyond ${M_m}$
and triggering body methods, which may involve longer execution times and significantly increase time complexity. This phenomenon is carefully noted for a comprehensive understanding of computational performance.
${M_m}$
and triggering body methods, which may involve longer execution times and significantly increase time complexity. This phenomenon is carefully noted for a comprehensive understanding of computational performance.
5.3 Direct comparison with CFD
This section compares the computational complexity of ROMs with CFD simulations, focusing on CPU time, wall time, and the number of cells/points in the mesh. The comparison is made between STAR-CCM, a parallelised CFD programme running on a computer cluster with 128 processors, and all presented ROMs executed in serial on a laptop.
Table 3 shows the computational metrics for STAR-CCM simulations and execution of all the ROMs for the HATHOR and X-43-like geometry. The wall time for STAR-CCM ranges from ${10^4}$
to
${10^4}$
to ${10^2}$
for HATHOR and the X-43-like geometry, respectively. The increase in CPU time is owed to the three-dimensional nature of the HATHOR simulations. In contrast, the execution times of all the ROMs are on the order of
${10^2}$
for HATHOR and the X-43-like geometry, respectively. The increase in CPU time is owed to the three-dimensional nature of the HATHOR simulations. In contrast, the execution times of all the ROMs are on the order of ${10^0}$
, highlighting the substantial difference in execution times between finite volume and finite element-based computational algorithms. Although STAR-CCM’s parallelisation reduces CPU time by two orders of magnitude, the execution times are still on the order of
${10^0}$
, highlighting the substantial difference in execution times between finite volume and finite element-based computational algorithms. Although STAR-CCM’s parallelisation reduces CPU time by two orders of magnitude, the execution times are still on the order of ${10^4}$
. Notably, the ROMs’ streamline tracing approach may limit parallelisation for certain methodologies that rely on a sequential approach, requiring properties upstream of the point of interest.
${10^4}$
. Notably, the ROMs’ streamline tracing approach may limit parallelisation for certain methodologies that rely on a sequential approach, requiring properties upstream of the point of interest.
Comparing execution times of STAR-CCM simulation and ROM based simulations (all ROMs applied)

Lastly, considering the number of mesh elements, finite volume-based problems demand a large number of cells, making them infeasible for non-high-performance machines. With typical computers having around 8 GB of RAM, supercomputer clusters are required to handle the memory demands of high-fidelity finite-volume simulations.
In conclusion, this comparison demonstrates the significant advantage of ROMs in terms of computational efficiency when compared to traditional CFD simulations, making them a promising alternative for rapid and iterative aerodynamic analysis.
6.0 Conclusion
This study explored the application of ROMs for the rapid and seamless prediction of aerodynamic quantities over high-speed vehicle surfaces, with a focus on challenging low-supersonic flows. A comprehensive analysis of methodologies provided insight into the accuracy and capabilities of these models. The insights gained from this investigation contribute to the understanding and limitations of high-speed aerodynamic predictive methods. Table 4 summarises all the quantitative and qualitative properties of the considered reduced-order models.
Summary of range of applicability and limitations of reduced-order models

This analysis has highlighted the utility and limitations of Newtonian theory-based methods and their behaviour. The study reveals the tendency of these methods to experience accuracy degradation in surfaces with an inclination angle close to 45 degrees, where it overpredicts pressure. Furthermore, it has been demonstrated that at high inclinations, above 45 degrees, the accuracy of Newtonian theory-based methods ceases to depend strongly on $M$
, resulting in simple functions of
$M$
, resulting in simple functions of $\theta $
to quantify the accuracy of these methods. Such methods often perform best when considering three-dimensional authentic vehicle designs, the under-predictive nature of these methods improves their performance in application where three-dimensional shock structures are present due to the relaxation phenomena of conical shocks.
$\theta $
to quantify the accuracy of these methods. Such methods often perform best when considering three-dimensional authentic vehicle designs, the under-predictive nature of these methods improves their performance in application where three-dimensional shock structures are present due to the relaxation phenomena of conical shocks.
Furthermore, the investigation has also touched upon the sensitivity to matching points, although this aspect necessitates further exploration and data to draw conclusive insights.
Shock-wave-Mach-wave interactions have emerged as crucial factors influencing pressure distribution calculations at low Mach numbers, especially for sharp tangent ogive and blunt leading edge configurations. Mach number is defined as the prevailing metric in characterising the recompression effects induced by shock-wave-Mach-wave interactions. This accentuates the dominance of shock strength over shock structure (including whether the shock is attached or detached), in the context of Mach wave reflection exhibited on convex bodies and blunt leading edge configurations.
The exceptional performance of DeJarnette’s method yielded ${C_P}$
results accurate within 2% for a wide range of conditions. Although minor departures in accuracy were observed for cones with small semi-vertex angles at low Mach numbers, the accuracy remains within 10%, suggesting this method is a reliable substitute for the numerical solution of the Taylor-Maccoll equation, which can expedite the solution provided by the tangent-cone and SOSE methods by reducing their computational complexity.
${C_P}$
results accurate within 2% for a wide range of conditions. Although minor departures in accuracy were observed for cones with small semi-vertex angles at low Mach numbers, the accuracy remains within 10%, suggesting this method is a reliable substitute for the numerical solution of the Taylor-Maccoll equation, which can expedite the solution provided by the tangent-cone and SOSE methods by reducing their computational complexity.
The computational complexity reduction achieved by ROMs over conventional finite-volume CFD simulations has been quantified. Four orders of magnitude reduction in CPU time were demonstrated, reiterating the significant contribution of finite-element ROM-enhanced simulations for expediting aerodynamic simulations while ensuring computational tractability and accuracy. In addition, mesh convergence studies demonstrate the reduced requirement of fine surface meshes to attain converged and reliable results, disregarding low-speed blunt leading-edge configurations where leading-edge mesh discretisation plays an important role in the accuracy of the method, requiring as little as 20 points per streamline to achieve converged results for sharp ogives.


 Open access