





INTRODUCTION
The magnitude and sources of waterborne (enteric) illness in Canada are not well-defined. Enteric illness is largely under-reported, and existing national and provincial surveillance systems for enteric illness do not distinguish between infections caused by food, animal contact, person-to-person, environmental, or drinking water transmission. The Public Health Agency of Canada estimates that there are roughly 20·5 million AGI cases each year (0·6 cases/person per year) [Reference Thomas1]. Of the overall burden, we estimate that 4 million cases are foodborne (and acquired domestically) [Reference Thomas1], while the remaining cases are attributed to water, animal contact, and person-to-person transmission.
Private water supplies (households) serve an estimated 12% of the Canadian population, or ~4·1 million people [2]. Eleven percent of Canadians are supplied by a private (unregulated) groundwater source, and 1% use a private surface water source (e.g. a spring, lake, river or dugout) [2]. The responsibility of managing and maintaining the quality of these water supplies falls to their owners [Reference Jones3]. Health Canada recommends that households on private wells have their water tested by a laboratory 2–3 times per year [4]; however, only 27% of households on private water supplies had their water tested in 2011 [2].
An estimated 1·7 million (4·9%) Canadians are served by small community groundwater (3·1%) and surface water (1·8%) supplies [2, 5]. For this study, a small supply is defined as a system serving <1000 people. Private and small community water systems may be more at risk for human illness than municipally operated systems in Canada [Reference Locas6–Reference Hrudey and Hrudey9]. In a review of Canadian waterborne outbreaks between 1974 and 2001, two-thirds of the outbreaks occurred at either private or semi-private systems [Reference Schuster10]. Campylobacter spp., Cryptosporidium spp., Giardia spp., and E. coli O157 were responsible for the majority (~58%) of these outbreaks, which is consistent with European trends [11]. In addition, Schuster et al. [Reference Schuster10] found that Norwalk-like viruses and rotavirus were responsible for 9·3% (14/150) of Canadian outbreaks where causative organisms were identified. This is consistent with findings in the United States [Reference Craun12], where 6% of waterborne outbreaks were due to norovirus.
There is some evidence to suggest that private well and small water system users may be at increased risk of AGI; however, the magnitude of this risk had not been quantified in Canada. The objective of the work presented herein is to estimate the number of AGI cases associated with Giardia, Cryptosporidium, Campylobacter, E. coli O157 and norovirus associated with the consumption of water from private and small community systems in Canada using a quantitative microbial risk assessment (QMRA) approach. This study is part of a comprehensive approach to quantify and attribute AGI in Canada to various sources to inform policy, research and surveillance efforts [Reference Murphy13].
MATERIALS AND METHODS
Model framework
A multi-pathogen QMRA was developed using Giardia, Cryptosporidium, Campylobacter, E. coli O157 and norovirus as these are the pathogens most commonly associated with enteric drinking water outbreaks in Canada. Five stochastic models were developed to estimate the number of AGI cases caused by each pathogen, separated into three types of drinking water supplies: private groundwater wells, small groundwater supplies (serving <1000 individuals), and small surface water supplies (serving <1000 individuals). The QMRA methodology and subsequent equations applied were adapted from Haas et al. [Reference Haas, Rose and Gerba14] and Howard et al. [Reference Howard, Pedley and Tibatemwa15] (Fig. 1). The daily probability of infection in the present study represents the probability of being infected following exposure to a water supply that is contaminated with the pathogen of interest. The annual probability of infection represents the probability of infection over a 1-year period accounting for the possibility of exposure to a water supply that is positive for pathogens (prevalence rate). In this analysis, the conversion from probability of illness to cases of illness assumed a maximum of one illness per year.
Schematic diagram of QMRA model used to estimate the disease burden of Giardia, Cryptosporidium, Campylobacter, E. coli O157 and norovirus from the consumption of water from private wells and small water systems serving <1000 people (adapted from Haas et al. [Reference Haas, Rose and Gerba14]; Howard et al. [Reference Howard, Pedley and Tibatemwa15]).

QMRA was used because no randomized control trials have been performed on small community supplies or private wells [Reference Murphy16]. To capture the uncertainty and variability associated with the estimates, inputs were described using probability distributions. The minimum, maximum, and most likely values for the variables were developed (using PERT and Uniform distributions, or raw data fit to parametric distributions such as Lognormal or Weibull) [17]. The final estimates [reported as mean with 90% probability interval (PI) around the mean] were generated using Monte Carlo simulation [10 000 iterations using @Risk (Palisade Corp., USA)]. Sensitivity analyses were performed by examining the Spearman correlation coefficients (r s ).
Model inputs
Population at risk
Using the 2011 Canadian population (34 342 800) [18], and data on the proportion of Canadians that consumed water from private and small system groundwater and surface water supplies [2], the approximate population on each of these water supplies was estimated: 1 068 830 individuals on small municipal groundwater systems, 614 128 individuals on small surface water systems, 4 138 080 individuals on private wells, and 22 246 976 individuals on large municipal systems. The proportion of Canadians that report exclusively consuming bottled water and the proportion of households that reportedly treat their water at the intake to their home and state that this is to treat for bacteria [2] were excluded (Table 1). The proportion of children (⩽10 years), adults (11–64 years) and elderly ⩾65 years) were estimated [18] to generate age-specific incidence rates (Table 2).
Estimation of the population at risk that consumes water from private wells and small system supplies in Canada

GW, Groundwater; SW, surface water.
* Applies to private wells.
† Applies to small GW and small SW systems.
Population served by private wells and small system water supplies in Canada, and water consumption distribution inputs by age group (children, adults, elderly)

GW, Groundwater; SW, surface water.
* Age categories in the 2011 census (Statistics Canada [5]) were ⩽10 years for children (17·1%); 15–64 years for adults (65%); ⩾65 years for the elderly (17·9%). No adjustments were made to reconcile these census categories with the water consumption categories.
Water consumption
Water consumption data collected from a Canadian community survey were used to develop consumption inputs for three age groups: ⩽10 years (n = 132), 11–64 years (n = 1636) and ⩾65 years (n = 331) (raw data from [Reference Pintar19]), and fit to a lognormal distribution [Reference Roseberry and Burmaster20].
Canadian groundwater and surface water pathogen occurrence and concentration data
All inputs for both pathogen prevalence rates (PR) and concentration (C) in groundwater [Reference Hynds, Thomas and Pintar21] and surface water were derived from the published literature (Tables 3, 4; Supplementary Tables S1, S2). Data were obtained from those studies that examined pathogen occurrence under ‘non-outbreak’ conditions. Canadian pathogen data were included where available. In the absence of Canadian data, US studies were used. Where Canadian or US data were unavailable, international studies were used. It was assumed that reported non-detects or zero values from the literature were zero.
Groundwater pathogen inputs selected for use in the private well and small groundwater system QMRA models for Giardia, Cryptosporidium, Campylobacter, E. coli O157 and norovirus
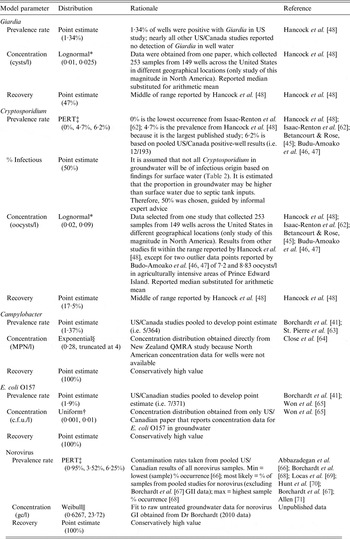
c.f.u., Colony-forming units; gc, genomic copies; MPN, most probable number; QMRA, quantitative microbial risk assessment.
* Lognormal distribution (arithmetic mean, standard deviation).
†Uniform distribution (minimum, maximum).
‡ PERT distribution (minimum, most likely, maximum).
§ Exponential distribution (scale parameter).
|| Weibull distribution (shape parameter, scale parameter).
Surface water pathogen inputs selected for use in the small systems QMRA models for Giardia, Cryptosporidium, Campylobacter, E. coli O157 and norovirus
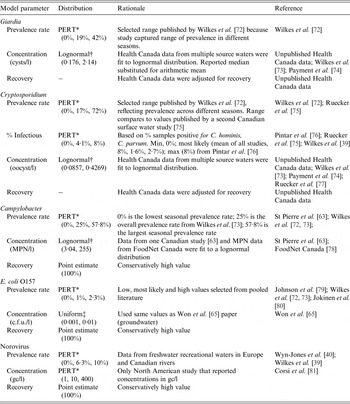
c.f.u., Colony-forming units; gc, genomic copies; MPN, most probable number; QMRA, quantitative microbial risk assessment.
* PERT distribution (minimum, most likely, maximum) – expert judgement informed the choice of minimum, mode and maximum values when the literature were sparse (for example, a minimum value of 0% was included based on our understanding that samples could be negative for this pathogen).
† Lognormal distribution (arithmetic mean, standard deviation).
‡ Uniform distribution (minimum, maximum).
For small groundwater and surface water systems, the level of treatment applied (log reduction) was considered based on the treatment systems currently in place in Canada (Fig. 1). Using data from the Survey of Drinking Water Plants [5], 19 treatment types were developed (Supplementary Table S3: Treatment types). These treatment types were further combined into the following five categories.
-
(1) No treatment.
-
(2) Membrane filtration (micro- or ultra-filtration) with chemical disinfection (with/without other treatment, but no UV disinfection).
-
(3) Media filtration (with/without other treatment, but no UV or membrane filtration).
-
(4) Chemical disinfection (ozone, chlorine, chlorine dioxide, or chloramines) with/without coagulation/ flocculation/sedimentation, but no filtration or UV disinfection.
-
(5) UV and chemical disinfection (with/without other treatment).
Specific log removal/inactivation ranges were developed using the minimum and maximum levels of treatment that could be achieved for each pathogen and each of the original 19 treatment categories and source water types (ground vs. surface). These values were developed from literature references compiled by Health Canada for various treatment types for five reference pathogens: Giardia, Cryptosporidium, rotavirus (used as a proxy for norovirus treatment in this QMRA), Campylobacter and E. coli (based on studies used for the Health Canada QMRA model) [Reference Douglas34]. As no single virus has all the characteristics of an ideal reference virus, this risk assessment incorporates the key characteristics of rotavirus, with CT values based on hepatitis A virus (HAV) and poliovirus [United States Environmental Protection Agency (USEPA, 1999)] as the best currently available disinfection information for enteric viruses commonly found in surface water and groundwater sources (Health Canada, 2011). For each of the five treatment categories above, the log-reduction ranges were combined and PERT log removal distributions were developed such that each source water type, treatment category, and pathogen has a unique distribution. Mode values are based upon population-weighted fitting (sampling from population size/treatment level combinations for each pathogen/treatment combination) (Supplementary Table S5). Applying a PERT distribution is less sensitive to the extremes of the distribution than a triangular distribution and more sensitive to the most likely value (mode) [17].
Previously published dose-response models for each of the five pathogens were obtained from the peer-reviewed literature (Table 5). The morbidity factor (P ill/inf) for each organism is presented in Table 5. These values were based on an in-depth literature review conducted by USEPA [22].
Dose-response functions and morbidity values selected for the Giardia, Cryptosporidium, Campylobacter, E. coli O157 and norovirus models

* It was assumed that the entire population lacks immunity to norovirus.
RESULTS
Estimated daily and annual probabilities of infection, numbers of cases of infection/year and the corresponding cases of illness/year for all five pathogens for all three water supplies are presented in Tables 6, 7, and Supplementary Tables S6–S8.
Estimated total number of domestically acquired Canadian cases of Giardia, Cryptosporidium, Campylobacter, E. coli O157 and norovirus attributable to private wells, small groundwater systems and small surface water systems

GW, Groundwater; SW, surface water; PI, Probability interval.
* Data from Public Health Agency of Canada foodborne illness estimates [Reference Thomas1]
† Sum of projected illnesses attributable to private wells and small systems divided by total estimated Canadian cases.
Comparison of AGI incidence rates by water source type and treatment system category

AGI, Acute gastrointestinal illness.
* Incidence rate = cases/p-yr.
Private wells
QMRA models estimated a total of 78 073 cases of illness/year (90% PI 38 466-128 109) resulting from consumption of water containing Giardia, Cryptosporidium, Campylobacter, E. coli O157 and norovirus from untreated private wells in Canada (Supplementary Table S6). This corresponds to ~0·027 AGI cases/person-year (p-yr) for those consuming water from these supplies. Norovirus is estimated to be responsible for 71·2% of symptomatic cases (n = 55 558), followed by Campylobacter (n = 9273, 11·9%), Cryptosporidium (n = 11398, 14·6%), Giardia (1207, 1·53%) and E. coli O157 (637, 0·82%).
Small groundwater systems
The small groundwater systems models predicted that 13 035 cases of illness/year (90% PI 3416-25 698) are attributable to Giardia, Cryptosporidium, Campylobacter, E. coli O157 and norovirus associated with the consumption of water from small groundwater supplies serving <1000 people (Supplementary Table S7). This is an incidence of ~0·016 AGI cases/p-yr for those consuming water from these supplies. Similar to private wells, norovirus was responsible for the majority of cases (n = 10869, 83·4%) followed by Cryptosporidium (n = 1639, 12·6%), Campylobacter (n = 378, 2·90%), Giardia (n = 121, 0·93%) and E. coli O157 (n = 28, 0·21%).
Small surface water systems
It is estimated that 12 122 cases of illness/year (90% PI 2974-26 274) are attributable to the consumption of water from small Canadian surface water systems (serving <1000 people) as a result of Giardia, Cryptosporidium, Campylobacter, E. coli O157 and norovirus (Supplementary Table S8). This corresponds to an incidence of 0·026 AGI cases/p-yr for those consuming water from these supplies. Norovirus is responsible for the majority of cases of illness (n = 9003, 74·3%), followed by Giardia (n = 2288, 18·9%), Campylobacter (n = 513, 4·23%), Cryptosporidium (n = 317, 2·62%) and E. coli O157 (n = 1, 0·008%).
Waterborne AGI
In Canada, it is estimated that there are 20·5 million AGI cases that occur annually (0·6 cases/p-yr), after accounting for under-diagnosis and under-reporting [Reference Thomas1]. This includes both domestically acquired and travel-acquired AGI. Of the total 20·5 million, an estimated 4 million (20%) domestically acquired cases are attributed to food [Reference Thomas1]. The current study estimates that ~103 230 cases (0·003/p-yr), or 0·51%, of the total are attributed to the consumption of water from private wells and small water systems (Table 6).
When comparing cumulative projected AGI incidence rates from all reference pathogens by system type and treatment category, those served by surface water systems with no treatment (0·098 cases/p-yr) or only one treatment barrier, such as chemical disinfection (0·037 cases/p-yr) are more at risk than those served by groundwater systems or private wells (Table 7). Incidence rates for those served by untreated groundwater or private wells were the same (0·027 cases/p-yr) and were slightly lower than for those served by groundwater systems treated by chemical disinfection (0·016 cases/p-yr), membrane filtration (0·008 cases/p-yr) or media filtration (0·012 cases/p-yr). The lowest incidence rates were estimated for individuals served by surface water or groundwater sources with both UV and chemical disinfection (0·0005–0·001 cases/p-yr).
Sensitivity analysis
Sensitivity analyses were performed to determine model input contributions to each model (Supplementary Table S4). Pathogen concentration was predictably correlated with estimated numbers of illnesses, appearing in the top three factors in all pathogen models with the exception of norovirus (r = 0·442–0·866), and was the most highly correlated input in both protozoan models. The lack of correlation for norovirus is due to the estimated high exposures for a small fraction of private wells and small systems; for which, the corresponding annual probability of infection is nearly 100%. The prevalence rate was significantly correlated with outputs from the Cryptosporidium, E. coli O157 and norovirus models (r = 0·267–0·755). Daily adult water consumption was a significant input in both the Giardia (r = 0·187) and Campylobacter (r = 0·195) models.
DISCUSSION
This study is part of a larger effort to quantify and attribute AGI in Canada to various sources, including drinking water. The objective of the work presented herein is to estimate the number of AGI cases caused by Giardia, Cryptosporidium, Campylobacter, E. coli O157 and norovirus attributable to the consumption of water from private wells and small community systems in Canada using a QMRA approach.
In Canada, the majority of drinking water systems are small systems. There are significant challenges faced by these systems, which have been identified nationally and internationally as a priority in the drinking water treatment and public health communities. The World Health Organization (WHO) has identified management of small community drinking water supplies as a critical issue for sustainable development and health [23]. The Office of the Inspector General within the USEPA also conducted an evaluation and concluded that effort and resources are needed to help small drinking water systems overcome the challenges to delivering safe drinking water [24]. In Canada, federal, provincial and territorial governments have long recognized the importance of supporting small drinking water systems in the delivery of safe water.
Small drinking water systems face the same issues as larger municipal drinking water systems in the provision of safe water. In 2011, the National Collaborating Centre for Environmental Health (NCCEH) published a report that examined the issue of waterborne disease risks in Canadian small drinking water systems. They found a high proportion of waterborne disease outbreaks occurred in small drinking water systems serving <5000 people [25]. While the challenges small systems face are similar to large systems, they are usually operating with fewer people, who have less experience and technical knowledge [Reference Pons26]. Small systems often find it difficult to hire and retain staff with sufficient technical knowledge. In addition, they often have limited time to dedicate to the operation of these systems, as drinking water operators/managers are often responsible for other operations in the community [27]. Distribution system issues exist in small systems too, including inadequate maintenance, high water losses, cross-connections, frequent breaks and slow replacement [25]. Northern communities have unique challenges, due to the presence of permafrost, extreme cold and lack of year-round road networks, as well as difficulty accessing laboratories.
Source protection, adequate treatment and continued monitoring are the tenets of a safe and robust drinking water supply, regardless of size [Reference Huck and Coffey28]. With small systems, there are more elusive factors associated with the effective operation of a treatment system and delivery of safe water. A recent Canadian study emphasizes the utility of developing water safety plans for small and large water systems and the importance of building community readiness through early engagement [Reference Kot, Castleden and Gagnon29] to reduce the risk and burden of waterborne illness.
Risk by drinking water source and treatment category
The combination of source water type (ground vs. surface) and level of drinking water treatment influence the microbial and chemical quality of drinking water. This study illustrates that those individuals served by small surface water systems could be more at risk of AGI than those served by private wells or small groundwater systems (in terms of incidence rates, as shown in Table 7). This study also illustrates that those served by untreated surface water supplies could be at greatest risk for waterborne AGI, although only about 6000 Canadians rely on water from this category. The risk of exposure to waterborne pathogens in small untreated surface water supplies has previously been well documented [Reference Craun12]. Conversely, drinking water systems that treat with UV disinfection are estimated to be at much lower risk for AGI, for both ground and surface water sources. This is attributed to the efficacy of UV disinfection for the inactivation of pathogens in water [Reference Craik30–Reference Hijnen, Beerendonk and Medema32].
Small water systems typically have fewer treatment barriers in place compared to larger systems and risk is inherently greater [5, Reference Hrudey and Hrudey9]. Small surface water supplies that only chlorinate will be more vulnerable to Cryptosporidium and Giardia as these organisms are highly resistant to chlorine; whereas a system with multiple barriers (e.g. coagulation, flocculation, filtration, disinfection) is more effective at removing these protozoa [Reference Betancourt and Rose33, Reference Douglas34].
This work illustrates the efficacy of UV disinfection at inactivating pathogens, reducing the likelihood of AGI cases attributed to drinking water. UV disinfection is highly effective (>4 log) at inactivating Giardia, Cryptosporidium, Campylobacter, E. coli O157 and norovirus [Reference Douglas34]. Although membrane filtration is a robust treatment technology, microfiltration has a nominal pore in a range that will allow viruses to pass through. It is not as effective against rotavirus as UV disinfection [Reference Douglas34].
This study also illustrates the impact of private well water quality on the overall burden of waterborne illness in Canada. Engaging private homeowners in the important responsibility of maintaining their wells, treating their drinking water supply, and routinely testing their water is a shared responsibility. Public engagement on the issue of safe well water and stewardship continues to be limited by complacency, inconvenience, cost and privacy concerns, identified consistently by those examining stewardship behaviour of private well owners in Newfoundland [Reference Roche35], Ontario [Reference Hexemer36], and across Canada [Reference Kreutzwiser37].
Norovirus
We estimate between 74% (private wells) and 83% (small groundwater systems) of predicted AGI cases are attributed to norovirus. However, the norovirus dose-response relationship and mechanistic interpretation is subject to considerable debate [Reference Schmidt38] and may need to be revised as improved dose-response information becomes available.
Few published studies have examined the prevalence and concentration of norovirus in Canadian surface water and groundwater systems and this is an identified knowledge gap. The prevalence rate for norovirus in surface waters was based on one Canadian study of rivers [Reference Wilkes39] and a study of recreational waters in Europe [Reference Wyn-Jones40]. With respect to groundwater, we recognize that the developed models do not reflect variations in local hydrogeology, which have a significant influence on the transient nature of virus prevalence and concentrations [Reference Borchardt41].
Norovirus contributes greatly to the total burden of enteric disease in Canada (~3·4 million cases annually) [Reference Thomas1], yet is both under-reported and under-diagnosed, and is not routinely included in national surveillance platforms for enteric illness. In this study, it is estimated that 2·23% of all annual, domestically acquired norovirus cases in Canada could be the result of consumption of water from small or private Canadian water supplies. This is similar to what has been reported in other countries; in the United States, 1·5% of reported norovirus outbreaks between 2010 and 2012 were linked to waterborne transmission [Reference Leshem42]. Similarly, norovirus was found to be the most common pathogen contributing to waterborne disease in groundwater systems in Norway [Reference Kvitsand and Fiksdal43]. Future work to consider the impact of secondary transmission in the epidemiology of waterborne norovirus infections could consider the rate of community cases attributed back to these initial illnesses, given its high infectivity.
Cryptosporidium and Giardia
The developed model predictions that 13 354 and 3616 cases of Cryptosporidium and Giardia, respectively, occur in Canada each year from the consumption of untreated or inadequately treated groundwater or surface water from private wells and small water systems. The disease burden for Giardia infections in Canada is high and ranks in the top three reported enteric infections provincially and nationally, with a national incidence rate of 11·43 cases/100 000 people per year [44]. While the cryptosporidiosis disease burden in Canada is lower (1.82 cases/100000 people per year), the number of predicted cases of Cryptosporidium is roughly 9 and 14 times greater in private wells and small groundwater supplies, respectively, than the predicted cases of Giardia in the same systems.
Occurrence studies show that Cryptosporidium oocysts are more prevalent in groundwater sources than Giardia cysts [Reference Betancourt and Rose45–Reference Hancock, Rose and Callahan48], primarily due to their smaller size, which allows for more rapid downward ingress through overburden layers [Reference Solo-Gabriele49]. Moreover, Cryptosporidium oocysts are more resistant to low subsurface temperatures and thus persist in the environment for longer periods of time [Reference Carmena and Mendez-Vilas50]. In addition, Cryptosporidium is more resistant to chemical disinfection than Giardia [Reference Korich51]. Many private or small system groundwater sources are actually undocumented GUDI (groundwater under the direct influence of surface water), which explains the reported presence of oocysts/cysts in these waters [52]. In fact, the presence of large diameter pathogens such as Cryptosporidium or Giardia in groundwater is sometimes used to define a GUDI water source [53].
Campylobacter
Campylobacter is the leading cause of bacterial gastrointestinal illness in Canada, with an incidence of 29·3 cases/100 000 people per year in 2012 [44]. In this study, we estimate that Campylobacter is the third leading cause of waterborne AGI in private well and small water system users in Canada. This represents an estimated 4·76% of an estimated 213 000 domestically acquired cases of Campylobacter that occur annually in Canada, after accounting for under-reporting and under-diagnosis [Reference Thomas1]. A recent source attribution study of campylobacteriosis using a systematic review and meta-analysis framework demonstrated that untreated drinking water is a significant risk factor [Reference Domingues54]. Previous Canadian studies have demonstrated that private wells are a risk factor for campylobacteriosis [Reference Lévesque55].
E. coli O157
The E. coli O157 QMRA model estimated that 666 cases were attributable to the consumption of untreated or inadequately treated water from private wells, small surface water or small groundwater supplies. In Canada, the incidence rate for verotoxigenic E. coli (VTEC) is 1·81 cases/100 000 people per year based on reported cases [44]. In a review of E. coli O157 outbreaks 1982–2002 in the United States, 15% of all outbreak cases were linked to the consumption of drinking water [Reference Rangel56]. Similarly, a source attribution study of E. coli O157 infections in the United States found that 5% of sporadic infections and 73% of outbreak infections were associated with consumption of untreated water [Reference Cole57]. In Canada, private well water and small system supplies are recognized risks of E. coli O157 infection [Reference Hrudey58, Reference Michel59].
Study limitations/model uncertainty
These models rely on data from the literature and some Canadian surveillance systems, and thus are not site-specific and do not reflect the influence of local hydrogeology, as well as temporal and spatial differences specific to local systems. Rather, the models are designed to reflect the range of likely scenarios for small water systems and private wells in Canada. The inputs are designed to encompass both site-to-site variability and uncertainty in the enteric pathogen concentration and prevalence rates of Canadian groundwater and surface water supplies. The models are limited by data availability. Where pathogen data were available, few studies documented pathogen concentrations in the source water; only 10 of 22 North American studies of Campylobacter, E. coli O157 and norovirus documented concentrations, of which two reported only zero values/non-detects, and the remaining reported presence/absence results (Supplementary Tables S1, S2). While we attempted to capture the influence of seasonality on input distributions, by including multi-year studies, these data were not always available. The concentration and prevalence rate (occurrence) of pathogens in Canadian source waters, collected over multiple years, are crucial data needed to refine future burden estimates.
Dose-response models continue to be a limitation of all QMRA models [Reference Havelaar and Swart60]. Additionally, the ratios for the probability of illness given infection do not account for variations we would expect in various sub-populations or the dependence of morbidity upon dose [Reference Gerba, Rose and Haas61]. The uncertainty around the infectivity of different strains and genotypes of an organism, as well as the large variability in host/pathogen interactions, contributes to the uncertainty in the outputs. Future knowledge gaps that could be explored include: (1) rigorous reporting of outbreak details (attack rates for different subtypes of organisms), and (2) community aetiology studies to examine the prevalence of asymptomatic carriage of pathogens.
Deriving a burden estimate by focusing on specific (reference) pathogens may under-estimate illness. There is the potential that there are additional AGI cases attributable to other pathogens, such as Shigella, Salmonella, and other enteric viruses [Reference Schuster10]. The continued development and optimization of (clinical and environmental) pathogen detection methods will help to further inform which pathogens are most often associated with AGI, and refine our estimate. Despite these inherent limitations, the five pathogens that were used are recognized waterborne reference pathogens (for both the WHO and Health Canada drinking water guidelines) and thus, are considered to adequately represent the majority of known microbial risks from these water supplies. Another consideration that was not explored in this analysis but could influence our understanding of risk is the role that socioeconomic factors play in the burden of waterborne disease, both in urban and rural areas.
Finally, it is important to note that this study did not consider waterborne illness from recreational water, or water for other uses such as irrigation, medical uses, or building water systems. Other types of waterborne illness, such as respiratory illnesses, eye, ear or skin infections, and wound infections were also not considered. Future iterations of this work could assess the burden of the broader spectrum of waterborne diseases, to inform the appropriate allocation of resources and public health interventions.
CONCLUSIONS
Based on QMRA estimates, the consumption of untreated private well water or inadequately treated water from small surface water and groundwater supplies in Canada may be responsible for an estimated 103 230 AGI cases annually (90% PI 52 419–166 286), representing a small proportion of the burden when considering other routes of transmission. By pathogen, waterborne AGI is attributed to norovirus (73%), Cryptosporidium (13%), Campylobacter (10%), Giardia (3·5%), and E. coli O157 (0·6%) in this study.
The results indicate that those served by small surface water systems in Canada with no treatment or inadequate treatment (e.g. chemical disinfection only) are more at risk for AGI than those served by untreated or inadequately treated groundwater supplies. Private wells and small water systems on both surface and groundwater systems are potential sources of parasitic, viral and bacterial infections. Previous Canadian studies focusing on waterborne outbreaks have made similar conclusions [Reference Hrudey and Hrudey9, Reference Schuster10]. The results continue to illustrate the efficacy of water safety interventions, including the combined use of physical removal with UV and chemical disinfection, for small and private systems, regardless of water source, to reduce public health risk and AGI rates.
Small drinking water systems face the same issues as larger systems with respect to producing potable water; however, they typically have fewer resources, experience and technical knowledge. This is a significant challenge when faced with additional operational objectives, such as implementing a multiple barrier approach based on risk assessment and risk management. The key strength of multi-barrier systems is that the limitations or failure of one or more barriers may be compensated by the effective operation of the remaining barriers [88]. A multiple barrier approach requires an understanding of the hazards, an assessment of the potential risks through the entire drinking water system, and resources to implement a management plan to address those risks. New research focusing on the importance of community engagement in the delivery of safe water, and the utility of water safety plans [Reference Kot, Castleden and Gagnon29] may help to inform next steps for communities relying on small water systems. Engaging private well owners in the stewardship of their wells is an ongoing responsibility shared by private well owners and governments at all levels, and can be facilitated by effective knowledge translation strategies to inform Canadians about known risks and effective treatment technologies to reduce risk.
In addition to providing a mechanism to assess the potential burden of AGI attributed to small systems and private well water in Canada, this research demonstrates that QMRA is an effective source attribution tool when there is a lack of randomized controlled trial data to evaluate the public health risk of an exposure source. QMRA is also a powerful tool for identifying existing knowledge gaps on the national scale to inform future surveillance and research efforts.
SUPPLEMENTARY MATERIAL
For supplementary material accompanying this paper visit http://dx.doi.org/10.1017/S0950268815002071.
ACKNOWLEDGEMENTS
We acknowledge Dr Mark Borchardt and the research team of the Wisconsin WAHTER Study (Water and Health Trial for Enteric Risks) and Dr Beth Parker and the Ontario Ministry of Research and Innovation Ontario Research Fund (Research Excellence Round 3 Project no. 03–061) for their contribution to the norovirus datasets used in this publication. We also acknowledge the contributions of Dr Michael Messner US EPA, Dr Michael Beach US CDC, and Dr Julia Gargano US CDC.
DECLARATION OF INTEREST
None.


 Open access

