1 Introduction
At first glance, Latin American democracies follow the global trend of political apathy. Traditional measures of political participation have shown significant declines: fewer citizens identify with political parties, a trend related to and exacerbated by the deinstitutionalisation of the party system (Lupu, Reference Lupu2025), and voter turnout has declined. In parallel, widespread dissatisfaction with democratic institutions has led to polarised elections and a resurgence of extremist and populist politics. Thus, there is an apparent retreat from formal political engagement that operates alongside democratic dissatisfaction. However, this first glance overlooks important dimensions of contemporary political engagement in Latin America. While citizens may be turning away from traditional political institutions, political activity continues to expand beyond elections and parties. We observe not only a shift in the forms and modes of participation, with an increase in the use of non-political activities for political purposes or in a political context, but also in the arenas from which political participation emerges and develops.
Across the region, parent association meetings serve as venues for contesting educational policy, religious gatherings become launch points for moral campaigns targeting legislative agendas, and indigenous community assemblies evolve into sites for developing governance practices that enhance negotiating capacity with state authorities. These patterns demonstrate that sustained and substantive citizen engagement with political life exists, especially in social arenas that increasingly function as political arenas, where citizens often find a sense of political efficacy that they cannot find in traditional political spaces.
Recent political developments across Latin America underscore the political significance of these social arenas. In Colombia’s peace agreement process, groups linked to religious conservatives on one side and women’s and LGBTQ+ organisations on the other wielded significant influence over negotiation outcomes. Rather than through traditional party structures, mobilisation emerged and was exercised in religious spaces and social organisations (Céspedes-Báez, Reference Céspedes-Báez2016; Corredor, Reference Corredor2021). Indigenous communities and feminist organisations served as important spaces for organising Ecuador’s social uprising in October 2019 (Ríos Rivera et al., Reference Ríos Rivera, Umpierrez de Reguero, Vallejo Robalino, Ríos Rivera, Umpierrez de Reguero and Vallejo Robalino2020). In Peru, we saw teachers’ unions and rural patrols as key spaces for the mobilisation in favour of Pedro Castillo, which helped make him, a virtually unknown person, a viable candidate in the 2021 elections (Arce, Reference Arce2023; Muñoz, Reference Muñoz2021). In Guatemala in 2019, we witnessed the electoral triumph of the Movimiento Semilla, a movement born out of anticorruption mobilisations, whose victory was defended by movements rooted in indigenous communities. Across the region, teacher unions have served as important spaces for the organisation of protests and strikes against education reforms, and religious group meetings have served as arenas for mounting counter-reform initiatives targeting reproductive rights, LGBTQ+ rights, and changes to the educational curricula (Gindin et al., Reference Gindin, Casco and Becher2025; Payne, Reference Payne and Rossi2023; Ramírez Plascencia, Reference Ramírez Plascencia2018).
Political participation research in Latin America has recognised the political relevance of social arenas, documenting how engagement in community organisations, religious groups, and local associations builds social capital, develops civic skills, and enhances subsequent electoral participation (Boulding et al., Reference Boulding, Foxworth and Verner2025; Carreras and Bowler, Reference 91Carreras and Bowler2019; Hale, Reference Hale2024; Wilson and Gianella-Malca, Reference Wilson and Gianella-Malca2019). This scholarship has established clear connections between social participation and traditional political engagement. However, it has primarily conceptualised participation in social arenas as a precursor to political participation. Social arenas are often seen as spaces where citizens develop capacities that they later deploy in ‘political’ venues, such as elections or party/political organisations meetings (Boulding and Holzner, Reference Boulding and Holzner2020; Hochstetler and Friedman, Reference Hochstetler and Friedman2008). We argue that these social arenas often function as political arenas themselves, where citizens directly engage in political forms of participation, including collective decision-making, articulation of demands, and negotiation with authorities, with the explicit objective of making political demands or challenging established political arrangements. Our central finding is that social and political arenas are related but distinct spheres of political engagement; they are neither interchangeable nor merely precursors to one another, but constitute independent venues in which forms of political participation occur. Rather than preparing citizens for political engagement elsewhere, these social arenas often serve as the primary venues for political participation, particularly when formal institutional channels prove weak, inaccessible, or unresponsive to citizens’ needs.
1.1 Research Approach and Contribution
This Element tackles four key questions about the nature of political participation in contemporary Latin America: Do social arenas function as complements to traditional political arenas, serving as training grounds that ultimately channel citizens towards political engagement in the electoral or institutional arena, or do they operate as independent venues for political action when other channels prove inadequate? Who is more likely to engage politically through social arenas? Moreover, given broader social changes such as declining union membership, weakening Catholic Church influence, and increasing political fragmentation, how politically consequential are social arenas in shaping political outcomes? Finally, what are the implications of political participation in social arenas for democracy, considering that individuals who are more likely to participate in these spaces are also more likely to feel disenfranchised in traditional political arenas? These questions challenge conventional understandings of political participation that privilege formal institutional spaces and suggest the need for a more expansive framework that recognises the independent political value of social arenas.
Our conceptual approach is grounded in studies that distinguish between the various components of participation (Hofer and Kaufmann, Reference Hofer and Kaufmann2023; Jasper, Reference Jasper2021; van Deth, Reference van Deth2014). We separate the components into forms (specific activities, such as voting or petitioning), modes (broader styles, including conventional/institutional or unconventional/contentious participation), and arenas (the spaces where participation occurs). We argue that by focusing primarily on forms and modes that originate in traditional political arenas (the electoral arena and party headquarters), existing research overlooks how these same forms of participation increasingly emerge from social arenas such as religious and community meetings, educational spaces, and others.
We contend that while traditional political arenas – such as electoral spaces, party meetings, and other conventional institutionalised spaces – are undoubtedly important for democracy and the political life of a country, much political participation emerges and takes place in social arenas. We propose that social arenas can and do function as political arenas, where political ideas and identities are developed, and initiatives are propelled. Drawing on data from the AmericasBarometer (LAPOP) and three targeted case studies – Chile, Peru, and Guatemala – we examine how citizens engage politically when traditional political arenas fail to function as spaces that foster a sense of political efficacy. Our approach combines regional analysis of participation trends with case studies to explore the correlates of participation in political and social arenas.
The Element has five additional sections and a short conclusion following this introduction. Section 2 presents our argument in detail, including our conceptualisation of political participation and arenas. Section 3 analyses participation across Latin America using LAPOP data, demonstrating that participation in social arenas follows distinct patterns from participation in conventional institutional arenas, such as elections and parties, suggesting that they represent independent rather than solely complementary spaces for political engagement. We identify three focal arenas for our case studies: school-related spaces (parent associations, teacher unions, and student movements), religious meetings, and local social arenas (including indigenous and peasant communities, as well as community improvement and security spaces). Our analysis reveals significant demographic patterns: men participate more in traditional political arenas, while women favour social arenas, and indigenous people show notably higher participation in local social arenas. We also find that while participation in the electoral arena positively correlates with democratic values, participation in social arenas shows a more complex relationship with democracy, which we attribute to the fact that individuals who participate politically in these spaces are more likely to feel or be excluded from traditional political arenas. Finally, Sections 4–6 develop our three case studies: Guatemala, Peru, and Chile. Using national data (household surveys, census data, and opinion polls) and narrative accounts, we illustrate the political significance of participation in social arenas. In the case of Guatemala, we highlight the role of indigenous governance systems in the defence of electoral outcomes. In Peru, we show how parent associations and religious groups contributed to educational counter-reforms, and how local social arenas were key to the election of Pedro Castillo. Finally, in Chile, we show how student organisations contributed to the reshaping of national politics. Our case studies offer detailed accounts of how citizens in these countries have utilised their participation in social arenas to advance their political initiatives.
Through our regional analysis and case studies, we demonstrate that citizens exercise political agency outside traditional political spaces, with significant and far-reaching political consequences. We also show that social arenas serve as important political spaces for marginalised groups and that participation in these arenas has profound implications for democracy. This Element provides a general overview of the region, with case studies that highlight the political significance of social arenas. We conclude by highlighting the need for further in-depth studies of political participation in social arenas.
2 Arenas of Political Participation
Democracy fundamentally depends on how citizens engage with political processes, making political participation a crucial component. This has been widely recognised in democratic participatory theory, which highlights how participation in different arenas can foster both democratic skills and attitudes and generate a sense of political efficacy (the belief that one can influence politics), which is important for a healthy democracy (Pateman, Reference Pateman1970). While minimal procedural views of democracy regard electoral participation as sufficient for democracy (Schumpeter, Reference Schumpeter1975), most contemporary studies of both democracy and political participation recognise the importance of participation beyond elections. As posited by E. Chapman (Reference Chapman and Chapman2022, pp. 21–22): ‘No serious scholar of democracy believes that voting is all that is required to realise democracy in practice. […] Even the democratic value of voting itself depends on the quality of agenda-setting processes and the ability of citizens to form their political opinions freely.’ Thus, to look at political participation, we need to look beyond the polls.
In this Element, we make a point of differentiating among forms, modes, and arenas of political participation. As we will discuss in more detail further, forms are the practices, modes are the larger styles or logics of participation (such as conventional/institutional participation that includes voting, partisanship, and things like formal petitioning), and arenas are the spaces either physically or socially constructed in which participation is formed and exercised (Cornwall, Reference Cornwall2004; Jasper, Reference Jasper2021).Footnote 1
We argue that in Latin America, viewing political participation as limited to the institutional and contentious modes that emerge from traditional political arenas occludes the vast array of political participation that arises from social arenas. Thus, our study builds upon longstanding discussions in political theory, particularly regarding citizens’ capacity to engage politically through everyday interactions (Curato, Reference 92Curato2019; Dzur, Reference 93Dzur2019; Mansbridge, Reference Mansbridge2003, Reference 97Mansbridge1983), thereby generating new spaces or transforming existing ones into arenas of political engagement and participation (Pogrebinschi, Reference Pogrebinschi2023).
Examining political participation that emerges from social arenas is crucial for two reasons. First, while institutional/conventional modes of participation are in decline, the story is more complex when examining unconventional forms of participation and civil engagement (Hay, Reference Hay2007). As Inglehart and Catterberg (Reference 95Inglehart and Catterberg2002, p. 301) summarised for Western democracies, there seem to be ‘two divergent trends: on one hand, the bureaucratized and elite-directed forms of participation such as voting and party membership have declined, while individually-motivated and elite-challenging forms of participation have risen’. In both Latin America and Western Europe, we see a decline in traditional forms of political participation in political arenas. However, in Western European democracies, we have seen a rise in individually motivated, postmodernist participation, which is more elite-challenging than elite-directed. In contrast, political participation in Latin America takes both conventional and unconventional forms and is both elite-directed and elite-challenging; however, it is increasingly emerging from social arenas that function as political ones. For example, participants in and organisers of religious meetings both seek to influence political elites through petitions or informal lobbying and employ manifestations as a means of signalling public support for their objectives.
Second, participation outside the electoral arena is key to a democracy’s functioning. As Dalton (Reference Dalton2008, p. 93) argues, ‘non-electoral methods of political action expand the potential influence of the citizenry […] citizens can focus on issues of greatest concerns [that][…] might be as broad as nuclear disarmament or as narrow as the policies of the local school district […] it allows citizens to select how and when they participate, since they do not have to wait until the next election to be active’. Thus, social arenas emerge as meaningful spaces for political initiatives.Footnote 2 This, in turn, echoes discussions about the role of participation in the formation of social capital and an individual’s sense of political efficacy (Pateman, Reference Pateman1970). Social capital, defined as ‘the connections among individuals’ social networks and the norms of reciprocity and trustworthiness that arise from them’ (Putnam, Reference Putnam2000, p. 19), can be either inclusive (when it bridges divisions across groups for a common goal) or exclusive (when it relies on group distinctiveness to promote in-group bonding and out-group exclusion). For political participation to emerge from social arenas, a certain level of social capital among citizens participating in these spaces is required. Still, many of these spaces likely rely on an exclusive form of social capital, with important implications for the relationship between political participation and democracy, as we discuss. Furthermore, political participation that emerges from social arenas suggests that political dissatisfaction does not always lead to apathy, as citizens often find alternative spaces that foster a sense of political efficacy (Campbell et al., Reference Campbell, Gurin and Miller1954).
In this Element, we move away from a focus on forms and modes of participation to a focus on arenas – the spaces, whether physically or socially constructed, where political participation emerges and takes place (Cornwall, Reference Cornwall2004; Jasper, Reference Jasper2021). We do this because, as mentioned in the Introduction, we propose that in Latin America, we observe how some ‘old’ forms of participation (such as petitioning, protest, and other contentious politics) remain highly relevant; but we also see how they are not emerging from political arenas, but rather from social arenas that function as political ones, especially in contexts and for citizens for which traditional political arenas are not as accessible or as responsive.
2.1 What Is Political Participation?
As the range of participation continues to expand, it has become increasingly complicated to determine what constitutes political participation. Some of the more constrained definitions of political participation limit it to legal actions ‘by private citizens that are more or less directly aimed at influencing the selection of government personnel and/or the actions they take’ (Verba, Reference Verba1978, p. 1),Footnote 3 which, depending on the context, may exclude things like protests. Broader definitions include any voluntary actions ‘intended to influence the choice of public policies, the administration of public affairs, or the choice of political leaders at any level of government, local or national’ (Weiner, Reference Weiner, Binder and La Palombara2015, p. 164), or as any ‘citizens’ activities affecting politics’ (van Deth, Reference van Deth2014, p. 351).
The expansion of what is considered political participation responds in part to the changing nature of participation ‘in areas that would have been considered private, social, or economic only a few decades ago’ and to the increasing use of non-political activities for political purposes (van Deth, Reference van Deth and Hannah2016, n.p.). When new forms of participation emerge, it can take time to incorporate them into the acknowledged repertoire of political participation. This happened to, for example, protests and other contentious politics (Tilly et al., Reference Tilly, Tarrow, Tilly and Tarrow2015), which were initially separated from other forms of political participation, but were eventually included in what is acknowledged as the repertoire of political participation. Nowadays, emerging forms of political participation, such as boycotts, are being incorporated into some repertoires, and there is considerable debate over whether online participation is a mode of participation rather than merely a mobilisation tool (Bennett and Segerberg, Reference Bennett and Segerberg2012).
Still, there are some minimum requirements to be met for something to be considered political participation. Most researchers on political participation agree that it is a voluntary activity undertaken by citizens, either directed towards political elites to influence or to challenge them (van Deth, Reference van Deth and Hannah2016, Reference van Deth2014). While participation is defined as action, some forms of non-action are inherently political, such as the absentee vote, which has been on the rise even in countries with mandatory voting. Furthermore, voting is considered political participation even in systems where voting is mandatory, because the obligation is to turn out rather than to vote, and this, in turn, makes absentee voting a political act more clearly.
In most cases, studies of participation focus on forms and modes (aggregate types or styles) of participation. Here we have, for example, van Deth’s (Reference van Deth and Hannah2016, Reference van Deth2014) conceptualisation of different forms of participation into five modes of political participation: institutional/conventional participation, unconventional/contentious (protest) participation, civic engagement, contextualised non-political activities (non-political activities that take a political tone in a given context, such as an art performance in a political site), and intentional use of non-political activities (such as political consumerism). As van Deth himself recognises, most research on political participation has focused on forms of participation within the institutional/conventional mode, such as voting, petitioning, and partisanship. This is also the case in Latin America, where extensive research has examined macro-level political movements and institutional participation (Cameron et al., Reference Cameron, Hershberg and Sharpe2012; Pogrebinschi, Reference Pogrebinschi2023).
We propose that the emerging focus on new forms of participation occludes political participation that resembles traditional forms and modes, yet emerges from social arenas.
2.2 Arenas of Participation
In the study of political participation, a differentiation exists between the forms and modes of participation, referring to the types of actions individuals engage in, and the arenas, or the spaces from which these actions emerge and take place. Arenas can be defined as the ‘physical spaces where players interact to generate decisions and other outcomes […]’ (Jasper, Reference Jasper2021, p. 244). Although our framework separates arenas and forms of participation, other frameworks, such as Hofer and Kaufmann’s (Reference Hofer and Kaufmann2023) ‘3A3’ framework, treat the spaces and formats (i.e., forms) of participation as components of arenas.Footnote 4
As summarized in Table 1, we see arenas of participation as the physical and socially constructed spaces (Cornwall, Reference Cornwall2004) in which ‘players interact to generate decisions and other outcomes’ (Jasper, Reference Jasper2021, p. 244), the modes of participation as the general styles or logics of participation, and the forms of participation as the actual activities that people engage in (van Deth, Reference van Deth and Hannah2016).
| Definition | Examples | |
|---|---|---|
| Forms | The forms of participation | Voting, petition signing and organising, campaigning, protests, etc. |
| Modes | The logic or style of participation | Conventional or institutional participation, unconventional or contentious participation, civic engagement, etc. |
| Arenas | The venues or spaces for which participation emerges and takes place. | Voting booths, streets, roads, religious meeting spaces, schools, etc. |
Our focus on arenas instead of exclusively on the forms and modes of political participation allows us to recognise that some widely recognised forms of political participation (such as protests, organised petitioning, legal reform initiatives, and the like) are still quite relevant but emerge not only from institutional/conventional arenas but also from social arenas. This echoes previous work in both political science and sociology, which argues that it is often futile to draw a sharp distinction between ‘civic’ and ‘political’ participation, as ‘political and civil society are interdependent’ (Macedo et al., Reference Macedo, Alex-Assensoh, Berry, Brintnall, Campbell, Fraga, Fung, Galston, Karpowitz, Levi, Levinson, Lipsitz, Niemi, Putnam, Rahn, Reich, Rodgers, Swanstrom and Walsh2005, p. 6). Still, our study introduces nuance to the role of political participation in social arenas. We view participation in social arenas not only as part of a civic culture that fosters political participation (Almond and Verba, Reference Almond and Verba1963; Putnam et al., Reference Putnam, Leonardi and Nanetti1993) but also as a form of political participation in its own right. By viewing social arenas as potential political arenas in their own right, our approach stands apart from studies that see participation in social arenas exclusively as a precursor for conventional political participation (Boulding and Holzner, Reference Boulding and Holzner2020; Carreras and Bowler, Reference 91Carreras and Bowler2019).
We argue that social arenas function as political arenas in which political initiatives are formed and advanced. This perspective has important implications for understanding a country’s political life, as our case studies will demonstrate, and may fundamentally alter how we view the citizenry – people disengaged from traditional political arenas are not necessarily disengaged from politics itself.Footnote 5
Our study also dialogues well with the literature on ‘latent political participation’ (Ekman and Amnå, Reference Ekman and Amnå2012) or ‘unconventional political participation’ (Kaim, Reference Kaim2021). Yet, even within this literature, many potential arenas for political participation remain understudied. We propose that examining how social arenas function as political arenas can help broaden our understanding of political participation.
2.3 Social and Political Arenas of Participation in Latin America
For our approach, we divided arenas of political participation into political and social. This division is mostly based on which arenas have been studied as political arenas in the past (the electoral arenas, party meetings and spaces, and other institutional/conventional spaces) and which have been mostly studied as social arenas (such as meetings of indigenous and peasant communities, religious organisations, unions, parent associations, neighbourhood associations, etc.).
The political relevance of participation in social arenas has been recognised by scholars of democratic participatory theory, as discussed in the Introduction. They highlight that we ‘learn to participate by participating […] [,] that feelings of political efficacy are more likely developed in a participatory environment […] [and that] the notion of a participatory society requires that the scope of the term “political” is extended to cover spheres outside national government’ (Pateman, Reference Pateman1970, p. 105). Thus, social arenas are important, and we argue that they matter not only as training grounds for political participation but also as political spaces in their own right.
Studies on political participation in social arenas are not completely absent from the social science literature. For instance, Klesner’s (Reference Klesner2007) analysis of participation in Latin America, based on WVS data, also considers social arenas such as women’s groups and local communities. Similarly, Carlin et al.’s (Reference Carlin, Singer and Zechmeister2015) study of electoral participation in the region also considers correlates with participation in non-electoral arenas. For example, in their analysis of the relationship between religion and political participation, Boas and Smith (Reference Boas, Smith, Carlin, Singer and Zechmeister2015) recognise that participation in religious groups creates social capital and drives political actions.
The question then becomes which arenas to focus on in our analysis and which cases to use to illustrate the importance of political participation in these social arenas. We could examine various potentially significant political spaces: grassroots organisations linked to social programmes (Barrientos, Reference Barrientos2023; Soss et al., Reference Soss, Hacker and Mettler2007); cultural or sports clubs, which have been studied primarily in historical contexts of authoritarian regimes (Arbena, Reference Arbena1986; L’Hoeste et al., Reference L’Hoeste, Irwin and Poblete2015); neighbourhood associations, which reinforces the bonds between citizens and policymakers (Lenk et al., Reference Lenk, Toomey, Wagenaar, Bosma and Vessey2002; Pekkanen et al., Reference Pekkanen, Tsujinaka and Yamamoto2014; Rich, Reference Rich1980); or women’s groups, among others.
In this Element, we focus on three groups of social arenas: those linked to schools, churches, and local social areas, which have had significant political relevance in recent years. Our selection of arenas was informed by the regional analysis in Section 3, which showed sustained participation across time, and by their recent political significance: Religious meetings (both from Evangelical and Catholic churches) have become important spaces for the emergence of counter-progressive-reform initiatives and other political initiatives in Brazil, Peru, and Central America; indigenous organisations have been arenas from which actors and groups shaped constitutional reforms in several Andean nations, and in educational spaces, we have seen the emergence of important movements and initiatives, from Chile’s student protests to parent activism against curriculum reforms in Peru. To illustrate this relevance, we use the examples of Peru, Chile, and Guatemala. We selected these cases based on their varying levels of institutional strength, different electoral rules,Footnote 6 and their experience of significant political changes driven by initiatives and actors emerging from social arenas in recent years.
2.3.1 Religious Spaces
As mentioned, one of the social arenas we focus on is religious meetings, which are spaces used by groups or organisations linked to a Church but distinct from the Church itself. This is perhaps the arena that has received the most attention in recent years, with scholars interested in the role of religious groups in the region’s turn towards conservatism and authoritarianism (Semán and García Bossio, Reference Semán and García Bossio2021).
But the political importance of participation in church-linked spaces was recognised even before the recent wave of Evangelical movements. In his seminal work, Huntington recognised the role of the doctrine shift in the Catholic Church, with the Second Vatican Council, in the processes that took place before and during the third wave of democratisation. He highlighted that this shifted the Church’s role from defender of the status quo to a proponent of social and political reform (Huntington, Reference Huntington1993). This transformation allowed religious spaces to function as sites of political engagement, particularly for historically marginalised populations.
The actors that make use of these spaces, the organisations linked to the Catholic Church and the Church itself have not had a uniform role in the political life of Latin American countries. In Argentina in the 1970s, the Catholic Church acted mostly in complicity with the military dictatorship and its repression apparatus (Ruderer, Reference Ruderer2021); while in Pinochet’s Chile, the Church provided legal aid to victims and allowed Church buildings to be used for gathering (Fleet and Smith, Reference Fleet and Smith1997). The Catholic Church has played a significant role in democratic transitions in several Latin American countries (Fitzpatrick-Behrens, Reference Fitzpatrick-Behrens, Freston, Dove and Garrard-Burnett2016; Klaiber, Reference Klaiber2009), as well as in the organisation of indigenous communities through the Ecclesial Base Communities (Steigenga and de la Vega, Reference Steigenga, de la Vega, Freston, Dove and Garrard-Burnett2016), which serve as important political arenas.
In recent years, religious spaces linked to the Catholic and Evangelical churches have been used to advance a socially conservative agenda (Encarnación, Reference Encarnación and Encarnación2016; Stoll, Reference Stoll2023), especially on issues such as reproductive rights, gender equality, and LGBTQ+ rights (Hale, Reference Hale and Hannah2019). Actors in these spaces have been especially active against abortion and the inclusion of sexual education in school curricula (Campos Machado and Freston, Reference Campos Machado, Freston, Gerrard-Burnett, Freston and Dove2016).
As with Catholicism, the political role of the Evangelical Church has not been uniform. While its corporatist character led them to ‘tap resources for religious expansion and dispute spaces in civil religion’, often through corruption and vote-selling (Freston, Reference Freston2001, p. 23), they also act in spaces that welcome under-represented groups. The agenda promoted in these spaces has also changed over the years. While in the 1970s, ‘revolutionary’ evangelicals actively called for political and social transformations, nowadays, evangelicals in Latin America are more aligned with the North American religious right (Stoll, Reference Stoll2023).
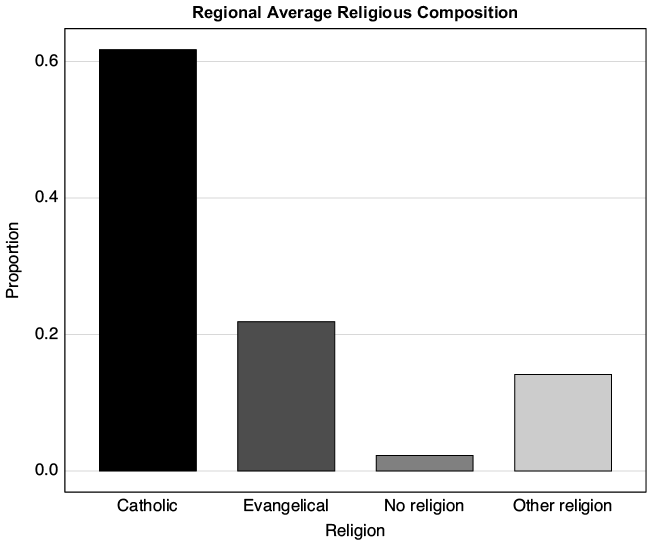
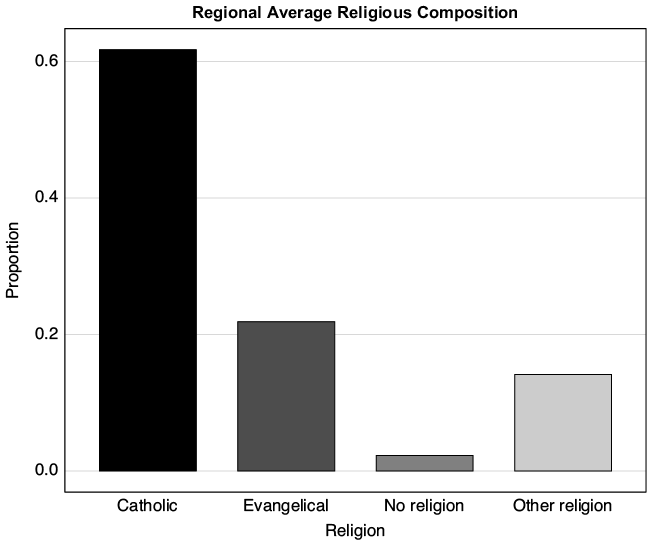
Evangelism has been growing exponentially in Latin America since the late 1980s. While Catholicism remains the predominant religion in the region, the growth of evangelism has been evident across most countries, as shown in Figure 1.
Religion in Latin America
While churches have had a clear role as political actors, in this Element, we are particularly interested in religious group meetings (not mass or religious services) as political arenas. Among these spaces, we have explicitly political ones, such as the Bancada Evangélica in Brazil, but also less explicitly political ones, like those created around the movement ‘Don’t mess with my children’ (Rousseau, Reference Rousseau2020), the Base Ecclesial Communities, which played an important role for indigenous communities, and grassroots spaces like Caritas. The relevance of participation in religious-linked spaces is clear across the region, with groups emerging from such spaces having achieved historical electoral wins in Guatemala (two presidents) and Peru (representation in Congress).
2.3.2 School-Related Spaces
In relation to schools, we have identified several social arenas that function simultaneously as political arenas, including teachers’ unions, parent associations, and student movements.
Teachers’ unions, among the largest in the region and with significant mobilisation and organisational capabilities, have emerged as important political arenas. Through strikes and other forms of participation, actors in these spaces have managed to delay, and sometimes halt, educational reforms linked to teachers’ evaluation, salaries, and other issues (Ross Schneider, Reference 99Ross Schneider2022). While parent associations have been less studied as political arenas in Latin America, studies from North America show that parent associations can function as spaces for advocacy (McGuinn, Reference McGuinn, McGuinn and Kelly2012) where parents organise to lobby for school policies (Murray, Reference Murray1997). Student movements in Latin America have played a significant role as political arenas and coordination spaces for protests in favour of democratisation and for both supporting and opposing educational reforms (Donoso, Reference Donoso and Rossi2023).
Unlike participation in electoral arenas, engagement in these spaces often begins with concrete, immediate concerns about educational quality or content before evolving into more comprehensive forms of political participation. Parent associations, teachers’ unions, and student organisations represent what Alvarez et al. (Reference Alvarez, Dagnino and Escobar1998) describe as ‘sites of citizenship construction’ where participants develop political identities through engagement with issues that directly affect their daily lives. In Latin America, where access to quality education has historically served as a primary mechanism for social mobility amid profound inequality, understanding the political role of these spaces is increasingly important.
These educational arenas often interact with one another. As Levinson et al. (Reference Levinson, Foley and Holland1996) argue, the politics of education in Latin America often involves triangular negotiations between parent/student associations, teacher unions, and state authorities, creating arenas for democratic contestation. The debates surrounding educational policy, including curriculum content, school funding, and other issues, transform school spaces into sites where broader questions about national development, citizenship formation, and social justice are negotiated.
In our case studies, we see Chilean students organising in educational spaces against expensive, privatised education systems that limit access for lower-income families, and parents in Peru mobilising through parent–teacher associations to oppose curricular reforms they perceive as threatening traditional values. In Guatemala, educational spaces have served as venues for indigenous communities to advocate for culturally appropriate education and greater local control over schooling. Thus, these educational arenas allow for undeniable political discussions and demand articulation about the teachers’ career paths, the schools’ curricula, and school governance.
2.3.3 Local Social Arenas
Finally, we focus on community organisations, which include indigenous and peasant communities, community improvement meetings, town halls, and rural patrols.Footnote 7
Indigenous and community organisations are key spaces for understanding how social arenas function as political arenas. Unlike religious organisations or parents’ associations that may operate in multiple localities, these neighbourhood and community-based spaces are fundamentally place-bound and they serve as arenas for addressing local concerns. The participation that emerges from these spaces is both elite-directed (with communities organising to make demands on the political elites through petitions and other initiatives) and elite-challenging.
These locally embedded spaces serve as arenas where citizens develop political subjectivities and collective identities through direct engagement with fellow community members and local state institutions. Unlike formal electoral channels that emphasise individual preference aggregation, community organisations operate through deliberative processes anchored in specific territories, fostering distinct political consciousness and agency. They represent what Yashar (Reference Yashar2005) terms ‘spaces of citizenship formation’, where individuals learn not only to articulate demands about their immediate local environment but also to understand themselves as political actors.
The significance of these locally grounded spaces is particularly pronounced in Latin America, where colonial legacies and uneven state formation have produced complex relationships between identity, territory, and governance. Indigenous communities, for instance, often maintain parallel local governance structures that embody alternative conceptions of political legitimacy and authority tied to specific ancestral territories (Van Cott, Reference 101Van Cott2009). These spaces are especially relevant to groups that face intersectional exclusion, such as indigenous women (Rousseau and Hudon, Reference Rousseau and Hudon2017, Reference Rousseau and Hudon2016).
We might expect these locally rooted spaces to function differently from traditional political arenas in several ways. First, participation likely follows different logics, motivated by immediate neighbourhood needs and collective territorial identity rather than abstract civic duty. Second, these organisations may serve as platforms for local political learning, where citizens develop practical skills in negotiation, resource allocation, and conflict resolution through direct experience in their immediate environments rather than formal education. Third, they may foster distinctive forms of political efficacy rooted in collective rather than individual action.
Community organisations in Latin America frequently merge demands for local service provision with political advocacy in inherently political ways. As McAdam (Reference McAdam2001) argued, seemingly non-political activities can become political when they challenge existing power arrangements. In these spaces, identity plays a crucial role, with Indigenous, Afro-descendant, and other marginalised communities using collective organisation to assert recognition and rights claims tied to specific territories. These identity-focused organisations act as ‘subaltern counter-publics’ (Fraser, Reference Fraser1990), where members of subordinated groups formulate oppositional interpretations of their identities and needs. The programmatic nature of many Latin American community organisations and their involvement in distributing resources, implementing local development projects, or enforcing local regulations positions them as de facto political spaces whose role extends far beyond a complementary one.
2.4 Closing Remarks
In this Element, we revisit some of the questions asked by Salisbury (Reference Salisbury1975) decades ago, when he posited that political participation occurs across a variety of organisational contexts, both directly related to elections (like the elections themselves, the parties, and the campaign events) and not (such as school-related organisations, unions, and protest groups), and asks:
Does belonging to the PTA have the same impact on the individual as taking an active part in a presidential campaign? […] What are the differences in impact from marching in a protest demonstration compared to working as a den mother? Are the differences entirely at the level of affect, or are there cognitive changes as well? Are these in the same direction? […]. (p. 336)
We propose that these questions, and the role of political participation that emerges and develops from social arenas, have particular significance in contemporary Latin America, where political parties face widespread delegitimisation and fragmentation, whilst social movements struggle to maintain national-level momentum. As we discussed at the beginning, arenas such as community meetings, neighbourhood associations, parent associations, unions, and religious organisations’ meetings have emerged as important political arenas in which participation has shaped both electoral and policy outcomes.
We recognise that participation in these arenas is not isolated and that cooperation exists. While our analysis highlights the role of social arenas as arenas of political participation in Latin America, we do not negate the importance of traditional political arenas. In our regional analysis and case studies, we examine both social and political arenas, dedicating some space to discussing changes in electoral participation.
However, by focusing on political participation in social arenas, we move away from an instrumental view of participation and a subordinate view of social arenas. We do not view political participation as solely a means to obtain political office. Citizens who participate in politics do so to obtain rights, protect those rights already attained, and influence the political agenda to match their group’s worldview. And this participation often emerges and develops not in traditional political arenas but in social arenas. Participation in social arenas is not only a training exercise in civic culture that later leads to political participation, but also political participation in itself; thus, we need to continue paying attention to what goes on in social spaces.
3 Political and Social Arenas of Participation in Latin America
In this section, we aim to provide a general overview of participation in Latin America, focusing on participation in social arenas and how it compares to participation in traditional political arenas. As discussed in the previous section, we consider traditional political arenas to include the electoral arena and spaces associated with political parties. As mentioned, similar terms are used for arenas and actors in discussions of political participation, which can lead to confusion. We focus on the spaces, both physically and socially constructed, in which participation is formed and takes place. Thus, for example, while unions are actors, they are also the space where workers convene. A similar confusion can arise around protest, which, as an arena, refers to the public spaces where people protest and demonstrate, but also denotes a form of participation.
For a general picture of participation in Latin America, we rely on data from the Latin American Public Opinion Project (LAPOP) for eighteen Latin American countries from 2004 to 2023. From this dataset, we selected seven variables related to participation in political and social arenas. The variables were selected based on our theoretical interests and the availabilityFootnote 8 of data. As such, some other participation arenas included in LAPOP but with higher rates of missing values across countries were omitted from this section (such as participation in cultural spaces and Women’s Groups), but could still function as political arenas, as discussed in Section 2.
It is essential to note that our primary interest lies in variables that measure participation in a given space (such as voting, attending protests or meetings); other variables in the LAPOP dataset are also related to participation but focus on evaluating these participation acts. Thus, we decided to focus on the following variables for the regional analysis:
Community Meetings: Attends community improvement committee meetings.
Voted in Last Election: Voted in the last presidential/general election.Footnote 9
Religious Meetings: Attends religious meetings.
Parent Associations: Attends parent association meetings.
Political Meetings: Attends meetings of political parties or movements.
Municipal Session: Attended a municipal session or similar event.
Protest Participation: Participated in a protest or demonstration.
These variables were later recoded so that all higher values corresponded to higher participation in these spaces. Some variables related to meeting attendance were ordinal, while others were binary. For the analysis, we recorded these variables as ordered to reduce variation and as binary, with any attendance coded as 1 and all other values as 0, as this was the default for electoral participation. All variables were later scaled to 0–1.
Although we kept these variables as separate dependent variables for the analysis, we were also interested in how they related to one another. For this, we ran a quick correlation test and a factorial analysis for the selected variables.
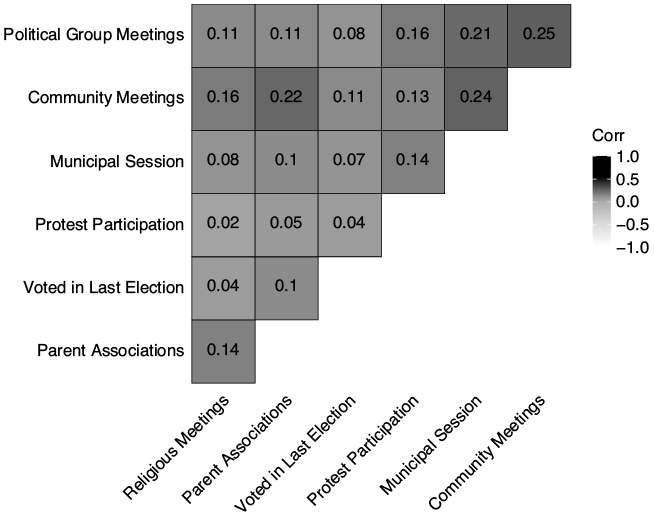
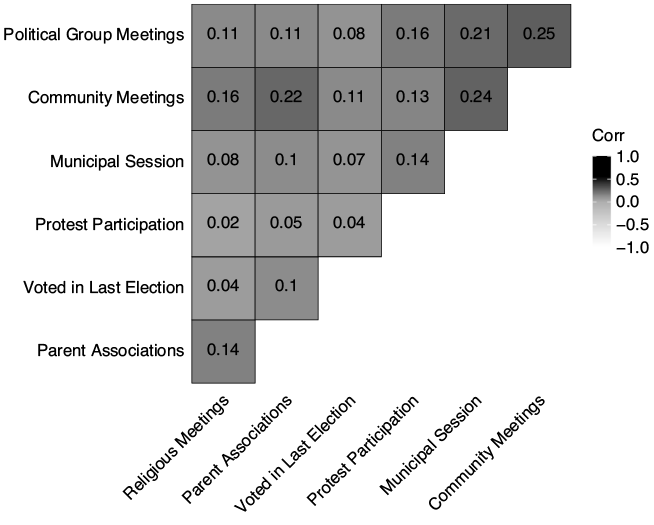
The results in Figure 2 show that the participation variables we included in our analysis are positively correlated (no negative correlations), but most of these correlations are weak. Importantly, we find that electoral participation is only very weakly correlated with participation in other arenas, underscoring the need to examine these arenas when studying political participation in the region. Another interesting finding is that our strongest correlation is between participation in political meetings and community meetings, as well as municipal sessions. This suggests that while participation in the electoral arena is only weakly correlated with participation in other arenas, involvement in traditional political arenas, such as political party meetings, may be related to participation in local social arenas.
Correlation between participation variables (binary variables)
We decided to organise the participation areas selected as follows:
Political Arenas:
◦ Electoral arena
◦ Political Meetings (political parties or movements)
Social Arenas
◦ Contentious Politics Arena: Protests
◦ Local Social Arenas: Here, we focus on participation in local spaces, and include participation in Municipal Sessions and Community Meetings
◦ Parent Associations
◦ Religious Meetings
3.1 Changes in Different Forms of Participation
As a first step, we wanted to see how these different forms of participation have changed over time in Latin America. To do so, we calculated the yearly global means (for the eighteen countries in our dataset). Our analysis accounts for LAPOP’s complex survey design by incorporating primary sampling units, stratification, and survey weights.Footnote 10
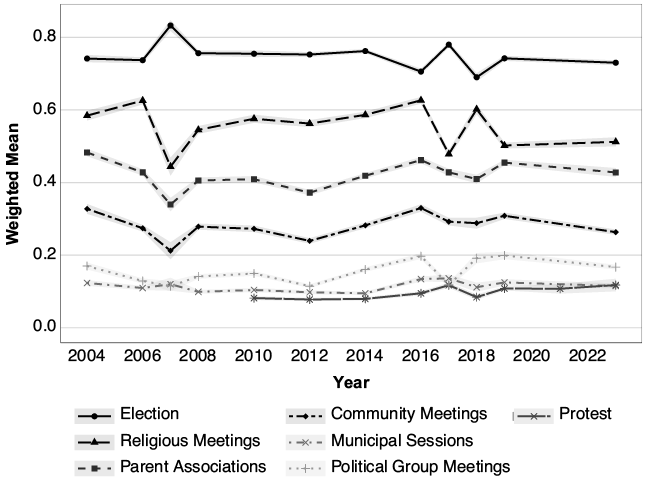
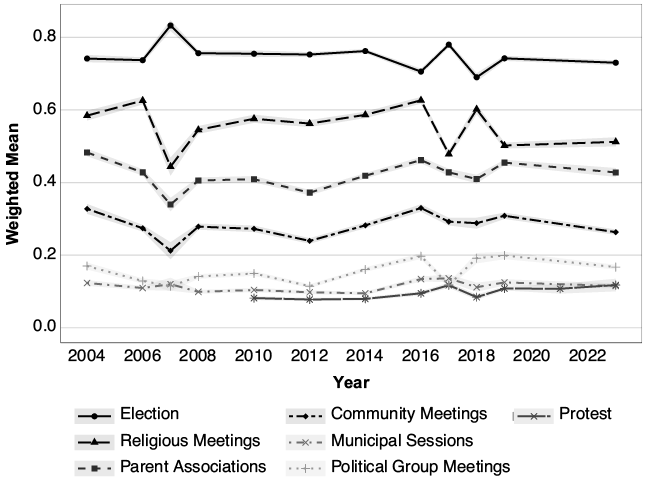
As shown in Figure 3, most people report participating in the electoral arena (voting), but there are also high levels of participation in social arenas, such as religious meetings, parent associations, and community meetings. For these trends, we focus on the dichotomous version of the variables, where any participation in the last year counts as 1. We will use the ordinal version of the variables for later analysis when available.Footnote 11
Regional trends in participation
Note: Overall regional average across all countries (weighted). Shaded areas represent 95% confidence intervals.
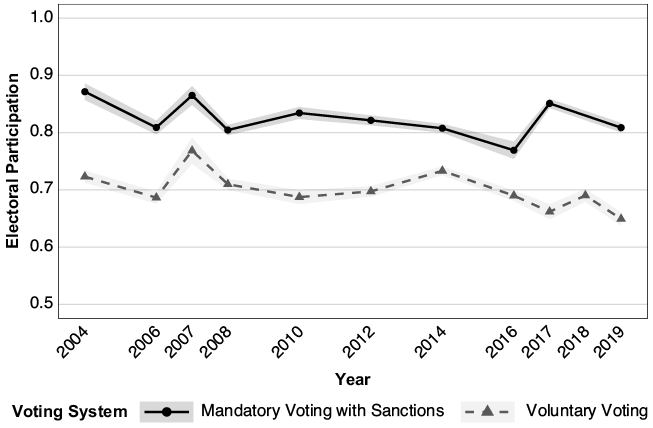
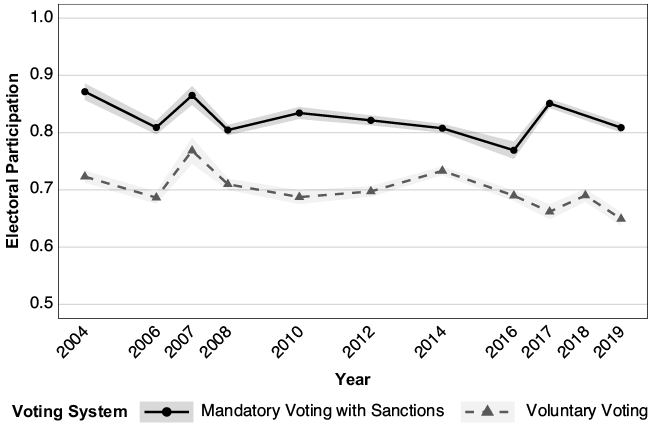
Although voting is the most prominent form of participation, the question that emerges is whether this is partly due to the obligatory vote in many countries in the region. As Carlin et al. (Reference Carlin, Singer and Zechmeister2015) find, the obligation to vote affects the role of individual characteristics in the decision to vote. To examine whether the obligation to vote played a significant role in citizens’ electoral participation in Latin America, we calculate the average number of votes per year, distinguishing between countries where voting was mandatory and those where it was not.Footnote 12
As shown in Figure 4, in those countries and years in which voting was mandatory, the (reported) electoral participation rate was higher, and this difference was significant.Footnote 13 We will explore the effect of electoral rules on participation more deeply by looking at the case of Chile in Section 6.
Voting by mandatory or voluntary vote
Note: Shaded areas represent 95% confidence intervals. Survey-weighted estimates.
3.1.1 Country Trends in Participation
Having looked at the general trends in Latin America, we wanted to examine them across different countries. To do this, we calculated the yearly means of our participation variables across the countries in our sample. For this descriptive analysis, we worked with the dichotomous version of the variables.
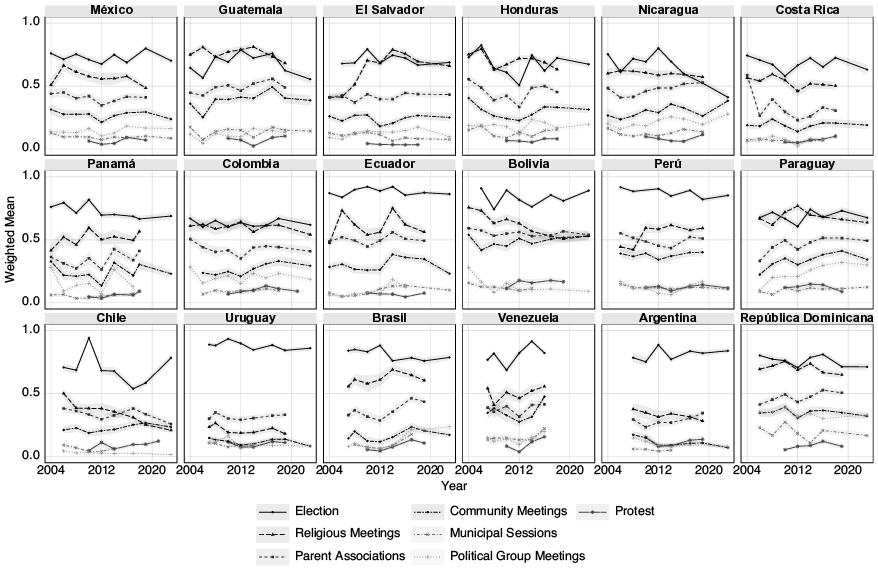
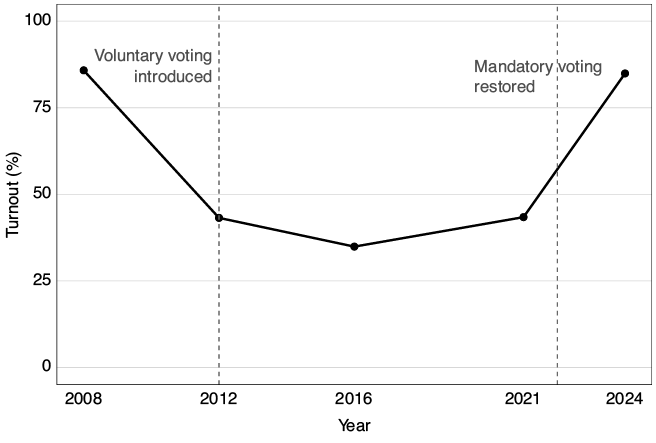
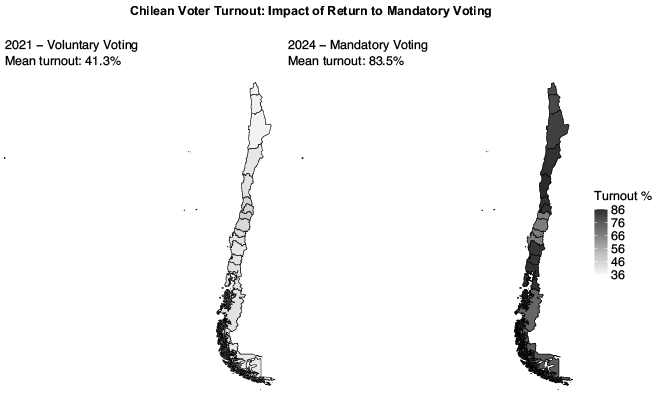
For traditional political arenas, we can see, as shown in Figure 5, that participation in Elections is higher than in political groups (parties or movements) meetings across all countries. But we see some interesting changes over time. For example, we can observe a decline in participation in Chile after 2012, followed by a resurgence in 2022, which may be attributed to changes in electoral rules (voluntary vs. mandatory vote) during those years, as we will further explore in Section 6.
Participation across different arenas
Note: Shaded areas represent 95% confidence intervals.
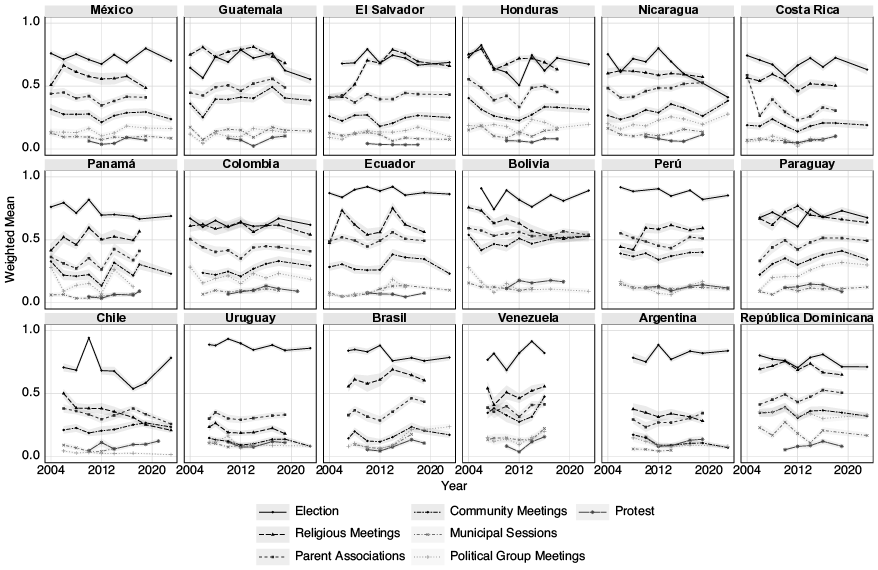
Figure 5 Long description
It includes participation in Elections, Political Groups, Protests, Community Meetings, Municipal Sessions, Religious groups, and Parent Associations. Electoral participation consistently outperforms other forms in most cases. We also see notably low protest participation in most countries. Community meetings show consistently higher participation than municipal sessions, particularly in Peru and Bolivia. Religious participation exceeds electoral participation in Central American nations, particularly Guatemala.
Another interesting case for electoral participation is Nicaragua, where a downward trend in reported voter turnout has been observed since 2012. Though reported turnout is lower than the official figures from electoral institutions, the declining trend aligns with the country’s democratic deterioration after Ortega’s return to the presidency in 2006. This decline tracks with several key events: the 2009 overturning of the constitutional provision banning immediate re-election, Ortega’s re-election in 2011, and the 2014 constitutional reform allowing indefinite re-election.
It is also interesting to notice changes in reported electoral participation between election years. For example, when asked about participation in the 2011 election in Nicaragua, around 80% of respondents in the 2012 LAPOP wave reported voting. However, when the same question was asked in the 2014 wave, only 69% reported voting in that same 2011 election. This shows that data on reported electoral participation may be capturing something beyond the actual participation, such as an individual’s attitudes towards elected leaders or the country’s political situation.
As we discussed in Section 2, among the social arenas we consider to function as political arenas in Latin America, we have protests, local spaces (municipal sessions and community meetings), parent associations, and religious groups meetings. There are many other potential politically relevant social arenas, but due to the data availability, we decided to focus on those for the regional analysis.
As discussed, ‘protest’ refers to both a form of participation (the act of protesting) and an arena (the space where the demonstration takes place). The phrasing of the question in the LAPOP survey does not fully differentiate between the two. Still, we considered it important to include it because, as discussed in Section 2, this form of contentious participation was considered separate from political participation until recently.
In Figure 5, we observe that protest participation is low in most countries. In Costa Rica, Peru, Uruguay, and Argentina, the rate of participation in protests is almost indistinguishable from that in political group meetings, which is surprising given the low levels of partisanship in Peru.
We also argue that local spaces, beyond local elections, are important political arenas, especially for groups that face higher barriers to accessing traditional political arenas, such as the indigenous population, women, and rural citizens. Among these local social arenas, we find indigenous communities, peasant communities, rural patrols, community meetings, and municipal sessions (or town halls). For this regional analysis, we are focusing on community meetings (attendance at meetings of a community improvement committee or association) and municipal sessions, given data availability.
As shown in Figure 5, participation in these local spaces occurs at higher rates than protest participation in most cases. This is especially the case for participation in community meetings, where high rates are observed in countries such as Peru, Guatemala, Bolivia, and Paraguay. Although participation rates in these spaces are relatively low in countries like Uruguay, Brazil, and Argentina, the overall results highlight their importance.
As discussed before, we are also considering two other social arenas that function as political arenas: schools-related spaces (which include parents’ associations, teachers’ unions, and student movements) and the religious spaces (focused on religious meetings and associations, beyond attendance at religious services).Footnote 14
Figure 5 shows that in the religious arena, participation rates are particularly high in several Central American countries, sometimes surpassing electoral participationFootnote 15 rates. Guatemala stands out among these countries, with attendance at religious meetings consistently exceeding voting rates. Chile and Uruguay are notable for the opposite reason, as they show remarkably low participation in religious meetings. These patterns align with broader religious affiliation trends – a 2023 IPSOS report indicates Chile had the region’s highest percentage of religiously unaffiliated people (29%), while Peru had the highest Christian population (76%).
Parents’ association participation also displays significant regional variation. While generally lower than religious meeting participation, it maintains relative stable across time in most countries, typically hovering around 25%. The Dominican Republic shows notably higher participation rates, possibly due to its more structured institutional framework. Under Dominican law, any parent automatically becomes a member of the Association of Parents, Mothers, Guardians and Friends (APMAE). Ordinance 09–2000 requires these associations to hold regular and extraordinary meetings to discuss school-related matters.
Thus, while voting remains the predominant form of participation across most countries, participation in social arenas is still highly relevant and, as we will show in our case studies, political in nature.
3.2 Correlates to Different Forms of Participation
We are also interested in whether different individual characteristics correspond with participation in different arenas. To explore this, we analysed the LAPOP data, focusing on three categories of variables capturing individual characteristics:
General demographic characteristics include age (and its square), gender, education, whether the person is a parent, and whether they reside in an urban or rural setting.
Race: Following LAPOP classification, we coded race as white, black, Indigenous, mixed, or Asian.
Religion
Political knowledge and engagement encompass variables that capture political knowledge, interest in politics, ideology, and party identification.
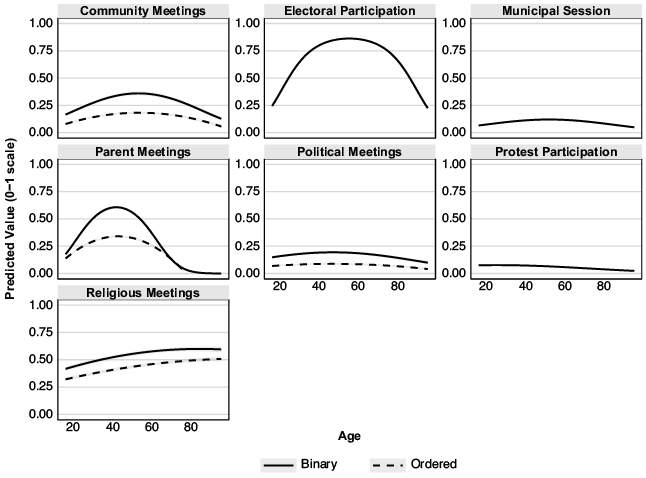
We added a squared term for age to capture the potential non-linearity in the relationship between age and participation, as observed in electoral participation. However, as shown in Figure 6, the quadratic relationship between age and other forms of participation is less clear than that for electoral participation.
Age and participation in different arenas
Note: Binary variables show probabilities; ordered variables show scale values. Predictions control for country and year fixed effects. Shaded areas represent 95% confidence intervals.
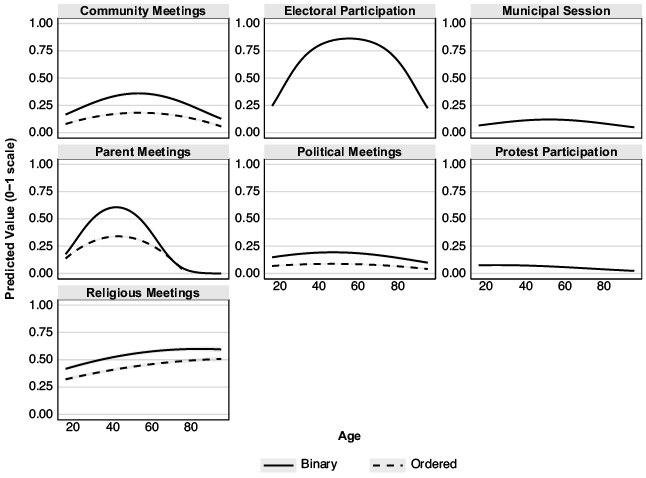
For example, religious meeting attendance increases with age, while participation in parents’ associations peaks among people in their thirties and declines to zero among older adults, a pattern consistent with the life cycle of having school-aged children.
For all subsequent analyses in this Section, we include both age and age-squared in our models, incorporate the complex survey design, and control for country- and year-fixed effects. As previously noted, we employ ordinal variables (scaled to 0–1) where available to maximise precision.
3.2.1 Traditional Political Participation Arenas
As a first step, we were interested in examining how different individual characteristics correlated with participation in traditional participation arenas (electoral arenas and political party meetings). At least for the correlates to participation in the electoral arena, we expected to find similar results to those of Carlin et al. (Reference Carlin, Singer and Zechmeister2015), since we work with the same data, although our time frame is longer.
First, we examined whether our selected individual characteristics variables correlated significantly with reported participation in elections and political party meetings.
| Elections | Party Meetings | |
|---|---|---|
| Age | pos.*** | n.s.† |
| Age² | neg.***† | neg.***† |
| Male (Gender) | n.s.† | pos.***† |
| Education (Years) | pos.*** | neg.**† |
| Has Children | pos.*** | n.s.† |
| Urban/Rural (Rural) | pos.*** | pos.***† |
| Ethnicity: Asian | n.s.† | n.s.† |
| Ethnicity: Black | n.s.† | n.s.† |
| Ethnicity: Indigenous | n.s.† | pos.**† |
| Ethnicity: Mixed | n.s.† | n.s.† |
| Ethnicity: Other | n.s.† | n.s.† |
| Rel. Believes but Unaffiliated | n.s.† | n.s.† |
| Catholic | n.s.† | n.s.† |
| Jehovah’s Witness | neg.** | n.s.† |
| Non-Christian Rel. | n.s.† | n.s.† |
| Other Religious Group | n.s.† | n.s.† |
| Protestant/Evang. | n.s.† | n.s.† |
| Political Knowledge | pos.*† | n.s.† |
| Political Interest | pos.*** | pos.*** |
| Left Ideology | n.s.† | pos.**† |
| Right Ideology | pos.**† | pos.***† |
| Party ID | pos.*** | pos.*** |
| Country FE | ✓ | ✓ |
| Year FE | ✓ | ✓ |
| Observations | 24,433 | 24,462 |
Notes: pos. = positive; neg. = negative; n.s. = not significant. Stars denote significance levels: *=p < 0.05, **=p < 0.01, ***=p < 0.001. † indicates a small effect (coefficient close to zero). Entries come from Full models estimated via quasi-binomial logistic regression with survey weights. Country and Year fixed effects included as indicated (✓).
As shown in Table 2, the base demographic variables (age, education, whether the respondent has children, and whether the respondent is from a rural context) have a positive and significant effect on the reported participation in the electoral arena. These results are similar to those of Carlin et al. (Reference Carlin, Singer and Zechmeister2015). We also ran partial models, which are available in the Supplementary Material. There, we note that while male respondents are more likely to report having voted, this effect disappears when we include other variables related to race, religion, and political knowledge and characteristics.
For race/ethnicity, with ‘white’ as the baseline, we see that none of the race/ethnicity categories have a significant effect in the full model. For the religion variables, with ‘atheist/agnostic’ as the baseline, most coefficients are not significant in the full model, except for Jehovah’s Witnesses, who are less likely to report having voted than atheists/agnostics. In the model that includes only the religion variable, we also see that Jehovah’s Witnesses are the only ones with a negative correlation to reported turnout. At the same time, people who identify with any of the other faiths are more likely to report voting, although, as mentioned, this effect disappears when accounting for other demographics. The strong negative effect of identifying with Jehovah’s Witnesses (in contrast to being an atheist/agnostic) can be explained by political neutrality being one of the tenets of this religious sect; as Blankholm (Reference 90Blankholm2009, p. 209) puts it, they ‘discourage all political involvement, including recitation of the “Pledge of Allegiance”, voting, and all military involvement’.
Finally, examining political knowledge, interest, and characteristics, we find positive and significant correlations between reported turnout and respondents’ perceived political knowledge, reported political interest, right-wing ideology (versus centrist), and political party identification. For ideology, measured on a 1–10 scale (where 1 represents left and 10 right), we coded the three most extreme values at either end as ‘left’ and ‘right’, respectively, with the four middle values serving as our ‘centre’ baseline. The higher reported voting odds among right-identifying individuals may partly reflect the right’s more effective mobilisation of other identities (Boas and Smith, Reference Boas, Smith, Carlin, Singer and Zechmeister2015).
Table 2 also shows that most demographic characteristics have small effects on participation in meetings of political parties or movements. For age, the results suggest a quadratic relationship with participation in political groups: participation increases with age but declines in later years. We also see that rural residents are more likely to participate in political party meetings, which aligns with our previous finding that participation in this arena is correlated with participation in local social arenas. Men are more likely to participate in political party meetings, though the effect is small. Previous work in Western democracies has found that men are more active members of political parties (Coffé and Bolzendahl, Reference Coffé and Bolzendahl2010). Some studies suggest that this may also be the case in Latin America, where women are less likely to participate in explicit political activities, despite participating in other arenas (Espinal and Zhao, Reference Espinal and Zhao2015). This may be partly explained by the constraints women face compared to men due to caring responsibilities. This last point is supported by the negative, although not significant, coefficient we see for ‘Has Children’.
In terms of race and ethnicity, we see that individuals who identify as indigenous are more likely to participate in political group meetings than individuals who identify as white, although the effect is small.Footnote 16 Similarly, for religion, none of the results are significant, suggesting that any effect observed in the partial model available in the Supplementary Materials is likely mediated by factors included in the full model, such as gender and education.
Finally, the results on political knowledge, interest, and characteristics show that political interest and right ideology (as opposed to centre) correlate positively and significantly with participation in political group meetings. We observe a similar effect, albeit on a smaller scale, for left ideology (as opposed to the centre). We also see that party identification (whether people strongly identify with any political party) is positively correlated with participation in political party or group meetings, and that the coefficient for this is comparatively large. These results show that people with a strong ideological commitment are more likely to attend political group meetings, and political knowledge is less important for participation in spaces than people’s subjective interest in politics.
3.2.2 Political Participation in Social Arenas
In this section, we replicate the previous exercise, focusing on social arenas that include protests, local social arenas (municipal sessions, also known as town halls, and community meetings), parent–teacher associations, and religious meetings.
| Protest | Municipal Sessions | Community Meetings | Parent Associations | Religious Meetings | |
|---|---|---|---|---|---|
| Age (Centered) | n.s.† | pos.***† | pos.***† | neg.***† | pos.***† |
| Age² (Centered) | neg.***† | neg.***† | neg.***† | neg.***† | n.s.† |
| Male (Gender) | n.s.† | pos.**† | pos.***† | neg.***† | neg.***† |
| Education (Years) | pos.***† | n.s.† | neg.*† | neg.***† | n.s.† |
| Has Children | neg.*** | n.s.† | pos.***† | pos.*** | n.s.† |
| Urban/Rural (Rural) | n.s.† | pos.*** | pos.***† | pos.**† | pos.***† |
| Ethnicity: Asian | n.s.† | n.s.† | n.s.† | n.s.† | n.s.† |
| Ethnicity: Black | n.s.† | n.s.† | n.s.† | pos.**† | n.s.† |
| Ethnicity: Indigenous | pos.*** | pos.*** | pos.***† | pos.*† | pos.**† |
| Ethnicity: Mixed | pos.***† | n.s.† | pos.*† | n.s.† | n.s.† |
| Ethnicity: Other | n.s.† | n.s.† | n.s.† | n.s.† | n.s.† |
| Rel. Believes but Unaffiliated | n.s. | n.s. | n.s.† | n.s.† | n.s.† |
| Catholic | neg.*** | n.s. | n.s.† | pos.*† | pos.*** |
| Jehovah’s Witness | neg.*** | n.s. | n.s.† | n.s.† | pos.*** |
| Non-Christian Rel. | n.s. | n.s.† | n.s.† | n.s.† | pos.*** |
| Other Religious | neg.*** | n.s. | n.s.† | n.s.† | pos.*** |
| Protestant/Evang. | neg.*** | n.s. | n.s.† | pos.*† | pos.*** |
| Political Knowledge | pos.***† | n.s.† | n.s.† | n.s.† | n.s.† |
| Political Interest | pos.*** | pos.*** | pos.***† | pos.***† | pos.***† |
| Left Ideology | pos.*** | pos.*† | pos.**† | n.s.† | neg.*† |
| Right Ideology | pos.*** | pos.**† | pos.**† | pos.***† | n.s.† |
| Party ID | pos.*** | pos.*** | pos.***† | n.s.† | pos.**† |
| Country FE | ✓ | ✓ | ✓ | ✓ | ✓ |
| Year FE | ✓ | ✓ | ✓ | ✓ | ✓ |
| Observations | 24,639 | 19,509 | 24,498 | 24,424 | 24,504 |
Notes: pos. = positive; neg. = negative; n.s. = not significant. Stars denote significance levels: *=p < 0.05, **=p < 0.01, ***=p < 0.001. † indicates a small effect (|coefficient| < 0.2). Entries come from Full models estimated via quasi-binomial logistic regression with survey weights. Country and Year fixed effects included as indicated (✓).
First, we looked at reported participation in protests. In Table 3, we can see that gender shows no significant correlation with protest participation in the full model, which aligns with previous research suggesting that whilst men and women may engage in different types of protest activities, their overall levels of protest participation are similar (Dodson, Reference Dodson2015). What seems to matter more than gender is whether individuals have children; being a parent has a strong negative effect on protest participation, suggesting that family responsibilities, regardless of gender, constrain it. It is also worth noting that education shows a positive and significant correlation with protest participation; this may be related to the rise of student protest movements across the region, as discussed in Section 2.
In Table 3, we can also see that individuals who identify as indigenous are much more likely to participate in protests than individuals who identify as white. We also see a similar, although smaller, effect for people who identify as mixed. While in some countries, such as Ecuador and Bolivia, indigenous movements have managed to find space in the electoral arena and have formed parties that have run and won elections, in other countries, protests remain one of the few ways indigenous people can have their demands heard. This highlights the importance of distinguishing between forms and arenas of participation, since similar forms can emerge from different arenas.
Regarding religion, it is interesting to notice that professing a faith, as opposed to being an atheist/agnostic, is significantly and negatively correlated with protest participation. This is surprising, given that other studies have found that adherence to the Catholic Church is positively associated with protest participation (Hale, Reference Hale2024), but this may be due to the types of protest individuals think about when reading the questions (they may not think of protest events linked to things like ‘Don’t Mess With My Children’ as protests). Finally, regarding variables related to political characteristics, we see that, as with participation in political parties’ meetings, strong political interest and identification positively correlate with participation in protests.
Then, we examine how individual characteristics correlate with participation in local social arenas, including municipal sessions such as town halls and councils, as well as community meetings. As Table 3 shows, participation in municipal sessions exhibits a quadratic relationship with age, although this curvilinear pattern is less pronounced than that observed for voting (as illustrated in Figure 6). Men and rural residents display higher participation rates in this arena. Notably, in the full model, indigenous identity remains a significant positive predictor of municipal session participation compared to white identity, even after controlling for other demographic characteristics. Religious identification, however, shows no significant effects in the full model. Similar to traditional participation arenas, individuals with strong ideological identification (either left or right), high political interest, and party identification are more likely to participate in municipal sessions.
We also examined the correlates of participation in community meetings, including community improvement meetings and community associations. As shown in Table 3, a similar curvilinear effect of age is observed in this arena, as in the others. The results also show that males, individuals with children, and those residing in rural areas are more likely to participate in this arena. While we also see a significant effect for education, this effect is very small.
Regarding race and ethnicity, we can see that individuals who identify as indigenous are more likely to participate in community meetings than people who identify as white. This, combined with the results shown in Table 3, highlights the importance of local spaces for indigenous people. It would have been ideal to have sufficient data for participation in indigenous communities or peasant communities, but we will explore these spaces in more detail in our case analysis.
Table 3 also shows that religious identity does not significantly correlate with participation in community meetings and that, as in all other areas, strong ideological identification (left or right), political interest, and party identity significantly and positively correlate with participation in this arena.
Additionally, we also looked at the correlates of participation in parents’ associations, which is an understudied arena of political participation and corresponds to a broader view of the school as a political arena, not only for students (and the student movements) but also for parents and teachers, as discussed in Section 2. As shown in Table 3, there is a negative correlation between age and participation in parent associations, which is logical given that most, if not all, participants in this space have school-age children. We also observe that women and individuals with children are more likely to participate in this arena, which can be partly explained by the gender division of caring responsibilities. Additionally, there is a positive effect for people living in rural areas compared to urban areas, suggesting that parents’ associations play a more important role in rural communities. As we will discuss in Section 5 regarding Peru, this may be related to parents’ roles in grassroots social organisations that provide services to disadvantaged communities.
For race and ethnicity, we can see that people who identify as black or indigenous are more likely to participate in parent associations than people who identify as white, and the effect size is larger for people who identify as Indigenous, which gives more weight to the idea of this arena being especially important for disadvantaged and/or excluded communities.
We also see that individuals who identify as catholic or as protestant/evangelical are more likely to participate in these spaces compared to individuals who identify as atheist/agnostic. This is particularly relevant for the interconnection between educational and religious spaces as politically significant social arenas, as we will discuss in the case of Peru.
Interestingly, we see that variables related to political knowledge, interest, and characteristics have a different effect in this arena than in the previous ones. While interest in politics and right-wing ideology significantly and positively correlate with participation in parents’ associations, left-wing ideology and party identification have no significant effect in the full model. This arena may be more likely to be used by conservative sectors of the population.
Finally, we look at how individual characteristics correlate with participation in religious meetings. As mentioned earlier, this differs from attendance at religious services and corresponds to meetings of religious organisations. As Table 3 shows, aside from gender and rural/urban status, demographic characteristics have small or non-significant effects on participation in religious meetings. Women and individuals living in urban areas are more likely to participate in this arena. The lack of significant effects for other demographic characteristics suggests that variation in participation in religious meetings is better explained by factors other than these characteristics.
We can also see that, in general, race or ethnicity has no significant effect on participation in religious meetings, except for individuals who identify as indigenous, as in other social arenas. We can see that, compared to people who identify as white, individuals who identify as indigenous are more likely to participate, which points towards the importance of this social arena for marginalised communities.
Unsurprisingly, some of the strongest correlates are found in religious identification. Individuals who identify with any religion, in contrast to those who identify as atheist/agnostic, are more likely to participate in religious meetings, with the strongest effects observed among those who identify as Jehovah’s Witnesses or as protestant/evangelical.
Finally, we observe that, in contrast to what is seen in traditional political arenas and local social arenas, ideology does not appear to influence participation in religious organisation meetings significantly. However, political interest and party identification do positively and significantly correlate with participation in this space.
3.3 Participation in Different Arenas and Democratic Values
We will conclude the analysis of this section with a brief examination of how participation in these different arenas correlates with democratic values. We can think of democratic values as the normative preference for democracy and its implications, such as the inclusion of diverse groups and the political tolerance of different ideas (Kołczyńska, Reference Kołczyńska2020). These values are important because they contribute to the functioning and maintenance of democracy. Support for democracy can range from the very abstract (the belief that democracy is the best system) to the more concrete (support for democracy or the condemnation of undemocratic behaviour even under adverse conditions). For this short descriptive analysis, we have selected and re-coded the following variables from LAPOP:
Believe that Democracy is the best system (binary)
Agreement with the idea that Democracy is the best system (ordinal)
Support for the political system (ordinal)
Believe that a coup can be justifiedFootnote 17
Approval of violent overthrow of the government (ordinal).Footnote 18
We selected these variables based on both data availability and because they capture abstract and more concrete support towards democracy. The first three are related to more abstract support for democracy. In contrast, the phrasing of the last two (support for a coup when conditions are adverseFootnote 19 or a violent overthrow of an elected government) measures more concrete support for democracy. We constructed simple models with participation variables as the independent variables. Although we account for the survey design and country-year fixed effects, we consider these results more accurately interpreted as descriptive.
As we can see in Table 4, participation in elections is associated with stronger democratic commitment across all our measures, which echoes the maybe particular role of electoral participation in democracy pointed out by Chapman (Reference Chapman and Chapman2022), who argues that while political participation cannot and should not be reduced to electoral participation, ‘popular voting instantiates democratic values in a unique and important way, and it also performs functions that support a healthy democratic system, especially within very large polities’ (p. 22).
Participation in other traditional political and social arenas has a more nuanced relationship to democratic values. For example, while participation in political group meetings is associated with more support for the system, it is also associated with more support for a violent overthrow of the government, suggesting that individuals who participate in this arena may be more open to non-democratic transitions.
We also see that participating in protests is associated with weaker democratic support, both in an abstract sense and in concrete terms. There is an association between participating in protests, having low system support, and expressing approval for violent overthrow.
| System Support | No Coup Support | Democracy Best (ord.) | Reject Violent Overthrow | Democracy Best (dic.) | |
|---|---|---|---|---|---|
| Election | pos.***† | pos.***† | pos.***† | pos.***† | pos.*** |
| Political Group Meeting | pos.***† | n.s.† | n.s.† | neg.***† | neg.*† |
| Protest | neg.***† | neg.**† | pos.*† | neg.***† | n.s.† |
| Municipal Session | pos.***† | neg.***† | n.s.† | n.s.† | neg.*† |
| Religious Meeting | pos.***† | n.s.† | pos.***† | pos.***† | pos.***† |
| Parent Association | pos.***† | neg.***† | neg.***† | neg.+† | neg.*** |
| Community Meeting | pos.***† | n.s.† | pos.*† | n.s.† | n.s.† |
| Country FE | ✓ | ✓ | ✓ | ✓ | ✓ |
| Year FE | ✓ | ✓ | ✓ | ✓ | ✓ |
Notes: pos. = positive; neg. = negative; n.s. = not significant. Stars denote significance levels: +=p < 0.1, *=p < 0.05, **=p < 0.01, ***=p < 0.001. † indicates a small effect (|coefficient| < 0.2). Country and Year fixed effects included as indicated (✓).
Participation in local social arenas (community meetings and municipal sessions) correlates with system support but not with more concrete measures of democratic support. Religious meeting participation correlates positively, though weakly, with support for democracy, both through abstract and more concrete measures. And participation in parent associations is positively, although weakly, associated with system support, but negatively associated with other abstract and concrete measures of democratic support.
This raises important questions about how participation in different arenas might reinforce or undermine democratic values, suggesting fruitful directions for future research. For example, when it comes to the more concrete measures of support for democracy, we see that participation in social arenas correlates with higher support for coups when conditions are hard, which raises the question of whether people who participate in these arenas have weaker commitments to democracy a priori or a different conception of what is demcoracy.
3.4 Discussion
As this section demonstrates, political arenas beyond electoral participation are significant across Latin America, with notable variation in participation rates across different arenas.
We have seen that different demographic groups gravitate towards distinct participation arenas. Men tend to participate more in traditional political arenas (elections, parties, and protests), while women tend to participate more in parent associations and religious meetings. Rural residents participate more overall than urban dwellers, particularly in local social arenas such as municipal sessions. Indigenous identity is correlated with higher participation across all arenas, especially in municipal sessions, suggesting that local social spaces may be particularly important for identity-based political participation.
Our results suggest that traditional political and social arenas constitute related but distinct spaces for political participation, neither interchangeable nor merely precursors to one another. A central argument of our work is that although participation across these arenas may be interrelated, engagement in social arenas should not be reduced to a mere pathway to participation in conventional political arenas. In our case studies, we aim to demonstrate that participation in these social arenas can constitute political participation in its own right.
4 Guatemala
The Semilla Movement’s electoral victory in Guatemala’s 2023 presidential race, securing 60% of votes, represents the most significant political realignment since the 1996 peace accords (Schwartz and Isaacs, Reference Schwartz and Isaacs2023). While conventional analysis initially framed this as an unexpected breakthrough in a conservative system (Meléndez-Sánchez, Reference Meléndez-Sánchez2023), the result stems from longstanding patterns of political mobilisation in social arenas. Indigenous governance systems and community organisations, developed during periods of institutional weakness, operated as autonomous political arenas rather than mere conduits to formal participation. When state institutions attempted to invalidate the election results, indigenous authorities, such as the Xinka Parliament, mobilised pre-existing governance networks to deploy strategic commercial blockades (Schwartz and Isaacs, Reference Schwartz and Isaacs2023; The North American Congress on Latin America, 2024), transforming traditional community social arenas into sites of nationwide political resistance. This is a clear example of how political engagement in social arenas can restructure power relations, particularly for groups historically excluded from formal institutions.
Guatemala is an ideal case for examining how social arenas function as political arenas, rather than simply serving as pathways to traditional political participation. First, the country’s history of institutional weakness and state violence created enduring barriers to engagement with formal political spaces across society, leading diverse groups to develop forms of political organisation in social spaces. Second, the presence of robust traditional governance systems, particularly in indigenous communities, has provided models for transforming social arenas into effective sites of political action. Third, stark socio-economic inequalities, reflected not only in ethnic disparities but also in rural-urban and gender divides, have required the development of community-based political action through accessible social spaces.
In this context, social arenas serve as arenas of political engagement. As our analysis will show, this pattern manifests across different sectors of society: from indigenous community councils serving as centres of territorial defence to parent associations driving educational reform to religious gatherings becoming organisational spaces for diverse social movements. The intersection of these different social spaces has created networks of political engagement that cut across ethnic, class, and urban-rural divides, challenging conventional theories of political participation that privilege institutional channels.
4.1 Historical Context
Guatemala’s patterns of political participation through social arenas are rooted in its history of state violence and institutional failure. The 1952–1954 Guatemalan Revolution, sparked by ambitious land reforms, ended in a coup that set a precedent of state hostility towards organised civil society. The armed conflict began in 1960 with a failed military revolt, whose participants later formed the first guerrilla forces, establishing a pattern of military–civilian confrontation that would persist for decades. The most violent period was between 1979 and 1984, characterised by systematic campaigns of terror, particularly in indigenous-majority departments like Quiché, Huehuetenango, Chimaltenango, and Alta Verapaz (Fuentes Cordoba, 2021). According to the Commission for Historical Clarification (CEH), the government was responsible for 93% of the human rights violations during the conflict, with indigenous Maya communities bearing the brunt of the violence, representing 83% of all victims (Commission for Historial Clarification, 1999). This historical context of violence has shaped political participation patterns in Guatemala, creating a ‘culture of fear’ that continues to influence civic engagement (Fuentes Cordoba, 2021). The targeting of community leaders, teachers, and organisers during the conflict systematically dismantled existing networks of civil society, particularly in indigenous communities. In Alta Verapaz, like other conflict-affected regions, this violent history created enduring obstacles to political participation, reflected in extremely low levels of civic and political engagement, including voting, in the 2000s (Fuentes Cordoba, 2021; Lehoucq and Wall, Reference Lehoucq and Wall2004). The legacy of state violence has fostered deep distrust in government institutions and formal political processes, affecting how communities organise and engage with state initiatives (Matsuzaki and Schwartz, Reference Matsuzaki and Schwartz2024; Simon, Reference 100Simon2021).
However, this targeted destruction of formal civil society organisations did not eliminate political participation; instead, it transformed it. As formal channels of political engagement became increasingly dangerous or inaccessible, communities began to repurpose existing social spaces for political organisation. Religious gatherings, traditionally important in Guatemalan society, became spaces for discussing community concerns and coordinating responses to state violence (Hawkins, Reference Hawkins2021). Parent meetings in schools evolved into forums for addressing broader community needs (Altschuler and Corrales, Reference Altschuler and Corrales2012). Even seemingly apolitical spaces like agricultural cooperatives became spaces where communities could develop collective responses to political challenges (Konforti, Reference Konforti2022a). Rather than retreating from political engagement entirely, communities redirected their political participation through social spaces that offered greater safety and accessibility.
4.2 Electoral Participation
Using data from the Tribunal Supremo Electoral, we analysed the dynamics of electoral participation in Guatemala’s last two presidential elections, 2019 and 2023.
The 2019 presidential election exhibited substantial turnout disparities across regions, with all departments experiencing dramatic declines in participation between the first and second rounds, as shown in Figure 7. While the first round saw a 61.8% national turnout, this plummeted to just 42.0% in the second round – a 19.8 percentage-point decrease, representing a 32% reduction in participation. Most striking was the pattern in central highland regions, where turnout drops reached 60% in departments like Quiché and Jutiapa.
Voter turnout changes in the 2019 Guatemalan presidential election
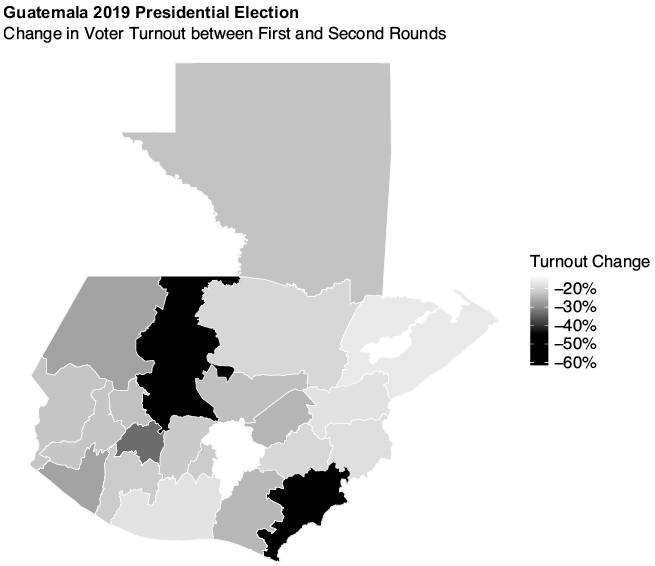
These participation patterns reflect historical institutional challenges and the importance of political engagement through social arenas. The departments showing the steepest turnout declines often correspond to areas with high indigenous populations, suggesting that formal electoral channels may be viewed with scepticism in these communities. This aligns with Lehoucq and Wall’s (Reference Lehoucq and Wall2004, p. 497) observation that ‘as turnout has fallen through time, the share of registered voters who are literate and the share of the population that is indigenous have become negatively associated with turnout’.
The 2023 presidential election, shown in Figure 8, shows commonalities and differences with the 2019 election. As in 2019, there was a significant drop in overall participation between rounds, from 56.3% in the first round to 45.0% in the second, an 11.3 percentage-point decline. While smaller than the 2019 drop, this still represents a substantial withdrawal from the electoral process in the runoff stage.
Voter turnout patterns and Semilla Movement support in the 2023 Guatemalan presidential election
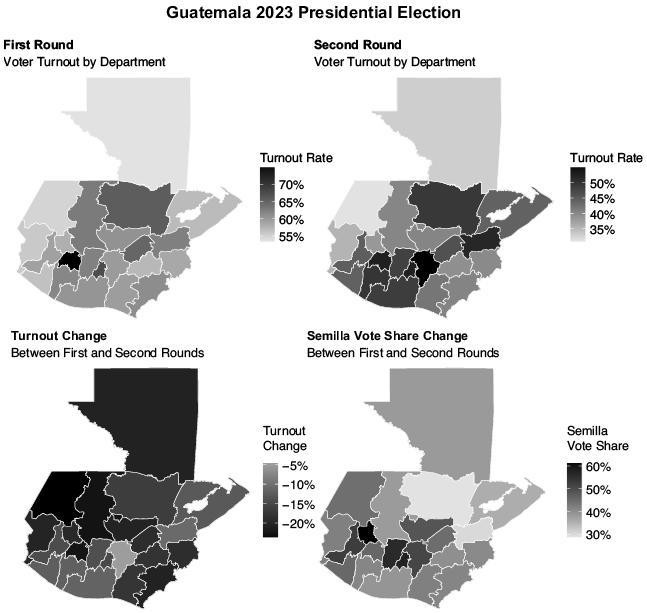
To better understand these patterns, we conducted correlation analyses examining how first-round party support related to second-round turnout changes across departments in both elections, as shown in Table 5.
| Variable | Correlation |
|---|---|
| VAMOS Support (2019) | −0.115 |
| UNE Support (2019) | −0.436* |
| Other Parties Support (2019) | 0.476* |
| Semilla Support (2023) | 0.589** |
Note: Significance codes: ***p < 0.001, **p < 0.01, *p < 0.05
The results reveal distinct patterns in how voter behaviour varied across these two elections. In 2019, areas with higher support for parties eliminated after the first round showed a significant positive correlation with turnout decline, indicating that voters whose preferred candidates were eliminated were more likely to abstain in the runoff. Interestingly, even departments with higher first-round support for UNE saw significant declines in turnout, whereas VAMOS support showed no significant relationship with turnout change.
In contrast, the 2023 election shows a stronger and highly significant positive correlation between first-round Semilla support and turnout retention. This suggests that departments with higher initial Semilla support were much more likely to maintain their participation levels in the second round. While a formal statistical test comparing these correlationsFootnote 20 does not reach conventional significance thresholds, the contrasting patterns across elections remain worth examining.
In the bottom-right panel of Figure 8, we show a substantial increase in Semilla’s vote share in the second round across all departments, despite the overall decline in turnout. The spatial distribution of this support is revealing, as Semilla performed well in both urban areas, such as the Guatemala Department, and in some indigenous regions.
The consistent pattern of second-round disengagement across both elections suggests structural challenges in Guatemala’s formal electoral institutions. However, despite declining participation, the successful consolidation of support for Semilla in 2023 highlights how electoral outcomes can still be significantly influenced even with limited formal participation. This analysis shows we need to investigate political participation in formal electoral turnout and engagement in social arenas, which we examine in the following section.
4.3 Social Arenas as Political Arenas
Three types of social arenas are particularly significant as sites of political participation in Guatemala: indigenous governance systems, educational spaces, and religious groups and gatherings. Each of these has evolved to serve distinct political functions while remaining embedded in daily community life.
4.3.1 Indigenous Governance Systems
In Guatemala, 38.8% of the national population self-identify as members of indigenous groups (Maya, Xinka, and Garífuna) as of 2023 (Monzón Escobedo and Asturias Ramírez, Reference Monzón Escobedo and Asturias Ramírez2024). Most indigenous people live in rural areas (61.8%), with a significant female majority (53%), and are notably young, with 42.9% under eighteen years old. They are concentrated in specific regions, particularly Region II (Alta Verapaz and Baja Verapaz) and Region VII (Huehuetenango and Quiché). Significantly, 72.4% of the indigenous population speaks an indigenous language as their mother tongue, reflecting strong cultural preservation despite historical pressures.
However, indigenous peoples face substantial socio-economic challenges. While the national poverty rate stands at 56.0%, with 16.2% in extreme poverty, these figures are dramatically higher for indigenous populations (Monzón Escobedo and Asturias Ramírez, Reference Monzón Escobedo and Asturias Ramírez2024). These disparities are further reflected in literacy rates, with only 72.9% of the indigenous population literate, suggesting ongoing challenges in accessing education and other basic services (Mejia Villatoro et al., Reference Mejia Villatoro, Cabrera Ayala, Anzueto Garcia and Peralta Soto2024).
Based on the income distribution data shown in Figure 9, these socio-economic disparities are reflected in labour income patterns. Maya individuals, who comprise the largest indigenous group, earn a median monthly income that is nearly 30% less than their Ladino/Mestizo counterparts. The disparity is even more pronounced for Xinka people. While Garífuna communities show slightly higher median earnings, they still fall below the Ladino/Mestizo income levels. These income distributions, visualised through violin plots, reveal not only differences in median income but also less income variability among indigenous groups, suggesting more limited economic opportunities and mobility.
Income distribution by ethnic identity in Guatemala
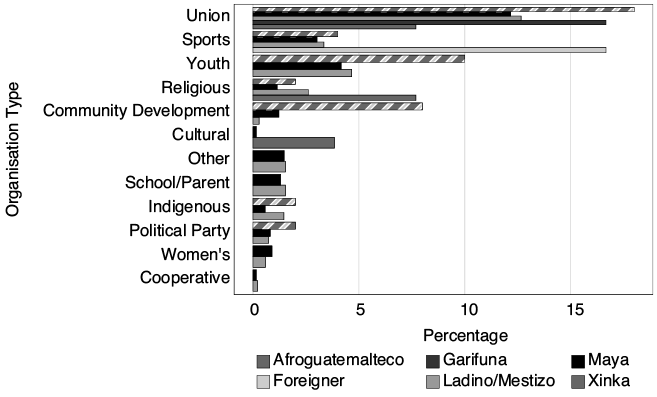
These socio-economic disparities have motivated indigenous communities to develop parallel governance structures rooted in traditional social spaces. Operating through communal assemblies, religious gatherings, and ancestral leadership networks, indigenous peoples have established effective mechanisms for resource distribution and service provision where state infrastructure falls short. This transformation of social spaces into venues for political organisation and resource management reflects historical resilience and pragmatic adaptation to persistent institutional gaps.
Figure 10 shows that marginalised groups strategically engage through multiple channels. Maya communities show particularly high engagement in union and youth organisations, whilst maintaining a significant presence in religious and community development spaces. This diversified pattern of participation, where indigenous peoples maintain a strong presence across various social spaces rather than concentrating solely in traditional political organisations, supports our argument that these spaces function as independent political arenas rather than mere stepping stones to formal participation. The relatively lower participation rates in formal political party structures (below 5%) compared to social organisations further emphasise how these social arenas serve as venues for political engagement when institutional channels prove inadequate.
Participation in social and political organisations by ethnic identity in Guatemala, 2023
Note: Distribution shown up to ninety-fifth percentile. White points indicate median income.
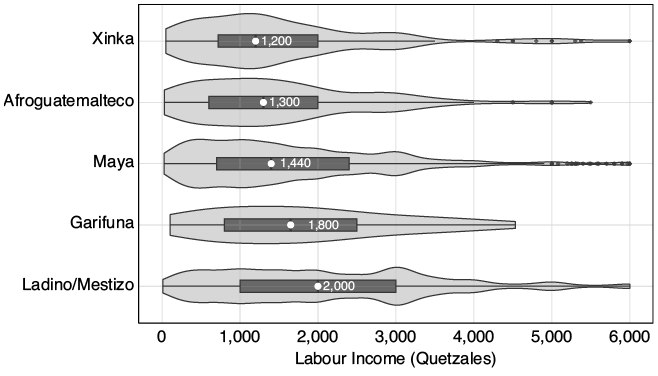
Indigenous governance networks in Guatemala demonstrate how social arenas can function as political arenas with sophisticated mechanisms for political coordination and resistance, especially around extractive projects. Community gatherings, traditionally used for addressing local matters, have been repurposed as forums for discussing mining impacts, coordinating legal strategies, and organising service provision such as healthcare for their communities (Hernández et al., Reference Hernández, Ruano, Hurtig, Goicolea, San Sebastián and Flores2019; Klick, Reference Klick2016; Millner et al., Reference Millner, Peñagaricano, Fernandez and Snook2020). Participation in these spaces is political because it facilitates local resistance and broader regional coordination, from organising community consultations (consultas comunitarias) about mining projects to coordinating inter-community networks for territorial defence (Aguilar-Støen and Hirsch, Reference Aguilar-Støen and Hirsch2017).
Community spaces for indigenous peoples in Guatemala serve as crucial arenas for organising resistance against mining projects, particularly when formal institutional channels prove inadequate. Q’eqchi’ communities, operating under the banner of ‘defence of territory’, have leveraged social spaces to challenge extractive industries through transnational networks connecting activists, NGOs, scientists, and journalists (Konforti, Reference Konforti2022b). This strategy aligns with the larger pattern observed across Latin America, where social spaces serve not merely as stepping stones to formal political participation but as legitimate venues for political engagement.
In La Puya, communities engaged international experts through environmental NGOs to challenge inadequate Environmental Impact Assessments (EIAS) (Aguilar-Støen and Hirsch, Reference Aguilar-Støen and Hirsch2017), achieving success through a 2015 court ruling that upheld their right to consultation. This exemplifies how local communities transform social spaces into centres of organised resistance. Similar success in community-based resistance efforts is evidenced by cases such as the Chabil Utzaj plantation, where organised indigenous opposition ultimately forced the cessation of operations, demonstrating how social spaces can effectively serve as sites of political mobilisation and resistance against resource extraction (Konforti, Reference Konforti2022a).
The effectiveness of these spaces as political arenas extends beyond environmental issues, as demonstrated during the 2023 electoral crisis. Indigenous authorities and communities, particularly the 48 Cantons of Totonicapán, transformed their organisational networks into powerful instruments of democratic resistance. Following months of careful coordination, these groups orchestrated a nationwide strike in October 2023, establishing roadblocks at 140 strategic points across Guatemala and maintaining a persistent encampment outside the Public Ministry headquarters. The mobilisation demanded the resignation of Attorney General Porras and an end to electoral interference (Matsuzaki and Schwartz, Reference Matsuzaki and Schwartz2024). Notably, unlike previous protest movements that were predominantly urban and educated (Azpuru et al., Reference Azpuru, Rodriguez and Zechmeister2018), the 2023 electoral mobilisations showcased indigenous authorities’ unique capacity to build bridges across civil society, fostering cross-ethnic solidarities in defence of democracy. This collective mobilisation demonstrates how social spaces serve not merely as stepping stones to formal political participation, but as autonomous political arenas in their own right.
4.3.2 School-Related Spaces (PRONADE)
The National Programme for Educational Self-Management Development (PRONADE) emerged in Guatemala in 1996 as an innovative educational initiative that transformed schools into a community empowerment and political arena. PRONADE established more than 3,400 schools nationwide, with the Alta Verapaz department having the highest concentration, accounting for roughly 20% of the country’s PRONADE schools. The programme was particularly significant in indigenous areas, with Alta Verapaz’s predominantly Q’eqchi’ communities finally gaining access to education services that had historically been absent (Altschuler and Corrales, Reference Altschuler and Corrales2012). The programme’s cornerstone was its decentralised structure, operating through local Educational Committees (COEDUCAs) that were legally empowered to manage Community Self-Management Schools, funded by the Ministry of Education. The programme became a significant platform for political engagement, particularly for indigenous parents who had traditionally been marginalised from institutional decision-making processes (Rojas et al., Reference Rojas, Valerio and Demas2005). Through COEDUCAs, parents gained unprecedented authority over their children’s education, including responsibilities for administrative tasks, school operations, and teacher hiring. Altschuler and Corrales (Reference Altschuler and Corrales2012) found that in Alta Verapaz, 77% of participating parents reported learning at least one new skill through their involvement, and 34% applied these skills to participation in other community organisations. Training played a crucial role: PRONADE provided support three times per year and required field staff to hold regular meetings with all council members, enabling the wider dissemination of learning and skills (Altschuler and Corrales, Reference Altschuler and Corrales2013). However, conservative gender norms often prevented women from taking active roles, with women rarely becoming council members unless no other willing male participants remained (López Molina, Reference López Molina2013). When women were involved, they were typically relegated to marginal positions.
PRONADE became increasingly controversial and politically charged, ultimately becoming a pivotal issue in the 2007 presidential election. The Teachers’ Union (STEG) strongly opposed the programme, arguing it undermined labour conditions and educational quality, while human rights groups criticised the uncompensated administrative burden placed on parents. The polarising debate culminated in presidential candidate Álvaro Colom’s campaign promise to dismantle PRONADE, which he fulfilled after winning the 2008 election. In this case, community-based educational initiatives became catalysts for broader political participation and electoral influence, particularly among traditionally under-represented rural and indigenous populations, even as they revealed the tensions between different stakeholders’ visions for educational governance.
4.3.3 Religious Spaces
The Catholic Church’s structure in Guatemala has been historically defined by a significant disparity between foreign and domestic clergy, with foreign priests constituting the majority and serving predominantly rural and indigenous communities (Tortolani, Reference Tortolani1973). This created a unique dynamic where religious spaces became sites of cultural tension and political transformation. While domestic clergy often maintained traditional perspectives, foreign clergy were more willing to engage with social change and community challenges. The transformation of religious spaces into arenas for political participation was further complicated by the syncretic nature of religious practice in rural Guatemala, where traditional Catholicism merged with indigenous beliefs and practices. These hybrid religious spaces, varying even between neighbouring villages, created distinctive venues for community organisation. As Hawkins (Reference Hawkins2021) documents, these spaces evolved from purely spiritual gatherings into forums for discussing community concerns and coordinating responses to state violence.
However, the political role of religious spaces was neither uniform nor uncontested. The scarcity of priests and the cultural divisions between foreign and domestic clergy often led to conflicting pastoral interpretations and approaches to community engagement (Tortolani, Reference Tortolani1973). These tensions, combined with pre-existing cultural and linguistic barriers, influenced how religious spaces could serve as venues for political participation, particularly during periods when formal channels were restricted or dangerous.
Based on ENCOVI 2023 data, there are notable patterns in religious gathering participation by indigenous identity and gender in Guatemala. As shown in Table 6, Garífuna women have the highest participation rate at 13.2%, significantly higher than that of their male counterparts (3.33%). Among Maya populations, women and men maintain relatively similar levels of participation (4.82% and 4.29%, respectively), representing one of the most balanced gender distributions in religious gathering attendance. Ladino/Mestizo groups show lower overall participation rates, with women at 2.50% and men at 1.81%. A consistent pattern emerges across all indigenous groups where women demonstrate higher participation rates than men, with particularly pronounced gender gaps among Garífuna and Afroguatemalteco communities. Notably, no participation was recorded among individuals identifying as Foreigners.
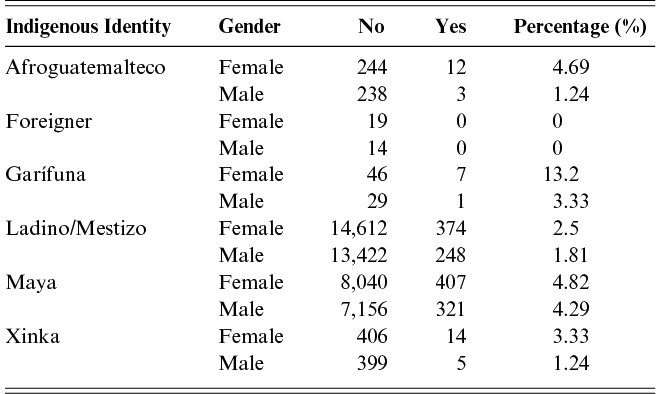
Table 6 Long description
Table showing the counts and participation rates for religious gatherings by indigenous identity group (Afroguatemalteco, Foreigner, Garífuna, Ladino/Mestizo, Maya, and Xinka) and gender (Female and Male) in Guatemala, using ENCOVI 2023 data. The results show that women consistently participate at higher rates than men across all groups with any recorded participation, with the most pronounced gender gap among Garífuna communities (13.2% female vs 3.33% male) and the most balanced distribution among Maya communities (4.82% female vs 4.29% male). No participation was recorded among individuals identifying as foreigners. Overall participation rates are low across all groups, ranging from 0% to 13.2%.
Note: Percentages represent the proportion of individuals participating in religious gatherings within each indigenous identity and gender group.
These participation patterns are important in our broader understanding of how social arenas function as political arenas. Religious spaces in Guatemala exemplify our argument that social arenas can function as parallel channels for political engagement, especially for groups traditionally marginalised from formal political institutions. During Guatemala’s internal armed conflict and subsequent political transitions, these religious gatherings served as safe spaces where indigenous communities could maintain political agency despite systematic exclusion and violence. The higher participation rates among indigenous women, particularly Garífuna women, further suggest that religious spaces may serve different political functions for women compared to men, potentially offering women avenues for political expression and leadership development when formal political channels remain dominated by men. This points to the idea that understanding political participation in contexts of institutional weakness requires examining the social spaces where marginalised groups sustain political engagement despite institutional barriers.
4.4 Closing Remarks
The Guatemalan case demonstrates how electoral participation patterns cannot be fully understood without examining the broader ecosystem of political engagement through social arenas. The consistent pattern of second-round disengagement across both elections, despite the contrasting political contexts, suggests structural challenges in Guatemala’s formal electoral institutions. Yet the successful consolidation of support for Semilla in 2023, particularly in departments with strong indigenous governance systems, reveals how social arenas matter for electoral mobilisation when aligned with community interests. The interaction between formal electoral processes and community-based political organisation highlights our central argument that examining only traditional metrics of political participation provides an incomplete picture of political engagement.
5 Peru
In this section, we discuss the relevance of social arenas as political participation arenas in Peru through two narrative cases. First, we focus on the role that religious spaces, especially those led by the Catholic and Evangelical churches, and parents’ associations have had in the counter-education reform. Second, we explore how rondas campesinas and workers’ unions (particularly teachers’ unions) were instrumental in Pedro Castillo’s unexpected 2021 presidential victory. Throughout our analysis, we also consider other politically important social arenas, including neighbourhood associations, peasant communities, and grassroots social organisations linked to social programmes.
This section begins with a brief introduction to the Peruvian case, followed by an overview of how electoral participation has evolved in the country. Next, we will present a panorama of various participation arenas, examining participation rates in different spaces and geographical variations. Then, we will examine how certain demographic characteristics of Peruvian citizens correlate with participation in different arenas and how this, in turn, relates to varying evaluations of democracy. Finally, we will examine how these social arenas (rural patrols, teachers’ unions, churches, and parents’ associations) underscore the significance of studying participation in social arenas as a form of political participation.Footnote 21
5.1 Peru: Recent Years of Instability
Peru is a unitary presidential republic, with presidential and legislative elections held every five years and local elections every four years. The country is characterised by a highly fragmented and unstable party system (Levitsky, Reference Levitsky and Mainwaring2018), with a disconnect between national parties and regional/provincial movements and parties (Muñoz and Dargent, Reference Muñoz, Dargent, Van Dyck, Loxton, Domínguez and Levitsky2016) that has left both national parties without strong grassroots support and regional movements as localised and disconnected from each other and the national arena. Additionally, the Peruvian Congress (with 130 members) has an unusual amount of power for a presidential system, a factor that has partly contributed to the political instability seen since 2016. Due to a broad interpretation of the impeachment provisions in the 1993 constitution, which list ‘moral incapacity’ as a cause for impeachment without ever defining it, the Congress has the authority to initiate an impeachment process against the President for anything deemed ‘moral incapacity’.
Even without a stable and consolidated party system, Peru appeared relatively stable after its return to democracy in 2001; however, this changed in 2016 following the election of Pedro Pablo Kuczynski. While Kuczynski’s narrow victory in the run-off of the 2016 election initially seemed like a ‘win for continuity’, especially compared to the alternative of Fujimori’s party controlling both the executive and the legislature (Dargent and Muñoz, Reference Dargent and Muñoz2016), things quickly moved towards instability due both to the tensions between the Fujimorismo-controlled legislature and Kuczynski’s government and the revelations of the Lava Jato case (Gonzalez-Ocantos et al., Reference Gonzalez-Ocantos, Muñoz Chirinos, Pavão and Baraybar Hidalgo2023). What followed was a series of impeachment processes and changes in the presidency. After Kuczynski was ousted in March 2018, his vice president, Vizcarra, took office and called for a constitutional referendum that led to important reforms, especially in the judiciary and campaign financing. Vizcarra constitutionally dissolved the congress due to their attempts to block further political reforms and called for an extraordinary legislative election for January 2020, where we saw the brief emergence of the FREPAP, an evangelical political party, as an important political force (they got fifteen congressional seats in that election but none in the 2021 election). Vizcarra was impeached in October 2020, amid the COVID-19 pandemic, due to corruption allegations and was replaced by Manuel Merino (the president of Congress), who lasted only five days in office due to mass protests. After Merino, a new interim president, Francisco Sagasti, took office until the 2021 election. In 2021, we witnessed the surprising victory of Pedro Castillo, whose presidency lasted only until December 2022, when he attempted a self-coup and was removed by Congress, leaving his vice president, Dina Boluarte, as the new president. Boluarte’s government also faced vast public oppositionFootnote 22 and was later impeached in 2025, continuing the cycle of instability.
Peru provides an ideal case study of political participation arenas beyond traditional political ones, not only because of weak political parties that are not functional participation spaces, but also because recent years of political upheaval have highlighted the political importance of social arenas.
5.2 Electoral Participation
In Peru, voting has been mandatory for eligible adults since the beginning of the Republic, with ‘Reglamento de Supremo Delegado’ sanctioning citizens who did not vote by disqualifying them from voting in the future. This was later further formalised in the Constitution of 1920, which established the registry of voters, and then in the Constitution of 1933, which established both mandatory registration and voting (Paniagua Corazao, Reference Paniagua Corazao2003). Throughout history, Peru has enforced mandatory voting through financial sanctions. Voting is thus mandatory for all citizens over eighteen years (women were included in the voters’ registry in 1955Footnote 23). Nevertheless, we have observed variations in turnout over the years.
Let’s examine only the first round of the past four presidential elections in Peru. We can observe that the rate of absenteeism has steadily increased since the 2006 election, reaching a peak of 30% in the 2021 elections. The rate of invalid votes has also risen, albeit less dramatically, reaching a high of 18.7% of all votes cast in 2021,Footnote 24 as seen in Figure 11.
Rate of absenteeism and invalid votes in Peru in presidential elections
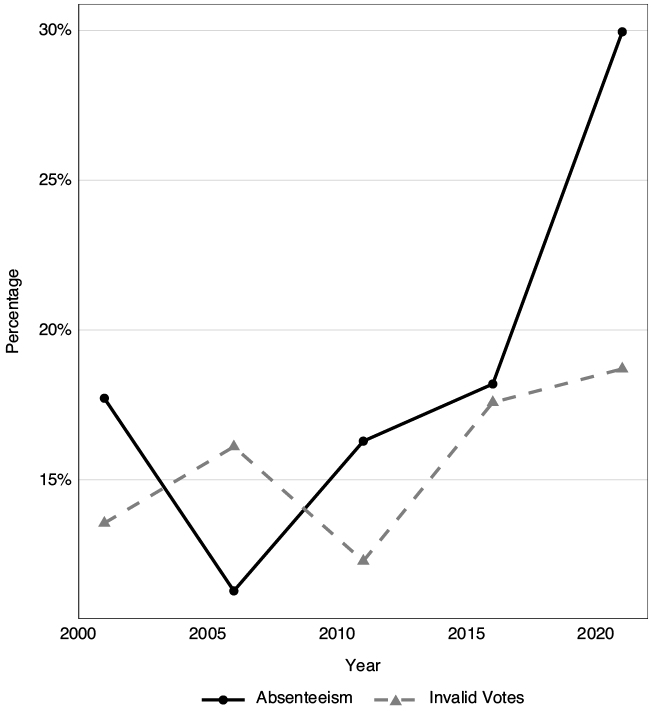
While the COVID-19 pandemic can explain part of the rise in absenteeism in 2021, the political instability in the country since 2016, as well as discontent among the population, likely exacerbated it (Barrenechea et al., Reference Barrenechea, Encinas, Barrenechea and Encinas2022). Absenteeism rates have never been uniform. As we can see in Figure 12, if we compare the rate of absenteeism across regions of the country, we can see that in 2021, highest levels of absenteeism could be seen in Amazonian regions such as Madre de Dios and Loreto, but there is also a strong pocket of absenteeism in the south of the country in the regions of Huancavelica, Ayacucho, and Apurimac. A similar trend is observed in the rate of invalid votes.
Rate of absenteeism across regions in Peru 2001 and 2021 presidential elections
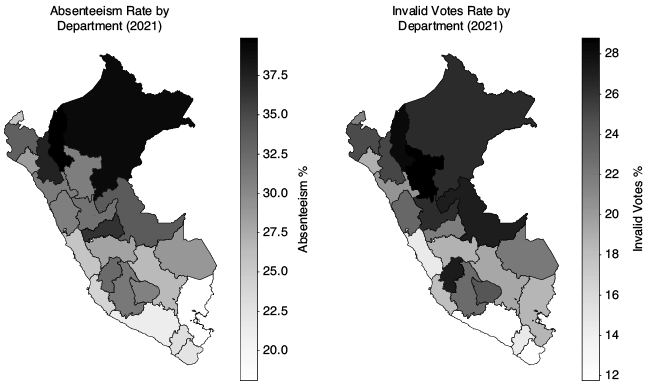
Thus, even in a country with mandatory voting, there are high levels of absenteeism and invalid voting, highlighting the weakening of traditional political arenas.
5.3 Political and Social Arenas
As we saw in the previous section, even though voting is mandatory, electoral participation has declined over the years. While this decline may result from a combination of discontent and access difficulties, it is also part of a larger trend that affects other participation arenas, particularly traditional political ones. It is well established that political parties are weak in Peru (Levitsky and Cameron, Reference Levitsky and Cameron2003), as reflected in the high degree of electoral volatility (the lack of stable party support) even compared to other countries in the region (Carreras and Acácio, Reference Carreras, Acácio and Hannah2019). Previous work has argued that due to the absence of strong political parties that could canalise demands, ‘movements have often looked for other sorts of mediation to exert political pressure (throughout NGOs, Church-based local organisations or the Defensoría)’ (Crabtree, Reference Crabtree2010, p. 376). Here, we argue that social arenas not only function as spaces to coordinate mediation but also as political arenas, where demands are articulated and salient political initiatives originate.
We rely on ENAHO (National Household Survey) data to study participation across different arenas in Peru. The ENAHO collects data at both individual and household levels, with some modules being answered only by the household head, while all household members answer others. The Supplementary Materials provide more details on the ENAHO design, weights, and modules used.
Respondents were asked about their participation in nineteen arenas, as seen in the Supplementary Materials. Across the nineteen years we include in our dataset (2004–2023), some arenas were replaced by others, and some new arenas were added only in recent waves (such as participation in the School Meals programme, which was added to the list only since 2016). For the analysis, we restrict it to the years in which data were available for the participation area.Footnote 25
As shown in Figure 13, the total reported participation rate across these arenas over the years indicates that approximately one in every two households had at least one individual participating in at least one of the listed arenas. At the individual level, around one in five individuals reported participating in one or more of the listed arenas. It is important to note that this does not imply sporadic participation, as the question directly asks whether people belong to these groups or programmes, which implies a higher degree of commitment. It is also worth noting that participation declined during the pandemic years, though the current trend is rising towards pre-pandemic levels.
Individual and household participation rate – Any group or organization
Note: Shaded areas represent 95% confidence intervals. Survey-weighted estimates.
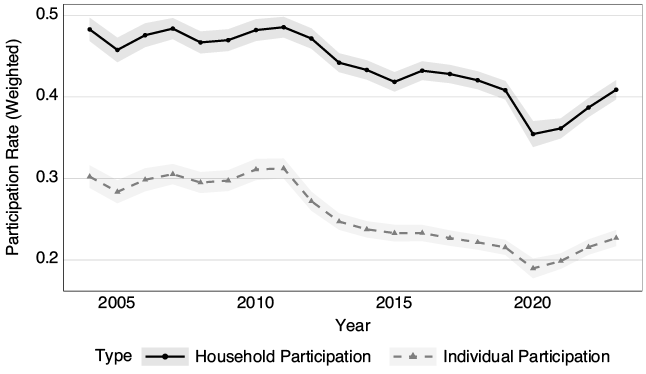
Figure 14 shows the average participation rate across different arenas, based on data from 2004 to 2023.Footnote 26 Although general participation appears to be high, upon examining participation in political groups or parties – traditional arenas of political participation – we can see that the average rate is comparatively low.
Participation rate by group or organization
Note: Unweighted mean participation rates across all available years.
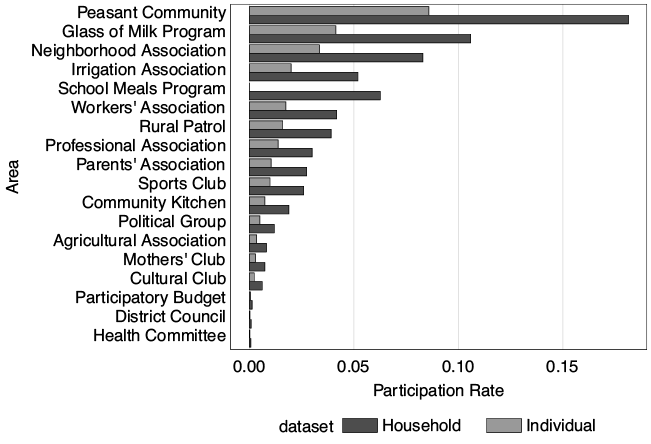
Some notable observations include the high participation in what we previously denoted as local social arenas, such as peasant communities and rural patrols (rondas campesinas). We also see a comparatively high participation rate in workers’ associations (including unions and similar organisations). Although ENAHO data on participation do not include participation in religious groups, we can see that participation in parents’ associations, although lower than in workers’ associations and rural patrols, is still higher than in traditional political arenas.
One further thing that stands out is that for School Meals, a programme with both beneficiaries and participants among the general population, where parents participate in preparing school meals, we observe a high rate of household participation but no individual participation. This is because we constrained the individual-level dataset to individuals eighteen years or older. In this instance, household participation captures instances in which the household head reported that minors participated in these programmes. This suggests confusion in how respondents understood the question, leading them to equate participation with benefit. A similar thing happens with participation in other organisations linked to social programmes, and it’s another reason to constrain the individual dataset to individuals eighteen years and older.
Participation in School Meals is part of participation in ‘organizaciones sociales de base’ (grassroots organisations). These organisations have the role of providing meals (and some other services) to the vulnerable population in the country through cooperation with the state social programmes. In addition to the School Meals programme,Footnote 27 we have the Glass of Milk programme (Vaso de leche), which aims to provide one meal a day to the vulnerable population, prioritising children from 0 to 6 years old and pregnant women; the Community Kitchens programme; and the Mother’s Clubs, which provide services such as occupational training, meals, among others. Although we do not focus on this arena, analysing whether participation in grassroots organisations that coordinate with the state to provide welfare programmes can be considered political participation is an interesting avenue for future research, as briefly discussed in Section 2.
To explore time trends in participation in these arenas, we grouped them. Thus, we created the category of Political for traditional political arenas (Political groups/parties, District Councils, and Participatory Budgets), grassroot participation linked to social programmes (School Meals, Glass of Milk, Community Kitchens, and Mother’s Clubs), cultural (Sports Clubs and Cultural Clubs), workers (Workers Associations/Unions and Professional Associations), and agricultural (Agricultural Association and Irrigation Association).Footnote 28 The other categories were kept the same.
As shown in Figure 15, participation in traditional political arenas has consistently been the lowest, surpassed by participation in parents’ associations since 2012. We also see, as previously noted, that most forms of participation declined during the pandemic, though the decline was more pronounced in some arenas (such as peasant communities) than others.
Individual participation rate over time
Note: Shaded areas represent 95% confidence intervals. Survey-weighted estimates.
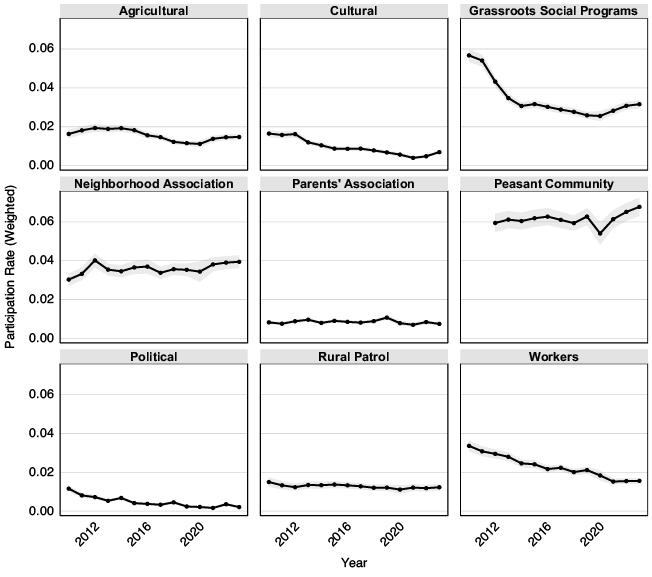
As mentioned, the ENAHO dataset does not ask about participation in religious meetings or organisations, as LAPOP does, but it does include a Governance Module that asks participants about their social identity. They are asked with which group or community they identify, and the options are: (1) department, province, or town; (2) ethnic or race; (3) indigenous or peasant community; (4) religious group or religion; or (5) other. This module only includes people over eighteen and has its own expansion factor.
Since this question directly asks whether people identify most with their religious group, even above other important identities such as ethnic identity or community, it serves as a useful measure of the importance of religious identity. And while identifying with a group is not the same as participating in groups associated with this identity, both are undoubtedly interlinked, with the act of participating often strengthening identity and with strong identities leading to further participation, as Durkheim (Reference Durkheim2008, p. 193) posits:
Their unity comes solely from the fact that they have the same name and the same emblem, from the belief that they sustain the same relations with the same categories of things, that they practise the same rites, in short that they participate in the same totemic cult.
Thus, while the ENAHO survey does not measure direct political participation, we can use religious identity as an approximation towards it.
In Figure 16, we can see that among adults in Peru, identification with religious groups is the strongest, surpassing identification with the locality and even above ethnic/racial and indigenous communities. This aligns with our expectations, as outlined in Section 2’s discussion of the recent role of religious groups in the region.
Identity proportion by group
Note: Shaded areas represent 95% confidence intervals. Survey-weighted estimates.
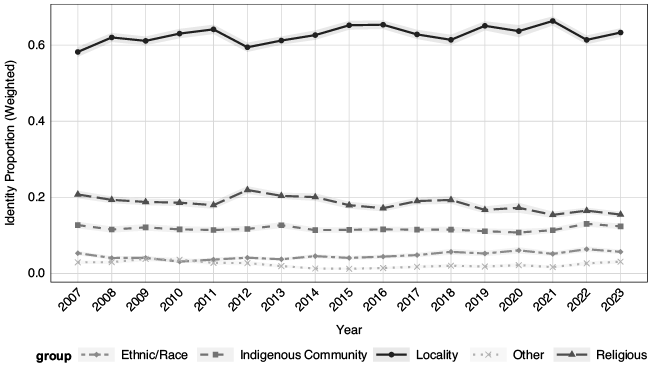
5.3.1 Participation Across the Territory
As we have seen previously, electoral participation varies across the territory, with higher absenteeism rates in the southern part of the country. We also wanted to explore territorial variation in participation in social arenas. To do this, we calculated the average individual participation rate (of individuals over eighteen years) at the department level (the level for which the ENAHO yearly data is representative), for the last electoral year (2021).
As shown in Figure 17, there is some territorial variation in participation in arenas outside traditional political arenas.Footnote 29 We can see that participation in peasant communities is more concentrated in the south. In contrast, participation in rural patrols is more concentrated in the north of the country (where these organisations originated). There is also less marked variation in participation in cultural groups (sports and cultural clubs) and in grassroots organisations linked to social programmes. However, for the latter, we do see higher rates in some departments, such as Huancavelica, Pasco, Loreto, and Piura, which is not surprising considering that these departments are among the poorest in the country.Footnote 30 We also observe territorial variation when examining the question of identity, which, as discussed earlier, serves as a proxy for religious participation.
Participation rate in 2021
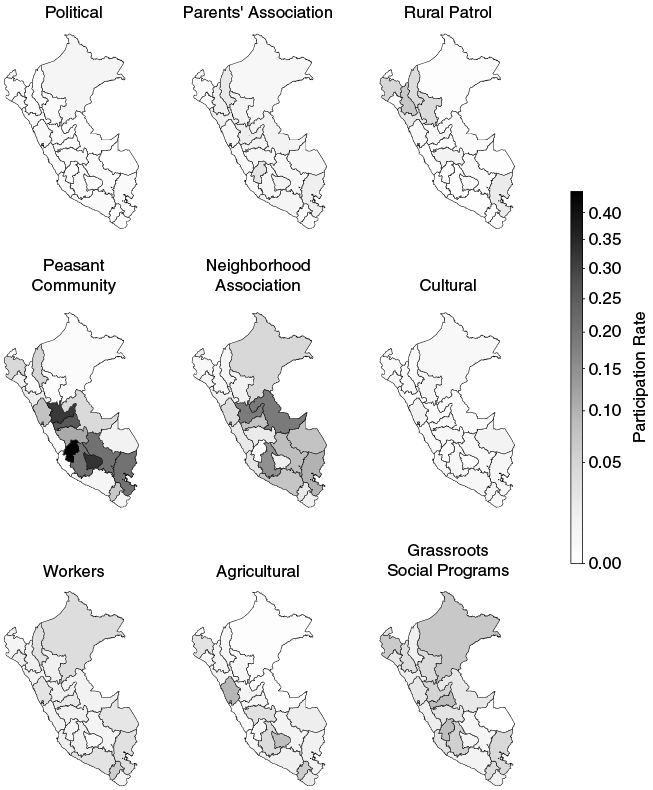
As shown in Figure 18, although a relatively high proportion of people identify with their locality across all departments, there is more variation in their other identities. We can see that the proportion of people who identify mainly with their indigenous or peasant community is higher in Huancavelica, Ayacucho, Apurimac, and Pasco. This is surprising since, according to the 2017 census, the highest percentage of indigenous population (from the Andes) is located in Lima (23.1%). However, it is essential to note that the ENAHO question asks respondents to identify with the group with which they feel most connected. Thus, this does not necessarily reflect the actual distribution of the indigenous population. Finally, we see a comparatively high proportion of people who identify most with their religious group across all departments, with slightly higher proportions in Loreto, Amazonas, Arequipa, and Apurimac. As discussed in Section 2, both the Catholic and the Evangelical Church have been involved with indigenous communities and have a strong presence in the Amazon.
Identity proportion in 2021
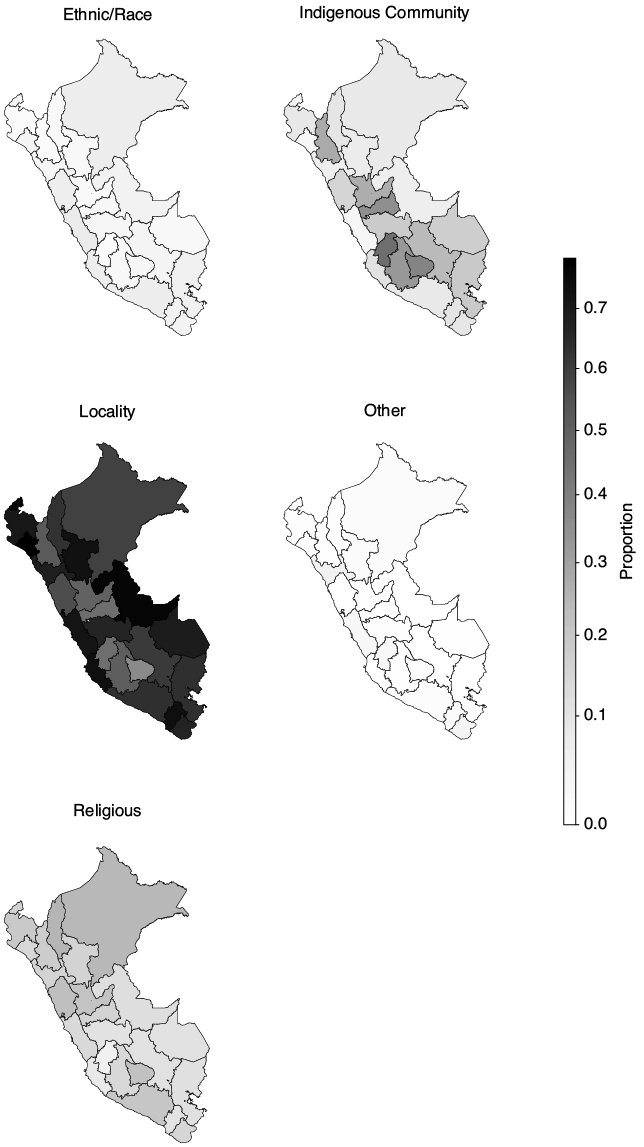
5.3.2 Correlates of Participation in Different Arenas
Now, we will explore the characteristics that make Peruvians more likely to participate in these arenas, while partially replicating the analysis presented in Section 3.
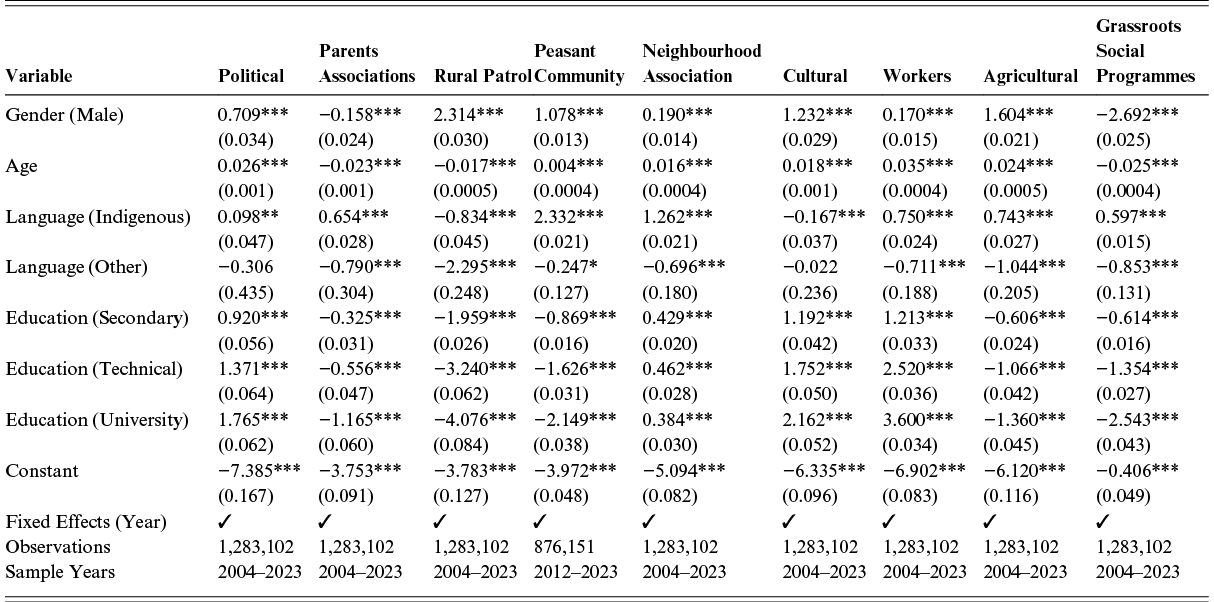
Table 7 Long description
Table showing the results of survey-weighted regression models for participation in different arenas (Political, Parents Associations, Rural Patrol, Peasant Community, Neighbourhood Association, Cultural, Workers, Agricultural, and Grassroot Social Programmes) by demographic characteristics (Gender, Age, Language, and Educations) in Peru using the ENAHO data set. The results show that being a man correlates to higher participation in all arenas, except parent associations and grassroot social programmes. Being older also correlates with higher participation, with the exception of participation in Parent Associations, Rural Patrols, and Grassroot Social Programmes. Speaking an indigenous language also correlates to higher participation in most arenas, with the exception of Rural Patrols and Cultural groups. And a higher degree of educational attainment correlates to more participation in Political groups, Neighbourhood Associations, Cultural groups, and Workers associations.
Note: Reference category: Female, Spanish speaker, Primary education or less. *p < 0.1; **p < 0.05; ***p < 0.01.
As Table 7 shows, men are more likely to participate in rural patrols, agricultural organisations, cultural clubs, and traditional political arenas. Women are more likely to participate in grassroots organisations linked to social programmes. Although we also see some gender differences in participation in neighbourhood associations, workers’ organisations, and parents’ associations, these differences are smaller.
We also see that the effect of age is generally modest. Still, younger adults are more likely to participate in grassroots organisations linked to social programmes, parents’ associations, and rural patrols. For the former two, this is likely due to their higher likelihood of having school-age children, and rural patrols historically emerged as spaces for young males to participate (Yrigoyen Fajardo, Reference Yrigoyen Fajardo2002).
As mentioned, the ENAHO Demographic Module does not directly ask people about their ethnic/racial identity, but the Education module does ask them about their mother tongue, which we used as a proxy. The question has multiple alternatives, which we grouped into Spanish, Indigenous,Footnote 31 and Other.Footnote 32 As shown in Table 7, respondents whose mother tongue is an indigenous language (with Spanish as the baseline) report significantly higher participation in peasant communities, neighbourhood associations, workers’ associations, agricultural organisations, and parents’ associations. This reinforces some of the findings of Section 3, showing that these social arenas are especially relevant for potentially marginalised groups.
Finally, regarding education, we decided to recode the variable into four categories: primary or less, secondary, technical, and university or more. We find that people with higher levels of education are more likely to participate in traditional political arenas (political parties, district councils, and participatory budgets). This effect is particularly high for people with a university education or higher. We also find similarly strong effects for cultural clubs (including sports and cultural clubs) and workers’ associations, with individuals having higher levels of education being more likely to participate. For participation in workers’ associations (unions and professional associations), the effect is also higher for individuals with a university education, likely because they are more likely to be employed in the formal sector. We also see that individuals with lower levels of education (primary or less) are more likely than those with higher levels of education to participate in rural patrols, peasant communities, agricultural organisations, and grassroots organisations. These results also highlight the need to examine political participation in social arenas as particularly relevant for individuals who may face higher barriers, linked to education and gender, in entering traditional spaces.
Since ENAHO does not include religious participation in the participation module but does include a question on identity in which religion is one of the options, we conducted a similar analysis using this question, taking Local Identity as the baseline, as shown in Table 8.
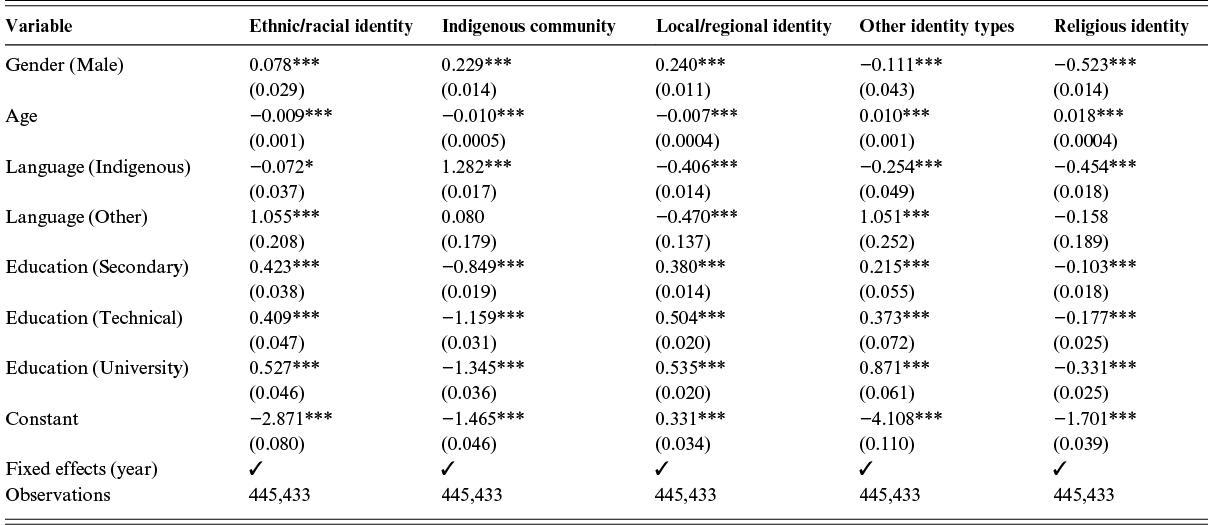
Table 8 Long description
Table showing the results of survey-weighted regression models for identification with different identities (ethic/racial, indigenous community, local/regional identity, other identity types, religious identity) by demographic characteristics in Peru using the ENAHO data set. The key identity here is the religious identity, since there are no measures of participation in religious meetings in the ENAHO in Peru. The results show being a woman, older, Spanish speaking and having lower levels of educations correlates with identifying with a religious group.
Note: Reference category: Female, Spanish speaker, Primary education or less. *p < 0.1; **p < 0.05; ***p < 0.01
While males are more likely to identify primarily with the other two categories (ethnic/race and indigenous or peasant community), women are more likely to identify primarily with their religious group. We also observe that individuals with lower levels of education (primary or less) are more likely to identify primarily with their religion. This highlights the importance of religious identity, and thus of religious participation, for potentially marginalised groups like women and people with lower levels of education.
Finally, we examined how different forms of participation (and identity) correlated with perceptions of democracy’s importance. Because we could only use data from the Governance module, which has its own expansion factor, and we added the participation variables to those included in the Governance module, the results should be taken as descriptive. We decided to use the question ‘In Peru, do you think democracy is: (1) Not important, (2) A little important, (3) Important, (4) Very Important’Footnote 33 due to data availability and because it captures whether people hold at least some abstract support for democracy.
Similarly to what we saw in Section 3, in Figure 19, we can observe a positive correlation between participation in traditional political arenas and a higher perceived importance of democracy in Peru. We also see that participating in workers’ organisations and cultural groups (sports and cultural clubs) has a similar positive effect on perceptions of democracy’s importance. However, participation in other social arenas, such as peasant communities, grassroots organisations linked to social programmes, and rural patrols, correlates with negative evaluations of democracy’s importance. We observe a similar trend, although to a lesser extent, with participation in neighbourhood associations and agricultural groups. We also see that identifying with a religion or religious groups, in contrast to one’s locality, also negatively correlates with evaluations of the importance of democracy. As we discussed, these results suggest that participation in different arenas can lead to different relations with the democratic system and the state. Here, we are not attempting to establish directionality; participants in social arenas may value democracy less because participation in these arenas is more likely among individuals who see themselves disenfranchised and/or excluded in traditional political arenas. But it is also possible that these spaces themselves promote a type of relation with democracy that leads to it being seen as less valuable.
Importance of democracy
Note: Reference category for identity: Local/Regional. Bars represent 95% confidence intervals. Model includes year fixed effects (not shown).
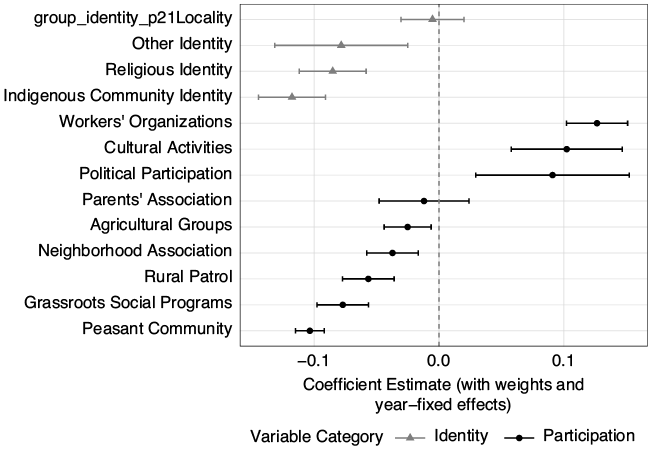
5.4 Churches and Schools: The Counter-Educational Reform
Having examined the general panorama of participation in Peru, we will now analyse how these social arenas function as arenas for political participation through two brief narrative accounts. Our first case centres on the educational and religious social arenas. To this end, we will focus on the development of counter-educational reform in Peru and show how these arenas functioned as spaces for political participation, from which initiatives, movements, and figures emerged.
In Peru, according to the 2017 census, 76% of the population identified themselves as Catholic and 14.1% as Evangelical. In the Catholic faith, this represented a decline from the 2007 census, when 81.3% of Peruvians identified as Catholic. The slight increase in people who identify as evangelical is also relevant if we consider that in the extraordinary elections of 2020, we saw the election of fifteen congresspeople from Frente Popular Agrícola Fía del Perú (FREPAP), the political party founded by the Evangelical Association of the Israeli Mission of the New Global Pact (Aeminpu). Evangelism has been on the rise in Peru, as in the rest of the region, and in recent years, this movement has been characterised by its closeness to the North American religious right. Therefore, it’s unsurprising that evangelical groups in Peru have also been active in the counter-educational reform. As we saw in Figure 16, Peruvians are highly likely to identify with their religious group, thereby reinforcing the influence of these groups in the political landscape.
The political influence of the church and religious spaces is particularly notable in Peru, where the evangelical church has actively advocated for structural transformation at the local level, with a strong connection to indigenous communities (Scarritt, Reference Scarritt2013). These groups are also culturally conservative, and evangelicals have become key proponents of a conservative agenda that opposes LGBTQ+ policies, reproductive rights, and educational reforms (Sosa-Villagarcia and Rozas Urrunaga, Reference Sosa-Villagarcia and Rozas Urrunaga2021; Tello Aguinaga, Reference Tello Aguinaga2024), aligning with regional trends in Section 2. The political influence of organisations linked to the evangelical faith has been both direct (with religious politicians serving as direct proponents of counter-reforms) and indirect (with various groups associated with the evangelical movement exerting pressure and promoting a conservative discourse), demonstrating that these spaces function as political arenas in both cases.
These spaces became especially relevant after 2006, when laws protecting LGBTQ+ people and attempts to reform school curricula took centre stage and started to face backlash from groups linked to evangelicalism (and the Catholic Church) (Rousseau, Reference Rousseau2022; Tello Aguinaga, Reference Tello Aguinaga2024). For example, we have spaces like the ‘Coalición Internacional Pro Familia’ (Ciprofam), which lobbied against LGBTQ+ protections (Tello Aguinaga, Reference Tello Aguinaga2024) and the ‘Coordinadora Nacional Pro Familia’, funded by Christian Rosas Calderon. Christian Rosas, who later headed the conservative collective ‘Don’t mess with my children’, was formed and socialised in evangelical organisations, particularly the ‘Iglesia Alianza Cristiana y Misionera’, created by his father and congressman Julio Rosas Huaranga.
These spaces became especially relevant in the counter-reform movement in education, which emerged in opposition to the new school curriculum approved by Ministerial Resolution N. 281-2016-Minedu in June 2016. This new school curriculum incorporated a gender perspective to promote gender equality. As Rousseau (Reference Rousseau2022) highlights, Peru played a key role in creating and disseminating the countermovement against the so-called ‘gender ideology’.
One of the biggest opponents to the reform of the national curricula was the collective ‘Don’t mess with my children’,Footnote 34 which, as previously mentioned, is linked to the conservative evangelical movement. This collective alleges that the new curriculum introduces a ‘gender ideology’ that contradicts the idea of only two genders.Footnote 35 This collective mainly expressed itself through mobilisation in the streets and on social media, but it also found support in the 2016–2020 Congress, with 20 out of 130 congresspeople supporting the collective and many conservative evangelical and Catholic members of Congress advancing its demands.
Although the spaces we have discussed have been linked to evangelism, the evangelical church and groups associated with it have coordinated with the Catholic Church in their counter-reformation agenda. For example, while the ‘March for Life’, a yearly manifestation against abortion, has been historically coordinated by the Catholic Church, it has received the adherence of the evangelical collective ‘Don’t mess with my children’ since 2018. Similarly, the multitude of manifestations organised by ‘Don’t mess with my children’ have seen the participation of citizens and politicians outside the evangelical faith.
While these religious organisations have played an important role in the counter-reform movement in Peru, parent associations have also emerged as significant spaces. Parents in Action, which emerged in 2016, was initially formed by a small group of parents, around six couples, among which were lawyers who proposed to present a popular action demand against the curriculum, arguing that it was not valid because civil society was not consulted about it (Castro-Pérez, Reference Castro-Pérez2024), even though the curriculum underwent a consulting process among experts, parents, and teachers. This group presented a popular action demand in 2016, which the judicial power declared unfunded in 2019, something the collective criticised. The collective continued to exert pressure and was joined in this effort by established collectives, such as ‘Don’t mess with my children’, and emerging platforms like Peruvian Parents.Footnote 36
The conservative counter-reform movement achieved its greatest success in 2022 when the Peruvian Congress passed Law 31498, proposed by evangelical congressman Esdras Medina. This legislation allows parent associations and non-governmental civil society organisations to review school textbooks that have already been published and those that are still in development. This law also said that ‘education should not be a means to promote any type of social or political ideology’, making clear reference to the so-called ‘gender ideology’. This law’s regulations were published in September 2023 and limited its application to parents of children in public schools, prompting criticism from ‘Padres Peruanos’. It is still unclear how the observations from parents in parent associations will be implemented, or whether they will be implemented at all, as mentions of the approved law in other normative documents refer only to other components.
5.5 ‘Rondas Campesinas’ and Unions: Beyond the Election of Castillo
In 2021, Pedro Castillo was elected president after a highly competitive runoff election and against all predictions. Castillo, a rondero linked to the radical sectors of the teachers’ union, was an unlikely candidate and even an unlikelier winner. The election of 2021 in part reflected the aggravation of a long-seen tendency of social discontent and distrust towards politics and parties, alongside political fragmentation (in 2021, there were nineteen candidates for the presidency), where Castillo emerged as a populist leader who painted the country’s political class as corrupt and as enemies of the people (Muñoz, Reference Muñoz2021). However, it also exemplified the political importance of social arenas such as the ‘rondas campesinas’ and teachers’ unions, whose role as political arenas in Peru goes beyond Castillo’s presidency.
Rural patrols (‘rondas campesinas’) emerged in the 1970s in the northern highlands of Peru.Footnote 37 They initially formed as a community response to security issues, particularly cattle theft and crime, which had increased due to the state’s abandonment of rural areas following the dissolution of haciendas (large estates) after the land reform. While they began as surveillance groups, they quickly expanded their function beyond security to include conflict resolution, local governance, and mediation with the state (Yrigoyen Fajardo, Reference Yrigoyen Fajardo2002). Rural patrols are organised around community assemblies, where all residents participate through democratically elected committees. As shown in Table 7, men and individuals with fewer years of education are more likely to participate in these spaces.Footnote 38
Rural patrols emerged as important political arenas, not only in isolation but also in relation to other social and political arenas. As Degregori et al. (Reference Degregori, Coronel, Pino and Starn1996) point out, by providing local protection, rural patrols contributed to the re-emergence of other societal arenas, such as parent associations. These patrols were important in the context of conflict, for example, during the Internal Armed Conflict in the 1980s and 1990s, ronderos were active in the defence of their communities, which led to them being targeted by the Shining Path (Pærregaard, Reference 98Pærregaard, Webster and Engberg-Pedersen2002). They also emerge as important arenas in extractive conflicts, such as the CongaFootnote 39 conflict (Duárez-Mendoza et al., Reference Duárez-Mendoza, Minaya-Rodríguez, Perez-Pachas, Segura-Celis, Duárez-Mendoza, Minaya-Rodríguez, Perez-Pachas and Segura-Celis2019).
Pedro Castillo was part of the ‘Central Única Nacional de Rondas Campesinas del Perú’ (Cunarc-P); this group was an important supporter of his candidacy, especially during the days after the election, when Fuerza Popular alleged fraud.Footnote 40 But even beyond the election, the Cunrac-P remained a relevant political arena from which a series of demands emerged. Leaders of this group lobbied Castillo and his cabinet to fulfil a series of demands. For example, a report by Ojo Público (2022) argued that representatives from the Cunarc-P had meetings with Castillo to propel a series of projects, among which were: the creation of a new registry for indigenous peoples, peasant communities and rural patrol,Footnote 41 and the establishing of a general amnesty for members of rural patrols, urban patrols, and indigenous communities accused, investigated, prosecuted, or convicted of crimes related to what the Curnac-P saw as derived from the exercise of their authority and functions.Footnote 42 Thus, even separate from the figure of Castillo, this arena functions as a political arena, where demands were articulated.
Teachers’ unions are also an important political arena in Peru. On multiple occasions, members of teachers’ unions in Peru have managed, through the pressure exerted via strikes (Duárez-Mendoza et al., Reference Duárez-Mendoza, Minaya-Rodríguez, Perez-Pachas, Segura-Celis, Duárez-Mendoza, Minaya-Rodríguez, Perez-Pachas and Segura-Celis2019), to alter reforms to the public teachers’ career (Carrera Publica Magisterial – CPM) and achieve benefits such as salary increases. The main teachers’ union in Peru is the SUTEP, the ‘Sindicato Único de Trabajadores de la Educación en el Perú’ (SUTEP), which was founded in 1972 and officially recognised by the Peruvian state in 1984. However, the history of teachers’ unions goes back further in time, with multiple atomised unions emerging linked to different political forces.Footnote 43
In the 2000s, the SUTEP, controlled by Patria Roja (a Peruvian communist party), continued to exert political pressure, organising strikes to demand higher salaries and to oppose reforms to the CPM (public teaching career path). In 2003, the SUTEP factionalised, and the ‘Comité Nacional de Reorientación y Reconstrucción del SUTEP’ (CONARE-SUTEP) emerged as a significant political arena. The CONARE-SUTEP was further divided into two factions, the CONARE-Proseguir and the CONARE-Movadef. The latter was a faction formed in 2009 to demand the liberation of Abimael Guzmán and others arrested during the Internal Armed Conflict (Arce, Reference Arce2023). Still, although the teachers’ union was divided, they united to strike against reforms to the CPM and to demand salary increases.
Castillo first emerged in the political scene in 2017, as the figurehead of the public-school teachers’ strike promoted by the CONARE-SUTEP. During this strike, CONARE-SUTEP demanded the derogation of the teacher evaluations provided for in the Law of Teachers’ Reform, in addition to the salary increases SUTEP had demanded. The strikes against the reform were led by Castillo, who was elected president of the ‘Comité de Lucha de las Bases Regionales del SUTEP’. Although the reform was not abolished, these strikes positioned Castillo in the political scene, making him an attractive candidate for the leftist party Peru Libre (López Lozano, Reference López Lozano2022).
Castillo’s candidacy did not seem viable until two weeks before the 2021 election. His success was partly possible due to the fragmentation of both the right (where the vote was divided between Fujimori, López Aliga, and De Soto) and the left (where the vote was divided between Lescano and Mendoza) (Asensio et al., Reference Asensio, Camacho, González, Grompone, Moscoso, Teves, Jiménez, Villagarcía and Vásquez2021). While timing and luck favoured Castillo’s candidacy, we cannot discount that he would not have been considered a viable candidate by Peru Libre (and by his leader, Vladimir Cerrón) without his participation in the rural patrols and the teachers’ unions (Hurtado Lozada, Reference Hurtado Lozada2023). In the run-off election, Castillo’s candidacy found support not only from fellow ronderos and unionists but also from a sector of the population that is normally marginalised in traditional political arenas, including people who identified as indigenous (Asensio et al., Reference Asensio, Camacho, González, Grompone, Moscoso, Teves, Jiménez, Villagarcía and Vásquez2021). As we saw in Figure 17, there were higher rates of participation in rural patrols in Cajamarca, higher rates of participation in workers’ associations or unions in Moquegua, and higher rates of participation in peasant communities in Huancavelica, Huanuco, and Apurimac; all areas where Castillo won over Keiko Fujimori in the runoff elections.
While Castillo was not a major union leader with significant political experience, his victory stemmed from more than just the perfect electoral storm of 2021 and sheer luck (Barrenechea et al., Reference Barrenechea, Encinas, Barrenechea and Encinas2022). His participation in rural patrols (rondas campesinas) and teachers’ unions proved crucial to his candidacy. Participation in these social arenas gave Castillo visibility and legitimacy in a way that traditional political pathways could not. In remote communities, the rondas campesinas mobilised support through decentralised committees, social media, and family networks (Hurtado Lozada, Reference Hurtado Lozada2023). This case illustrates how participation in social arenas can be inherently political and can significantly influence national politics.
5.6 Closing Remarks
The analysis of participation in Peru and our two narrative cases has shown the importance of examining participation outside traditional political arenas, particularly in social arenas such as rural patrols, workers’ unions, religious organisations, and parent associations. The political role of education-related spaces (such as parent associations) and religious spaces is particularly important to acknowledge, considering the surge of counter-reform movements across the region. The case of Peru shows how these spaces provide fertile ground for the articulation of initiatives that can stop or even reverse progressive gender politics, affecting both educational reforms and policy more broadly. While there is some literature on the role of these arenas as political spaces, more research is needed to fully understand their impact on the formation of citizens’ political views and initiatives.
6 Chile
Despite having historically strong political parties and institutions, Chile has experienced fundamental challenges to traditional participation channels in recent decades. The 2019 social uprising and the subsequent constitutional process show this shift: what began as student protests against metro fare increases evolved into widespread demonstrations that culminated in a constitutional referendum in which nearly 80% of voters chose to replace their dictatorship-era constitution. The resulting Constitutional Convention saw unprecedented participation from groups historically marginalised from formal political spaces: women, indigenous peoples, and grassroots activists whose political capacity had developed through feminist collectives, indigenous communities, and local organisations rather than formal party structures (Delucchi, Reference Delucchi2024). This trajectory from social spaces to national political influence revealed both citizens’ dissatisfaction with established political structures and their capacity to engage politically through diverse arenas.
The Chilean case is particularly important for understanding how citizens navigate participation when formal institutions remain functional, but their legitimacy is wavering. Unlike Guatemala’s institutional weakness or Peru’s party system collapse, Chile demonstrates how social arenas can function as political arenas even in contexts of relative institutional stability. The country’s recent oscillation between mandatory and voluntary voting systems further allows us to assess whether electoral participation genuinely reflects political engagement or merely compliance with legal requirements.
Our analysis examines three critical dimensions of Chilean political participation: the impact of changing electoral rules on voting patterns, the emergence of powerful social movements operating through educational spaces, and the role of indigenous community spaces and religious gatherings as arenas for political mobilisation. Together, these elements reveal how citizens construct multiple forms of political engagement across different arenas when traditional institutional channels fail to adequately represent their interests.
6.1 Electoral Participation
Chile’s recent transition back to mandatory voting provides an ideal case to analyse how electoral participation metrics can mask deeper patterns of political engagement and participation. The country’s electoral system has undergone two major legal transitions: Law 20,568 (2012) introduced automatic registration with voluntary voting, ending the previous system in which registration was voluntary but voting was mandatory for life, with fines of 0.5–3 UTM (approximately 40–240 USD). A decade later, Law 21,524 (2022) reinstated mandatory voting while maintaining automatic registration, taking effect for the 2022 constitutional plebiscite and 2024 municipal elections.
To assess these rule changes’ impact, we focus primarily on municipal elections, which provide the most consistent institutional comparison across all three periods, supplemented by evidence from the unique 2022 constitutional plebiscite.
The 2012 reform introduced automatic registration with voluntary voting, producing the dramatic decline in municipal election turnout shown in Figure 20. While the reform expanded voter registration by bringing approximately 968,000 new voters onto the electoral roll (17.3% of previously non-registered citizens), this was outweighed by existing voters’ withdrawal: about 1,633,000 previously registered voters ceased participating, resulting in a net decrease of roughly 665,000 voters (Brieba and Bunker, Reference Brieba and Bunker2019; Cox and Gonzalez, Reference Cox and Gonzalez2022). Turnout plummeted from around 86% in 2008 to approximately 43% in 2012, where it remained relatively stable through 2021.
Turnout rate of voters in municipal elections in Chile, 2012–2024.
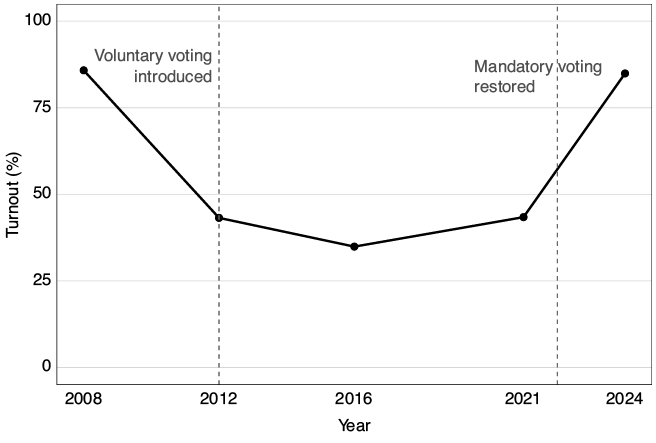
The return to mandatory voting in 2022 dramatically reversed this pattern. The 2024 municipal elections saw participation surge to 85% of eligible voters, nearly matching pre-2012 levels. This sharp response to institutional rule changes is consistent with the view that legal obligations play a substantial role in Chilean electoral participation patterns.Footnote 44
The regional analysis shown in Figure 21 reveals important geographical variations in electoral participation. Under voluntary voting in 2021, the country experienced relatively low participation in the municipal elections, with a mean turnout of 41.3%. The northern regions appear to have had particularly low turnout during this period. The 2024 municipal elections map, following Chile’s return to mandatory voting, shows a dramatic increase in participation, with mean turnout nearly doubling to 83.5%. This is evident in the dark blue shading across most of the country, particularly in the northern and central regions. The colour scale ranges from 36% (white) to 86% (black), highlighting the stark contrast between the two periods. The geographical distribution of turnout became more uniform under mandatory voting. However, some variation remains, particularly in the country’s southernmost regions, where turnout appears slightly lower than the national average in both periods.
Chilean voter turnout in municipal elections by region, 2021–2024
Note: 2021 mean turnout calculated on available data; some polling stations had missing vote records.
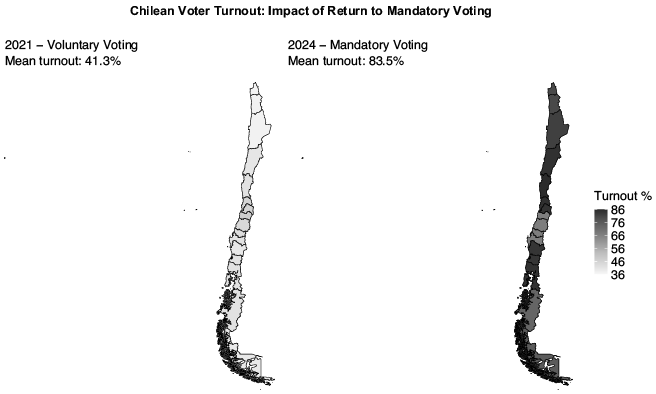
Previous research by Cox and Gonzalez (Reference Cox and Gonzalez2022) and Brieba and Bunker (Reference Brieba and Bunker2019) on the 2022 constitutional plebiscite indicates that areas with higher proportions of elderly residents showed somewhat lower participation rates, while communities with lower average incomes and rural areas demonstrated higher turnout. Their studies also found that areas with strong social networks tended to maintain higher participation rates even under voluntary voting regimes.
However, the return to mandatory voting raises questions about the relationship between institutional rules and authentic political engagement. While the system has succeeded in bringing millions of previously disengaged citizens to the polls, as evidenced by the 2024 municipal elections, it remains unclear whether this translates into meaningful political participation and engagement. This tension between formal participation rates and substantive political engagement is central to our analysis of how social arenas function as political arenas in Chile, which we explore in the following sections.
6.2 Indigenous Mobilisation
Indigenous organisations in Chile represent vital social arenas that function as political arenas, particularly for the Mapuche, who constitute approximately 10% of the Chilean population according to the 2017 Census. Despite being frequently excluded from comparative analyses of indigenous movements in Latin America, the Mapuche have developed significant parallel political structures that operate through community-based spaces. These arenas function not merely as stepping stones to formal political engagement but as spaces for direct political action. As Kowalczyk (Reference Kowalczyk2013, p. 127) notes, these community-based spaces emerged as indigenous organisations began to reject ‘the traditional left and political parties and demanded autonomy’, reflecting their dissatisfaction with conventional political structures.
The Mapuche have developed community governance structures that challenge dominant political frameworks. These community spaces serve many functions beyond simple social gathering, as they become sites where political identity is formed and collective action is coordinated. Following their incorporation into the Chilean state in 1881, the Mapuche were forced onto small reservations (reducciones) of poor-quality land, yet these spaces paradoxically allowed for the cultivation of cultural practices and ‘the consolidation of ethnic identity’ (Kowalczyk, Reference Kowalczyk2013, p. 125). The ceremonies and rituals performed in these communal spaces were informed by abuse, violence, and the subjugation of the Mapuche in the Chilean state and served to create an ‘ethnic subculture of resistance’ (Saavedra, Reference Saavedra2002, pp. 89 –94). Since Chile’s ‘pacification’ campaign in 1883, these arenas have been particularly active in contesting government policies. When formal institutions like CONADI (National Corporation for Indigenous Development) proved inadequate, Mapuche communities repurposed traditional gathering arenas to coordinate resistance against development projects that threatened their territories. As Haughney (Reference Haughney2006) notes, these community-based political arenas have allowed the Mapuche to assert what scholars call a ‘postliberal’ conception of communal rights focused on collective identity and territorial autonomy (Funk, Reference Funk2012).
These indigenous political spaces have gained significant traction as sites of collective mobilisation, particularly in response to environmental and territorial conflicts. Organisations like the ‘Coordinadora de Comunidades en Conflicto Arauco-Malleco’ (CAM) have transformed traditional gatherings into venues for coordinating resistance against logging companies and hydroelectric projects. Through these community-based structures, the Mapuche have achieved tangible outcomes, including ‘recovering some 17,000 hectares of land, most of which was in constant dispute with the lumber companies, and which are now collectively cultivated by Mapuche communities’ (Kowalczyk, Reference Kowalczyk2013, p. 131). However, this approach has come at a significant cost, as the Chilean state has criminalised these forms of political participation, applying Pinochet-era anti-terrorism laws to indigenous activists (Funk, Reference Funk2012; Planas, Reference Planas2009). Despite these challenges, indigenous community spaces continue to function as vital arenas of political engagement where the Mapuche can renovate their cultures and societies on their own terms by reinventing ancestral forms and devising new forms of politics (Kowalczyk, Reference Kowalczyk2013).
Figure 22 shows the variation in participation patterns across different organisation types by ethnic identity in Chile. Mapuche citizens show significantly higher participation rates in indigenous organisations than non-indigenous Chileans, as expected, and also maintain substantial engagement in community development, cultural activities, and religious organisations. Non-indigenous Chileans show dominant participation in community development, religious, and sports organisations, while participation in political parties remains remarkably low across all ethnic groups. Other indigenous peoples (including Aymara, Diaguita, and others) maintain modest but consistent participation across various organisational types. These patterns suggest that social arenas functioning as political arenas play particularly important roles for indigenous peoples, who appear to engage in civic life through multiple channels rather than concentrating solely on identity-based organisations.
Organisational participation by ethnic identity in Chile (2022).
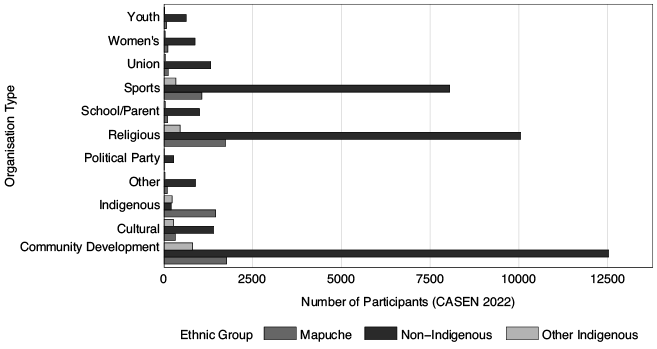
6.3 Student Movement
Chile possesses a long-standing tradition of student mobilisation that demonstrates how educational spaces can function as political arenas. Unlike other countries where parent associations drive education-related political mobilisation, Chilean educational institutions – particularly universities and secondary schools – have emerged as powerful sites for developing political consciousness, practising democratic deliberation, and generating nationwide political influence.
The student movement’s roots extend to the early twentieth century, but it gained particular significance during the 1960s and 1970s (Fleet and Guzmán-Concha, Reference Fleet and Guzmán-Concha2017). Following Chile’s return to democracy, two pivotal moments reinvigorated student mobilisation: the 2006 ‘Penguin Revolution’ led by secondary school students and the 2011 massive university student protests (Donoso et al., Reference Donoso and Rossi2023). These events transformed educational spaces into centres of political activism that not only influenced educational policy but also fundamentally challenged Chile’s neoliberal socio-economic model (Guzmán-Concha, Reference Guzmán-Concha2023).
The 2006 movement, named after students’ penguin-like black-and-white uniforms, demonstrated sophisticated organisation despite participants’ young age. As Donoso (Reference Donoso2013, p. 1) notes, ‘secondary school student groups merged to form a single organisation and adopted a horizontal and participatory decision-making mechanism’. What began as protests over economic concerns evolved into a broader critique of the education system’s structural inequalities. The movement effectively leveraged President Michelle Bachelet’s ‘government of citizens’ rhetoric to open political opportunities, ultimately forcing the creation of a Presidential Advisory Commission on the Quality of Education and contributing to the 2009 General Law of Education (Somma, Reference Somma, Joignant and Somma2024).
The movement’s evolution continued with the 2011 university student protests, which consolidated students as a major political force. Through consistent mobilisation, student organisations placed education at the centre of national political debate, critiquing the market-based mechanisms governing not only education but also healthcare, pensions, and other public services. As noted in recent scholarship, ‘the student movement was perhaps the main challenger to the societal model inherited from Pinochet’s dictatorship and managed – albeit with some significant changes – by successive democratic governments’ (Joignant and Somma, Reference Joignant and Somma2024, p. 96). These educational spaces serve not just as venues for protesting specific policies, but as political arenas where democratic practices are cultivated and political identities formed. Student assemblies function as training grounds for deliberative democracy, whilst educational institutions provide physical spaces for developing collective political consciousness. Research by Santibáñez-Rodríguez (Reference Santibáñez-Rodríguez2022) shows that participation in the student movement led to profound political socialisation, equipping participants with resources, common understandings, and ways of relating politically that extended far beyond their student years.
The movement’s impact also goes beyond education policy. Disi Pavlic (Reference Disi Pavlic2021) found that proximity to student protests significantly influenced various political attitudes among the general public. The study concluded that proximity to protests boosts political interest and external efficacy. However, it also noted that exposure to protests could ‘simultaneously politically engage and alienate public opinion’ by diminishing respect for political institutions (p. 88). This research highlights how student mobilisation functions as a political arena that shapes broader societal attitudes, not merely as a pathway to formal political participation.
The student movement has also addressed intersectional concerns. Webb and Radcliffe (Reference Webb and Radcliffe2013) document how indigenous Mapuche students have challenged the education system’s mono-cultural and mono-linguistic approach, advocating for Intercultural Bilingual Education that recognises cultural diversity. These demands highlight how educational spaces can become sites where marginalised groups contest hegemonic national identities.
The student movement was a protagonist in the 2019 ‘estallido social’ (social uprising), where many demands initially championed by students became central to nationwide protests. While the ‘estallido’ incorporated diverse concerns beyond education, it built upon the politicisation fostered within student spaces. The uprising’s motto – ‘It’s not 30 pesos, it’s 30 years’ – reflected how student critiques of neoliberal policies had expanded into broader societal discontent with the post-dictatorship socio-economic model (Gordon-Zolov, Reference Gordon-Zolov2023). As Guzmán-Concha (Reference Guzmán-Concha2023) explains, ‘students opened up a cycle of heightened social conflict that persisted in the following years’, creating space for movements focused on women’s rights, indigenous rights, environmental concerns, and pension reform.
Perhaps the most tangible evidence of student spaces functioning as political arenas is the trajectory of student leaders into formal politics. Former Chilean President Gabriel Boric was leading student demonstrations just over a decade before taking office, and a significant portion of his government came from the student organisations of around that time (Joignant and Somma, Reference Somma, Joignant and Somma2024). This transition from student activism to electoral politics demonstrates how these spaces cultivate skills and networks that enable effective political participation across various arenas.
However, research has also shown that participation in Chilean student organisations has not consistently translated into electoral participation. Medel, Somma, and Donoso’s (Reference Donoso and Rossi2023) research shows that participants in student demonstrations were significantly less likely to vote than those in labour movement protests, even after controlling for demographic factors. While organised labour activists showed an 85% probability of voting compared to 68% for non-organised participants, student movement membership had virtually no effect on electoral participation – organised student activists voted at nearly identical rates (42%) to non-organised student protesters (45%). This pattern persists even after controlling for age, education, and political ideology, suggesting that the relationship stems from the student movement’s ideological and material autonomy from political parties. Unlike labour organisations, which maintained resource dependencies and institutional linkages with political parties, student organisations developed self-sustaining structures that enabled political mobilisation without necessitating electoral engagement. The study shows that protest participation and voting do not correlate positively at the individual level in Chile, and it supports our argument that social organisations can serve as independent political arenas.
The student movement’s experience reveals how social arenas, in this case, educational spaces, can evolve into powerful sites of political engagement when formal channels are unresponsive to citizen demands. Unlike parent-led educational activism common in many countries, Chile’s student-led movement has successfully transformed schools and universities into enduring political arenas that shape national discourse and policy. The ‘movimiento estudiantil’ chileno could socialise forms of manifesting and processing political discontent that extended well beyond formal protest activities (Santibáñez-Rodríguez, Reference Santibáñez-Rodríguez2022). This suggests the need to broaden our understanding of political participation to include spaces where citizens develop and exercise political agency outside traditional institutional frameworks.
6.4 Religious Mobilisation
Religious arenas represent significant venues for engagement in Chile. Using data from the ‘Centro de Estudios Politicos’ survey, Table 9 reveals notable shifts in religious affiliation between 2018 and 2024. In 2018, Catholics dominated the religious landscape, with 55.3% of the population, while 16.4% reported no religious affiliation. By 2024, however, there has been a substantial decline in Catholic identification, dropping to 45.3%, concurrent with a marked increase in those identifying as having no religion, which rose to 29.7%.
The data also highlights the relative stability of other religious groups. Evangelical Christians remained relatively consistent, decreasing slightly from 16.0% in 2018 to 15.2% in 2024. Smaller religious communities such as Jehovah’s Witnesses (1.0%), Jewish communities (0.2%), and Mormons (1.0%) maintained relatively stable proportions.
The most significant demographic shift is the substantial increase in the number of people without religious affiliation. The combined percentage of ‘None’ (29.7%), Atheists (1.5%), and Agnostics (2.9%) suggests a growing trend of secular identification, adding to 34.1% in 2024, compared to 21.0% in 2018.
| Category | Religion | 2018 | 2024 |
|---|---|---|---|
| 1 | Catholic | 55.3 | 45.3 |
| 2 | Evangelical | 16 | 15.2 |
| 3 | Jehovah’s Witness | 1 | 1 |
| 4 | Jewish | 0.2 | 0.2 |
| 5 | Mormon | 1.3 | 1 |
| 7 | Orthodox | 0 | 0.3 |
| 8 | Other religion or creed | 2.6 | 1.7 |
| 9 | None | 16.4 | 29.7 |
| 10 | Atheist | 2.6 | 1.5 |
| 11 | Agnostic | 2 | 2.9 |
| 88 | Don’t know | 0.4 | NA |
| 99 | No answer | 2 | 1.4 |
According to the CEP 2018, which focused on religious identification, only 29% of religiously active Chileans express interest in conventional politics. In contrast, 71% report being politically uninterested yet remain engaged in religious organisations. According to traditional understandings of political participation, these individuals would be classified as civically disengaged despite their active engagement in religious spaces. Instead, we suggest that religious arenas serve as significant venues for civic participation, operating in parallel to formal political institutions in ways that traditional measures of engagement may not capture.
As demonstrated during Chile’s constitutional processes, these religious spaces function as political arenas in their own right, where collective political positions are developed and political mobilisation is coordinated, regardless of whether participants identify as ‘interested in politics’. The slightly higher political interest among non-religiously active citizens (33.4% compared to 29.0% among the religiously active) further suggests that religious organisations may function as parallel arenas for political engagement. This pattern aligns with our broader argument that in contexts where traditional political institutions are perceived as inaccessible or unresponsive, citizens, particularly those from traditionally marginalised groups, create and sustain political engagement through social arenas.
Recent research on evangelical communities in Chile provides context for understanding how religious arenas function as political arenas. Castillo and Medel (Reference Castillo and Medel2024) have identified that evangelical support for certain political positions, particularly the populist radical right, stems from religious beliefs, community solidarity, and political disillusionment rather than strong partisan attachments. Rural evangelical communities are characterised by strong internal cohesion and limited external connections, creating ‘bonding social capital’, reinforcing shared values and political perspectives.
In Chile’s recent constitutional processes, evangelical communities emerged as significant political actors. Church leaders played a crucial role in guiding political preferences, with churches and families serving as key socialisation arenas that transmit and reinforce conservative political attitudes (Castillo and Medel, Reference Castillo and Medel2024). In response, progressive evangelicals also mobilised, differentiating themselves from conservative evangelicals who had organised primarily in opposition to ‘gender ideology’ and sexuality politics reforms (Castillo et al., Reference Castillo, Contreras-Guzmán and Henzi2023). This intra-denominational competition for evangelical identity shows how religious arenas can serve as sites of political contestation and identity formation. Progressive evangelicals explicitly challenged the association between evangelicalism and right-wing politics, demonstrating that religious arenas are not monolithic but spaces where diverse political perspectives can emerge even within shared religious frameworks.
6.5 Comparative Analysis of Participation Across Different Arenas
Our analysis of participation in Chile reveals distinct patterns across indigenous spaces, educational institutions, and religious gatherings. Rather than merely serving as pathways to formal political engagement, these social arenas are political arenas with their own demographic patterns and social dynamics. By examining participation across these different spaces comparatively, we can better understand how they function within Chile’s broader political landscape and how they relate to traditional electoral participation.
Figure 23 shows the participation rate in social arenas across Chile’s regions between 2017 and 2022. Regarding religious participation, we see the most notable change in the central regions around Santiago, showing a marked decrease of around 2% to 3% (indicated by the darker blue shading). This decline in religious participation aligns with broader secularisation trends observed in urban areas during this period, particularly in regions with higher levels of education and economic development. For indigenous organisation participation, the changes appear minimal across most regions (as shown by the predominantly white/light shading), with the data suggesting virtually no change in participation rates (mean change of 0.0%). This stability is remarkable given the Constitutional Convention process during this period, which included dedicated indigenous representation and might have been expected to increase indigenous organisational activity.
Changes in social space participation by region (2017–2022)
Note: Survey-weighted change in participation rates (percentage points) by region.
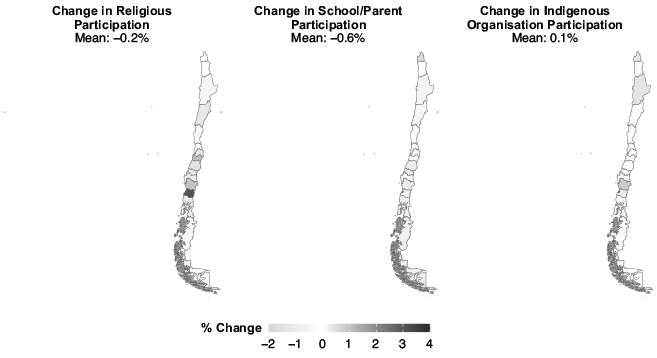
Regarding school/parent participation, there is a general slight decline across most regions (indicated by the light pink shading), with the national mean showing a −0.7% change. This modest decrease might reflect the impact of the COVID-19 pandemic on in-person school activities, though the relatively small magnitude suggests resilience in maintaining participation through these spaces. The spatial distribution of these participation patterns reveals important regional variations that align with Chile’s socio-economic geography. The metropolitan region around Santiago shows distinctly different patterns from both the northern mining regions and the southern agricultural and indigenous areas, suggesting that local context significantly influences how citizens engage across different participation arenas.
When we examine the relationship between religious participation and conventional political interest, Figure 24 reveals an important pattern. A substantial 15.3% of the population engages actively in both religious organisations and expresses political interest, suggesting complementarity between these forms of engagement for a significant minority. More notably, about 10% of Chileans participate actively in religious organisations while reporting no interest in formal politics. This represents an important demographic whose civic engagement manifests exclusively through religious arenas, challenging conventional measures of political participation that would classify these citizens as disengaged. Meanwhile, approximately 30% express political interest without participating in religious spaces, highlighting distinct pathways to civic engagement in Chilean society.
Patterns of religious organisation participation and political interest in Chile (2018)
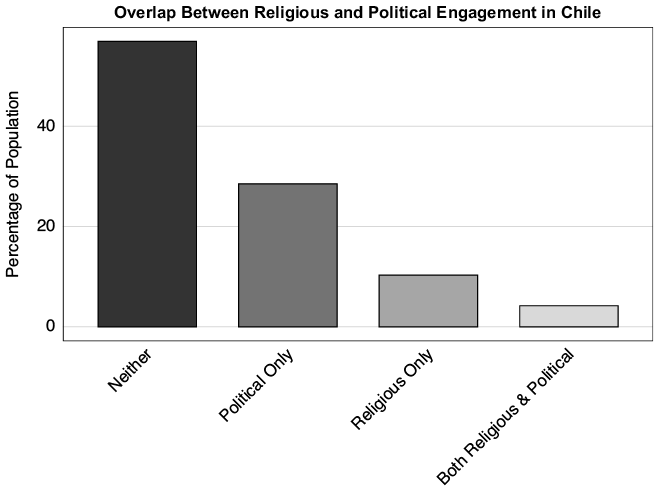
Women constitute a disproportionate share of active religious participants (63.2% versus 36.8% for men), suggesting that religious arenas serve as important venues for women’s civic engagement in contexts where traditional political institutions remain male dominated. This gender imbalance contrasts with the student movement, where leadership has been more evenly distributed between men and women, though recent years have seen prominent female student leaders rise to national prominence.
A central question for us is whether these social arenas function primarily as pathways to electoral participation or as autonomous spaces of political engagement. Figure 25 presents our analysis of the relationship between regional participation rates in social arenas and changes in voter turnout following Chile’s return to mandatory voting. We calculated regional participation rates using the 2022 CASEN survey. We then joined these participation estimates with electoral turnout data from SERVEL for the 2021 (voluntary voting) and 2024 (mandatory voting) municipal elections.
Social participation and voter turnout in Chilean Municipal Elections, 2021–2024
Note: Shaded areas represent 95% confidence intervals.
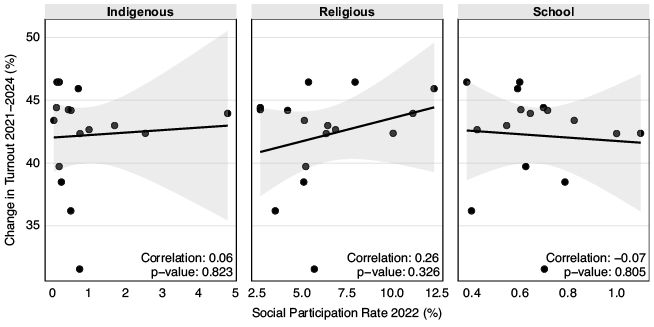
The three types of social spaces we examine – indigenous community spaces, educational institutions, and religious gatherings – differ in their relationship with formal political institutions. Student movements have regularly interfaced with government institutions, albeit often in confrontational ways, whilst indigenous organisations have experienced both engagement and criminalisation by the state. Religious organisations, particularly evangelical churches, have maintained complex relationships with formal politics, sometimes endorsing candidates whilst maintaining institutional distance from political parties. These variations in institutional relationships highlight how different social arenas develop distinct strategies for exercising political influence depending on their specific historical contexts and organisational strengths.
Our analysis reveals no significant correlations between participation rates in these social arenas and changes in voter turnout following the implementation of mandatory voting. These findings support our broader argument that these social arenas can function as autonomous political arenas. If these spaces primarily served as pathways to conventional political participation, we would expect regions with higher participation in these social arenas to respond differently to the implementation of mandatory voting. The absence of such relationships suggests that citizens engage in these arenas for their intrinsic political value, not simply as preparation for electoral participation.
6.6 Individual Characteristics of Participants
To identify the individual characteristics associated with participation in each social arena, we relied on data from the 2022 CASEN. We employed survey-weighted logistic regression models for religious meetings, school and parent associations, and indigenous organisations, controlling for regional effects.
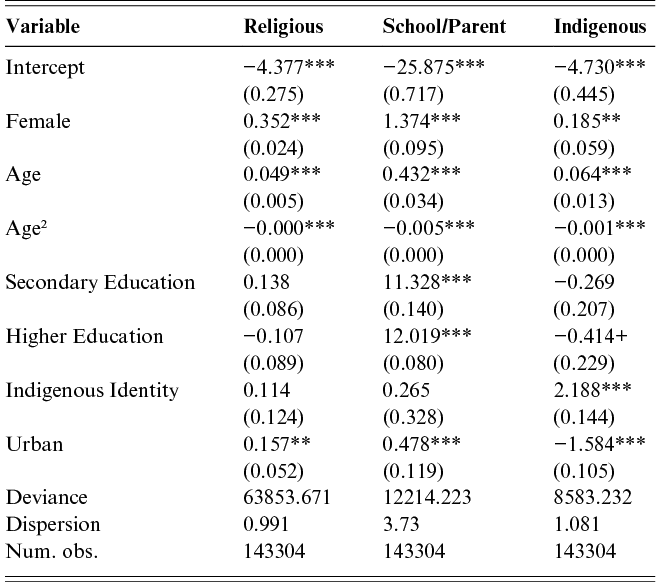
Table 10 Long description
Table showing the results of survey-weighted regression models for participation (religious meetings, school/parent associations, and indigenous organisations) in different arenas by demographic characteristics (gender, age, education, indigenous identity, and urban/rural) in Chile using CASEN 2022 data. The results show that being women and being older correlates to higher participation in all three arenas. That a higher level of education correlates with a higher level of participation in school/parent associations, that indigenous identification correlates with higher participation in indigenous organizations, and that being for an urban area correlates with higher participation in religious meetings and school/parent associations but lower participation in indigenous organisations.
Notes: Survey-weighted logistic regression models using CASEN 2022 data. Regional fixed effects included but not shown. ***p < 0.001; **p < 0.01; *p < 0.05; +p < 0.1. Coefficients are log-odds. Reference categories: Male, Primary education or less, Non-indigenous, Rural.
Table 10 reveals several key patterns. First, we observe significant non-linear age effects across all three participation arenas, with participation increasing until reaching a peak (around sixty-one years for religious participation, forty-three years for school/parent associations, and thirty-two years for indigenous organisations) before declining. Second, women are significantly more likely to participate in all three arenas, with the gender gap most pronounced in school/parent associations. Third, education shows distinct patterns across participation types, strongly predicting school/parent participation but showing minimal or negative associations with religious and indigenous participation. Finally, indigenous identity powerfully predicts participation in indigenous organisations, while urban residence correlates positively with religious and school/parent participation but negatively with participation in indigenous organisations. This follows the patterns identified in our other cases and in the regional analysis, with social arenas serving as important political spaces for under-represented groups.
6.7 Closing Remarks
The Chilean case reveals how social arenas can function as political arenas where institutions face legitimacy challenges even when they remain relatively stable. The dramatic shifts in turnout following voting law changes demonstrate how formal metrics can mask deeper engagement patterns across different arenas. These social spaces provide venues for women and indigenous communities who face barriers in conventional politics and, at times, reshape formal institutions, as evidenced by student leaders transitioning into national political roles. Chile’s experience demonstrates that understanding contemporary political participation requires examining the diverse arenas where citizens engage when traditional channels inadequately represent their interests.
7 Conclusions
Our analysis of political participation in Latin America innovates by explicitly acknowledging that social arenas can function as political arenas, particularly in contexts where institutional channels are weak, inaccessible, or unresponsive to citizens’ needs. We show that social spaces are not merely stepping stones towards ‘proper’ political engagement but constitute arenas where citizens, especially from marginalised groups, articulate demands, exercise influence, and pursue collective objectives.
Our regional analysis showed that participation in social arenas followed different trends and correlates than participation in traditional political arenas (elections and political party/group spaces), highlighting the need to study participation more broadly. Our case studies provide further evidence of the political relevance of social arenas functioning as political arenas. In Guatemala, indigenous governance systems transformed into mechanisms for coordinating nationwide strikes to defend electoral outcomes. In Peru, parent associations and religious groups served as venues for educational counter-reforms, and local social arenas were key sites for the election of Pedro Castillo. In Chile, student organisations served as spaces where actors developed political capabilities that reshaped national politics. Our narrative case studies thus demonstrate that, even in a period marked by downward trends in religious affiliation and union membership, participation in social arenas associated with these groups remains highly politically consequential.
Furthermore, our regional and case analyses show that social arenas functioning as political arenas are particularly significant for marginalised groups. Whilst participation in traditional political arenas correlates with education, wealth, and urban residence, participation in social arenas shows more inclusive patterns, with women participating at higher rates in religious organisations and parent associations and indigenous peoples maintaining a strong presence in community organisations.
Thus, our findings show that social arenas sometimes function as alternatives rather than complements to traditional political arenas, providing important spaces for citizens excluded from formal institutions to exercise their political agency. Guatemala’s 2023 electoral defence, Peru’s counter-educational reform movement, and Chile’s student movement all show how mobilisation that gestates in social arenas can reshape formal politics.
However, our findings also reveal what we term an ‘inclusion paradox’: many social arenas incorporate groups that face barriers in traditional political spaces. Yet, because this inclusion stems partly from exclusion, participation in some of these social arenas correlates with lower support for democracy, particularly when measured through more concrete indicators, such as support for coups during times of crisis. As shown in our regional analysis, while participation in the electoral arena is positively correlated with support for democracy across all measures, participation in other political and social arenas is often only weakly positively correlated with support. Moreover, participation in social arenas can sometimes correlate with support for undemocratic measures.
Although we hope this Element contributes to the understanding of political participation, we must also recognise its limitations. First, our reliance on survey data means we capture self-reported participation rather than observed engagement in these spaces. This is particularly relevant for arenas where social desirability bias may lead to over-reporting (e.g., religious organisations’ meetings or parent associations). Future research should complement this with registry data or ethnographic approaches. Second, whilst we’ve established the relevance of social arenas functioning as political arenas, more detailed process-tracing would help identify precise circumstances under which social spaces become sites of political agency formation. Finally, although we focused on religious groups, educational spaces, and local/indigenous organisations, future research should also examine other potential arenas, such as neighbourhood organisations or digital spaces.
Our case analysis also revealed disparities in data accessibility across countries. Even in countries with relatively accessible data, such as Peru, formats are often not research friendly, which can discourage their use. While collecting new data is valuable, researchers should also invest time in utilising existing data, despite challenges with access and usability.
We hope this Element inspires further research on political participation through social arenas across Latin America and other contexts where the exclusionary nature of traditional political arenas leads to highly consequential political participation in social arenas.
The authors declare the use of AI software (Grammarly and Calude Sonnet 4.5) for proofreading and light editing of the manuscript.
Raymond Duch
University of Oxford
Raymond Duch is the co-founder and Director of the Centre for Experimental Social Sciences (CESS) at Nuffield College University of Oxford. He established and directed similar CESS centers in Chile, China, and India. He is also co-Director of the Candour Project that assembles a global team of research scholars with expertise in behavioral economics and data analytics addressing challenging health policy issues.
Anja Neundorf
University of Glasgow
Anja Neundorf is a Professor of Politics and Research Methods at the School of Social and Political Sciences at the University of Glasgow, UK. Before joining Glasgow, she held positions at the University of Nottingham (2013–2019) and Nuffield College, University of Oxford (2010–2012). She received her PhD from the University of Essex.
Randy Stevenson
Rice University
Randolph Stevenson is the Radoslav Tsanoff Professor of Public Affairs at Rice University in Houston, Texas. Professor Stevenson works and teaches in the areas of survey design, applied statistical methods, comparative mass political behavior, comparative political psychology, and experimental design.
About the Series
This Elements series is aimed at students and researchers interested in understanding how and why the political behaviour, perceptions, attitudes, emotional responses, interest, knowledge, and identities of citizens are conditioned on the political, social, and economic contexts in which they experience the political world.