


This article provides an updated overview and analysis of internal security spending by the People’s Republic of China (PRC) from 1992 to 2022, building on work covering 1992–2012 that was previously published in The China Quarterly.Footnote 1 A new dataset, now publicly available online, covers the past three decades, including the first two terms of Xi Jinping’s 习近平 tenure.Footnote 2
Broadly speaking, the updated data on China’s internal security spending reveal a mix of continuity and change. China’s domestic security expenditure continues to increase rapidly, more than doubling from 2012 to 2022, but has risen mostly in proportion to the rest of the PRC’s budget. The balance between central and local expenditure has shifted slightly more towards decentralized funding of domestic security, providing context for recent high-level expressions of concern about the revenue-generating activities of local public security bureaus (PSBs) in an era of increased local fiscal constraint. Within the internal security apparatus, the Ministry of Public Security (gong’anbu 公安部, MPS hereafter) continues to receive the lion’s share of domestic security spending, and that share has risen since 2012. By contrast, the proportion of internal security spending allocated to the People’s Armed Police (wujing 武警, PAP hereafter) has decreased (likely reflecting a reorganization in 2017–2018), although the PAP’s budget has continued to rise. Internal security spending, both per capita and relative to GDP, tends to be higher in locations that are politically sensitive, including Beijing, Tibet and Xinjiang.
Overall Trends in China’s Internal Security Spending
China’s domestic security budget has been a frequent point of reference in both media and academic discourse since internal security expenditure first surpassed spending on national defence in 2011.Footnote 3 Internal security spending generally refers to expenditure on China’s political-legal system (zhengfa xitong 政法系统), which is composed of public security, the procuratorate, courts, and justice (gongjianfasi 公检法司), as well as the PAP. It appears under the grouped heading of gonggong anquan zhichu 公共安全支出 in publications by the PRC Ministry of Finance. Understanding the PRC’s domestic security spending is important for debates over the extent and nature of securitization under Xi Jinping, as well as discussions of China’s overall coercive capacity and authoritarian stability.Footnote 4
Such understanding is also important for ongoing discussion on how to interpret and measure China’s military spending, as debates over defence spending hinge, in part, on which line-items and categories of spending should be considered part of China’s military budget versus the internal security budget (for example, the gendarmerie-like PAP, discussed below), and on how to treat off-budget adjustments to official statistics. External analysts generally agree that China’s defence spending is substantially larger than official figures indicate when appropriate off-budget expenses are included, but estimates of how much larger vary widely.Footnote 5
Figure 1 shows China’s official internal security spending from 1992 to 2022, placed alongside official defence spending for comparative purposes. It reveals a continued rise in overall internal security expenditure throughout the past decade, continuing the previous two decades of spending growth. In absolute/nominal terms, the domestic security budget more than doubled from 2012 to 2022, rising from 711.2 billion yuan to 1.44 trillion yuan in 2022.Footnote 6 Using average market exchange rates for those years, that translates to roughly US\$112.7 billion to ∼US\$214 billion.Footnote 7 However, internal security expenditure also shows a plateau from 2018 to 2021, which we explain at least partly with reference to a reorganization that moved parts of the PAP and MPS into a new Ministry of Emergency Management (yingji guanli bu 应急管理部, MEM hereafter), which is not included in the Ministry of Finance’s internal security expenditure category.
China’s Defence and Internal Security Expenditures, 1992–2022

Similar to defence spending, important categories of internal security expenditure do not appear in official totals. And, as with defence spending, the excluded categories could add considerably to estimates of the total expenditure if published and counted. Extrabudgetary expenditures for internal security include: the Ministry of State Security (guojia anquanbu 国家安全部, MSS hereafter), which has both internal and external responsibilities; the Party political-legal commissions that lead and manage public security work at various levels of China’s political system; and MEM, which as a new ministry created in 2018 absorbed some previous PAP and MPS units and has some responsibility for planning and maintaining social stability under emergency conditions.Footnote 8 MEM, for example, would have added 68.5 billion yuan to internal security expenditure in 2022, an amount 1.4 times larger than the Ministry of Justice (48.3 billion yuan) and slightly smaller than the procuratorate (72.7 billion yuan). The MSS budget under Xi remains unknown, in a period when that ministry has taken on a much more visible role, adding an unknown amount to the total.
Figure 2 shows the share of overall government expenditure devoted to internal security from 1992 to 2022. Although internal security spending has increased as a proportion of overall expenditure since 1992, its share of the budget is not significantly higher under Xi Jinping (2012–2022) than in the previous period (1992–2012). Internal security expenditure remains between 5 per cent and 7 per cent of the overall spending. In 2012, the percentage of national expenditure allocated to domestic security was 5.6 per cent; in 2022, that percentage was 5.5 per cent.
Internal Security Expenditure as a Proportion of Overall Expenditure

How to interpret internal security as a share of overall spending is, of course, open to interpretation. One possible interpretation is that China has been able to pursue its approach to internal security without a clear budgetary trade-off: growth in domestic security spending, as a line item, has not necessarily come at the expense of other budget categories. This, however, fails to account for “securitization” if other actors in the Chinese political system have been required to take security measures that are accounted for in their budgets, rather than appearing solely in the internal security expenditure category.
There is some indication of securitization dynamics. For example, MEM does not fall under the domestic security budget, but an updated 2025 requirement for local authorities to generate “emergency response plans” now requires non-security actors (such as education systems) to plan for how they will address “social security emergencies,” including mass incidents, meaning that emergency management has a strong domestic stability component.Footnote 9 Moreover, for the last several years, the PRC has earmarked (by issuing a special long-term treasury bond) an additional 700–800 billion yuan for “implementation of major national strategies and security capacity-building in key areas” that is not included in the regular annual domestic security budget; according to the Ministry of Finance’s March 2025 report, the last round of this funding appears to have been spent largely on infrastructure (railways, highways, airports, etc.) and how much of it should be considered internal security spending is subject to interpretation.Footnote 10
One major difference between China’s defence spending and its internal security spending is that the latter is primarily the responsibility of provincial and local governments, rather than the centre.Footnote 11 Previous work has shown that the burden for spending on domestic security and stability has shifted over time towards localities; Figure 3 shows that this trend has continued. Provincial and local governments are now responsible for slightly more of the PRC’s domestic security expenditure than they were a decade ago, from below 80 per cent in the pre-2000 period to 83 per cent in 2012, to 86 per cent of internal security spending in 2022.
Local Spending as a Proportion of Total Internal Security Spending

This rising fiscal burden occurs in the context of declining local fiscal revenues and an overall budget deficit. The combination of these trends may explain (and exacerbate) apparent recent concern at senior levels of the party-state leadership that budget pressures could be pushing local PSBs to use coercive or predatory tactics to offset revenue shortfalls by imposing false or inflated fines and confiscating property illicitly.Footnote 12 In spring 2025, the Supreme People’s Procuratorate launched a campaign of targeted supervision to eradicate “illegal cross-jurisdictional and profit-seeking law enforcement” (weigui yidi zhifa he qulixing zhifa 违规异地执法和趋利性执法),Footnote 13 a phenomenon sometimes known as “distant/deep sea fishing” (yang bulao 洋捕捞).Footnote 14 The focus in Figure 3 on the domestic security expenditure burden that falls on local governments, therefore, provides a note of caution in assuming, as one might looking at Figure 2, that the party-state has faced no “guns-butter” trade-off when it comes to internal security spending. In China, this may take the form of a trade-off between stability maintenance and routine criminal policing, as the MPS and local PSBs are required to do both. Analyses in both Chinese and English have highlighted resource shortfalls.Footnote 15
Spending Breakdown: Categories
Previous scholarship has noted the utility of understanding “not only the total amount that China spends, but also how it spends these resources.”Footnote 16 Figures 4–5, therefore, show how domestic security expenditure has been allocated to different actors within China’s internal security apparatus.
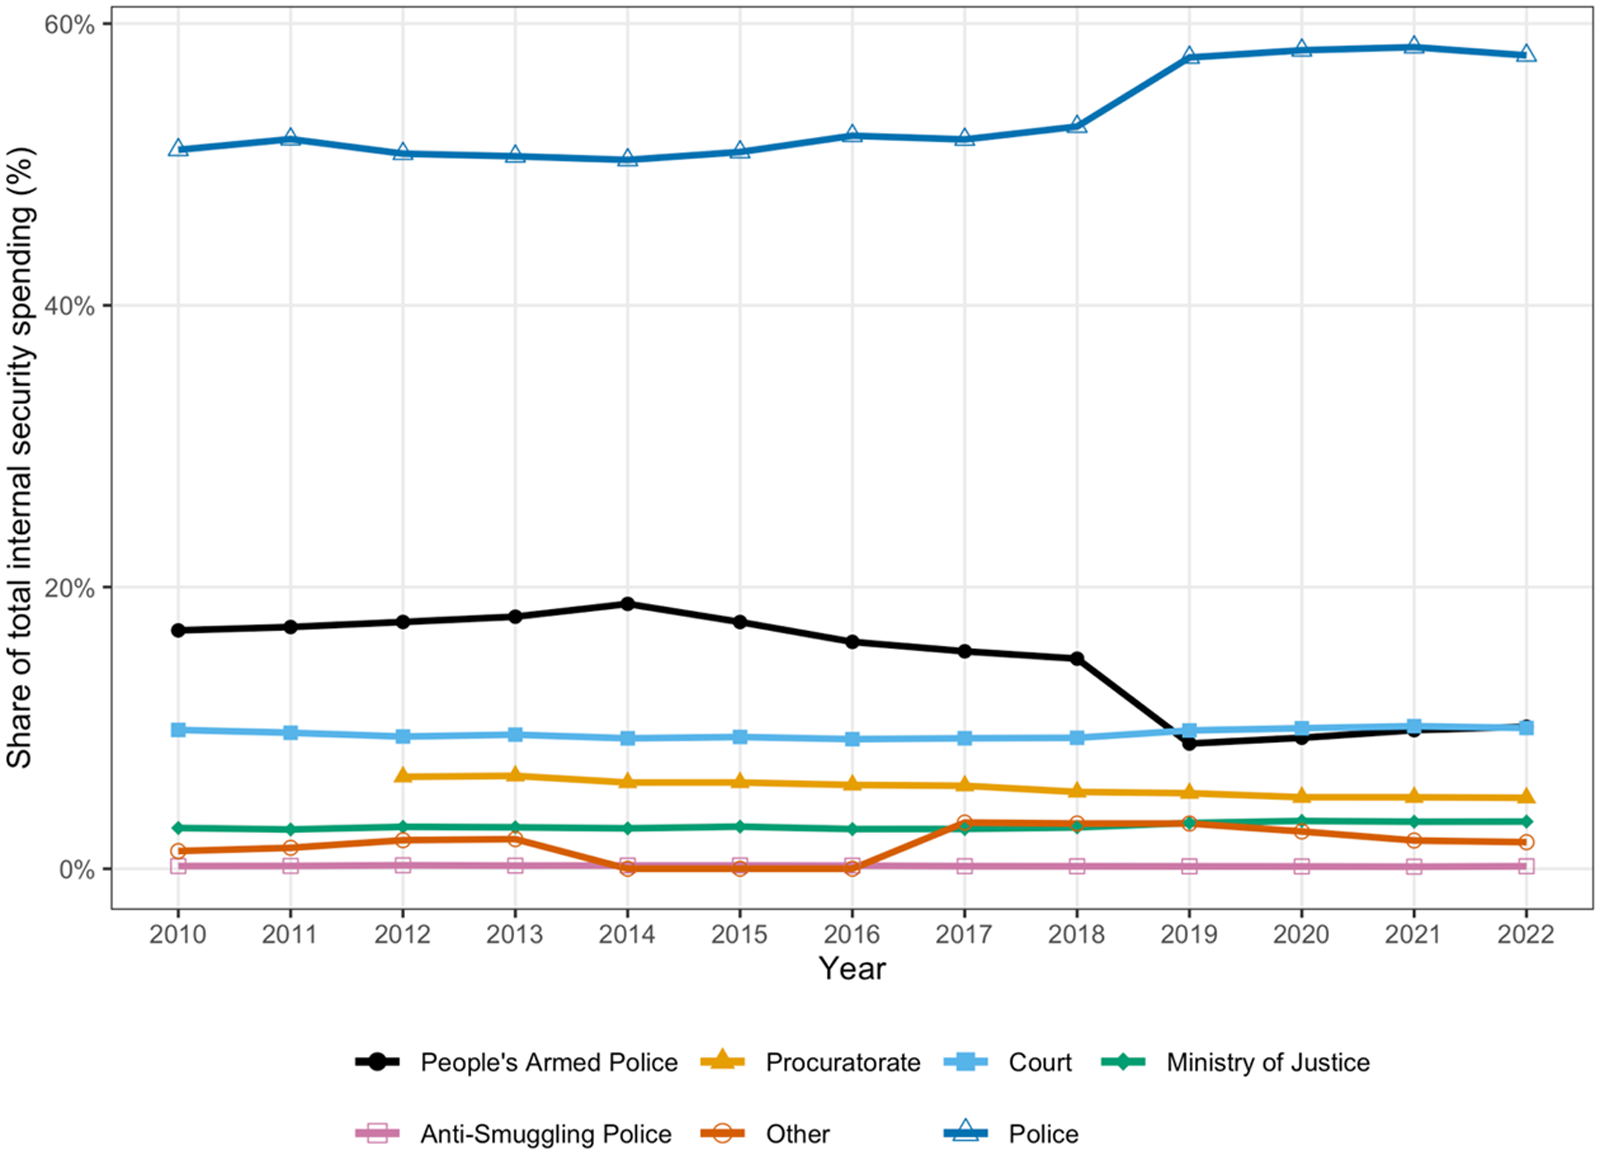
Categorical Breakdown of China’s Internal Security Spending

Categorical Breakdown of Internal Security Spending (excluding the MPS)

Figure 4 shows that the MPS continues to receive a much larger share of domestic security spending than any other actor. This share has increased over time, rising from 50 per cent in 2012 to 57 per cent in 2022. In nominal terms, this increase represents something between a doubling and tripling of the MPS budget over the course of a decade: from 361 billion yuan in 2012 to 832.7 billion yuan in 2022.
Figure 5 removes the MPS so that budget allocations across other actors can be seen more clearly. The remainder of the domestic security budget goes to actors across the political-legal system, including the procuratorate (jiancha 检察), courts (fayuan 法院), Ministry of Justice (sifa 司法), customs anti-smuggling police (jisi jingcha duiwu 缉私警察队伍), and other unspecified expenditures, as well as a continued category of funding for the PAP.Footnote 17
The biggest change apparent in the 2012–2022 data is what looks like a sizeable drop in the share of domestic security spending allocated to the PAP, from 17.5 per cent of the internal security budget in 2012 to ∼10 per cent in 2022. Nominal PAP spending dropped in absolute terms, from 205.6 billion yuan in 2018 to 123.6 billion yuan in 2019, rising again to 145.5 billion yuan in 2022.Footnote 18
It seems unlikely that the PRC cut spending on functions carried out by the PAP by roughly 40 per cent in a single year, especially given the relative continuity observed across other aspects of the internal security budget. In fact, the same table that shows the PAP budget dropping from 2018 to 2019 also states that PAP spending in 2019 was 118.7 per cent of its 2018 level – clearly at odds with the reported absolute drop and suggesting that an unexplained change in categorization/classification or measurement may be affecting the statistics provided.Footnote 19 Moreover, the continued appearance of the PAP in the domestic security budget, rather than the defence budget, suggests that China’s leaders continue to view it as having an internal security role.Footnote 20
We assess that what appears as a drop in PAP spending likely reflects the reorganization in 2017–2018 that moved the PAP into the national defence system, placing it solely under the Central Military Commission (CMC), rather than in a dual-authority arrangement with the State Council. Two aspects of that reorganization moved specific units out of the PAP. First, the Guards and Border Defence Forces were transferred to the MPS. In Figure 4, the MPS displays a non-linear increase in its share of domestic security spending in 2018–2019 that offsets the drop in PAP expenditure share, suggesting that funding for these forces may have transferred from the PAP subcategory of expenditure to the MPS one. Second, the PAP’s Forestry and Firefighting Forces were merged (along with some non-PAP entities) into the new Ministry of Emergency Management, and thereby removed from domestic security spending totals altogether. If included, China’s new emergency management expenditures in 2019 would offset about half the drop in PAP spending from 2018 to 2019.Footnote 21
Spending Breakdown: Geography
Given how heavily China’s internal security apparatus relies on subnational funding, it is also important to look at how such spending is borne at the provincial level. Figures 6–7 show domestic security expenditure by province, first per capita and then relative to GDP.
Domestic Security Spending per Capita over Time by Province

Domestic Security Spending over Time by Province Relative to GDP

Figure 6 suggests that every province in China has spent more per capita on internal security since 1992. However, per capita spending has been particularly prone to increase in locations that are politically sensitive. This includes Beijing, as China’s capital, which is consistent with a concept of “political security” that prioritizes protecting China’s socialist system, the Party leadership and Xi Jinping as the core of that leadership. It also includes the Tibetan Autonomous Region (TAR) and Xinjiang Uyghur Autonomous Region (XUAR), where security crackdowns by the authorities during this time period appear to have required higher levels of spending both per capita and relative to regional GDP than China’s other provincial-level units. This finding is consistent with other research showing that these particular municipalities and regions are also allocated more internal security (PAP) manpower.Footnote 22
Table 1 shows that provincial-level units that are plausibly more politically sensitive with respect to internal security (Beijing, Tibet and Xinjiang) spent more on internal security per capita than other provinces in 2012, and that the gap in per capita security spending between these provincial-level units and others has widened between 2012 and 2022.
Per Capita Internal Security Spending in Politically Sensitive Provinces

Notes: Values reflect mean internal security expenditure (yuan/person, nominal).
In 2012, China spent 2.8 times as much per person on domestic security in the three most politically sensitive provinces (Beijing, Tibet and Xinjiang) as it did on average in the rest of the country. By 2022, it spent over three times as much, creating a spending gap of ∼1,840 yuan/person each year between these provinces and the rest.
Figure 7 shows domestic security spending by province relative to GDP as an alternative way of thinking about the financial burden imposed by security on each provincial-level unit.
Conclusion
This article presents updated data on China’s internal security spending from 1992 to 2022, with a specific focus on changes during Xi Jinping’s tenure. Compared to the pre-2012 period, the updated data reflect a mix of continuity and change. China’s internal security expenditure has continued to rise, more than doubling from 2012 to 2022, but has risen mostly in proportion to the PRC’s overall budget. The balance between central and local expenditure has shifted further towards local spending, which may increase pressure on local PSBs given rising local fiscal constraints. The MPS continues to receive the largest share of domestic security spending, with that share increasing from 2012 to 2022; meanwhile, absolute spending on the PAP has increased while its share of internal security spending has declined, which reflects its 2017–2018 reorganization. Domestic security spending per capita and relative to GDP continue to be higher in locations that are politically sensitive, including Beijing, Tibet and Xinjiang. These data point to the continued utility of examining China’s internal security spending statistics but also highlight the continued need to provide context to make them appropriate indicators that generate useful insight into China’s coercive capacity, its political economy and the functioning and stability of its overall political system.
Acknowledgements
The author thanks Jinhong Li for excellent research assistance. This research was supported by a Policy Research Institute grant from the LBJ School of Public Affairs at the University of Texas at Austin.
Competing interests
None.
Sheena CHESTNUT GREITENS is associate professor at the LBJ School of Public Affairs at the University of Texas at Austin, where she directs UT’s Asia Policy Program and serves as editor-in-chief of the Texas National Security Review. She is concurrently visiting faculty at the China Landpower Studies Center of the US Army War College’s Strategic Studies Institute, and a non-resident scholar at the Carnegie Endowment for International Peace. All views expressed here are her own.


 Open access