


’I know he’s a good general, but is he lucky?’
attributed to Napoleon Bonaparte1 Introduction
Under the presence of uncertainty, decisions can be correct ex-ante, in the sense of making the best possible use of information available at the time, and yet prove incorrect ex-post, with the benefit of hindsight. Conversely, a decision that eventually reaped great rewards may have simply been a stroke of luck and actually incorrect ex-ante (see e.g., Reference Kamin and RachlinskiKaminRachlinski, 1995, Reference Tetlock and GardnerTetlockGardner, 2016). Quite often, only the ex-post outcome is observed by a third party, who nevertheless needs to judge whether to delegate more decisions of the same type to the decision expert in question, that is, whether an expert with a given track record actually has the skill to make decisions that are correct ex-ante.
A good example of this is where investors, through buying mutual fund shares, delegate the decision on which assets to invest in to the expert fund manager. To choose which of a number of funds to invest in, one will typically compare their historical results, usually finding that some funds have recently been considerably better than others. But how likely are the previously superior funds to perform similarly well in the near future, that is, do their respective managers really have the skill to beat the market by identifying above-average profitable stocks? Similarly, financial companies make hiring decisions, deciding who to delegate investment decisions to, based on often very limited information about the candidates’ track record. Existing research in the area of finance (e.g., Reference Bessler, Blake, Lückoff and TonksBessler et al., 2017, Reference CarhartCarhart, 1997, Reference Guercio and ReuterGuercioReuter, 2014) suggests that such decisions suffer from information noise and past performance often fails to replicate in the future.
In this paper, we aimed to show that it may be possible to assess a person’s decision skills (and predict future performance) more accurately by analyzing not only the outcomes of the person’s previous decisions, but also the process through which those decisions were reached. In this way, we could identify skilled experts who performed a sound analysis of the problem but were unlucky, as well as people with little skill who were right ‘for the wrong reasons’ and unlikely to reproduce their lucky past results in the future.
In order to conduct such an analysis of the decision process, we propose to use the eye-tracking technique. It is well known that attention is subject to not only bottom-up (stimulus-driven) but also top-down control. With experience, people learn to focus on relevant rather than irrelevant information (Reference Jovancevic-Misic and HayhoeJovancevic-MisicHayhoe, 2009), and the degree of top-down control increases (Reference Orquin and Mueller LooseOrquinMueller Loose, 2013). Accordingly, existing research has documented significant differences in gaze behavior between professionals depending on their level of expertise, and between subjects instructed to attempt a task in different ways (Reference Gegenfurtner, Kok, van Geel, de Bruin, Jarodzka, Szulewski and van MerriënboerGegenfurtner et al., 2017, Reference Jarodzka, Scheiter, Gerjets and van GogJarodzka et al., 2010, Reference Rubaltelli, Dickert and SlovicRubaltelli et al., 2012). In the context of finance, a relationship between eye-metrics and decisions was demonstrated by Reference Rubaltelli, Agnoli and Franchin(Rubaltelli et al., 2016). To summarize, expertise and decision skills lead to different decision strategies, which in turn manifest in different eye-movement patterns.
At the same time, these results do not automatically imply that it will be possible to carry out a reverse inference, whereby, based on observed eye-movement patterns, one can infer the underlying decision strategy and assess the decision maker’s level of expertise. This is harder to demonstrate than showing that experts will exhibit certain differences in eye-movements compared with novices. Indeed, studies demonstrating that such reverse inferences are possible are relatively scarce. Reference Borji and Itti(BorjiItti, 2014) used machine-learning to show that, based on eye-data, it is possible to predict which of a number of image-viewing tasks the subject performs, and these authors have used similar techniques to infer tasks or strategies during perceptual and strategic problem-solving (Reference Król and KrólKrólKról, 2017, Reference Król and KrólKrólKról, 2018). Relatedly, Reference Hayes and Henderson(HayesHenderson, 2017) used eye-data to infer cognitive traits like intelligence and working memory capacity, which may be likened to our aim of assessing capacity to make good decisions. Finally, in our concurrent work (Reference Król and KrólKrólKról, 2019), we investigated the possibility that people might improve their decision-making when given feedback based on their recent eye-movements. However, what remains to be seen is whether eye-data gathered while making a decision can not only reveal the strategy used to make a decision, but also predict whether the person will make good decisions in the future.
To examine the above possibility, we recorded subjects’ eye-data as they performed a laboratory stock trading task commonly used in behavioral finance (Reference Fischbacher, Hoffmann and SchudyFischbacher et al., 2017, Reference Frydman, Barberis, Camerer, Bossaerts and RangelFrydman et al., 2014). Subjects choose between “good” (likely to increase) and “bad” (likely to decrease) stocks based on their observed returns. The optimal strategy in this setting is to buy stocks that were recently seen to increase, as they are therefore likely to be good and to continue to go up. Conversely, one should sell stocks that have recently fallen. However, many subjects are typically seen to hold on to losing stocks instead of selling, thus compounding their losses, in a bias known as the disposition effect (Reference FrazziniFrazzini, 2006).
Suppose then that we are ourselves ignorant of how to distinguish between good and bad stocks but would like to delegate our investment decision to one of our experimental subjects. Suppose further that we must assess the subjects’ skills based on a very limited sample of data (say, a single decision trial). We could simply judge based on whether a subject managed to make money. However, a poor decision-maker might still make the good decision by chance, or invest in a good stock that has recently happened to fall (i.e., “for the wrong reasons”), or finally pick a bad stock but still make money, since even bad stocks can increase sometimes. Conversely, a good decision-maker might accidentally pick a bad stock that has recently increased against the odds, or correctly identify a good stock but still see its price subsequently fall, thus losing money through bad luck. Either way, the subjects’ observed past performance is misleading and unlikely to be reproduced in the future.
Could we therefore use eye-movement data to refine the subjects’ assessment? In particular, existing research associated poor performance in the investment task we consider with the subjects’ avoidance of a negative “realization utility” (Reference Frydman, Barberis, Camerer, Bossaerts and RangelFrydman et al., 2014, Reference Ingersoll and JinIngersollJin, 2013) derived from realizing a negative capital gain by selling a stock below its purchase price (i.e., selling an owned stock that has recently fallen). Indeed, altering the decision screen to make the comparison between the purchase and current prices attract less attention was found to attenuate the disposition effect and improve decisions (Reference Frydman and RangelFrydmanRangel, 2014). Thus, we hypothesized that making an eye-transition between the purchase and current price data (indicative of making the said comparison and calculating the capital gain) could be a signature of poor decision-making. This is because a good investor (not driven by the disposition effect) should learn to ignore such data as less relevant for the stock’s chances of being good vs. bad than direct information about its price change history.
More specifically, we used mixed modelling and bootstrapping to check if adding information on whether the eye-transition in question occurred to information about the subjects’ observed choices and their financial outcome (profit or loss) increases the out-of-sample accuracy of a model predicting whether or not a person’s subsequent decision will be correct ex-ante (i.e., will entail holding on to a stock that is most likely good, or selling one that is most likely bad). In other words, we sought to demonstrate that, based on the way in which a person looked at available information to reach a decision, it is possible to predict whether the observed outcome of that decision is a reflection of the person’s skill or whether it is down to good (or bad) luck and as such is unlikely to be reproduced in the future.
2 Method
2.1 Subjects
56 student subjects (mean age 22.14, SD =2.07, 27 females) were recruited at the University of Social Sciences and Humanities in Wroclaw, Poland. All had normal or corrected to normal eyesight.
2.2 Task
We used the laboratory stock market setting (see e.g., Reference Frydman, Barberis, Camerer, Bossaerts and RangelFrydman et al., 2014, Reference Frydman and CamererFrydmanCamerer, 2016), with slight adjustments in visual presentation. Subjects are given the opportunity to trade three stocks (represented by square, circle, and triangle icons). The price path of each stock is governed by a two-state Markov chain, whereby the price of a stock that is in a good state increases by one with probability 0.6 and decreases by one with probability 0.4. Conversely, if a stock is in the bad state, its price increases with probability 0.4 and decreases with probability 0.6. In other words, stocks that are in the good state are more likely to increase than to decrease, and the opposite is true for those in the bad state, but being in the good/bad state is not equivalent to a price increase/decrease, because stocks that are in the good state can still at times decrease, and those in the bad state can sometimes increase.
In every decision trial, a randomly chosen stock is subject to a price update, after which the subject chooses whether to buy (a unit of) that stock if it is not owned already, or whether to sell the stock at the current price if it has been purchased before. There are no transaction costs and each stock can be traded any number of times during 80 decision trials.
Initially, the state of each stock is independently drawn as good/bad with equal probability. However, every time a stock is subject to a price update, there is a 0.2 probability that its state will change. Subjects cannot observe the true states but can infer them from observed price paths. In particular, given a price change z n∈{−1, 1 }, during the current, n-th price update of an asset, and probability q n−1 that the asset was in a good state at its previous update, the probability that it is currently in a good state, q n( z n, q n−1) , can be recursively calculated (Reference Frydman, Barberis, Camerer, Bossaerts and RangelFrydman et al., 2014) and is equal to:

(prior to the first price update we have q 0 = 0.5). Put simply, if the price increases (z n = +1), it becomes more likely that the stock is in a good state, because stocks that are in the good state are the ones that usually increase. The probability that the price of the given stock will subsequently increase is therefore:

which means that stocks that are most likely in the good state (q n>0.5) are also more likely to increase than to decrease, i.e., probability (2) is above 0.5. Based on this specification, the following definitions will be used throughout the paper:
good/bad stocks: stocks with a high/low probability of being in the good state, i.e., with a high/low probability of subsequently increasing;
ex-post correct decision: a decision to either a) buy or not sell (hold) a stock which increased at the next price update; b) sell or not buy a stock which decreased at the next price update;
ex-ante correct decision: a decision consistent with the optimal strategy of a risk-neutral Bayesian investor, i.e., to either: a) buy or not sell (hold) a stock when q n>0.5, i.e., when the stock is more likely to increase than to decrease at the next price update; b) sell or not buy a stock when q n<0.5, i.e., when the stock is more likely to decrease than to increase at the next price update.
Note that the definition of ex-ante correct decisions assumes risk-neutrality, following the aforementioned existing studies that use the same setting as we do here, and the same definition. Still, one could in principle specify an alternative definition incorporating risk-aversion, in which the buy/sell threshold is above 0.5. However, what is beyond doubt is that a rational trader should be more likely to buy/hold a stock as q n increases, and this is a tendency which we examine in the results section. Relatedly, when we later use terms such as “high decision-making skills” or “good decision-making”, what we mean is exhibiting the above tendency to sell bad stocks rather than good ones, and hold good stocks rather than bad ones.
An example decision screen is shown in Figure 1. In each trial (preceded by 1.5-second fixation cross), the information was revealed to the subjects sequentially, with new Areas-of-Interest (AOIs) appearing alongside existing ones in the following order. First, the subject was shown an icon representing the asset subject to a price update, where a smaller wallet icon indicated whether or not the stock was currently owned. Next to it, there was a sequence of five icons, showing the history of recent price changes of the stock (up or down arrows). This was our AOI number 1. After four seconds, a similar up or down arrow would appear (AOI 2a/b) indicating the current price change. This was to simulate a real-world situation in which the investor is likely aware of how a stock she invested in performed in the past before finding out the latest price change.
A sample decision screen shown to subjects. In this example, the square stock is owned by the subject, and the eye-tracking Areas-of-Interest are orange-framed and labeled with their respective numbers (the orange frames and labels are for information and were not seen by subjects).
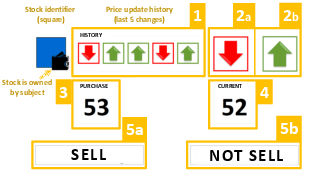
Upon displaying the current price change, the resulting current price of the stock was shown (AOI 4). If the subject owned the stock, the purchase price would be simultaneously displayed (AOI 3). In addition, two buttons would appear, representing the available choices: either “sell” and “do not sell” if the stock was owned, or “buy” and “do not buy” if it was not owned (AOI 5a/b). In summary, AOIs 2–5 appeared following AOI 1, after a 4-second delay. The left-right positioning of AOIs was randomized for each subject but constant between trials. Once all the information was revealed, the decision screen was as shown in Figure 1.
From the sixth trial onward, there was a time limit of 5 seconds from the moment all elements were displayed on the screen. After this, there would be a sound signal giving the subject a reminder to enter her choice, and failing that, a further 2 seconds later the choice would be made at random. Subjects were informed about the introduction of the time limit via an instruction slide appearing after the fifth trial. As in existing studies using the current setting, the purpose of the time limit was to keep the subjects focused on the task (and, in our case, to keep their gaze focused on the decision screen). However, compared with existing studies, the time limit was more generous (7 seconds since all elements becoming visible, or 11 seconds in total, compared with 3 and 5 seconds respectively in Reference Frydman, Barberis, Camerer, Bossaerts and RangelFrydman et al., 2014). Indeed, subjects failed to decide within the time limit in less than 1% of trials.
2.3 Procedure
Subjects were tested individually, each seated at a computer terminal with 15.4-inch screen with resolution set to 1280x720. Attached underneath the screen was a SMI RED250 eye-tracking device set to 120Hz frequency. Following on-screen instruction slides (see the supplementary file), we conducted a five-point eye-tracking calibration (average deviation was below 0.5° for all subjects).
To detect eye fixations, we used the SMI Vision Event Detector with default settings (fixation duration > 80ms, dispersion < 100px).
Each subject’s reward for taking part was calculated by subtracting the initial allocation of experimental currency that she was given from the final value of her portfolio (defined as the total price of stocks owned after the last trial, plus any uninvested experimental currency). The result was multiplied by a local currency equivalent of 0.40 USD, and an equivalent of 8 USD added as show-up fee. The study took approximately 35 minutes to complete and the average payoff was slightly above 8 USDFootnote 1
3 Results and discussion
3.1 Aggregate-level descriptive analysis
We analyzed 2426 decisions to sell or hold an owned stock (“selling decisions”, 43 per subject on average), 27.5% of which belonged to the former category. We focused on decisions to sell or hold rather than those on whether to buy a stock that is not currently owned, since the former of these two cases is where the disposition effect manifests itself. In fact, we hypothesized that attention to AOIs required to compute the capital gain would be a signature of poor decisions. However, the purchase price (AOI 3), was unavailable for buying decisions, in which case the stock is not yet owned and there is no capital gain for the subject to compute.
Furthermore, we dropped the less than 1% of trials in which the subject did not decide within the time limit, as well as the first five trials for each subject, which were intended as training and in which the time limit was not yet imposed. Finally, we dropped the less than 1% of trials in which no eye fixations were recorded.
To measure the strength of the disposition effect, we calculated the “proportion of gains realized” (PGR) in the sense of Reference Odean(Odean, 1998), defined as the share of trials in which a stock trading at a gain relative to purchase price is sold in the total number of trials in which the stock trades at a gain. The “proportion of losses realized” (PLR) is defined analogously. Across all data, we obtained PGR = 0.36 > PLR = 0.20, similarly to Reference Frydman, Barberis, Camerer, Bossaerts and Rangel(Frydman et al., 2014), indicating a tendency to realize gains rather than losses. This establishes the consistency of the task with its previous applications, and its validity for our purposes, as a problem in which decision bias is common and poor as well as good performance is possible.
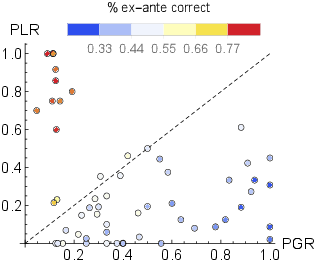
We observed a considerable heterogeneity among our subjects in how they approached the game. In particular, for each of the analyzed trials, we computed the probability q n (of the stock being in the good state) according to the formula 1, and used it to determine if the subject’s decision to sell or hold has been ex-ante correct. The overall frequency of ex-ante correct selling decisions was 50.8% (compared with 52% for buying decisions), while the between-subject variation in the proportion of ex-ante correct trades, as well as the PLR and PGR values, is shown in Figure 2. We see that the majority of subjects seems to have been affected by the disposition effect, in that they are more likely to realize gains than losses, which is reflected by the corresponding data points being located below the 45∘ line.
The between-subject variation in the proportion of realized losses (PLR), gains (PGR), and the proportion of ex-ante correct decisions (each dot represents a single subject).
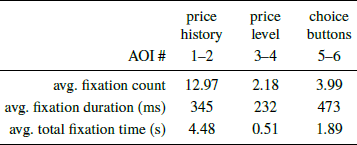
We now proceed to the analysis of eye-data, starting with a basic descriptive summary of fixation statistics, presented in Table 1.
For each trial, we further calculated the value of a binary variable “prices-compared”, taking a value 1 if subsequent fixations on AOIs 3 and 4 (purchase and current price level) were registered during the trial (i.e., the subject made an eye-transition between the two pieces of price level information, in any order), and 0 otherwise. Our decision to focus on the two price-level AOIs is motivated by earlier research (Reference Frydman and RangelFrydmanRangel, 2014), which showed that making these two pieces of information less visible reduces the disposition effect. Indeed, looking at AOIs 1 and 2 is sufficient to make ex-ante correct trades, since all information required to recursively update q n was displayed there. Furthermore, given the time limit, considering any other data, like that in AOIs 3–4, would have hindered the trading performance and was thus best avoided. Finally, looking at AOIs 3 and 4 was needed to compute the capital gain and decide in accordance with the disposition effect.
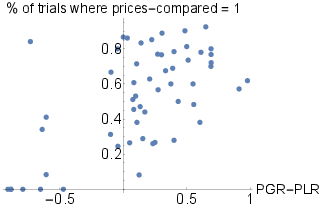
As hypothesized, transitions between these two AOIs are related to bad decisions. In particular, the frequency of trials in which prices-compared = 1 is significantly negatively correlated with the proportion of ex-ante correct decisions (ρ=−0.47, p<.01), and significantly positively correlated with the PGR – PLR measure of the disposition effect (ρ=0.61, p<.01), as additionally illustrated in Figure 3.
The between-subject variation in PGR-PLR and the proportion of trials where prices-compared = 1 (each dot represents a single subject).
In fact, we found that the proportion of total fixation time allocated to AOIs 3 and 4 has similar properties, as it is significantly negatively correlated with the proportion of ex-ante correct decisions (ρ−0.57, p<.01), and significantly positively correlated with the PGR – PLR measure of the disposition effect (ρ=0.59, p<.01). However, in line with our initial hypotheses, in what follows we focus on the prices-compared eye-transition variable, as the measure that can be more directly linked to making a comparison between the two price levels to compute the capital gain.
In particular, going back to the introductory discussion and hypotheses, our aim was to ask whether adding eye-data (in the form of the prices-compared variable) to standard observable behavioral information would increase the accuracy of predicting a subject’s future performance. To this end, for each selling decision trial, we further calculated the values of the following two binary variables:
ex-post-correct: taking a value of 1 if the subject decided to sell a stock which decreased at its next price update or to hold a stock which increased at its next update, and a value of 0 otherwise;
consistent-with-bias: taking a value 1 if the subject decided to sell a stock trading at a gain or hold one trading at a loss, and a value of 0 otherwise.
In Table 2, we report, for each of the 2x2x2 = 8 combinations of the above two variables and prices-compared, the proportion of ex-ante correct decisions made by the same subject in the next decision trial in which a selling decision is made (“next selling trial”). For instance, in the bottom-right cell of the table, we report the frequency (51.8%) of making an ex-ante correct selling decision by subjects whose previous selling decision proved correct ex-post, was consistent with disposition effect, and where during the trial in which that previous selling decision was made the subject made an eye-transition between the two pieces of price level data.

The structure of Table 2 represents the practical problem that motivated our investigation. Specifically, we wish to assess a person’s decision-making skills based on a relatively small sample of past performance data. In particular, suppose that we have observed that person make a single decision, and we know whether the outcome of that decision was positive (ex-post-correct). We can also judge whether the decision was ostensibly in line with common forms of bias known to be prevalent in the given context (here, the disposition effect, as captured by the consistent-with-bias variable). However, we do not know whether or not the decision made the best possible use of information available at the time, i.e., if it was ex-ante correct. (If we did know what the ex-ante correct decision is in given circumstances, we would not need to find an expert to delegate the decision to.) Based on this limited information, we would like to predict whether, should we delegate our decisions to the person in question, her next decision will make the best use of available information, i.e., will be ex-ante correct.
Note that the next selling decision could be a decision whether or not to sell a different stock, and could be separated from the current trial by one or more buying decisions. This makes the prediction task harder, but also highlights the crucial aspect of our investigation. Specifically, it is clear from existing research that information acquisition patterns determine decisions. For instance, if one does not look at the price level information required to compute the capital gain, then it is not surprising that the current decision is not driven by a tendency to realize gains rather than losses. However, we seek to go one step further, and hypothesize that the fact that a subject does not look at this information now could indicate a degree of top-down control and pursuing a strategy that deliberately ignores the price-level data. Thus, the subject might also apply this strategy in future decisions under different circumstances (different stock, different price change history etc.). We wish to verify if eye-data could help identify such consistent and transferable (between trials) styles of decision-making.
Unsurprisingly, we see from the row/column marginals in Table 2 that ex-ante correct decisions occur more often when the previous selling decision was inconsistent with bias and when it proved ex-post correct.
The comparisons of particular interest to us are the ones marked in the table by the four arrows – representing the effect of prices-compared for each of the four combinations of consistent-with-bias and ex-post-correct. It appears that, particularly when consistent-with-bias = 0, making an eye-transition between the two price levels is associated with a much smaller proportion of ex-ante correct decisions in the next trial. This suggests that even once we consider the available behavioral data, analyzing one’s eye-movements could still refine our view of how that person will perform in the future.
However, due to the presence of missing data (e.g., some subjects never looking at AOIs 3 and 4, never deciding consistently with bias etc.), the statistical significance of the four highlighted comparisons must be evaluated on the individual-trial rather than aggregate level.
3.2 Trial-level regression analysis: the contribution of eye-data to prediction accuracy
We estimated a mixed effects binary logistic regression model with the set of predictors including the three binary variables described above (ex-post-correct, consistent-with-bias, and prices-compared), as well as the probability q n of the stock being in the good state in the next selling trial (labeled prob-good-next). The binary dependent variable is the subject’s decision to sell the stock in the next selling trial (a decision to sell is encoded as sell-next = 1 and a decision to hold as 0).
The reason why we included sell-next and prob-good-next, rather than dropping the latter and replacing the former with whether or not the next decision was ex-ante correct, is that we wished to check not only if and when a subject becomes more likely to make good ex-ante decisions but also why this occurs, that is, what changes in the decision-making strategy to bring this about (we will later also consider a specification with ex-ante correct used instead). In particular, good ex-ante decisions occur if the subject sells when the said probability (of the stock being in the good state) is low and holds when it is high. Thus, by estimating a continuous relationship between prob-good-next and the propensity to sell, we are making a more precise assessment of the subject’s decision strategy than when making a binary prediction of an ex-ante correct/incorrect subsequent decision. Putting it differently, the presence of prob-good-next has a denoising effect. Without it, a situation in which one makes, for instance, an incorrect decision to sell an almost certainly good stock is not treated differently from one in which one incorrectly sells a stock that has a 49% chance of being a good one. Including prob-good-next thus controls the variation in the stocks’ price change history (i.e., the objective properties of the decision problem) between trials.
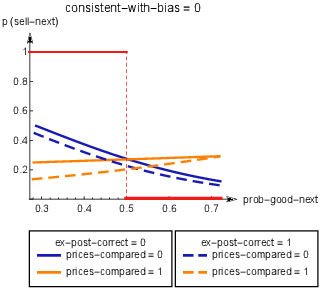
Thus, our regression formulation is structured to estimate the relationship between prob-good-next and the likelihood of selling for each of the 2x2x2=8 combinations of ex-post-correct, consistent-with-bias, and prices-compared. Estimating an intercept and slope in each of the 8 cases gives rise to 8x2 = 16 model coefficients. To illustrate, four of the estimated relationships (for consistent-with-bias = 0), are depicted in Figure 4.
The estimated relationship between the probability of a subject who made a trade not consistent with bias in the previous trial selling the stock in the next trial and the Bayesian probability of the stock then being in the good state. Each of the four continuous curves depicts the relationship under a different combination of ex-post-correct and prices-compared in the previous trial; the red piecewise function represents ex-ante correct decision-making.
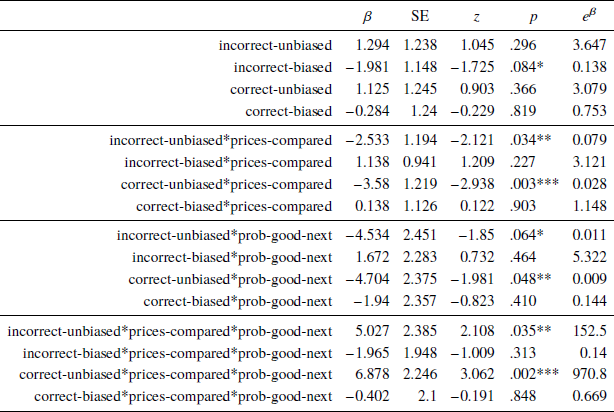
In particular, the first four (top-most) coefficient estimates in Table 3 represent the intercept terms for each combination of ex-post-correct and consistent-with-bias, coded by four dummy indicator variables (incorrect-unbiased, incorrect-biased, correct-unbiased, and correct-biased), and given that prices-compared = 0.
significance codes:
* 0.1
** 0.05
*** 0.01
The next four coefficients are interactions of the above indicators with prices-compared, and so represent the change in the intercept when the subject makes a transition between AOIs 3 and 4. We see that this change is significantly negative in the two “unbiased” cases. This means that, when consistent-with-bias = 0, subjects are less likely to sell very bad stocks (prob-good-next close to zero) if they made a transition between AOIs 3 and 4 in the previous trial.
The third (from the top) group of four coefficients represent the slopes of the estimated relationships between prob-good-next and the likelihood of selling, for each combination of ex-post-correct and consistent-with-bias, when prices-compared = 0. The slope is significantly negative in the correct-unbiased case, and a similar trend towards significance is seen for incorrect-unbiased. Thus, subjects who did not make a transition between AOIs 3 and 4 in the previous trial, and made a choice inconsistent with bias, are more likely to sell a stock when the chance of it being in the good state is smaller.
Finally, the last group of four triple interaction terms (which now involve prices-compared) represent the change in the above four slopes when the subject does make an eye transition between AOIs 3 and 4. This corresponds to the four effects indicated by arrows in Table 2. Indeed, we found significant positive effects in the correct-unbiased and incorrect-unbiased cases. This means that, in those two scenarios, a subject who made the transition between AOIs 3 and 4 becomes more likely, relative to one who did not, to sell a stock as the chance of it being in the good state increases.
This can also be seen in Figure 4, where the orange (resp. blue) lines represent the decision strategy of subjects who did (resp. did not) make the transition between the price level AOIs in the consistent-with-bias = 0 case. We can see that the orange lines are lower than blue ones for low values of prob-good-next, but this tendency is reversed for high values of prob-good-next, due to the slope of the orange lines being higher (more positive). This represents a significant change in decision strategy depending on the eye-movement patterns captured in the previous trial: subjects who did not transfer their gaze between the price level AOIs are more likely to sell bad stocks than good ones, while those who did appear to compare the prices do the opposite. This, in turn, translates into a significantly higher fraction of ex-ante incorrect decisions made (in the following trial) by subjects who previously made the eye transition, as already seen in Table 2 (the two comparisons marked by arrows in the consistent-with-bias = 0 case).
The fact that we do not observe a similar tendency when consistent-with-bias = 1 suggests that eye-data is then less decisive in diagnosing decision-making skills. A possible explanation for this might be that those subjects who focus their attention on the price change history rather than the price level information because they understand that the latter is irrelevant are also unlikely to decide in a way consistent with the disposition effect (consistent-with-bias = 1). Thus, those (other) subjects who avoid the transition between AOIs 3 and 4 when consistent-with-bias = 1 likely do so not because they understand the irrelevance of this information, but for other reasons. For instance, they might be generally inattentive to information about the stocks or they might infer the sign of the capital gain without directly transferring their gaze between the price level AOIs (e.g., a subject might buy a stock and then find the price of the same stock updated downwards in the next trial, in which case she might infer that the capital gain is negative without considering the price levels). Thus, observing a transition between AOIs 3 and 4 could be less informative when consistent-with-bias = 1 than in the opposite case, because it does not separate subjects who understand the relevance of different pieces of information from those who do not.
Overall, these results suggest that eye-data and standard behavioral data could complement each other and their effects could interact, leading to higher predictive accuracy. We further investigate this possibility in the following section.
3.3 Evaluating the contribution of eye-data to overall out-of-sample prediction accuracy
We have seen that eye-data can help predict future decision-making performance in some scenarios, but not in others. The question is then, can it significantly add to the overall prediction accuracy? Additionally, so far we have explored the relationship between subjects’ gaze patterns in a given trial and how they would behave in the future under different circumstances, i.e., how likely they would be to sell good vs. bad stocks. However, in real-world applications, in which we must pick an expert to delegate future decisions to, we would not know if the stock that the expert would need to assess next will be good or bad (if we did, there would be no need for us to hire the expert). We simply wish to know if the expert will be able to make the best possible use of information available at the time to make the ex-ante correct decision. Thus, we now estimated a model in which the binary dependent variable encodes making an ex-ante correct decision in the next trial (“ex-ante-correct-next”), while prob-good-next is dropped from the set of predictors.
Our aim was to compare the predictive accuracy of a model comprising ex-post-correct, consistent-with-bias, and prices-compared as predictors (“full model”) with one that does not include eye-data, i.e., with prices-compared dropped (“reduced model”). Furthermore, we wished to compare the performance of the two models in dealing with unseen data. To this end, we used out-of-sample bootstrapping, repeatedly drawing with replacement a sample equal to the full dataset in size, using it to estimate the two models, and then evaluating the two models using the remaining (not drawn) observations (but without conditioning on the random subject effects). The two evaluation metrics we used are the Brier score (mean squared error between the estimated probability and actual outcome) and total area under the resulting receiver operating characteristic curve (AUC). The latter is equivalent to the probability that the likelihood of being ex-ante correct estimated for a randomly drawn decision that was indeed ex-ante correct will be higher than one estimated for a randomly drawn ex-ante incorrect decision (it is also equal to the value of the corresponding Wilcoxon-Mann-Whitney test statistic). The model comparison results are presented in Table 4.
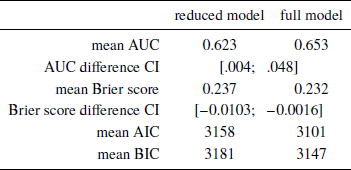
Based on the fact that the model including eye-data is characterized by significantly higher AUC scores and significantly lower Brier scores than the reduced model, we may conclude that the full model offers a greater out-of-sample prediction accuracy than the reduced model.
3.4 General discussion and potential applications
Using an established behavioral finance setting, we established that examining the way in which a person has reached a decision, even via the most basic eye-metrics, could still make it possible to more accurately predict how that person will perform in the future. In particular, existing literature (Reference Frydman and RangelFrydmanRangel, 2014) showed that making price level information less visible improves investment decisions, so we hypothesized that making an eye transition between the corresponding pieces of information could be a signature of poor performance in the task. However, our objective was different from Frydman and Rangel, in that we sought to use process data to assess decision skills and predict future performance, rather than looking for a way to improve choices by modifying the decision environment.
We found that we can more accurately predict if a subject’s next decision will be ex-ante correct if we consider not just whether or not that subject’s most recent decision has been consistent with the disposition effect and correct ex-post, but also whether or not the subject has made an eye-transition between the purchase and current price information. The reason for this was that, as evidenced by the regression estimates in Table 3, comparing the two prices is associated with selling good stocks rather than bad ones in subsequent decision trials, in line with the disposition effect. In contrast, refraining from a price comparison is a sign of relatively higher decision-making skills, which manifest in a tendency to subsequently sell bad stocks rather than good ones, leading to a higher proportion of ex-ante correct trades.
The fact that eye-data allowed us to make predictions with higher out-of-sample accuracy suggests that our proof of concept could have potential applications in real-world contexts. For instance, traders or investment analysts working in a financial company could have their decision-making skills assessed based on what pieces of information they looked at. This could be done using data from a very small number of decision trials, or indeed, as in our case, based on a single decision. This, again, is a crucial aspect, because the cost of bad financial decisions is high and it is vital to identify poor decision-makers as quickly as possible, before they make too many mistakes. However, assessing them based on a small sample of observed outcomes suffers from significant information noise because, in the short-run, bad decision-makers can at times succeed and good ones can fail by sheer chance. We demonstrated that process tracing could allow us, to a certain extent, to get the best of both worlds, i.e., consider a small sample of past decisions but, by considering how those decisions were made, predict future decision performance more accurately.
The fact that even the most simple eye-metrics, such as the one used here, can discriminate between decision strategies, could also make the proposed approach beneficial for individual, amateur traders, i.e., the ones especially susceptible to bias (Reference Dhar and ZhuDharZhu, 2006). In particular, most investment decisions are nowadays made using devices equipped with simple but increasingly accurate eye tracking facilities, such as laptops or smartphones. Latest crowdsourced eye tracking techniques allow for pooling data from such devices via the internet, and for simple eye-movement metrics, like the one used here, the quality of the data tends to be satisfactory (Reference Krafka, Khosla, Kellnhofer, Kannan, Bhandarkar, Matusik and TorralbaKrafka et al., 2016, Reference Xu, Ehinger, Zhang and FinkelsteinXu et al., 2015). Thus, technologies based on the present findings could, in the future, be integrated into online asset trading platforms in order to diagnose bad decision-making based on what information a person has looked at. Naturally, our results are obtained in a highly stylized, uniform laboratory setting, whereas real-world decision-making environments and interfaces are much more diverse and complex. However, we see the proof of concept we put forward here as a small but useful first step in reaching the final result outlined above.
Another important caveat that we should note is that in evaluating the model’s out-of-sample accuracy we have implicitly used the pre-determined probabilities of the stocks being in the good state. In real-world applications, it is likely that these probabilities (and the statistical properties of the price process) would be unknown (indeed, if they were known, there would be no need for experts able to estimate them). Here, due to the stylized nature of the laboratory setting, we were able to use a dependent variable indicating whether a subject’s decision in the next trial was ex-ante correct. This reduces the noise and gives enough power to validate the contribution of eye-data in a relatively small dataset. Had we used a dependent variable indicating if the next decision was ex-post (rather than ex-ante) correct, this would simply increase error variance, as some ex-ante correct decisions would prove incorrect ex-post. However, as any decision that is more likely to be ex-ante correct is also more likely to prove correct ex-post, a sufficient amount of data would see us reach the same conclusions as we did here. Similarly, in a real-world context, it should be possible to calibrate an effective model predicting future ex-post performance given enough data, a requirement that might be overcome with relative ease by crowdsourcing eye-data from mass consumer devices.
In conclusion, our results demonstrate that eye-movement information can be used to discriminate between different ways of making economic decisions, and particularly to distinguish between luck vs. skill when evaluating decision-making abilities and predicting future performance. The fact that the model can predict future decision performance out of sample, the simplicity of eye-metrics used to achieve it, and the increasing ubiquity of eye-tracking in mass consumer devices, all suggest that such techniques could potentially become applicable in real-world settings.


 Open access

