


Introduction
Many countries across the tropics face major challenges around meeting the needs of rapidly developing and growing populations and maintaining viable ecosystem services while tackling the impacts of climate change through mitigation and adaptation strategies. The REDD+ mechanism was proposed as a climate change mitigation framework with the potential for reducing greenhouse gas emissions while addressing rural poverty and conserving forest biodiversity and ecosystem services at the 16th Conference of the Parties (COP 16) of the United Nations Framework Convention on Climate Change (UNFCCC) in 2010. The international discussions on REDD+ evolved and diversified over time (Angelsen et al. Reference Angelsen, Brockhaus, Sunderlin and Verchot2012, Pistorius Reference Pistorius2012, Lund et al. Reference Lund, Sungusia, Mabele and Scheba2016), delivering hope, discouragement, support and criticism on its feasibility and capacity to mitigate climate change, while also contributing to livelihoods, sustainable development, enhanced governance and biodiversity conservation (Sunderlin et al. Reference Sunderlin, Pratama, Bos, Avitabile, Sills, de Sassi, Joseph, Agustavia, Pribadi and Anandadas2014, Pasgaard et al. Reference Pasgaard, Sun, Müller and Mertz2016, Turnhout et al. Reference Turnhout, Gupta, Weatherley-Singh, Vijge, de Koning, Visseren-Hamakers, Herold and Lederer2016, Loft et al. Reference Loft, Pham, Wong, Brockhaus, Le, Tjajadi and Luttrell2017).
Tanzania started its REDD+ readiness process in 2008 (Burgess et al. Reference Burgess, Bahane, Clairs, Danielsen, Dalsgaard, Funder, Hagelberg, Harrison, Haule, Kabalimu, Kilahama, Kilawe, Lewis, Lovett, Lyatuu, Marshall, Meshack, Miles, Milledge and Munishi2010, URT 2010). This set the foundations and tested the carbon emissions monitoring, reporting and evaluation system (MNRT 2015). Tanzania also recently submitted its Intended Nationally Determined Contributions to the UNFCCC (URT 2015); these give REDD+-related actions a central, national role in both mitigation and adaptation contributions to climate change and the development of a low-emission growth pathway. More recently, the country has submitted its Forest Reference Emission Level (FREL) to the UNFCCC (currently undergoing technical assessment), which estimates annual deforestation at 580 000 ha year–1 over the 2002–2013 period (URT 2016). Several factors drive deforestation either directly (e.g., demand for farmland and biomass energy) or indirectly (e.g., high population growth rate, governance weakness and unsecure land tenure; Burgess et al. Reference Burgess, Bahane, Clairs, Danielsen, Dalsgaard, Funder, Hagelberg, Harrison, Haule, Kabalimu, Kilahama, Kilawe, Lewis, Lovett, Lyatuu, Marshall, Meshack, Miles, Milledge and Munishi2010, Kweka et al. 2015).
The Norwegian government funded a series of REDD+ pilot projects in Tanzania, which mainly focused on the local implementation of REDD+, in isolation from other policy mechanisms (Blomley et al. Reference Blomley, Edwards, Kingazi, Lukumbuzya and Vesa2015). Although useful, these local insights are of limited use for scaling to the national context or for creating long-term future sustainable development strategies (Abidoye et al. Reference Abidoye, Mungatana, Mahlalela, Sacolo and Babalola2015). A key part of the REDD+ mechanism in Tanzania is to estimate trade-offs between carbon emission reduction and multiple co-benefits potentially achievable under REDD+, such as food and energy provisions, water availability and biodiversity conservation in relation to national development strategies (e.g., Tanzania Development Vision 2025; URT 2005). An initial assessment of potential REDD+ co-benefits in Tanzania (Miles et al. Reference Miles, Kabalimu, Bahane, Ravilious, Dunning, Bertzky, Kapos and Dickson2009, Runsten et al. Reference Runsten, Ravilious, Kashindye, Giliba, Hailakwahi, Kashaga, Khalid, Mbilinyi, Mwampashi, Pastory, Mant, Osti, Crête, Pekkarinen, Leppanen and Miles2013) has been followed by efforts to produce increasingly specific and nation-based datasets, analyses (Augustino et al. Reference Augustino, Bowles, Carr, Cox, Hicks, Mant, Mbilinyi, Meng, Ravilious, Runsten, Salvaterra, Dos Santos, Tognelli and Zahabu2014), scenarios methods (Capitani et al. Reference Capitani, Mukama, Mbilinyi, Malugu, Munishi, Burgess, Platts, Sallu and Marchant2016) and REDD+ Social and Environmental Safeguard Standards (VPO 2013a). In this study, we present a quantitative evaluation of the potential interacting impacts of two alternative socioeconomic and land-use and land-cover change (LULCC) scenarios on carbon stocks and two non-carbon forest ecosystem services: biodiversity and water regulation. We analyse the spatial distribution of potential mutually beneficial or conflicting outcomes from the two scenarios. We then discuss the potential contribution of scenario analysis to FREL reporting and to identifying potential synergies or conversely preventing unintended impacts within the framework of the Tanzania national climate change and development strategies and international pledges.
Methods
Our study focused on the mainland of the United Republic of Tanzania, the largest country in East Africa with a population of 44.9 million people (NBS & OGCS 2013). Forests cover c. 48.1 million hectares (Mha), corresponding to 55% of Tanzania’s mainland (National Forest Resources Monitoring and Assessment [NAFORMA]; MNRT 2015). This figure is higher than estimates obtained from satellite data (38.3% in 2010; MNRT 2013). In Tanzania, forests are managed either in protected areas – various designations comprising approximately half of the woody volume, where forest management ranges from total protection (e.g., nature reserves) to regulated harvesting (e.g., forest reserves) – or in ‘village’ and ‘general land’ (15.4 Mha; MNRT 2015). An estimated 4 Mha falls under community forest management regimes under participatory forest management (PFM; MNRT 2008).
Scenarios Development
We developed LULCC scenarios for Tanzania to 2025 following four steps within a mixed participatory and modelling scenario framework (see Supplementary Material, available online) that engaged 240 stakeholders from civil society and authorities at local, regional and national levels (WWF 2015, Capitani et al. Reference Capitani, Mukama, Mbilinyi, Malugu, Munishi, Burgess, Platts, Sallu and Marchant2016). First, we broadly defined two alternative scenarios: the business as usual (BAU) scenario, where the policies framework, demand for commodities and implementation of REDD+ follow the current development trajectory; and the green economy (GE) scenario, where a shift towards sustainable practices is envisaged for agriculture, forestry and energy sectors, supported by governance enforcement, effective REDD+ implementation and enhanced productivity. Then, regional stakeholders developed locally tailored, qualitative and semi-quantitative scenario trajectories, associated with specific spatial patterns and likelihoods of LULCCs. Next, LULCC scenarios were modelled by allocating demand for cultivated land and wood biomass according to LULCC likelihood spatial layers (Supplementary Table S1), as expected by stakeholders and validated with secondary data. By using the national land-use and land-cover map for 2010 (Supplementary Fig. S1a; MNRT 2013) as the baseline and the World Database on Protected Areas (IUCN & UNEP-WCMC 2015), changes were modelled from specific land-use and land-cover classes to arable land (cultivation expansion), to mixed cultivated–wooded land (shifting cultivation) and to classes having lower tree cover and biomass without cultivation replacement (degradation; e.g., from closed woodland to bushland). Preliminary results were validated in a national-level workshop in 2015 and refined thereafter to create the results presented here. The spatial resolution of scenario outputs was c. 100 m. To maintain the local representativeness of change pressures in the national-scale impact assessment on carbon and non-carbon benefits, we applied a double resampling process that has reduced the accuracy of our analysis (see ‘Discussion’ section and Supplementary Material).
Carbon Stock
Biomass carbon stock was estimated for the Tanzania mainland using a national dataset for above-ground biomass (Ortmann Reference Ortmann2014) based on NAFORMA forest inventory data, and from land cover-specific ratios for below-ground biomass (MNRT 2015), litter and deadwood biomass (Willcock et al. Reference Willcock, Phillips, Platts, Balmford, Burgess, Lovett, Ahrends, Bayliss, Doggart, Doody, Fanning, Green, Hall, Howell, Marchant, Marshall, Mbilinyi, Munishi, Owen and Swetnam2012). The wood dry matter biomass was converted to carbon by applying a 0.47 conversion factor, following the national protocol (URT 2016). Top soil organic carbon content for the 0–30-cm layer was estimated by multiplying carbon concentration data from a national map (Kempen et al. Reference Kempen, Kaaya, Mhaiki, Kiluvia and Ruiperez-Gonzalez2014) by the corresponding volume and bulk density obtained from the Soil and Terrain Database (SOTER) of Southern Africa (Dijkshoorn Reference Dijkshoorn2003). Both scenarios and the associated LULCCs imply carbon stock losses by 2025, though these are lower in the GE than in the BAU scenario (Capitani et al. Reference Capitani, Mukama, Mbilinyi, Malugu, Munishi, Burgess, Platts, Sallu and Marchant2016), reflecting the need for ensuring food and energy security while allowing infrastructure development. For LULCC-driven carbon stock changes, the baseline (Supplementary Fig. S2a) was created from biomass and top soil carbon datasets resampled from the original c. 250-m resolution to c. 100-m resolution by using the nearest neighbour method. We assumed that cultivation expansion depletes the five carbon pools, while shifting cultivation and degradation deplete the above-ground and dead wood biomass only. For newly created cultivated land or shifting cultivation, carbon stocks in the scenarios were estimated as the average stock of the respective classes for the baseline. Carbon stock for degraded areas in the scenarios was estimated by decreasing the baseline biomass proportionally to the average biomass loss for the specific LULCC types expected in each pixel. Carbon stock changes were calculated as the pixel base difference between the baseline and the scenarios. The final results were then aggregated at 1-km resolution.
Biodiversity
We assessed the potential impacts of LULCCs on biodiversity under the two scenarios focusing on terrestrial vertebrate species as derived from the International Union for Conservation of Nature (IUCN) Red List database (mammals, birds, amphibians and reptiles; BirdLife International & NatureServe 2015, IUCN 2016). Species sensitive to the modelled LULCCs (hence LULCC-sensitive species) were selected following the IUCN classification of threats from cultivation expansion (threat classes 2.1 and 2.2.1), livestock rearing (class 2.3), wood harvesting for energy and timber (class 5.3), fire (class 7.1) and urbanization (class 1) (see Salafsky et al. Reference Salafsky, Salzer, Stattersfield, Hilton-Taylor, Neugarten, Butchart, Collen, Cox, Master, O’Connor and Wilkie2008). For every species, extent of occurrence layers in Tanzania were clipped to the occupied habitats by matching the associated IUCN habitat classes with global cover land-use types (Foden et al. Reference Foden, Butchart, Stuart, Vié, Akçakaya, Angulo, DeVantier, Gutsche, Turak, Cao, Donner, Katariya, Bernard, Holland, Hughes, O’Hanlon, Garnett, Şekercioğlu, Mace and Hoffmann2013) and then with our reference land-use and land-cover classes to generate extent of suitable habitat (ESH) polygons. We collected spatial distribution data and generated ESHs for 164 amphibian, 311 mammal, 58 reptile and 1002 bird species on the Tanzanian mainland. Out of these 1535 terrestrial vertebrates, 177 are either classified by the IUCN (2016) as endemic (127) or included in the IUCN categories ‘Critically Endangered, Endangered and Vulnerable’ (hence threatened species; 140) or both (90). We calculated ESH reductions in the two scenarios for LULCC-sensitive species, focusing on endemic species and threatened species with at least 1% of their range included on the Tanzania mainland. We calculated a spatially explicit biodiversity richness and rarity index (BRRI; modified from van Soesbergen et al. Reference van Soesbergen, Arnell, Sassen, Stuch, Schaldach, Göpel, Vervoort, Mason-D’Croz, Islam and Palazzo2017; see Supplementary Fig. S2b) across Tanzania at a 1-km resolution by summing over all occurring species in each grid cell (richness) the ESH weighted by the species distribution range size in Tanzania and over the globe (rarity; see Supplementary Material for equations).
Water Yield
To assess the impacts of LULCCs under the two scenarios on water yields, we used the WaterWorld V2 (Mulligan Reference Mulligan2013) model at a resolution of 1 km. WaterWorld is a fully distributed, process-based hydrological model that utilizes remotely sensed and globally available datasets. Baseline climate data are based on long-term climatology from WorldClim (Hijmans et al. Reference Hijmans, Cameron, Parra, Jones and Jarvis2005). Land use and land cover in the model are represented by fractional values for three functional vegetation types (tree, herb and bare). We calculated these fractional values for each land-use class in the baseline case and the scenarios using the nearest mean fractional value for a group of cells of that class for moderate-resolution imaging spectroradiometer (MODIS) vegetation continuous fields (VCF) data for the year 2010 (DiMicelli et al. Reference DiMicelli, Carroll, Sohlberg, Huang, Hansen and Townshend2011), thus retaining variability within land-use classes as well as within country. Calculations were made at the c. 100-m scenario resolution by resampling the MODIS VCF data. Final baseline and scenario fractional vegetation maps were then aggregated to a 1-km resolution and used to run the model. Changes in water yields under each scenario were analysed as changes in pixel-based water balance in mm year–1 between the baseline (Supplementary Fig. S2c) and the scenarios.
Multi-Dimensional Scenario Assessment
We assessed spatial patterns of synergies and trade-offs between carbon stock, biodiversity and water yield changes in the two scenarios. We focused on LULCC-subjected areas, though we acknowledge that impacts could also be reflected outside these areas, particularly for water. Changes in the three dimensions compared to the baseline were standardized based on the scenarios and baseline statistical distributions of each dimension and merged into a composite red–green–blue (RGB) plot. We defined as increasing impacts between the scenarios and the baseline the decline of carbon stock, of BRRI index and either positive or negative changes in water yield diverging from 0. Here, we report and discuss trade-offs across scenarios by comparing high to low impacts on the three dimensions.
Results
In the BAU scenario, cultivated land is expected to expand by 5.4 Mha (0.36 Mha year–1) by 2025 (Fig. S1b). In addition, shifting cultivation is expected to expand over 3.5 Mha (0.23 Mha year–1) and degradation over 3.4 Mha (0.22 Mha year–1) by 2025. In the BAU scenario, 11% of LULCCs occur within protected areas, mainly in state-managed forest reserves. In the GE scenario (Supplementary Fig. S1c), cultivation expansion is reduced to 4.5 Mha (0.3 Mha year–1) and degradation occurs over 3.6 Mha (0.23 Mha year–1).
Carbon Stock
In the BAU scenario, the envisaged land-cover changes are estimated to result in c. 296 million tonnes of carbon (MtC) national stock loss by 2025 compared to 2010. The countrywide estimated carbon stock loss in the GE scenario is c. 133 MtC by 2025 (Fig. 1). In the GE scenario, 37 MtC of avoided emissions within protected areas account for 23% of the emissions difference compared to the BAU scenarios. Countrywide, the carbon stock changes mostly occur within open woodland in both scenarios, ranging between 58% (GE) and 65% (BAU) of the total change (Table 1). Under the GE scenario, following forest protection and sustainable management enforcement, LULCCs are partially displaced to habitats with lower management safeguards, such as bushland, grassland and mangrove forests.
Changes in total carbon stock (carbon tonnes per hectare, t C ha–1) in the business as usual (BAU) and green economy (GE) scenarios across Tanzania by 2025.
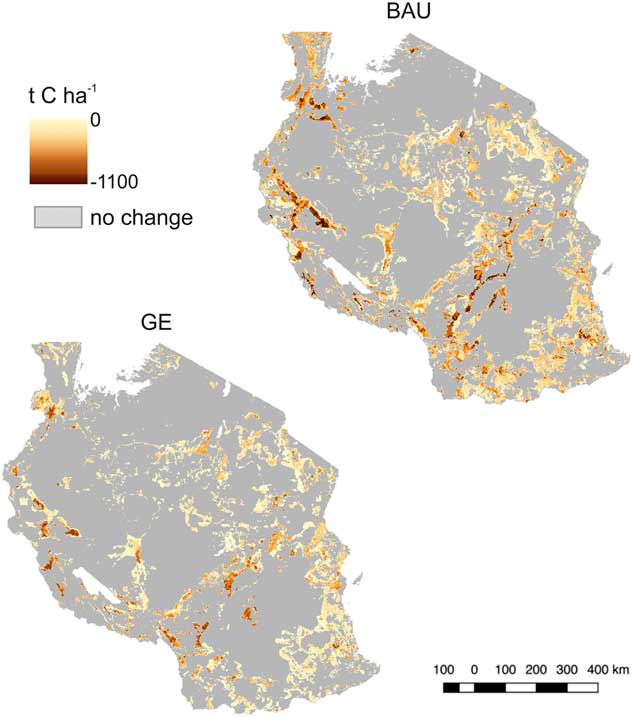
Share of carbon (C) stock losses (million tonnes, Mt, and percentage of the total land-cover class C stock, %) by different land-cover classes in the business as usual (BAU) and green economy (GE) scenarios. Classes are grouped according to the national definition of forests, other wooded land and other land (URT 2016)
Biodiversity
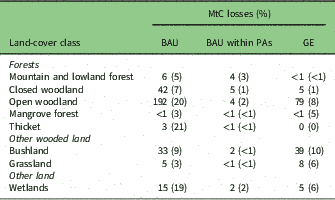
In the BAU scenario, 326 LULCC-sensitive species are impacted by habitat conversion; this includes 100 Tanzania-endemic and 120 threatened species. In the BAU scenario, the ESH reduction averages 20% for the endemic species and 6.5% for the 37 non-endemic threatened species. Under BAU, six species (Arthroleptis kutogundua, Afrixalus morerei, Churamiti maridadi, Galagoides rondoensis, Nectophrynoides laticeps and Nectophrynoides paulae) will lose 50% or more of their ESH. In the GE scenario, 317 LULCC-sensitive species will be impacted by LULCCs. The mean ESH reduction decreases to 4% for the 91 impacted endemic species and to less than 1% for the 36 non-endemic threatened species. The BRRI is highly variable across Tanzania, with the highest values mainly concentrated within the Eastern Arc Mountains (EAM) biodiversity hotspot (Supplementary Fig. S2b; Meng et al. Reference Meng, Carr, Beraducci, Bowles, Branch, Capitani, Chenga, Cox, Howell, Malonza, Marchant, Mbilinyi, Mukama, Msuya, Platts, Safari, Spawls, Shennan-Farpon, Wagner and Burgess2016). In both scenarios (Fig. 2), the highest potential impact in high-BRRI areas occurs in mountain forest patches. Compared to the GE scenario, in the BAU scenario, BRRI losses were locally higher, due to larger habitat losses of LULCC-sensitive species, but the BRRI gains were slightly wider, due to generalist species expansion in habitats with reduced canopies compared to the baseline. In the GE scenario, BRRI losses extended into species-rich regions not exposed to LULCCs in the BAU scenario.
Changes in the biodiversity richness and rarity index (BRRI) for terrestrial vertebrates in the business as usual (BAU) and green economy (GE) scenarios across Tanzania by 2025. Negative and positive changes relate to prevalent losses and gains of species-suitable habitats, respectively.
Water Yield
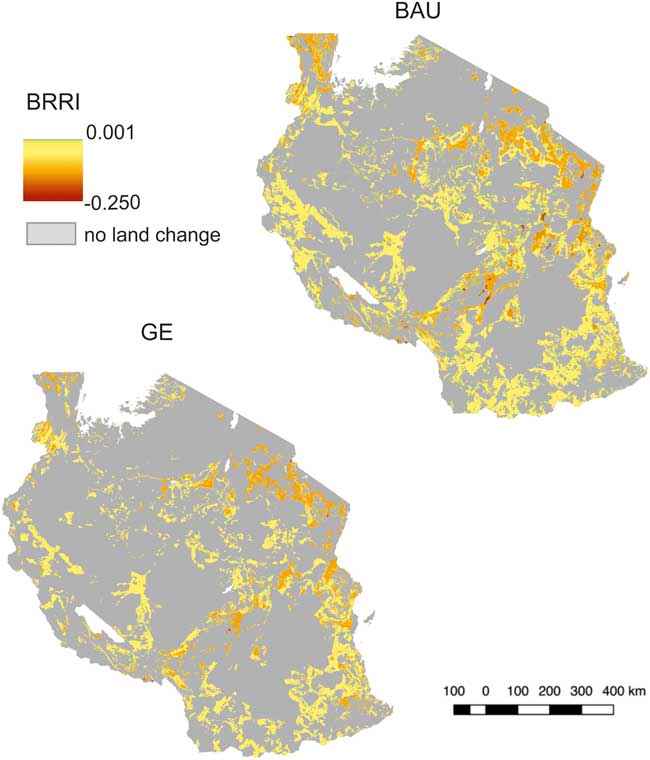
Changes in water yields, expressed as changes in water balance, are greater under the BAU scenario than the GE scenario, with a mean increase in water balance of 3.9 mm year–1 (+2%) versus 1.9 mm year–1 (+1%) across the BAU and GE scenarios, respectively (Fig. 3). Under the BAU scenario, nearly 10% of the country sees a change in water balance of more than 50%, while under the GE scenario, this is 6.2%. In both scenarios, mountain and lowland forest and closed woodland face the most intensive changes in water balance (per hectare), but woodland and wetlands contribute the largest observed absolute changes at the national scale because they cover a much bigger area than forests. Increases in water yield are generally the result of land degradation, reducing the amount of water use by vegetation and thus increasing available water for runoff, more closely following the rainfall pattern. In addition to water use by vegetation, trees can also play an important role in ‘capturing’ occult precipitation within cloud forests (Bruijnzeel et al. Reference Bruijnzeel, Mulligan and Scatena2011) and favouring precipitation infiltration within miombo (Kashaigili & Majaliwa Reference Kashaigili and Majaliwa2013). In the baseline, this contributes up to 17% of the water balance in montane forested areas of the Eastern Arc, the northern volcanoes and in the west near Lake Tanganyika. Forest degradation in those areas therefore is more likely to result in a reduction in available water.
Changes in water yield per year (mm year–1) in the business as usual (BAU) and green economy (GE) scenarios across Tanzania by 2025.
Multi-Dimensional Scenario Assessment
The simultaneous assessments of the impacts of LULCCs on carbon, biodiversity and water yield give a complex pattern for both scenarios. Few land-use patches show matching degrees of impact (e.g., either low or high impact in every variable), while in most areas, LULCCs generate different combinations of impact intensity (Fig. 4). In the BAU scenario, simultaneous high impacts in every dimension are mainly focused in protected forests and woodlands across EAM and south-western Tanzania (Fig. 4).
Red–green–blue (RGB) plot of combined impacts on carbon stocks (black to green), biodiversity (biodiversity richness and rarity index, black to red) and water yield (black to blue) under the business as usual (BAU) and green economy (GE) scenarios across Tanzania by 2025. The darker (lighter) the RGB combination colours, the lower (higher) the simultaneous impacts for all three dimensions. The three-dimensional legend is represented in two visions at the bottom left of the figure. The upper vision shows, for each cube face, the colour combinations of the three dimensions when one is at its maximum value and the other two are varying. The lower vision shows, for each cube face, the colour combination of the three dimensions when one is at its lowest value and the other two are varying.
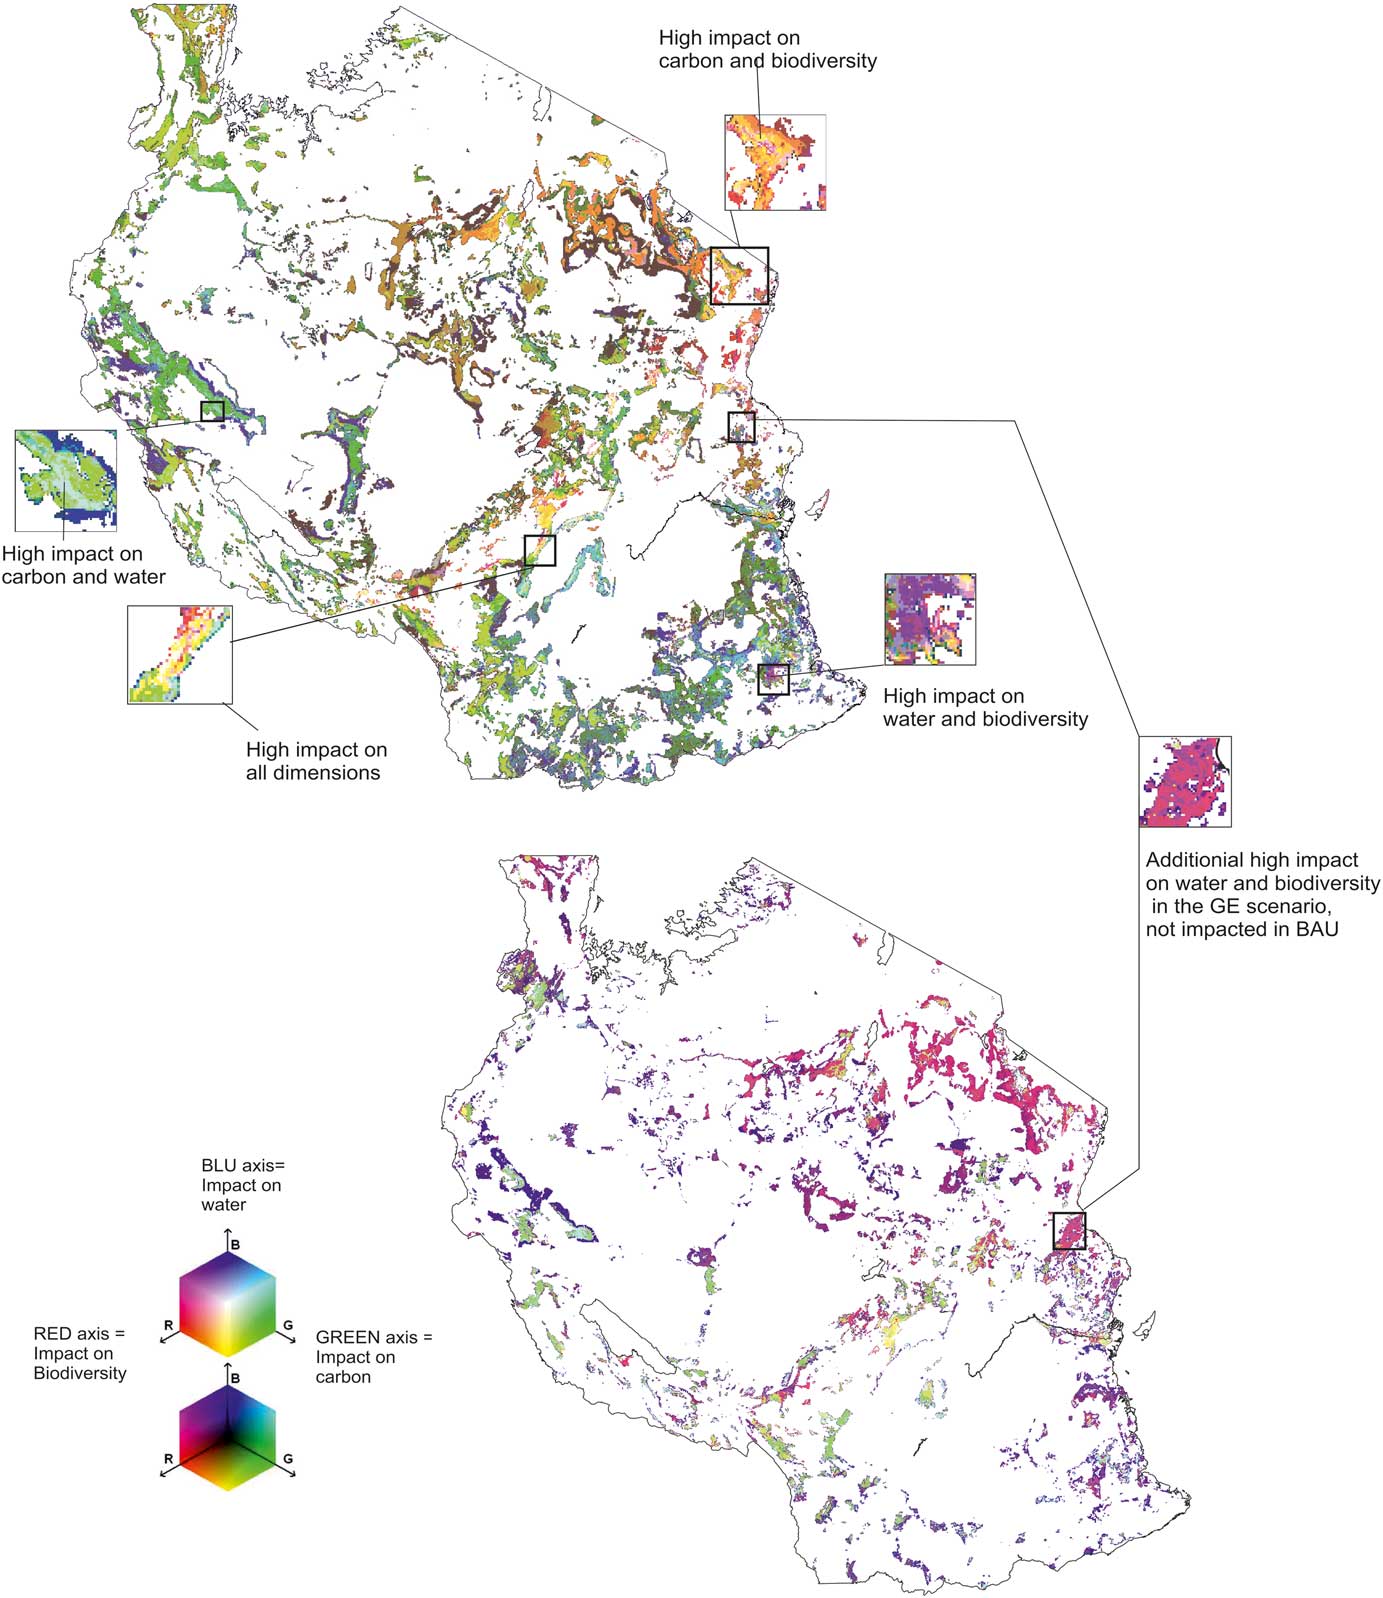
In the GE scenario, 40% of LULCCs are avoided, and simultaneous high impacts on carbon, biodiversity and water yield decrease. Increased impact on carbon, biodiversity and water yield is more frequent outside of managed areas. In the GE scenario, c. 19% of LULCCs occur in areas different from those in the BAU scenario (potential displacement). In about a third of displaced LULCC areas, low impact on carbon is associated with high impact on either biodiversity or water yield.
Discussion
Studies that assess potential future trade-offs and interactions between carbon and non-carbon benefits of natural habitat conservation are rare for East Africa (e.g., van Soesbergen et al. Reference van Soesbergen, Arnell, Sassen, Stuch, Schaldach, Göpel, Vervoort, Mason-D’Croz, Islam and Palazzo2017). Synergies and trade-offs between different ecosystem services vary over space as their provision and demands change (Locatelli et al. Reference Locatelli, Imbach and Wunder2013), with simultaneous assessment of carbon and non-carbon benefits at large scale being highly challenging (Busch & Grantham Reference Busch and Grantham2013).
Under land-change scenarios in the highly diverse landscape of Tanzania, spatial patterns of impacts on carbon storage, biodiversity and water yield are not homogeneous. Consistent patterns are identifiable to some extent in relation to the different habitats and forest management regimes. In montane and lowland forests, LULCC-driven impacts are usually consistent and result in high carbon stock loss, biodiversity loss and water yield change. This increased water availability could benefit farmers locally, but could cause severe impacts downstream (e.g., Enfors & Gordon Reference Enfors and Gordon2007, Kashaigili & Majaliwa Reference Kashaigili and Majaliwa2013). In the species-rich dry woodlands of north-eastern Tanzania, LULCC impacts are higher on biodiversity than on carbon stock. In addition, cultivated land expansion results in relatively low rates of carbon stock loss per unit area, but this is locally associated with accumulated water deficit and increased irrigation demand. Site-specific trade-offs between beneficial carbon and non-carbon impacts require joined-up action by decision-makers, such as management interventions that link water provision with carbon storage.
Lessons for REDD+ Implementation
The Tanzania National REDD+ Strategy (VPO 2013b) identifies three broad categories of REDD+ implementation actions: improved management and restoration of protection and production forest reserves; community-based forest management (including non-reserved areas); and plantation forestry. Our findings suggest that strictly protected forests conserve carbon, preserve biodiversity and maintain the water catchment, albeit over relatively small areas. Sustainable management of productive forests can support carbon emission reductions in the GE scenario, but with trade-offs for biodiversity and water yield. Maximizing the potential benefits depends on the simultaneous enforcement of management and adequate resolution of conflicts, while ensuring current and future human communities’ needs are met (Persha & Meshack Reference Persha and Meshack2015). Critical to REDD+ implementation is the risk of avoiding deforestation leakage (Pfeifer et al. Reference Pfeifer, Burgess, Swetnam, Platts, Willcock and Marchant2012). In the GE scenario, LULCC impacts on biodiversity shift from rare forest species to species-rich communities in semi-open habitats that have lower carbon values and hence are of slightly lower priority in the Tanzania REDD+ framework. This suggests that ambitious REDD+ targets are needed for carbon emission and habitat conversion reductions in order to meet biodiversity conservation objectives in Tanzania.
Protected areas and community-based forest management areas alone are not sufficient to achieve the emission reductions required to fulfil the Tanzanian national commitment (URT 2015), albeit ensuring food, water and energy security to the increasing population. At the national scale in both scenarios, most carbon stock changes, as well as water yield and biodiversity disturbances, are anticipated in general land, being particularly focused along the commercial development corridors (e.g., Southern Agricultural Growth Corridor of Tanzania (SAGCOT) and Tanga). Addressing land and natural resource degradation outside managed areas requires better integration of a landscape-centred REDD+ (Turnhout et al. Reference Turnhout, Gupta, Weatherley-Singh, Vijge, de Koning, Visseren-Hamakers, Herold and Lederer2016), economic development (e.g., poverty reduction, food security and education) and conservation policies based on broader consensus and engagement by a wide range of actors that have political will and support from government ministries, non-governmental organizations and community-based organizations.
The FREL assessment for Tanzania estimated c. 58 MtCO2 year–1 to be emitted due to deforestation (URT 2016), comparable to c. 61 MtCO2 year–1 estimated here in the BAU scenario using the same deforestation definition, though with a different methodology. Our demand-driven LULCC scenarios provide a useful estimate of the magnitude of the deforestation fraction not detectable from satellite images (Hojas-Gascon et al. Reference Hojas-Gascon, Cerutti, Eva, Nasi and Martius2015). The multi-dimensional quantitative assessment can contribute to ongoing national and international debates surrounding expectations for carbon and co-benefits values; these can be used to chart the triple-wins or compounded losses of potential futures. The scenarios, and importantly the wider information behind these, can be used to support current negotiations of desirable or undesirable impacts across diverse beneficiaries of forest services in relation to REDD+, the Intergovernmental Platform on Biodiversity and Ecosystem Services and the Sustainable Development Goals.
Caveats and Limitations
As with all results from scenario analyses, our findings have inherent uncertainty. The presented results are not predictions, but rather depict potential impacts within the range of our scenario trajectories. To maximize relevance and legitimacy, to represent multiple scale perspectives and the interaction of the key components of water, carbon and biodiversity and to overcome consistent challenges of time series data quality and scarcity for Tanzania, we put great efforts into model and dataset customization. However, the uncertainties generated by this approach should be considered when drawing conclusions from the presented results.
Dataset resampling has affected the accuracy of spatial pattern impacts and of the multi-dimensional assessment at the pixel level. The choice of indices also influenced the presented findings. For example, the adopted biodiversity index has the advantage of being sensitive to LULCCs. However, it does not consider other essential aspects of biodiversity (see Supplementary Material) or interactions with other sources of disturbance (e.g., climate change disturbance; Foden et al. Reference Foden, Butchart, Stuart, Vié, Akçakaya, Angulo, DeVantier, Gutsche, Turak, Cao, Donner, Katariya, Bernard, Holland, Hughes, O’Hanlon, Garnett, Şekercioğlu, Mace and Hoffmann2013). Prioritization of biodiversity and ecosystem service conservation should account for internal feedbacks characterized by connectivity and complementarity (Kukkala & Moilanen Reference Kukkala and Moilanen2017), which are not captured by pixel-based analysis.
The selected thematic and temporal scopes also influenced our findings. Considering additional dimensions (e.g., social) and different impacts thresholds (e.g., negotiated amongst stakeholders) could change the outcomes of multiple co-benefits assessment. The limited temporal horizons of the scenarios was set to comply with tangible objectives such as the Tanzania Development Vision 2025 (URT 2005) and the REDD+ roadmap, but this could limit the scope for green development assessment. With respect to the relevance for decision-making, we successfully engaged with a broad range of stakeholders from across the country to co-produce scenarios and build local assessment capacity and consensus around the scenarios’ outputs. Such approaches need integrating into institutional frameworks to effectively influence policy formulation and implementation in order to mainstream biodiversity conservation and ecosystem service provision in future land-use planning.
Supplementary Material
For supplementary material accompanying this paper, visit www.cambridge.org/core/journals/environmental-conservation
Supplementary material can be found online at http://dx.doi.org/10.1017/S0376892918000255
Acknowledgements
We thank the 180 people who attended the regional workshops for scenario development across Tanzania and 60 nationally focused decision-makers and delegates of the NGO community in Tanzania who provided validation and feedback at the national synthesis workshop. We thank staff within the WWF Tanzania office for logistics and administrative support. We acknowledge the financial support of the Norwegian Government International Climate and Forest Initiative through their Royal Embassy and of the Ministry for Foreign Affairs of Finland, and the financial and scientific support of the University of York and the UNEP-World Conservation Monitoring Centre.
Financial Support
This work was funded by the Norwegian Government International Climate and Forest Initiative through their Royal Embassy, as well as the Ministry for Foreign Affairs of Finland, the University of York and the UNEP-WCMC.
Conflict of Interest
None.
Ethical Standards
None.


