

1. Introduction
Two major developments following Iran’s 1979 Islamic Revolution shaped the country’s economic trajectory: the rapid expansion of basic infrastructure – roads, electricity, and clean water – to rural areas, and a sharp decline in fertility. These transformations profoundly impacted the living standards of ordinary Iranians. Investment in infrastructure contributed to a reduction in overall poverty levels (Salehi-Isfahani Reference Salehi-Isfahani2009a), while the decline in fertility enabled families to shift their focus from childbearing to human capital investment. As a result, educational attainment – particularly for rural women – increased significantly, and the gender gap in education closed (Assaad et al. Reference Assaad, Hendy and Salehi-Isfahani2019).
It is tempting to interpret the simultaneous expansion of infrastructure and the subsequent fertility decline in rural Iran as causal evidence that infrastructure investment reduces fertility, a relationship generally supported by the empirical literature. However, in this paper, we challenge this interpretation using Iranian data. We present evidence from a large sample of 45,000 villages in Iran, which allows us to instrument for electricity availability. While our Ordinary Least Squares (OLS) estimates align with the general negative relationship found in the literature, accounting for the endogenous nature of electricity access using an instrumental variable (IV) – specifically, the deviation of a village’s elevation from its district mean – to isolate variation in electricity access unrelated to fertility itself reveals a positive association between electrification and fertility. Our instrument is similar to those used in the electrification literature (e.g., Dinkelman (Reference Dinkelman2011) and Grogan (Reference Grogan2016)). It satisfies the relevance condition because it is correlated with the cost of extending electricity to the village and the exogeneity condition because it does not directly affect fertility.
At first glance, the finding of a seemingly counterintuitive positive effect may appear inconsistent with economic theory. However, theory does not predict a universal direction of impact (Vidart Reference Vidart2024). Electrification can influence fertility through competing mechanisms. First, rising incomes and the availability of labor-saving household appliances may increase demand for children (Greenwood et al. Reference Greenwood, Seshadri and Vandenbroucke2005). Second, expanded market opportunities for women generally raise the opportunity cost of childbearing, causing fertility to decline. Third, improvements in child survival and reduced education costs due to electrification could lead parents to invest more in child quality rather than quantity. Whereas the latter two lower fertility, as mainstream theory suggests, the first raises it.
Post-revolutionary Iran offers a particularly useful context for exploring the fertility effects of electrification, due to historically low – and persistently limited – female labor force participation (LFP) rates in both rural and urban areas. Rural women, in particular, rarely engage in market work outside the home, implying that a key mechanism through which electrification typically reduces fertility – by increasing the opportunity cost of women’s time – is largely absent. Following the revolution, while rural economic development was prioritized, strict gender segregation policies in public spaces and workplaces further discouraged female employment (Karshenas and Moghadam Reference Karshenas and Moghadam2024; Shahrokni Reference Shahrokni2019). According to the World Bank, women’s LFP in Iran is only 14%, far below that of men (around 90%). Our estimates using a 2% sample of the 1996 census reveal even lower rates: 10.0% in urban areas and 11.5% in rural areas, with some provinces exhibiting female participation rates as low as 5%. We explore the implications of low female LFP for the impact of electrification in section 7.
Since theory is ambiguous on the relationship between electrification and fertility, it becomes an empirical question, one that existing literature explores extensively but inconclusively. While a large body of literature examines this relationship, most studies rely on simple correlations. Using OLS without addressing the endogeneity of electricity access, several studies report a negative relationship: Harbison and Robinson (Reference Harbison and Robinson1985) in six countries, Cornwell and Robinson (Reference Cornwell and Robinson1988) in southern U.S. states, and Peters and Vance (Reference Peters and Vance2011) in rural Côte d’Ivoire. However, some studies find the opposite, sometimes even within the same country. Cornwell and Robinson (Reference Cornwell and Robinson1988) document a positive association in northern U.S. states, as do Peters and Vance (Reference Peters and Vance2011) in urban Côte d’Ivoire. In an influential study, Greenwood et al. (Reference Greenwood, Seshadri and Vandenbroucke2005) use structural estimation to argue that electrification contributed to the post-World War II U.S. baby boom. However, Bailey and Collins (Reference Bailey and Collins2011) challenge this conclusion, arguing that the diffusion of household appliances and the associated productivity gains occurred decades before the baby boom. A small number of studies addressing electricity’s endogeneity all report negative effects – Grogan (Reference Grogan2016) in Colombia, Fujii and Shonchoy (Reference Fujii and Shonchoy2020) in Bangladesh, and Vidart (Reference Vidart2024) in the U.S. – primarily contexts where expanded electricity also expanded female labor market opportunities. A cross-country panel study by Belmin et al. (Reference Belmin, Hoffmann, Pichler and Weisz2022) reaches a similar conclusion. To our knowledge, our paper is the first to document a positive causal relationship using instrumental variables, highlighting the critical importance of socioeconomic and institutional contexts.
Importantly, finding a positive relationship does not imply that electrification did not contribute to overall fertility decline – even in rural Iran. A key driver of rural fertility decline – the expansion of rural health clinics (Abbasi-Shavazi et al. Reference Abbasi-Shavazi, McDonald and Hosseini-Chavoshi2009; Salehi-Isfahani et al. Reference Salehi-Isfahani, Abbasi-Shavazi and Hosseini-Chavoshi2010) – was itself dependent on electricity. Because of this dependence, our IV estimates capture a net effect: the fertility-increasing channel of electrification, partly offset by the fertility-reducing channel through clinics, as noted in Section 7.2. As with all major social changes, multiple factors contributed to fertility decline in Iran. In the case of Iran, beyond the provision of infrastructure and family planning services, the revolution altered incentives for childrearing in other ways. In particular, the government’s pro-poor outlook, emphasizing the poor’s welfare raised their expectations of returns to investment in child education, encouraging lower fertility.
To minimize bias in our estimates, we control for other potential influences on fertility to the extent that our data permit. Electrification can increase access to education, so we control for the years of exposure to primary and middle schools. Notably, most villages in our sample already had primary schools before receiving electricity, implying that electricity’s effect through primary school access is not a major concern. We also control other key factors that can influence fertility such as village size, presence of TV and mosque, and whether the village is in the plains or a mountainous area. We also examine the impact of other correlated infrastructure, such as clean water and asphalt roads, and confirm that the positive impact of electrification remains robust even after controlling for these factors.
Our exclusive focus on electrification in this paper is motivated by two considerations. First, the timing of electricity extension to villages is more easily pinpointed than that of roads or clean water infrastructure. Second, among all types of infrastructure, electrification is most closely related to women’s opportunity cost of time, and therefore fertility.
Since electricity in Iran is publicly produced and provided, its placement in villages is likely not random. The government may have prioritized locations with lower placement costs, favoring areas that are less mountainous and easier to access. Ignoring elevation as a determinant of electricity placement would bias the estimated effect of years of exposure to electricity on fertility. This omitted-variable bias would likely be downward, as electrification was prioritized in more accessible, lower-fertility villages, potentially masking a true positive effect. Indeed, consistent with other studies cited above, our OLS estimates show a negative relationship. It is only when we instrument for placement of electricity that we find a positive impact.
The plan of the paper is as follows. The next section describes the Iranian context and how the electricity and fertility transitions took place. Section 3 describes the village sample and the instrument we employ. Section 4 discusses our methodology, and Section 5 presents and discusses the results. Section 6 discusses the importance of female LFP as the mechanism through which electrification affects fertility, and Section 7 checks for the robustness of the results in view of potential sources of bias, such as variation in child mortality, migration, and other infrastructure that affect child-woman ratios (CWRs). Section 8 concludes.
2. Iranian context
In this section, we describe the two major developments that underpin our study – rural electrification and fertility decline – both of which unfolded after the Islamic Revolution. As a popular revolution, it was natural that it would be followed by the rapid extension of infrastructure and basic services to rural and other disadvantaged areas (Lob Reference Lob2020; Salehi-Isfahani Reference Salehi-Isfahani2009b). Within a decade, most villages were connected to the national electricity grid and gained access to clean water.
Yet, as a conservative revolution, fertility decline was not part of the original plan. In fact, as we discuss below, the new regime’s early rhetoric and policies were explicitly pro-natalist, and only shifted once the urgency of family planning became clear. This policy reversal, combined with the revolution’s pro-poor orientation and emphasis on education, contributed to a rapid decline in fertility.
2.1. Family planning and rural fertility
Arguably, fertility decline also had its roots in the revolution, but in an indirect way. In its early years, the revolutionary state sought to eliminate Western influences by dismantling the Shah’s family planning program, halting the distribution of contraceptives, and promoting large families. Within a decade, however, the contradiction between pro-natalist policies and the government’s simultaneous commitment to eliminating illiteracy and providing universal education resolved in favor of the latter. A new, rural-focused family planning program was launched in 1989, later earning global recognition for its innovation and setting what has been described as a world record for fertility decline (The Economist 2009).
Although this rapid decline is often attributed to the family planning program (Abbasi-Shavazi et al. Reference Abbasi-Shavazi, McDonald and Hosseini-Chavoshi2009), its direct contribution has been estimated at less than 20% of the decline (Salehi-Isfahani et al. Reference Salehi-Isfahani, Abbasi-Shavazi and Hosseini-Chavoshi2010). Clearly, other changes – including the expansion of infrastructure – also played an important role, but these influences have received little systematic attention. In particular, the effect of electrification, which preceded the family planning program, has not been rigorously examined. Our analysis does not diminish the importance of family planning; rather, it shows that the direct effect of electrification was to raise fertility. At the same time, as we discuss in Section 7.2, electrification also contributed indirectly to fertility decline by enabling the expansion of family planning centers.
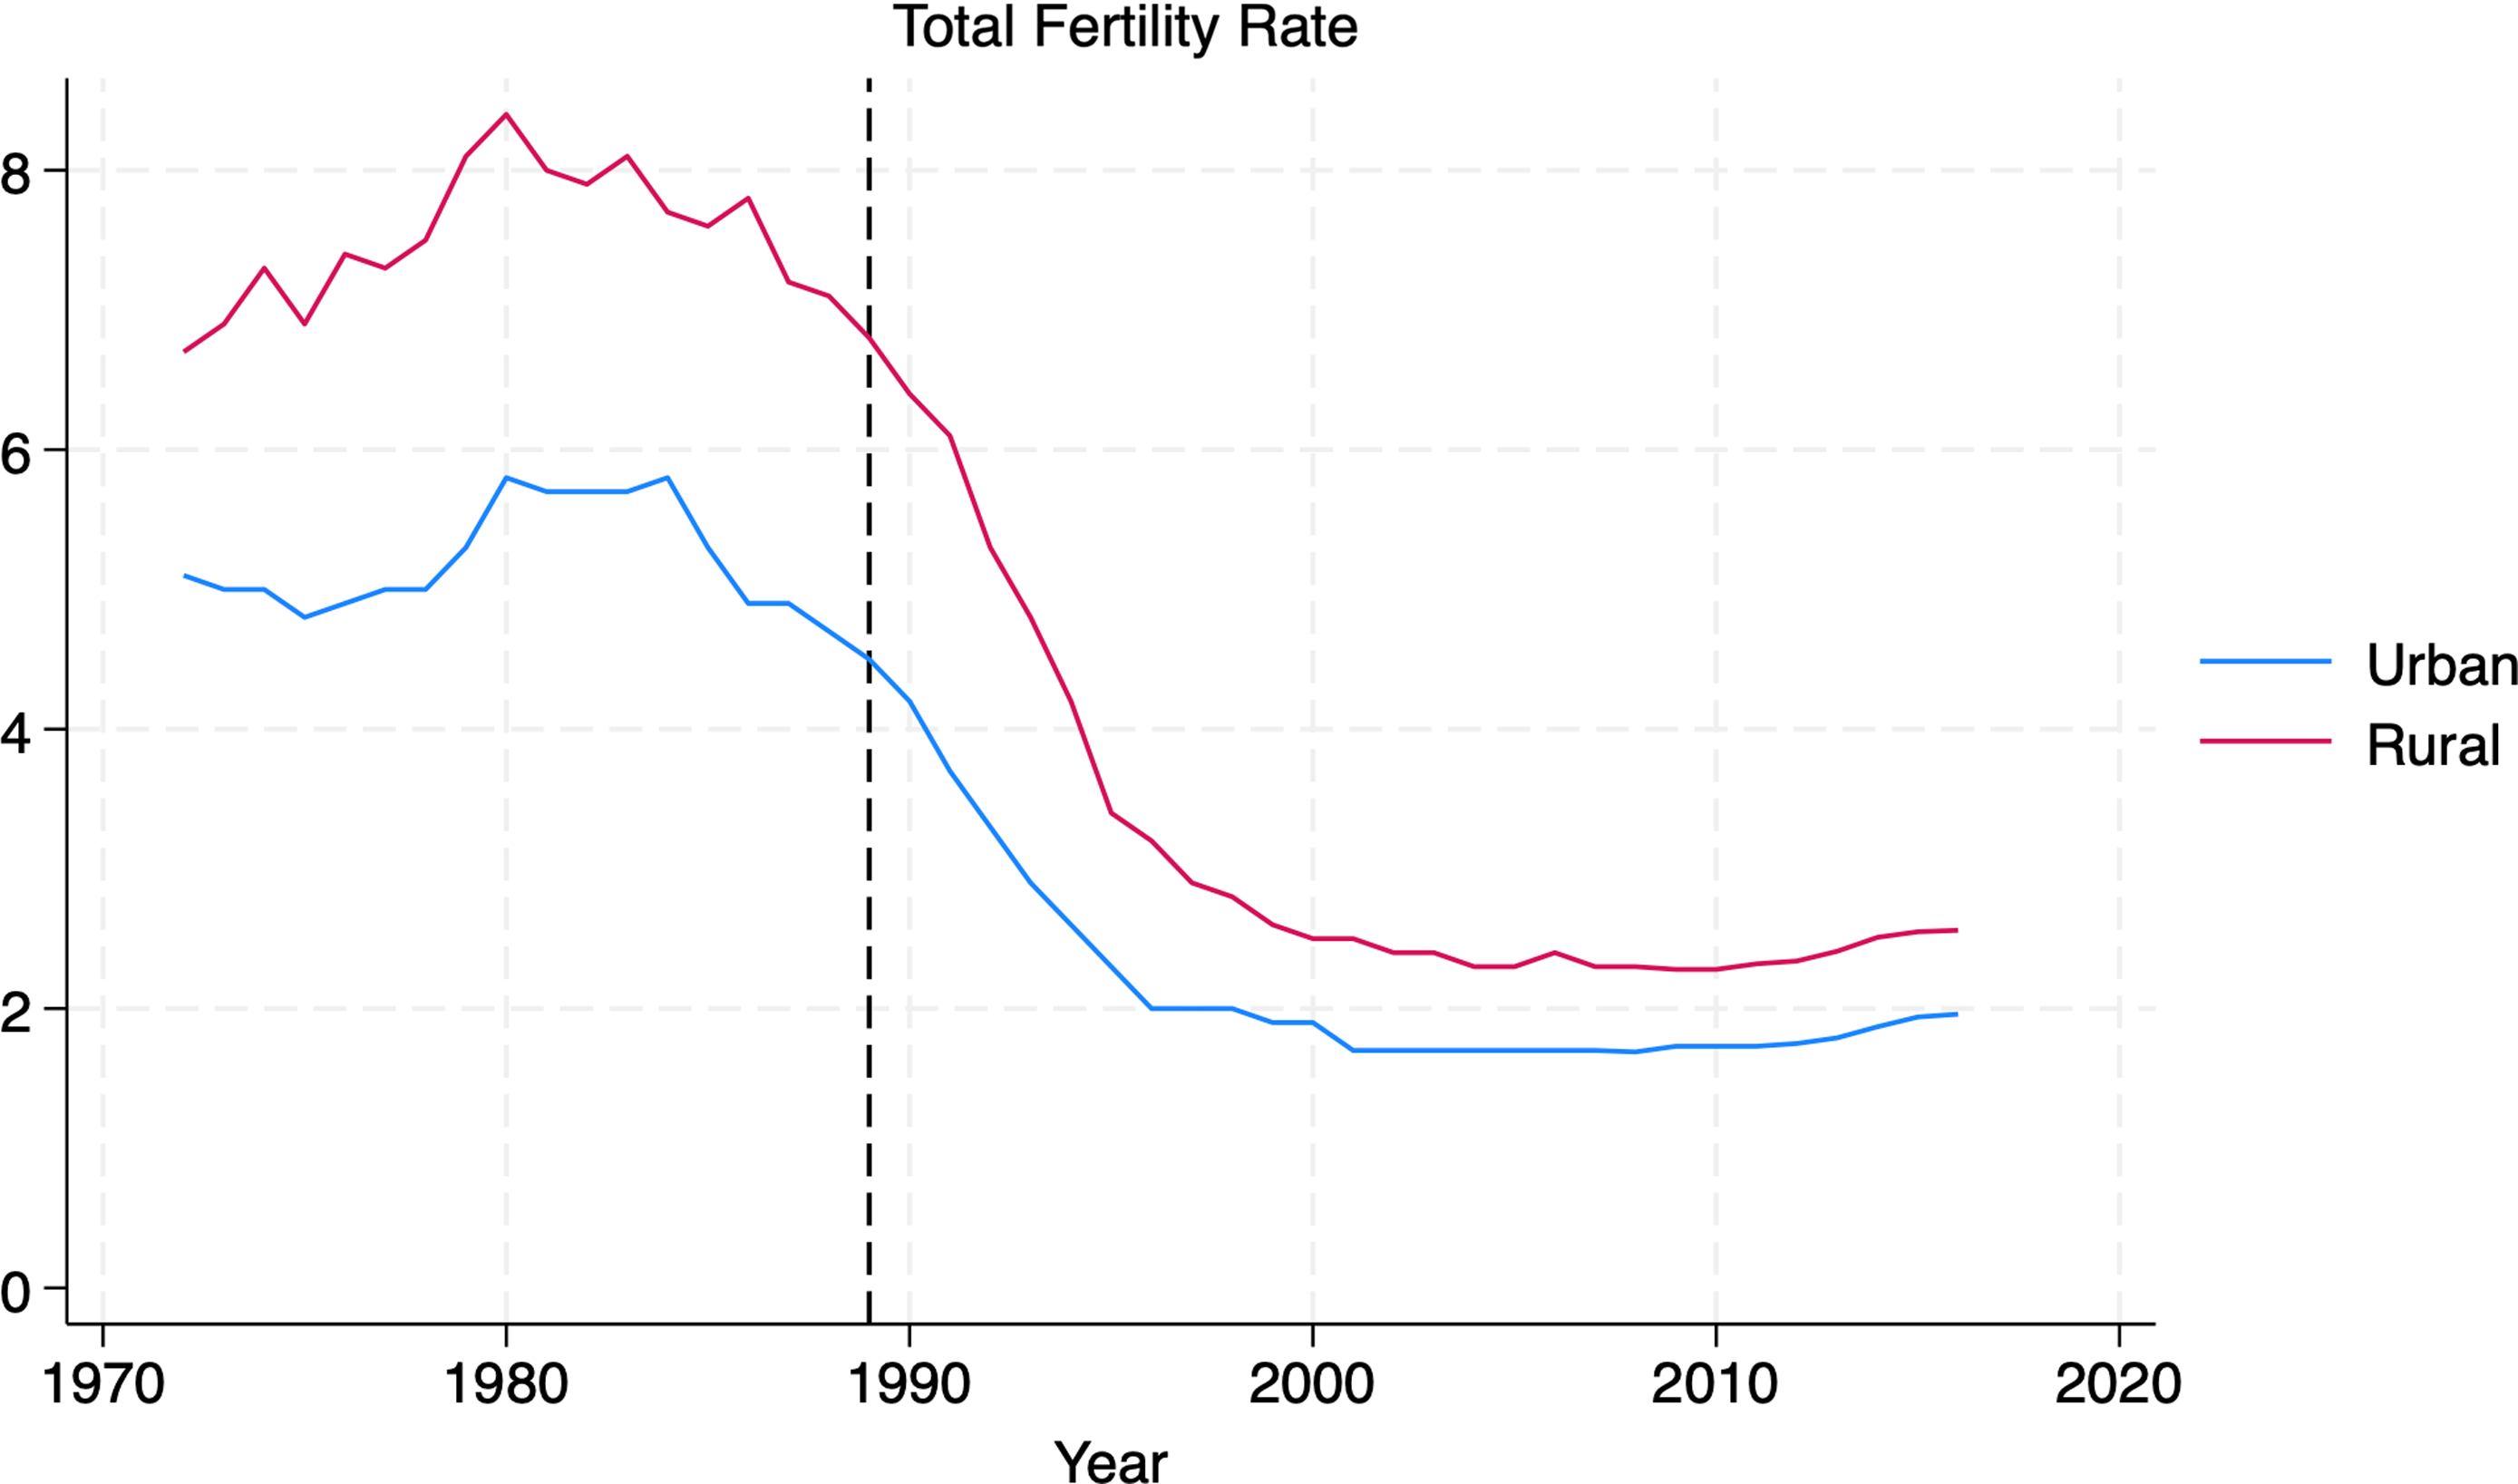
At the time of the revolution, rural fertility was at its peak – about eight births per woman. Urban fertility was also high, though consistently lower than rural fertility (Figure 1). Beyond these high levels, the most important feature of fertility in the early years of the revolution was the government’s explicitly pro-natalist orientation. The revolutionary state dismantled the Shah’s family planning program immediately after coming to power, dismissing it as a colonial legacy. This stance was further reinforced during the war with Iraq (1980–1988), when intense ideological mobilization and the loss of many young men strengthened the regime’s encouragement of large families.
Fertility decline in rural and urban areas.
Source: Abbasi-Shavazi M. J. (Reference Abbasi-Shavazi2020)

After the war ended, the government’s priorities shifted from sustaining the war effort to fulfilling its promise of improving living standards, particularly for the poor, whom it regarded as its social base. Results from the 1986 census revealed rapid population growth of 3.9%, and overcrowding in elementary schools threatened the regime’s objective of universal education. Enrollment in first-grade classes had risen by 40% – far outpacing the construction of new schools – forcing some schools to operate in three shifts per day (Salehi-Isfahani Reference Salehi-Isfahani, Besley and Zagha2005).
In a surprising but pragmatic move, the conservative fundamentalist regime reversed its pro-natalist stance and adopted family planning. The rural health network was commissioned with a new mandate: to reduce the birth rate (Abbasi-Shavazi et al. Reference Abbasi-Shavazi, McDonald and Hosseini-Chavoshi2009; Salehi-Isfahani et al. Reference Salehi-Isfahani, Abbasi-Shavazi and Hosseini-Chavoshi2010). The program achieved extraordinary success – acceptance of modern contraceptives among rural families eventually exceeded that of urban families – largely because the religious government enjoyed the trust of rural households. This trust was built on the clinics’ prior role in providing mother and child health care before promoting birth control. In this way, the program succeeded where the Shah’s had failed: it managed to reduce rural fertility (Aghajanian Reference Aghajanian1995). Importantly, however, the expansion and functioning of the rural health network depended on electrification, making electricity not only a direct influence on fertility but also an indirect contributor to fertility decline through family planning.
As part of this program, the government altered incentives for limiting family size by eliminating subsidies for children beyond the third. Yet whether fertility decline was driven by family planning, these new incentives, or other factors remains unclear. Salehi-Isfahani et al. (Reference Salehi-Isfahani, Abbasi-Shavazi and Hosseini-Chavoshi2010) estimate that rural clinics accounted for less than 20% of the overall decline. Economists are generally skeptical that governments can exert large influence on deeply ingrained behaviors such as childbearing. Instead, they emphasize the role of economic development and education in shaping fertility preferences (Schultz Reference Schultz1981; Pritchett Reference Pritchett1994; Miller Reference Miller2010; Miller and Babiarz Reference Miller and Babiarz2016). Iran’s own experience, as illustrated in Figure 1, supports this view: fertility decline in rural areas had already begun before the implementation of family planning.
2.2. Electrification
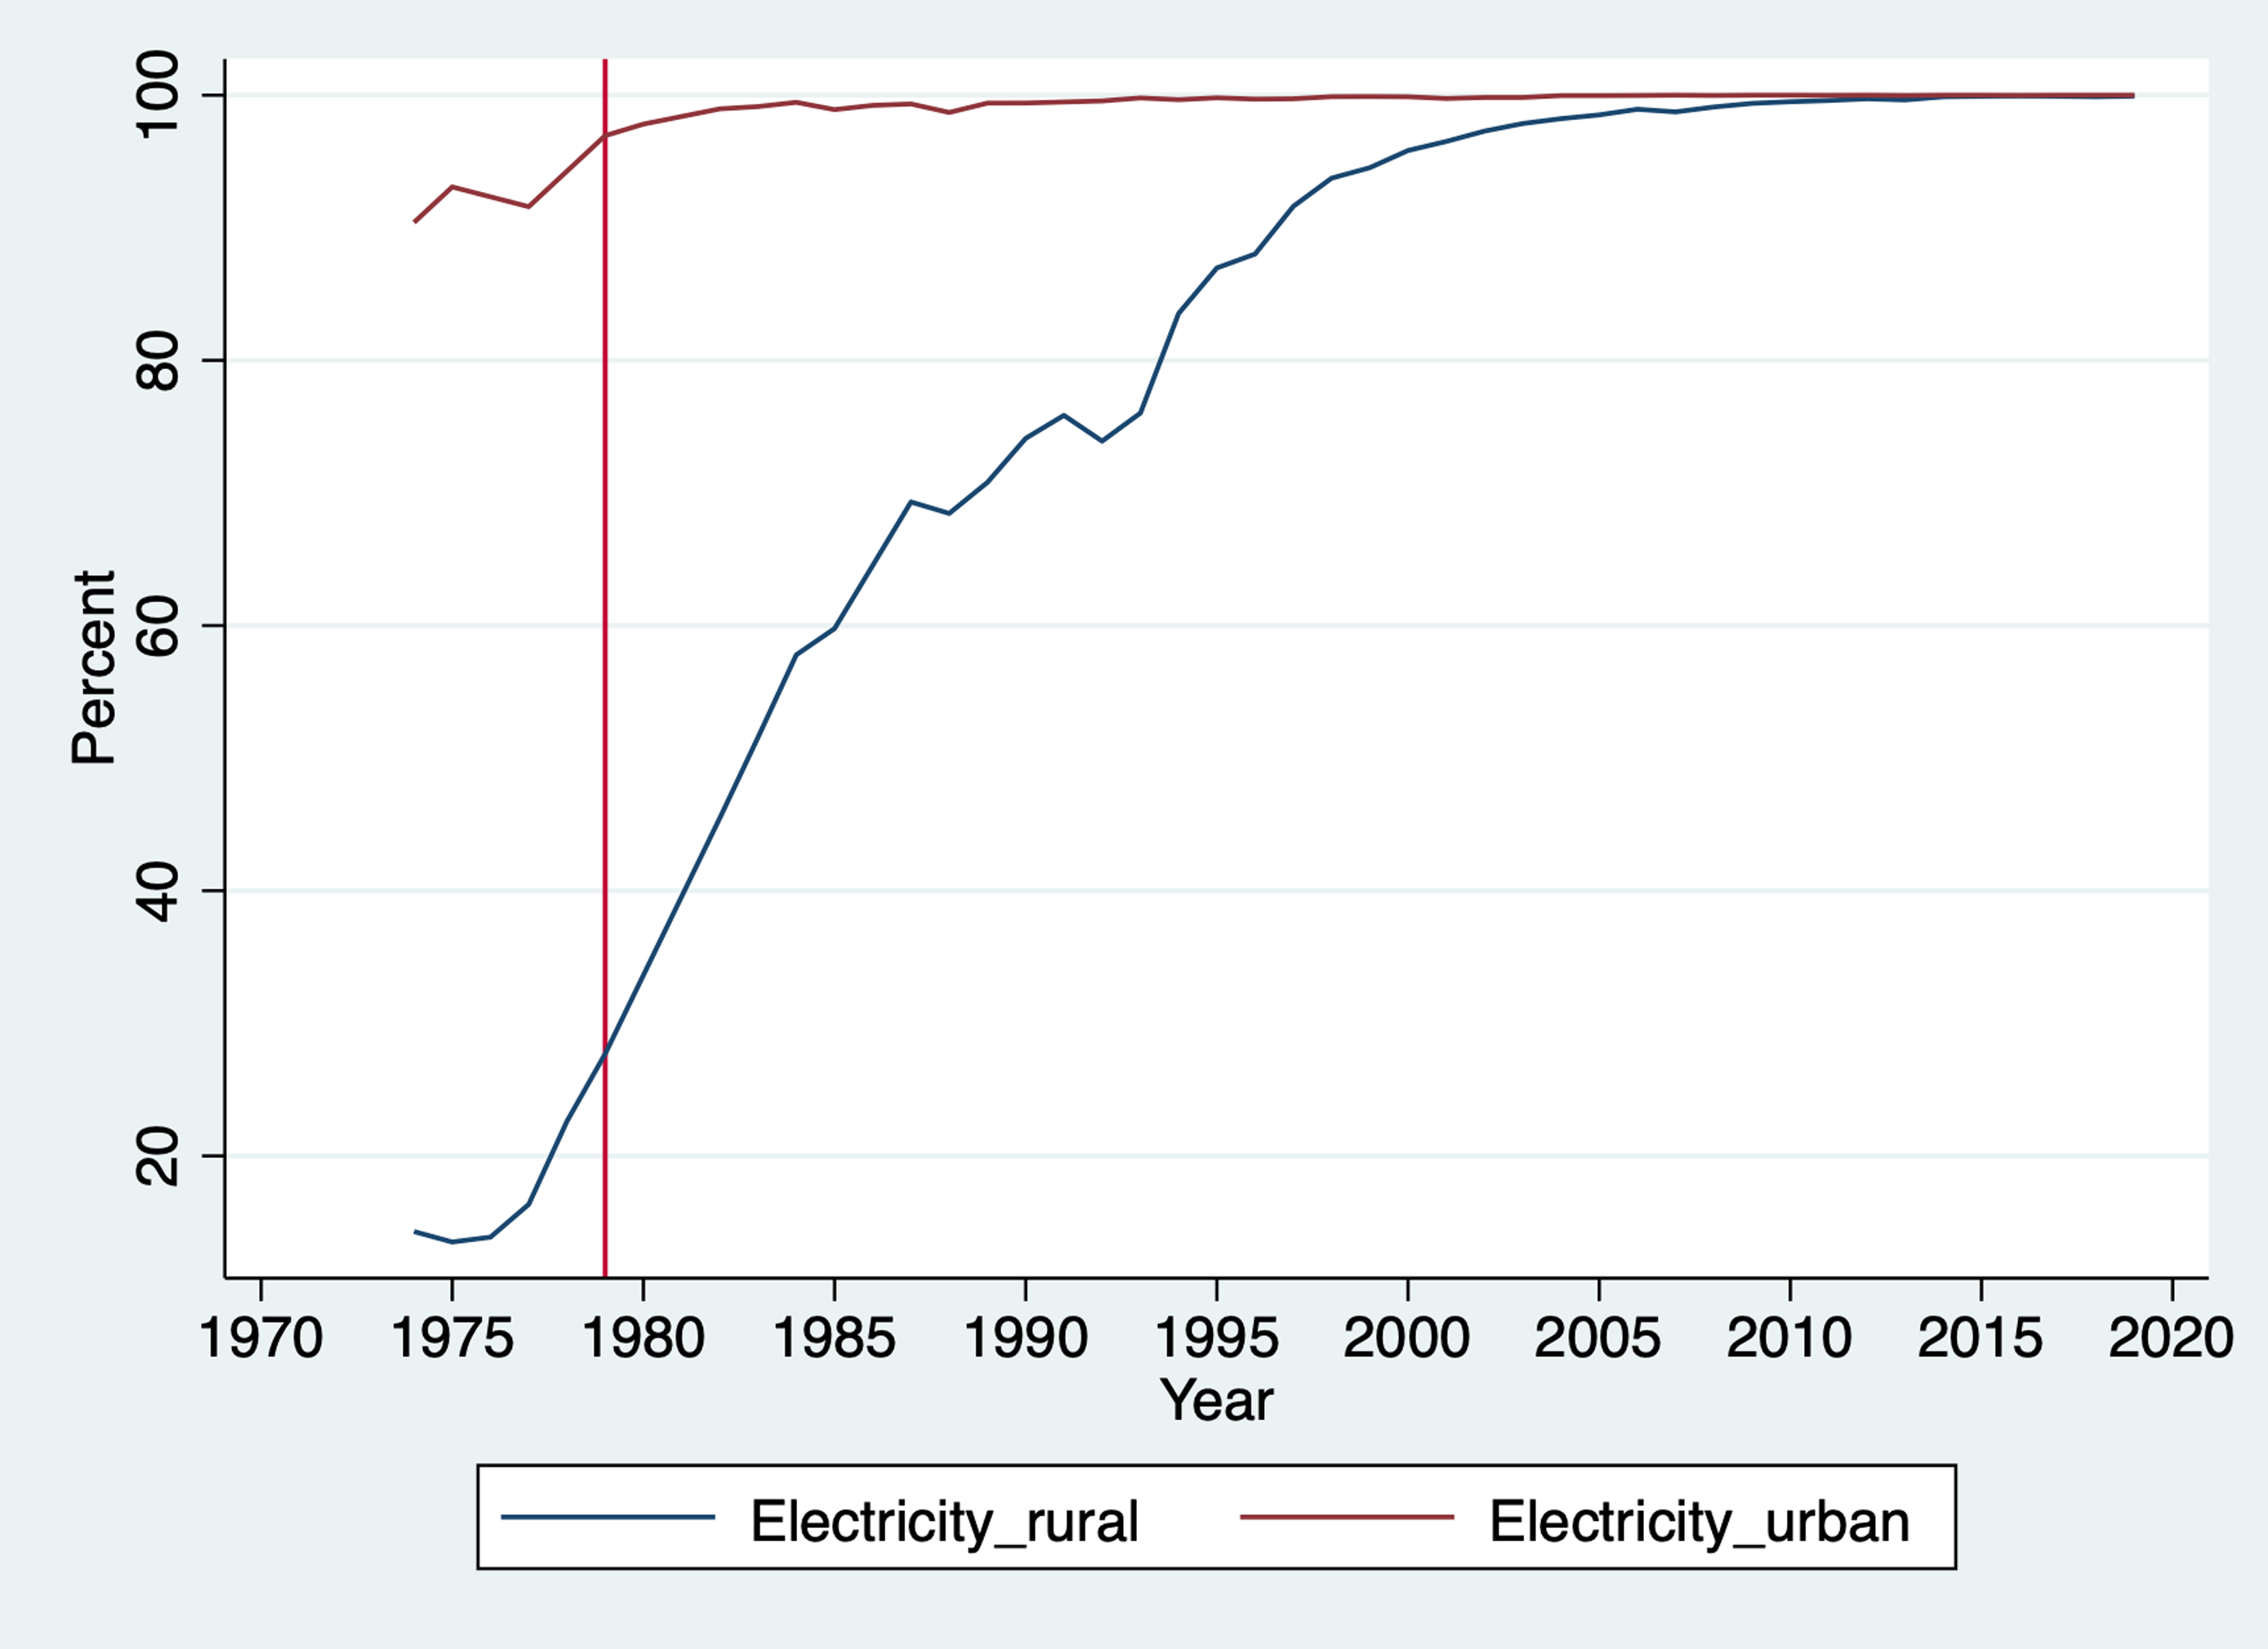
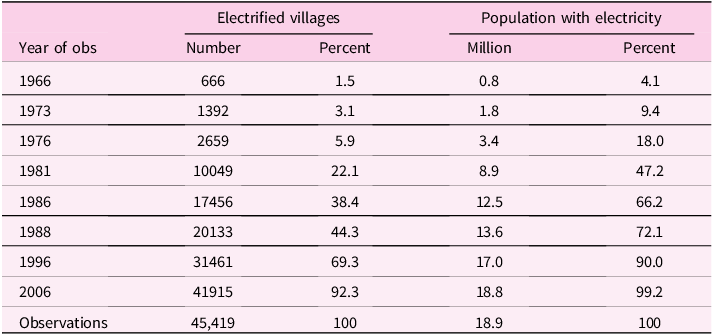
Replacing a western-oriented, urban-biased monarchy, for its first two decades the Islamic Revolution shifted investment to rural areas. The Reconstruction Crusade, which is now part of the Ministry of Agriculture, mobilized thousands of young volunteers nationwide to build roads and extend electricity and clean water to villages (Lob Reference Lob2018). Census data show that between 1966 and 1976, during a decade of record economic growth, the percentage of electrified villages increased from 1.5% to 5.9%, and the share of the population living in them from 4.1% to 18.0% (Table 1). These are modest increases in comparison with urban areas that had achieved full electrification by 1980 (Figure 2). Drawing on annual household surveys, Figure 2 shows the rapid expansion of electrification in rural areas, which closed the gap with urban areas by 2010. By 1981, the percentage of electrified villages and the population that lived in them (as of 2006) had increased to 22.1% and 47.2%, respectively. During the oil boom years (1973–1976), each year 422 villages were electrified, whereas during the Iraq War (1981–1986), this number jumped to 1,481 villages. By 2006, 92.3% of villages and 99.2% of the population living in them had access to electricity.
Rapid expansion of rural electrification after the revolution (percent of population with electricity).
Source: Household Expenditure and Income Surveys, Statistical Center of Iran, various years.

Distribution of villages in the full sample by year of electrification

Note: Villages in the full sample, observed in the censuses of 1986, 1996, and 2006. Village populations are in 2006.
Source: National Censuses of Population, Statistical Center of Iran.
3. Data
The unit of observation in this study is the village. Our data come from three consecutive population censuses – 1986, 1996, and 2006 – which provide basic information on all Iranian villages. We focus on these years because they span the period of rapid electrification and fertility decline at the center of our analysis.
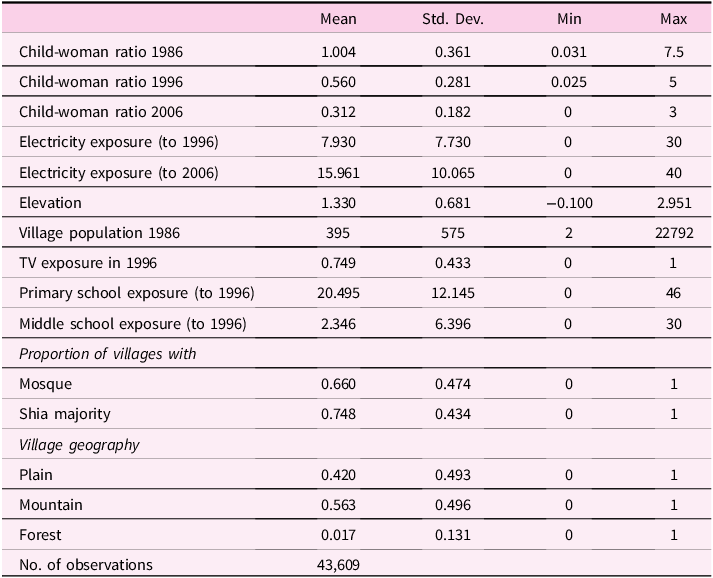
Each census enumerates roughly 100,000 villages, many of which are very small hamlets or temporary settlements. To construct a consistent panel, we restrict attention to the 43,609 villages that appear in all three censuses with a non-zero population. We refer to this set as the full sample, and its summary statistics are reported in Table 2.
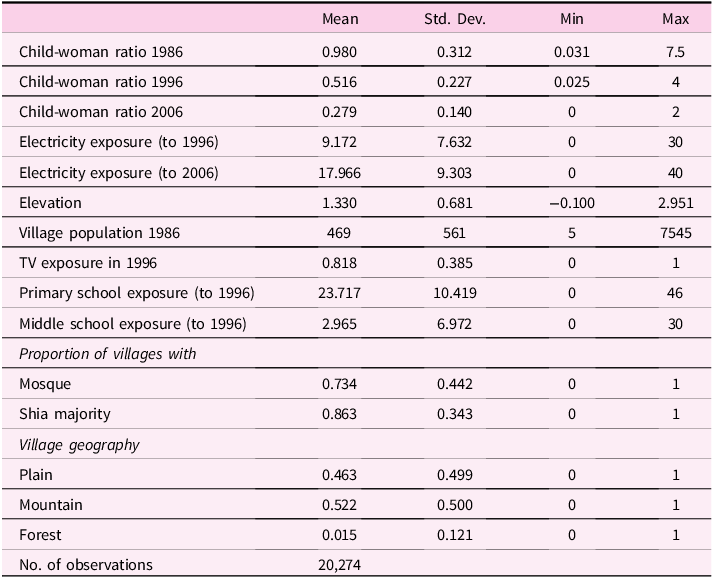
Summary statistics, full sample

Notes: The number of observations for the child-woman ratio in 2006 is 39,474 and for elevation is 20,274.
These censuses provide basic demographic information and community characteristics, including topography, availability of schools, access to basic services, and the presence of a mosque.Footnote 1 For our fertility measure, the CWR, the Statistical Center of Iran supplied village-level counts of children under age five and women aged 15-49 (see Salehi-Isfahani et al. (Reference Salehi-Isfahani, Abbasi-Shavazi and Hosseini-Chavoshi2010) for details).
In 1986, the average CWR was 1.0, roughly corresponding to a total fertility rate (TFR) of about seven births per woman. By 1996, the average CWR had dropped to 0.56, and by 2006 it had further declined to 0.31, implying a TFR just above replacement level. Some villages report CWR values outside the plausible range (e.g., the maximum CWR in Table 2 is 7.5, which implies a biologically impossible TFR). These outliers likely reflect unusual population structures; excluding them in sensitivity checks below does not affect our regression results.
A limitation of the CWR is its sensitivity to infant and child mortality. Electrification can raise the CWR if it reduces child mortality and allows more children to survive to age five, which enters the numerator of the ratio. Because the village-level census data do not include information on infant or child mortality, we rely on province-level estimates of under-five child mortality rates (CMR) for 1990 and 2019. From these benchmarks, we construct province-level CMR measures for the census years used in our study. In Section 7.1, we incorporate these measures, together with other proxies for child mortality, as controls in the regressions to reduce potential bias from the missing mortality variable.
We measure years of exposure to electricity from the earliest census year in which a village is recorded as having access. This does not necessarily correspond to the exact year electrification occurred, since the data report availability only in the census years and other national reports listed in Table 1. As a result, the distribution of exposure years is somewhat irregular. Exposure is measured up to 1996 and 2006, with average village exposure equal to 7.9 years in 1996 and 16.0 years in 2006.
As noted earlier, to address potential endogeneity of electricity exposure, we turn to instrumental variable (IV) estimation. Our instrument is a geographic proxy for the cost of electrification, defined as the difference between a village’s elevation above sea level and the mean elevation of its district. The idea is that elevation is correlated with the cost of extending rural electricity but not directly with fertility. Using relative elevation, rather than absolute elevation, further ensures that we capture variation in electrification costs within districts while netting out broader differences in geography, climate, and agricultural potential that might otherwise be correlated with fertility. Iran’s mountainous geography – with villages located in three main zones: mountain, forest, and plain (Fisher and Boyle Reference Fisher and Boyle1968; Modarres and da Silva Reference Modarres and da Silva2007) – provides a suitable basis for using elevation as a proxy for electrification costs.
Since village elevations are not reported in the census, we obtained elevation data from the website of the National Cartographic Center of Iran. Merging these data with our village sample reduces the IV sample to 20,274 observations – less than half of the full sample. Fortunately, the distributions of the key variables are very similar across the IV and full samples, suggesting that the loss of observations does not materially affect the representativeness of our analysis.
Table 3 reports summary statistics for the IV sample. The average CWR was 980 children per 1,000 women in 1986, falling to 516 in 1996 and 279 in 2006. The table also provides information on years of exposure to electricity, population size, years of exposure to primary and middle schools up to 1996, and religious characteristics in 1986. The average village population in 1986 was 469 persons, or roughly 90 households. By 1996, villages had been electrified for an average of 9 years, whereas exposure to primary schools was much longer, averaging 23.7 years. The data indicate that most villages received access to middle schools after electrification. Finally, TV coverage data, available only for 1996, show that about 80 percent of villages had television access by that year.
Summary statistics, IV sample

Religious characteristics in 1986 show that 73% of villages had a mosque – an indicator of both local wealth and religiosity – and 86% had a Shia majority. Geographic data indicate that 46% of villages were located in plains, 52% in mountainous areas, and only 2% in forests, underscoring Iran’s predominantly mountainous terrain.
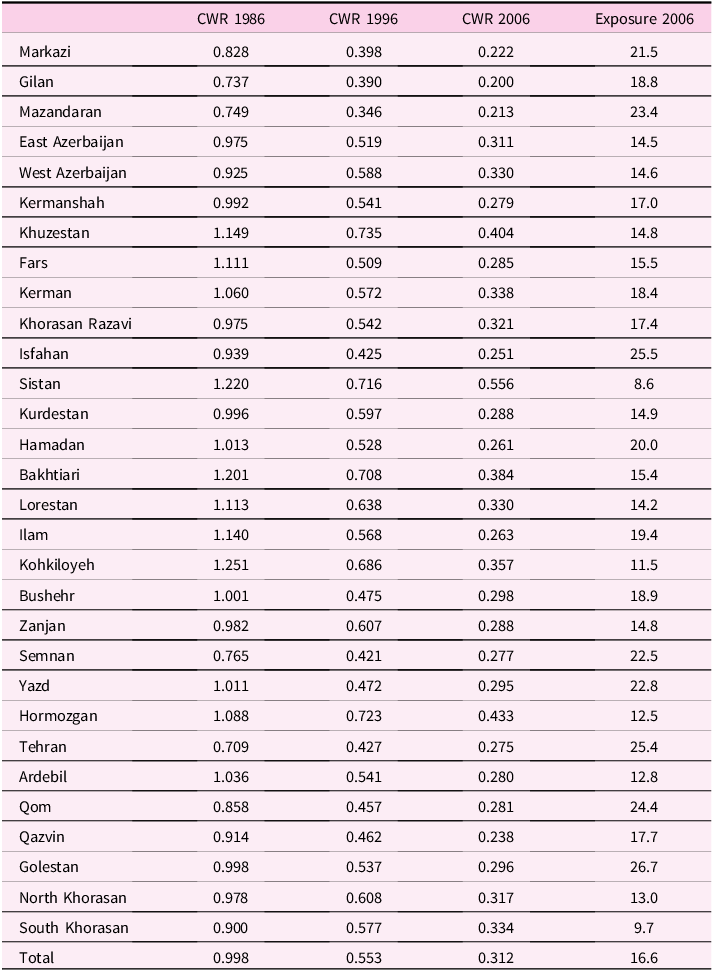
Table 4 reports average years of exposure to electricity and the CWR for 30 Iranian provinces. The contrast between more advanced provinces (e.g., Isfahan, Gilan, and Tehran) and disadvantaged ones (e.g., Sistan, Kohkiloyeh, and South Khorasan) is evident in both electrification exposure and fertility decline. Province-level averages reveal substantial variation in both outcomes. By 2006, several advanced provinces – notably Tehran and Isfahan – had accumulated more than 20 years of electrification, while disadvantaged provinces averaged as little as 8.6 years. In 1986, provincial CWRs ranged from 0.709 in Tehran to 1.251 in Kohkiloyeh, and by 2006, from 0.200 in Gilan to 0.556 in Sistan.
Fertility and electricity exposure by province

Note: Villages in the full sample, observed in the censuses of 1986, 1996, and 2006.
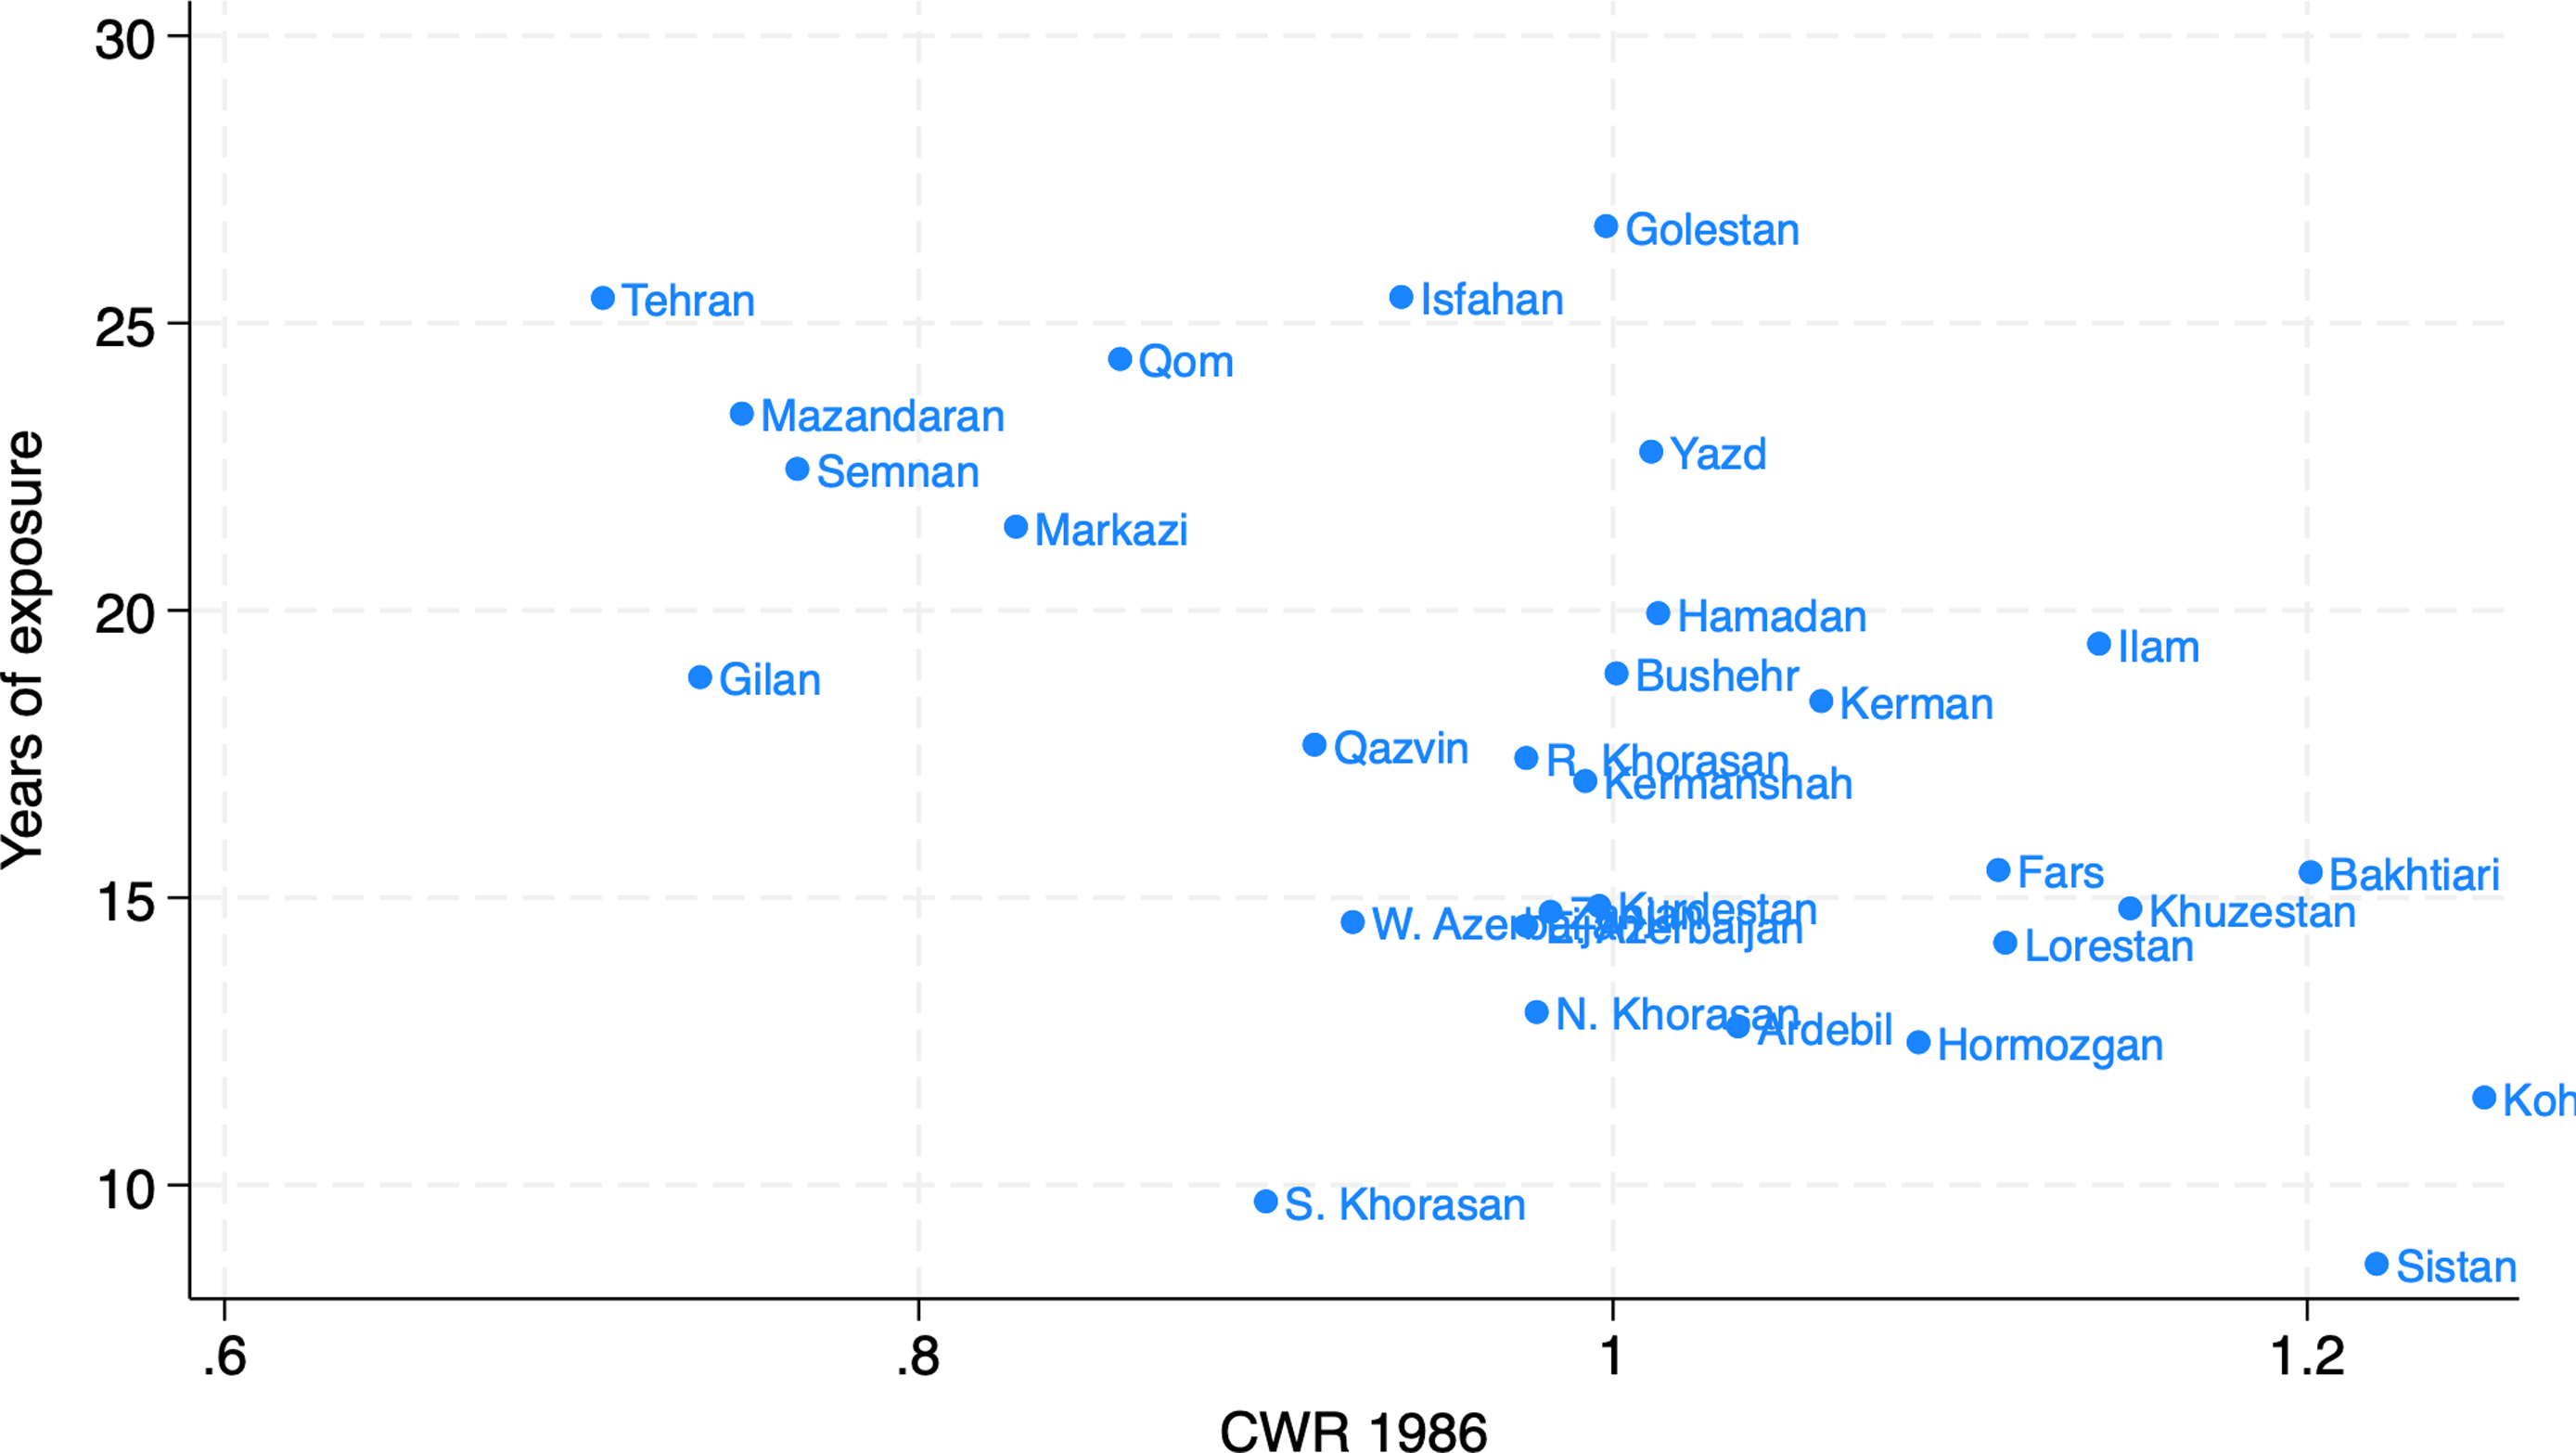
Province-level variation in fertility is positively correlated with years of electrification exposure: the correlation between CWR in 1986 and exposure by 2006 is 0.57. This relationship is also illustrated in Figure 3, which places Iran’s least developed provinces (Sistan, Kohkiloyeh, and Bakhtiari) at one extreme – with high fertility in 1986 and limited exposure – and the most developed provinces (Tehran, Gilan, and Isfahan) at the other. Interpreting CWR in 1986 as a proxy for provincial development, the pattern suggests that less developed provinces were electrified later.
CWR and years of exposure to electricity by province.

4. Methodology
Our baseline OLS specification estimates the following equation, expressing CWR as a function of years of exposure to electricity and other village characteristics:
 $${Y_i} = \alpha + \beta {E_i} + {X_i}\psi + {\varepsilon _i},$$
where ${Y_i}$
is the CWR in 1996 or 2006 for village
${Y_i}$
is the CWR in 1996 or 2006 for village $i$
,
$i$
, ${E_i}$
is the number of years of exposure to electricity up to that census year, and
${E_i}$
is the number of years of exposure to electricity up to that census year, and ${X_i}$
is a vector of exogenous village characteristics, including years of exposure to primary and middle schools by 1996 and village topography.
${X_i}$
is a vector of exogenous village characteristics, including years of exposure to primary and middle schools by 1996 and village topography.
As noted earlier, the OLS estimate of $\beta $
may be biased if more developed villages – with lower fertility – were electrified earlier. For example, if a government policy prioritized extending electricity to more advanced villages, which tend to be less remote and have lower fertility, then
$\beta $
may be biased if more developed villages – with lower fertility – were electrified earlier. For example, if a government policy prioritized extending electricity to more advanced villages, which tend to be less remote and have lower fertility, then ${E_i}$
and the error term
${E_i}$
and the error term ${\varepsilon _i}$
would be negatively correlated. This would bias the OLS estimate of
${\varepsilon _i}$
would be negatively correlated. This would bias the OLS estimate of $\beta $
downward, causing the effect of electrification on fertility to appear more negative than it truly is, or potentially to mask a positive effect.Footnote
2
$\beta $
downward, causing the effect of electrification on fertility to appear more negative than it truly is, or potentially to mask a positive effect.Footnote
2
For the IV estimation, we first predict years of exposure to electricity as a function of elevation – which proxies for the cost of electrification – and other village characteristics. The first-stage regression is:
 $${E_i} = {\alpha _0} + {\alpha _1}{Z_i} + {\alpha _2}{X_i} + {\upsilon _i},$$
where ${Z_i}$
is the elevation-based instrument and
${Z_i}$
is the elevation-based instrument and ${X_i}$
is the vector of control variables described above.
${X_i}$
is the vector of control variables described above.
The second-stage equation is:
 $${Y_{it}} = \alpha + \beta {\hat E_i} + {X_i}\psi + {\varepsilon _i},$$
where ${Y_{it}}$
is the village-level fertility outcome in year
${Y_{it}}$
is the village-level fertility outcome in year $t$
(1996 or 2006), and
$t$
(1996 or 2006), and ${\hat E_i}$
is the predicted years of electricity exposure from the first stage. The coefficient of interest,
${\hat E_i}$
is the predicted years of electricity exposure from the first stage. The coefficient of interest, $\beta $
, captures the causal impact of one additional year of electrification on fertility.
$\beta $
, captures the causal impact of one additional year of electrification on fertility.
All regressions include district fixed effects, so the estimates are identified from variation across villages within the same district. This specification eliminates unobserved district-level characteristics – such as cultural, administrative, or policy factors – that may jointly influence both fertility and education.
5. Empirical results
5.1. OLS
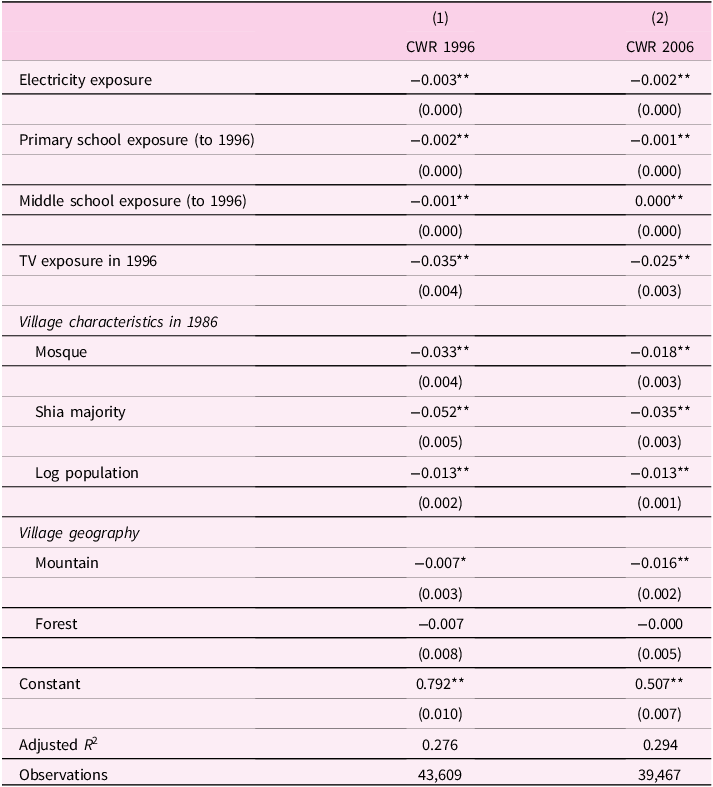
The core of our empirical analysis compares OLS and IV estimates. We begin with the OLS results for the full sample, reported in Table 5. Recall that exposure to electricity is measured as the number of years since a village was first recorded as having electricity, up to 1996 and 2006. As expected, the OLS estimates of $\beta $
in equation 1 are negative and statistically significant in both years. The results indicate that each additional year of exposure reduces fertility by about 3 children per 1,000 women in 1996 and 2 children per 1,000 in 2006. The smaller effect in 2006 reflects diminishing marginal gains from electrification over time. However, these effects represent only a small fraction of the observed fertility decline. Between 1986 and 1996, the average CWR fell by roughly 444 children per 1,000 women, meaning that even under the OLS estimates, electrification can explain only a minor part of the overall reduction in fertility.
$\beta $
in equation 1 are negative and statistically significant in both years. The results indicate that each additional year of exposure reduces fertility by about 3 children per 1,000 women in 1996 and 2 children per 1,000 in 2006. The smaller effect in 2006 reflects diminishing marginal gains from electrification over time. However, these effects represent only a small fraction of the observed fertility decline. Between 1986 and 1996, the average CWR fell by roughly 444 children per 1,000 women, meaning that even under the OLS estimates, electrification can explain only a minor part of the overall reduction in fertility.
OLS estimates of the impact of electricity exposure on fertility using the full sample (dependent variable CWR)

Notes: Exposure to electricity is measured to 1996 in column (1) and to 2006 in column (2). All columns use district-level fixed effects. Standard errors in parentheses, * $p \lt 0.05$
, **
$p \lt 0.05$
, ** $p \lt 0.01$
.
$p \lt 0.01$
.
The OLS estimates for village characteristics – including the availability of schools, TV, mosques, and religious composition – generally have plausible signs and magnitudes. Exposure to primary and middle schools is associated with lower fertility, and villages with TV signals also exhibit lower fertility in both 1996 and 2006. Shia-majority villages and those with a mosque report lower CWR as well, perhaps reflecting greater responsiveness to the information campaigns of a Shia-led government. Finally, villages in mountainous and forest areas have lower fertility than those in the plains, although the forest coefficients are not statistically significant.
5.2. IV
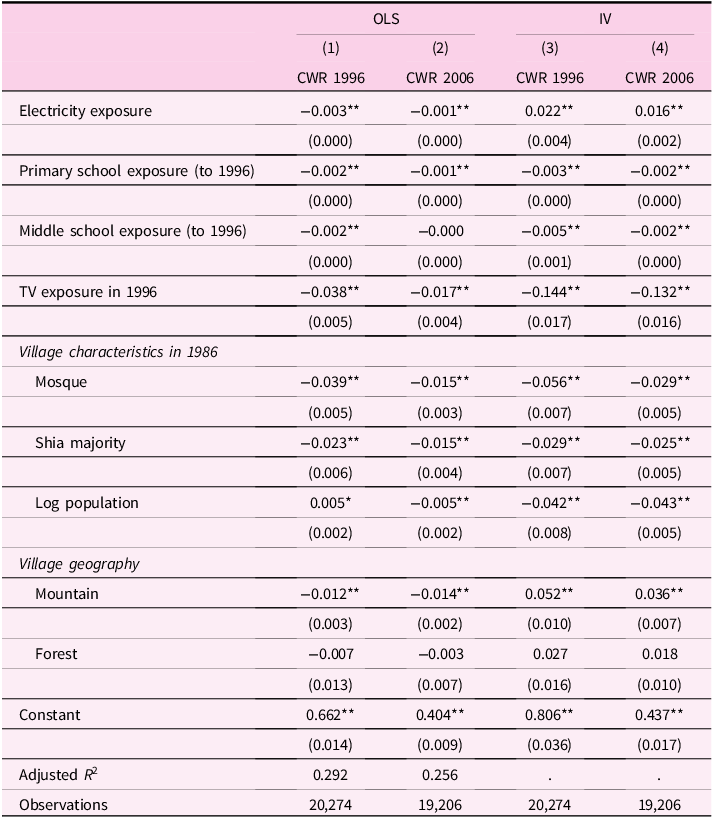
As noted in Section 3, the IV regression can only be estimated for the subset of villages for which elevation data are available. We therefore compare OLS and IV estimates using this smaller IV sample, reported in Table 6. In the OLS regressions, the coefficients on electricity exposure remain negative, and the estimates for other covariates are similar in both sign and magnitude to those obtained from the full sample.
OLS and IV estimates of the impact of electricity exposure on fertility (dependent variable CWR)

Notes: Exposure to electricity is measured to 1996 in columns (1) and (3), and to 2006 in columns (2) and (4). ${R^2}$
’s in IV regressions are not reported because they are not well-defined. All columns use district-level fixed effects. Standard errors in parentheses, *
${R^2}$
’s in IV regressions are not reported because they are not well-defined. All columns use district-level fixed effects. Standard errors in parentheses, * $p \lt 0.05$
, **
$p \lt 0.05$
, ** $p \lt 0.01$
.
$p \lt 0.01$
.
A natural concern is whether the restriction to the IV sample introduces selectivity bias. However, as shown in Tables 2 and 3, the distributions of key village characteristics are very similar across the full and IV samples. We therefore conclude that the comparison of OLS and IV results based on the smaller sample provides valid inference and is likely representative of what we would obtain if elevation data were available for all villages.
Beginning with the first-stage regression (see online Appendix A), which relates years of electricity exposure to elevation and other village characteristics, we find that elevation – the instrument – is strongly correlated with the cost and timing of electrification. Specifically, each kilometer of village elevation above the district average reduces electricity exposure by 1.93 years when measured up to 1996 and by 2.27 years when measured up to 2006. The corresponding F-statistics of 205.11 and 209.53 far exceed the conventional threshold of 10, ruling out concerns about weak instruments.
The key finding from the second stage is the positive coefficient on electricity exposure (Table 6). This result is consistent with the hypothesis that the small negative OLS estimates reflect downward bias; once corrected with the instrument, the effect reverses sign and becomes positive. In other words, rather than reducing the CWR by about 3 children per 1,000 women per year, electrification is estimated to increase the CWR by 22 per 1,000 in 1996 and by 16 per 1,000 in 2006 (columns 3 and 4). This reversal illustrates why IV estimation is necessary in this setting and underscores the importance of accounting for the non-random placement of electricity.
The IV estimates for most village characteristics – such as schooling and TV exposure, the presence of a mosque, and a Shia majority – retain the same signs as in the OLS regressions, although some coefficients are larger in magnitude. An exception is the mountain dummy: villages located in mountainous regions exhibit higher fertility, while those in forest areas do not differ significantly from villages in the plains. The coefficient on TV exposure is substantially larger in the IV specification, which may reflect the fact that TV access is highly correlated with omitted factors that also influence electricity exposure (the equivalent of $\delta $
in online Appendix B). Overall, the IV results confirm the robustness of the OLS patterns while underscoring the value of the IV approach in addressing omitted-variable bias.
$\delta $
in online Appendix B). Overall, the IV results confirm the robustness of the OLS patterns while underscoring the value of the IV approach in addressing omitted-variable bias.
6. Mechanism
The credibility of the hypothesis that electrification can increase fertility depends on demonstrating the mechanism through which this occurs and explaining why, in a specific context, the common empirical finding can be reversed. Economic theory suggests that a key channel through which infrastructure reduces fertility is by expanding market opportunities for women outside the home, thereby raising the opportunity cost of childbearing. In post-revolutionary Iran, however, such opportunities were contracting rather than expanding, which calls into question whether the impact of electrification in rural areas would follow the negative pattern observed elsewhere.
In principle, the absence of formal employment opportunities for women implies that electrification would not significantly increase the cost of childrearing. Under these conditions, the positive income effect of electrification could dominate, leading to higher fertility. Evidence from other settings supports this interpretation: for example, Lavy and Zablotsky (Reference Lavy and Zablotsky2015) show that when female LFP is very low, as among Arab women in Israel, the standard Beckerian mechanism linking education to lower fertility does not apply.
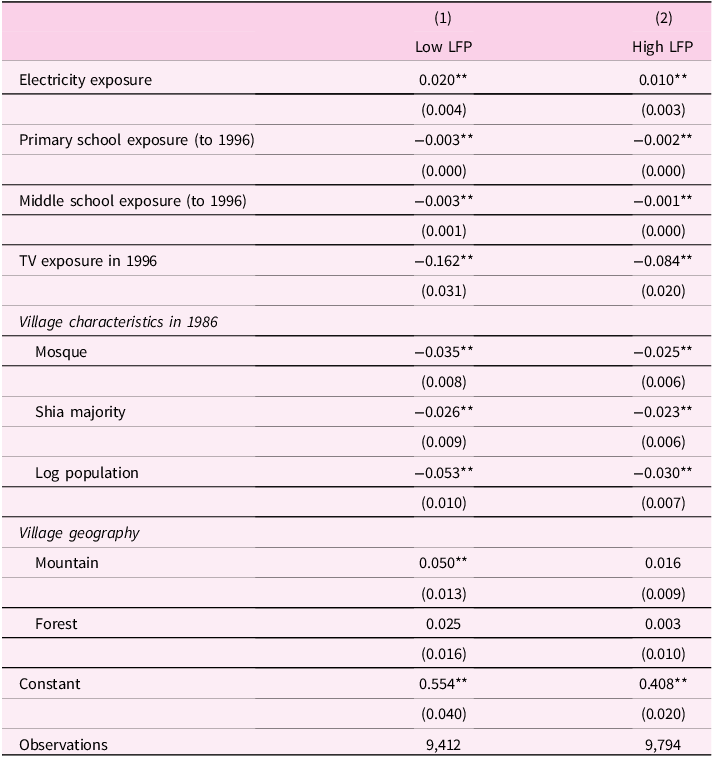
To test whether this mechanism accounts for the positive effect of electrification, we divide villages into low and high female LFP groups, depending on whether they are located in districts with female LFP above or below the median. District-level LFP is calculated from the 2% sample of the 1996 census, which reports a median rural female LFP of 8.6%. We then re-estimate equation 3 separately for these two sub-samples for CWRs in 2006. The choice of 2006 for the dependent variable is because the 1996 census is the earliest available in microdata, which makes the observation of CWR in 2006 more relevant.
The results, reported in Table 7, indicate that electrification increased fertility by 10 births per 1,000 women in high-LFP districts (column 2) and by 20 births per 1,000 women in low-LFP districts (column 1). Assuming the income effect of electrification is similar across the two groups, the fact that the impact is twice as large in areas with lower female LFP – where the substitution effect is presumably weaker – suggests that the positive effect of electrification operates primarily through the income channel.
Mechanism: the impact of electricity exposure on fertility in low and high female LFP areas (dependent variable CWR 2006)

Notes: We divide the sample into two groups based on the female labor force participation rates in rural areas in 1996. Regression in column (1) is for villages with low LFP (below the median LFP of 8.6%), and column (2) is for villages with high LFP (greater than the median). All columns use district-level fixed effects. Standard errors in parentheses, * $p \lt 0.05$
, **
$p \lt 0.05$
, ** $p \lt 0.01$
.
$p \lt 0.01$
.
7. Robustness checks
In this section we examine several potential sources of bias that could undermine our identification strategy or distort the estimated impact of electrification on fertility. First, electrification may reduce CMR, which would inflate the CWR even without an underlying increase in fertility. Second, electrification may affect fertility indirectly by enabling family planning services through the expansion of rural clinics. Third, selective migration into or out of villages between censuses could bias our estimates; for example, if younger families with children are more likely to move, the CWR would capture migration effects as well as fertility changes. Finally, we test whether accounting for other types of infrastructure – such as clean water and asphalt roads – alters the estimated effect of electrification.
7.1. Child Mortality Rate (CMR) and survivorship bias
A key concern with using the CWR as a proxy for fertility is its sensitivity to child mortality. Electrification may improve child survival and thus inflate the CWR, making fertility appear higher than it truly is. To ensure that our results are not driven by this survivorship bias, we incorporate measures of child mortality into our analysis.
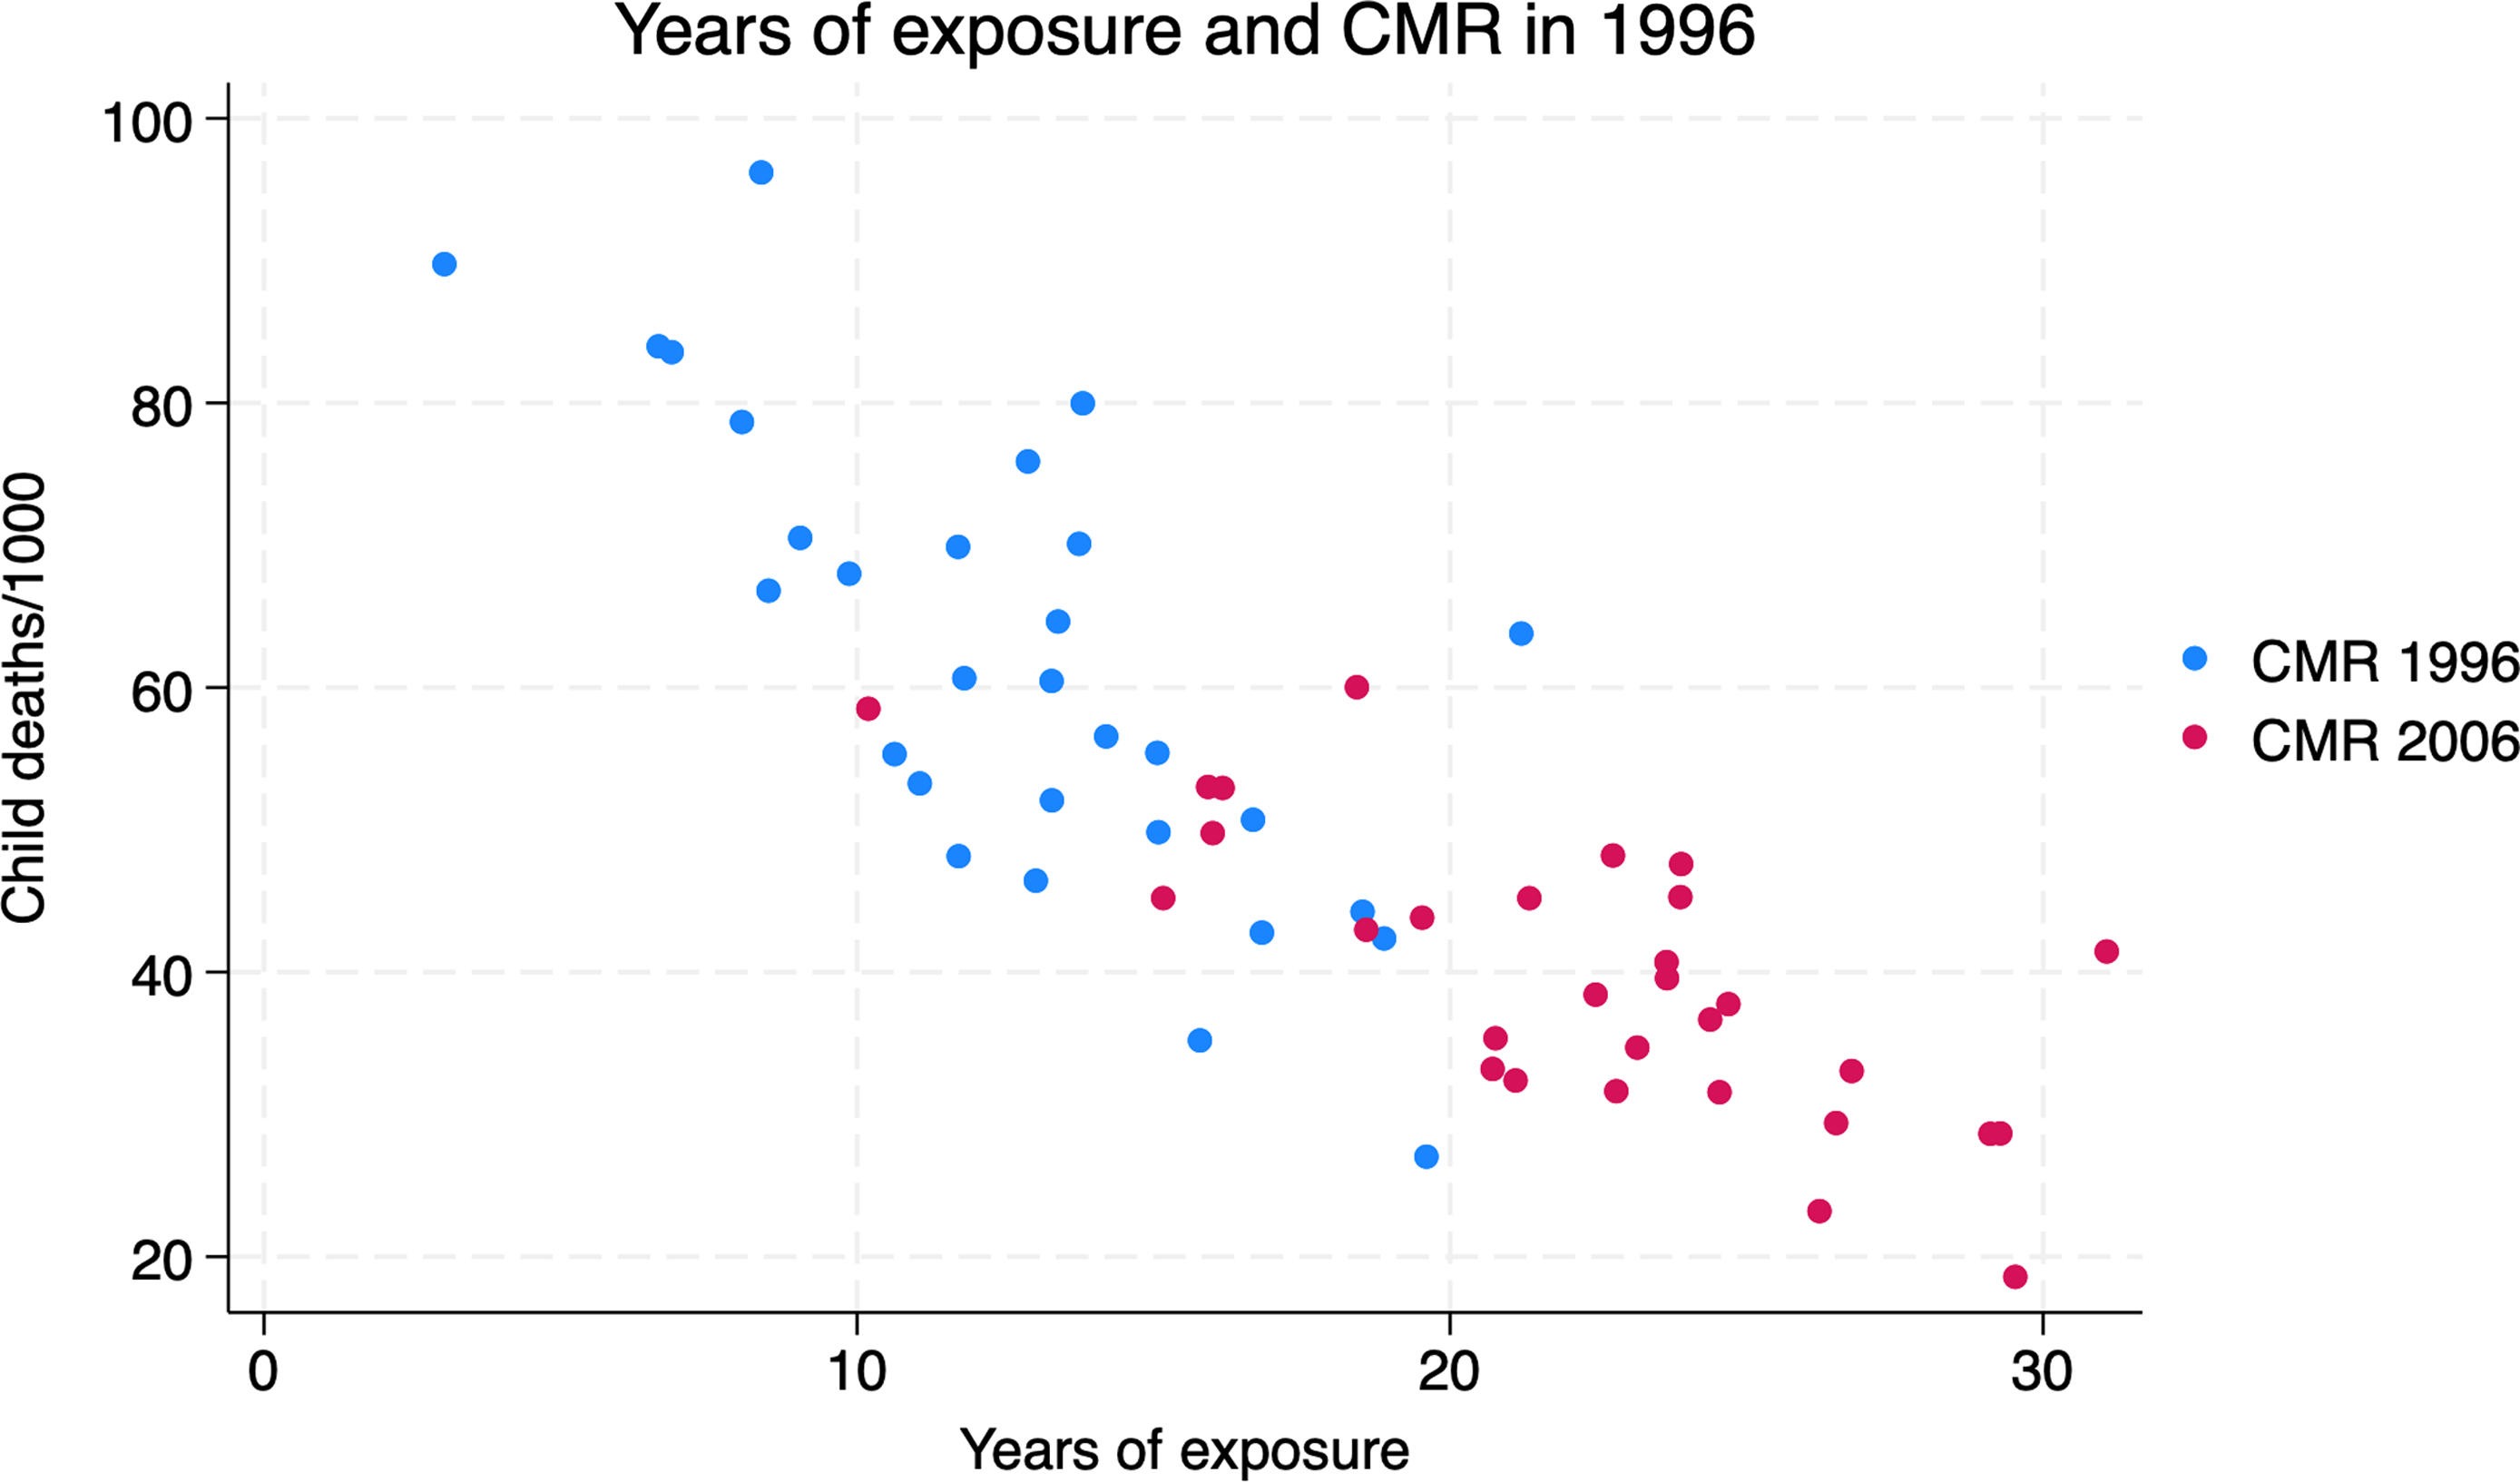
Since census data do not permit estimation of child mortality at the village level, we address this potential bias using province-level estimates of under-five CMR. Using dedicated surveys, Sepanlou et al. (Reference Sepanlou, Aliabadi, Naghavi and Malekzadeh2022) provide provincial CMR estimates for 1990 and 2019, from which we linearly interpolate values for 1996 and 2006. Although these provincial averages do not distinguish between rural and urban populations, they capture much of the cross-provincial variation in child mortality. Figure 4 illustrates the negative relationship between province-level CMRs and average village electricity exposure in both 1996 and 2006: provinces with longer exposure to rural electrification tend to have lower CMRs, and this association is consistent across the two census years.
The relationship between years of exposure to electricity and CMR, by province.
Note: Years of electricity exposure are means by province of village years of exposure in 1996 and 2006. Province CMRs are linear predictions based on their values in 1990 and 2019.

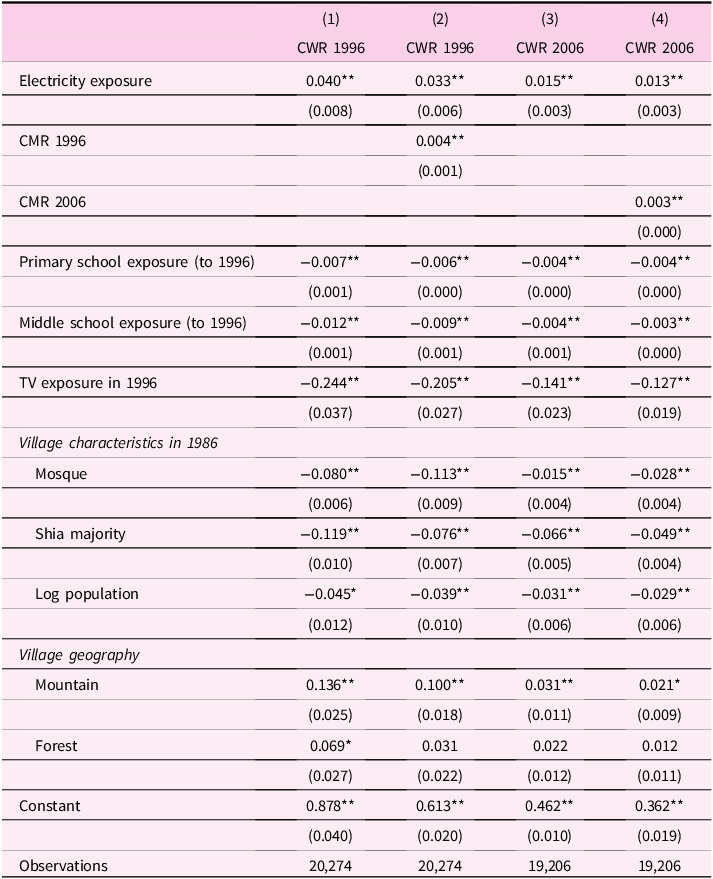
To address potential bias from variation in child mortality, we add province-level CMR as a control to the baseline regression. Because CMRs do not vary within districts, this specification cannot include district fixed effects. To allow comparison, Table 8 first reports the baseline model re-estimated without district fixed effects (columns 1 and 3), and then adds province-level CMRs (columns 2 and 4). The results indicate that controlling for CMR reduces the estimated impact of electrification somewhat (from 40 to 33 per 1,000 in 1996 and from 15 to 13 per 1,000 in 2006), but the effect remains positive.
Robustness check for CMR: controlling for province-level CMR

Notes: IV estimation, dependent variable CWR. Columns (1) and (3) repeat the IV regressions in Table 6 without district-level fixed effects. Columns (2) and (4) control for CMR. Standard errors in parentheses, * $p \lt 0.05$
, **
$p \lt 0.05$
, ** $p \lt 0.01$
.
$p \lt 0.01$
.
The smaller coefficients are consistent with the expectation that CWR overstates fertility by not adjusting for child mortality. At the same time, the persistence of a positive coefficient suggests that measurement error in CWR does not account for our main finding: electrification increased fertility in rural Iran.
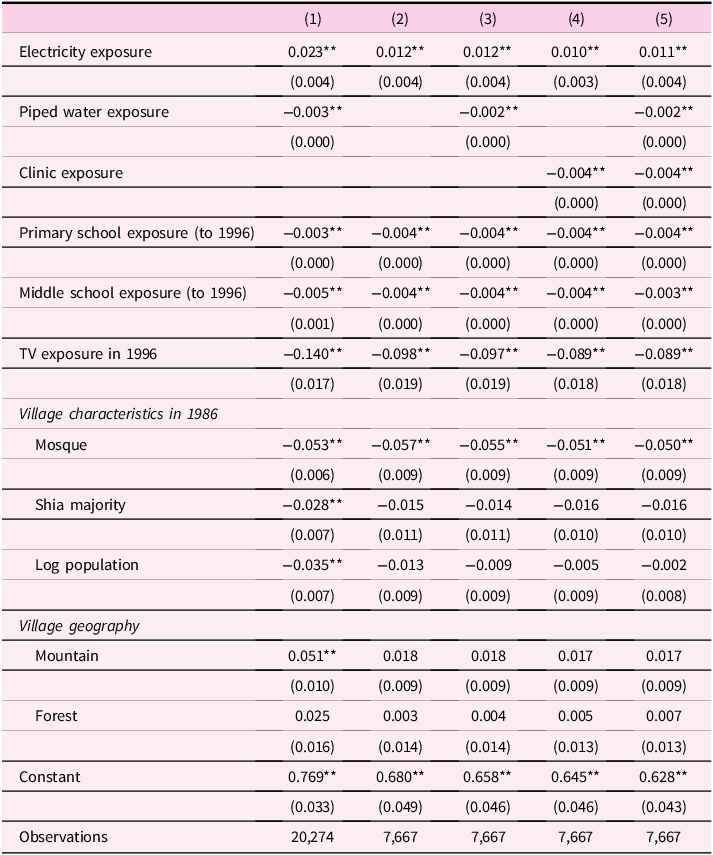
While the province-level CMR controls help address survivorship bias, they come at the cost of losing district fixed effects. To restore these, we turn to village-level proxies. As a first step, we use years of exposure to clean water (measured up to 1996 and 2006), which is available for all villages in the sample. Access to clean water is strongly correlated with child mortality (Cheng et al. Reference Cheng, Schuster-Wallace, Watt, Newbold and Mente2012), and in the case of Iran the association is particularly pronounced: in our sample, the correlation between province-level CMR and the share of villages with clean water is −0.59 in 1996 and −0.56 in 2006. We therefore treat years of clean water exposure as a proxy for reductions in child mortality at the village level, which helps mitigate potential bias in our electrification estimates arising from measurement error in the CWR. The results, reported in column (1) of Tables 9A and 9B, show that adding the clean water proxy has virtually no effect on our estimates (0.023 vs. 0.022 for 1996 and unchanged for 2006). This indicates that the positive effect we find is not an artifact of survivorship bias in the CWR measure: electrification appears to have increased fertility independently of its effect on child survival.
Robustness check for CMR: years of exposure to piped water and health clinics, 1996

Notes: Exposures to electricity, clean water, and clinics are measured in years until 1996. The sample for columns (2)–(5) includes villages with a health clinic. All columns use district-level fixed effects. Standard errors in parentheses, * $p \lt 0.05$
, **
$p \lt 0.05$
, ** $p \lt 0.01$
.
$p \lt 0.01$
.
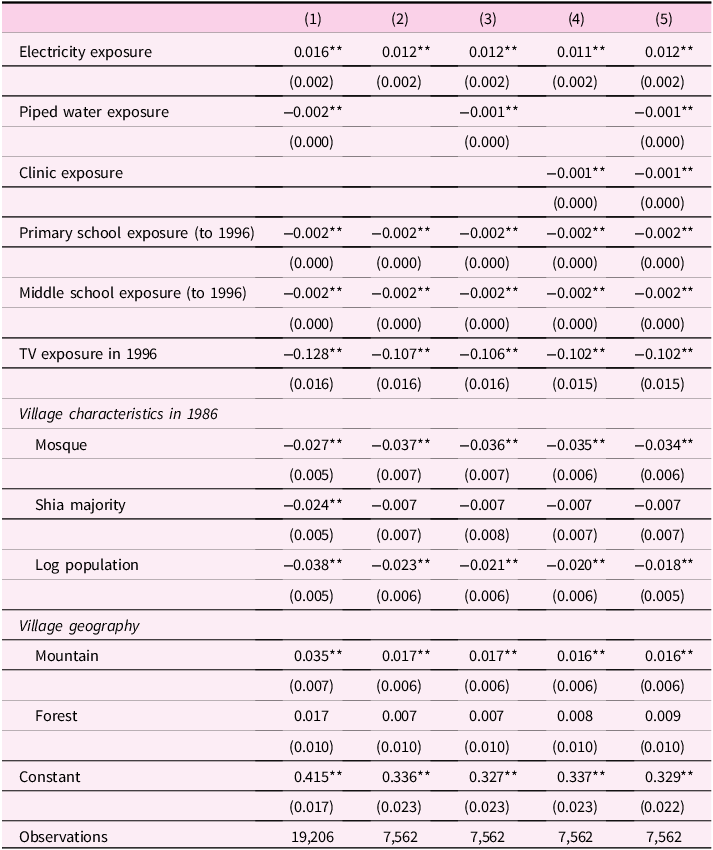
Robustness check for CMR: years of exposure to piped water and health clinics, 2006

Notes: Exposures to electricity, clean water, and clinics are measured in years until 2006. The sample for columns (2)–(5) includes villages with a health clinic. All columns use district-level fixed effects. Standard errors in parentheses, * $p \lt 0.05$
, **
$p \lt 0.05$
, ** $p \lt 0.01$
.
$p \lt 0.01$
.
Another plausible proxy for child mortality at the village level is years of exposure to health clinics. Unlike clean water, however, clinic data are only available for the “main” villages, which are fewer in number because clinics are located in central villages serving surrounding settlements. In our sample, this reduces coverage to 7,667 of 20,274 villages in 1996 and 7,562 of 19,206 in 2006. Tables 9A and 9B therefore first report the effect of electrification in this smaller subsample (column 2), which we take as the new baseline. Column (3) adds clean water exposure, column (4) adds clinic exposure, and column (5) adds exposures to both clean water and clinics.
Restricting the sample to villages with clinics reduces the estimated impact of electrification (from 22 to 12 per 1,000 in 1996 and from 16 to 12 per 1,000 in 2006), but continues to show a significant positive effect. The reduction is consistent with the fact that villages excluded from this analysis are smaller and less developed, where women have fewer market opportunities and thus a stronger positive fertility response to electrification. Importantly, however, once the new baseline is established, adding clean water and clinic controls do not further alter the coefficient on electrification, while the coefficients on both proxies are negative, as expected.
Taken together, the clean water and clinic results suggest two conclusions. First, survivorship bias does not explain the positive effect of electrification, since controlling for multiple proxies of child mortality leaves the estimates largely unchanged. Second, the somewhat smaller effect of electrification in the clinic subsample reflects genuine heterogeneity across villages, not omitted survivorship effects.
7.2. Family planning
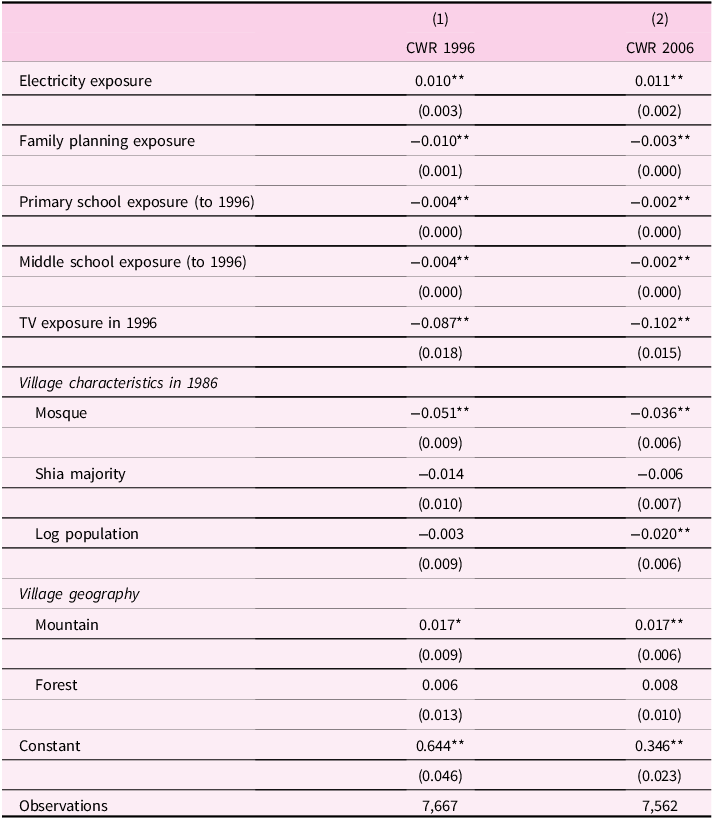
Another potential source of bias from the presence of health clinics arises through their role in providing family planning services. Electrification facilitated clinic expansion, and to the extent that clinics reduced fertility by offering family planning, this channel could offset the positive effect of electrification. As noted in Section 2.1, clinics in Iran initially provided family planning services until 1979, shifted to mother and child health when family planning was banned after the revolution, and resumed family planning activities in 1989, when pro-natalist policies were reversed (Abbasi-Shavazi et al. Reference Abbasi-Shavazi, McDonald and Hosseini-Chavoshi2009; Salehi-Isfahani et al. Reference Salehi-Isfahani, Abbasi-Shavazi and Hosseini-Chavoshi2010). This policy switching allows us to separate the fertility effects of family planning provision from the broader operation of clinics. Although clinics are estimated to account for less than 20% of the fertility decline between 1986 and 1996 (Salehi-Isfahani et al. Reference Salehi-Isfahani, Abbasi-Shavazi and Hosseini-Chavoshi2010), it is nevertheless important to test whether our electrification estimates are sensitive to this channel. Following Hashemi and Salehi-Isfahani (Reference Hashemi and Salehi-Isfahani2013), we therefore restrict years of clinic exposure to periods when family planning services were offered (before 1979 and after 1989). The results, reported in Table 10, show that controlling for years of family planning exposure does not materially alter our estimates of electrification’s effect on fertility.
Robustness check: controlling for years of exposure to family planning

Notes: Exposures to electricity and family planning are measured in years until 1996 for column (1) and until 2006 for column (2). All columns selected a sample of villages with a health clinic. All columns use district-level fixed effects. Standard errors in parentheses, * $p \lt 0.05$
, **
$p \lt 0.05$
, ** $p \lt 0.01$
.
$p \lt 0.01$
.
It is noteworthy that the estimated impact of electrification is smaller when we include the proxy for family planning. This is most likely because years of exposure to family planning and to clinics are highly correlated and, consistent with the results in Tables 9A and 9B, the mortality-reducing effect of clinics explains why adding them to the regression lowers the estimated coefficient of electrification. In addition, clinics provided maternal and child health services beyond contraception, and their presence was correlated with other development factors, such as education and health infrastructure, that also contributed to lower fertility.
7.3. Migration
During the period we study, rural-urban migration was substantial, though migration between villages was relatively limited, and most villages experienced out-migration. Both in – and out-migration can be age-selective in ways that affect the measured CWR independently of underlying fertility. But, our main concern is with out-migration, which is more likely to be selective of young families, reduce CWRs mechanically, and produce spurious results.
About 53% of villages in our sample lost population between 1986 and 1996, and 57% between 1996 and 2006. More important, only 5% experienced growth of more than 3%, which is consistent with a natural growth rate implied by their CWRs in 1986. The other 95%, which had population growth rates below 3% per year, were unlikely to have experienced in-migration.
To gauge the extent of rural-to-rural migration nationally, we use the 2-percent census samples of 1996 and 2006. We find that about 10% of rural residents had moved during 1986-1996, of whom 39% came from another rural area. By 2006, the migration rate had increased to 13%, with 44% originating from another village. Thus, only a small fraction of the 1996 and 2006 rural populations – about 3.9% and 5.7%, respectively – had moved from another village.
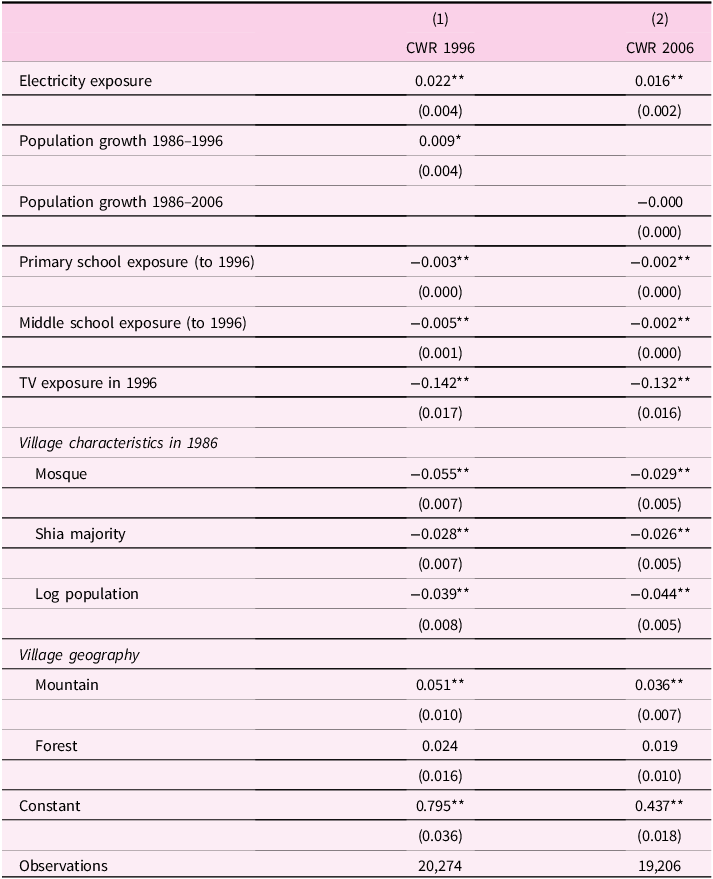
To address the potential bias due to migration, we control for changes in village population between 1986–1996 and 1986–2006 as a proxy for migration, in addition to including the log of 1986 population in all regressions to capture initial size effects. If migration – particularly out-migration of younger families – were driving our results, then controlling for these variables should attenuate the estimated effect of electrification. As reported in Table 11, however, the coefficients on electrification remain very similar to the baseline estimates, suggesting that selective migration does not bias our findings in any meaningful way.
Robustness check for migration: controlling for village population growth

Notes: Exposures to electricity is measured in years until 1996 for column (1) and until 2006 for column (2). All columns use district-level fixed effects. Standard errors in parentheses, * $p \lt 0.05$
, **
$p \lt 0.05$
, ** $p \lt 0.01$
.
$p \lt 0.01$
.
7.4. Other infrastructure: piped water and roads
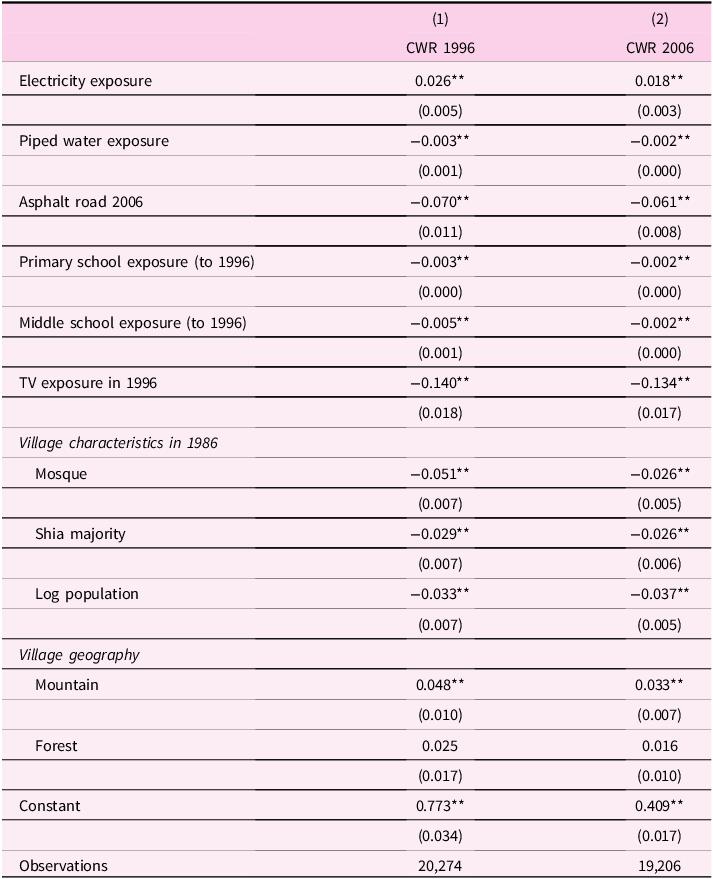
We next examine whether other forms of infrastructure – piped water and roads – bias the estimated effect of electrification, given their correlation with electricity expansion (correlation = 0.35 in 1996 and 0.39 in 2006). Previously, in Section 7.1, we introduced years of exposure to piped water as a proxy for child mortality; here we use it as another infrastructure. Information on road quality, which is available in 2006 only, is introduced as a dummy (1= asphalt; 0= gravel).
Table 12 reports the results. Including these additional controls leaves the electricity coefficient positive and similar in magnitude to the baseline: in 1996, the estimated impact is 26 births per 1,000 women, compared with 22 per 1,000 in Table 6. The partial effect of piped water is small and negative, suggesting slightly lower fertility in villages with piped water. By contrast, access to asphalt roads is associated with a much larger negative effect (about 70 per 1,000 in 1996), consistent with the idea that villages with better road access are closer to urban centers and therefore display more urban-like fertility patterns.
Robustness check for other infrastructure: piped water and asphalt road

Notes: Exposures to electricity and water are measured in years until 1996 in column (1) and until 2006 in column (2). All columns use district-level fixed effects. Standard errors in parentheses, *p < 0.05, **p < 0.01.
The smaller population coefficient relative to Table 6 is also consistent with this interpretation, since road access likely captures part of the urban-proximity and market-access channel that was previously loaded onto the population. Overall, these results indicate that the positive impact of electrification on fertility is robust to the inclusion of other correlated infrastructure.
8. Concluding remarks
The relationship between economic development and population growth is among the oldest themes in economics. Contrary to Malthusian predictions, economic development everywhere appears to have facilitated fertility transition, although the precise mechanism behind this relationship remains unclear. Investment in infrastructure, which often precedes sustained economic growth, is a natural channel linking development to fertility outcomes. Economic theory suggests that electrification affects fertility primarily through its impact on household income and the opportunity cost of women’s time. Since electrification typically raises income, its role in reducing fertility depends on whether it also raises the opportunity cost of women’s time and lowers the cost of child education – both of which tend to reduce the demand for children. While lower education costs are a plausible consequence of electrification, increases in women’s opportunity cost of time are highly context-dependent. In rural Iran, where female LFP was extremely low and restrictions on women’s employment and mobility intensified after the Islamic Revolution, it is implausible that electrification raised the price of childbearing enough to offset the positive income effect.
In this paper, we provide empirical evidence that electrification in rural Iran during the 1980s and 1990s increased fertility, in contrast to findings from previous studies. Ordinary least squares (OLS) estimates suggest a negative effect, consistent with the literature, but correcting for the non-random placement of electricity using an instrumental variable (IV) approach reverses the result and reveals a significant positive effect. Our robustness checks – using clean water and clinics as proxies for child mortality, controlling for migration, and adding other infrastructure – consistently show that the positive effect of electrification on fertility is not an artifact of omitted channels but a robust causal relationship.
This positive causal relationship underscores that the demographic effects of infrastructure are strongly context-specific. Our results do not contradict prior research; rather, they clarify that electrification’s impact depends critically on social structures, gender norms, and women’s economic opportunities. Where women’s participation in the labor market is severely constrained, the substitution effect of electrification (raising the opportunity cost of time) is minimal, allowing the positive income effect to dominate and increasing the demand for children.
From a policy perspective, our findings do not diminish the broader developmental benefits of electrification, nor do they deny that it can lower fertility through indirect channels. However, acknowledging the potential for a direct positive effect is essential when allocating scarce development resources. Policymakers should recognize that electrification alone may not reduce fertility, especially in contexts where complementary conditions – such as women’s access to employment – are weak. In such settings, complementary policies that enhance women’s economic opportunities, autonomy, and participation in the labor market may be necessary to achieve fertility-reducing outcomes.
In summary, while electrification remains an essential and highly beneficial development policy, its demographic impact varies substantially across contexts. Recognizing this complexity is crucial for designing effective development strategies. Future research could usefully explore the role of complementary policies – such as improving female education, expanding access to healthcare, and increasing women’s labor market participation – in aligning infrastructure investments with desired demographic and developmental goals.
Acknowledgement
We are grateful to an anonymous reviewer for helpful comments.

 Open access