

Introduction
Exposure is a key to second language (L2) incidental vocabulary learning (Schmitt & Schmitt, Reference Schmitt and Schmitt2020). Repeated encounters with unknown lexical items in written input are crucial for successful learning to occur. Empirical evidence showing the importance of repetition in incidental L2 vocabulary learning from reading abounds (e.g., Elgort & Warren, Reference Elgort and Warren2014; Horst et al., Reference Horst, Cobb and Meara1998; Pellicer-Sánchez & Schmitt, Reference Pellicer-Sánchez and Schmitt2010; Uchihara et al., Reference Uchihara, Webb and Yanagisawa2019). Most studies suggest that considerable gains can occur after eight to ten encounters, but that different aspects of vocabulary knowledge (e.g., receptive and productive knowledge) might need a different number of exposures (Peters, Reference Peters and Webb2020). However, the majority of studies exploring the role of frequency of exposure in vocabulary learning from reading have focused on the acquisition of single words. Despite the essential role of collocations (i.e., two or more words that co-occur more frequently than expected by chance alone), and other types of formulaic sequences, for achieving high levels of proficiency in a L2 (Siyanova-Chanturia & Pellicer-Sánchez, Reference Siyanova-Chanturia, Pellicer-Sánchez, Siyanova-Chanturia and Pellicer-Sánchez2019), the examination of the incidental learning of formulaic sequences from reading and of the role of frequency of exposure in this process has only recently started to receive attention in the literature.
The evidence to date suggests that the form and meaning of collocations can be learnt incidentally from reading (Choi, Reference Choi2017; Pellicer-Sánchez, Reference Pellicer-Sánchez2017; Vilkaite, Reference Vilkaitė2017; Webb & Chang, Reference Webb and Chang2020) and reading-while-listening (Webb et al., Reference Webb, Newton and Chang2013), but the few studies exploring the role of frequency of exposure have yielded conflicting findings. Studies attest to a significant effect of repetition in the learning of collocations (e.g., Webb et al., Reference Webb, Newton and Chang2013), with some studies showing that just one extra exposure may lead to significant gains in collocational knowledge (e.g., Durrant & Schmitt, Reference Durrant and Schmitt2010). However, other studies have questioned this effect, indicating that extra exposures do not always lead to higher gains (e.g., Pellicer-Sánchez, Reference Pellicer-Sánchez2017; Szudarski & Carter, Reference Szudarski and Carter2016). Thus, our understanding of the role of frequency of exposure in the incidental learning of collocations from reading is still incomplete.
Crucially, recent eye-tracking research with single words has shown that through repeated encounters during reading, learners can develop familiarity with new forms and processing fluency, as reflected in a decrease in the number and durations of fixations (e.g., Elgort et al., Reference Elgort, Brysbaert, Stevens and Van Assche2018; Godfroid et al., Reference Godfroid, Ahn, Choi, Ballard, Cui, Johnston, Lee, Sarkar and Yoon2018; Mohamed, Reference Mohamed2018; Pellicer-Sánchez, Reference Pellicer-Sánchez2016). However, no research to date has explored whether frequency of exposure has a similar effect on the processing of collocations. Eye-tracking research has shown that novel collocations initially attract more attention than known collocations (e.g., Choi, Reference Choi2017), but processing changes throughout subsequent exposures are yet to be examined. While there is some evidence that suggests that small increases in frequency of exposure can lead to significantly higher gains in collocational knowledge (e.g., Durrant & Schmitt, Reference Durrant and Schmitt2010; Webb et al., Reference Webb, Newton and Chang2013), it is still unclear whether such frequency manipulations can lead to differences in the development of processing fluency. Finally, eye-tracking studies have recently suggested that processing time on lexical items during reading is related to their learning (e.g., Godfroid et al., Reference Godfroid, Boers and Housen2013; Mohamed, Reference Mohamed2018; Pellicer-Sánchez, Reference Pellicer-Sánchez2016); however, this relationship has only been examined with single words. Thus, the aim of the present investigation was to explore the role of frequency of exposure in the learning and processing of novel collocations over several encounters in a text, as well as the relationship between online processing of collocations and their learning.
Background
Collocations in a first and second language
Collocations, being one of different types of formulaic sequences (Wray, Reference Wray2002), are often defined as a frequent co-occurrence of two or more words (Evert, Reference Evert, Ludeling and Kyto2008; Sinclair, Reference Sinclair1991). They are usually defined as the relation between a node and a collocate, “in which a collocate may be positioned either before or after the node and does not necessarily have to be adjacent to it” (Webb & Kagimoto, Reference Webb and Kagimoto2011, p. 262). They are syntagmatic units which can include both lexical and grammatical words (e.g., verb + noun [pay tribute], adjective + noun [hot spice], preposition + noun [on guard], and adjective + preposition [immune to], Henriksen, Reference Henriksen, Bardel, Lindquist and Laufer2013, p. 29). Research has shown that a high percentage of language is made up of collocations. According to Hill (Reference Hill and Lewis2000), “Collocations are found in up to 70% of everything we say, hear, read, or write” (p.53). Therefore, mastery of collocational competence is considered a crucial aspect of communicative competence, for both receptive and productive language competence (Cowie, Reference Cowie, Arnaud and Bejoint1992; Henriksen, Reference Henriksen, Bardel, Lindquist and Laufer2013; Siyanova-Chanturia & Pellicer-Sánchez, Reference Siyanova-Chanturia, Pellicer-Sánchez, Siyanova-Chanturia and Pellicer-Sánchez2019). The knowledge of collocations allows first language (L1) speakers to process language fluently (Siyanova-Chanturia & van Lancker, Reference Siyanova-Chanturia, van Lancker, Siyanova-Chanturia and Pellicer-Sánchez2019) and to fulfill different communicative and pragmatic needs (Bardovi-Harlig, Reference Bardovi-Harlig, Siyanova-Chanturia and Pellicer-Sánchez2019; Kecskes, Reference Kecskes, Siyanova-Chanturia and Pellicer-Sánchez2019). Thus, the knowledge of collocations is essential for L2 learners to reach high levels of proficiency (Bahns & Eldaw, Reference Bahns and Eldaw1993; Lewis, Reference Lewis2000) and to help learners communicate effectively (Hill, Reference Hill and Lewis2000). In addition, the knowledge of collocations is believed to foster both productive and receptive skills (Carter & McCarthy, Reference Carter and McCarthy1988), including reading comprehension (Kremmel et al., Reference Kremmel, Brunfaut and Alderson2017). Despite a central role of collocational knowledge in achieving fluent and successful communication in a L2, this linguistic phenomenon is acquired relatively slowly and is rarely mastered fully (Henriksen, Reference Henriksen, Bardel, Lindquist and Laufer2013). L2 learners differ in their use of collocations compared to L1 speakers (Nguyen & Webb, Reference Nguyen and Webb2017), both in terms of the type and amount of collocations used (Bahns & Eldaw, Reference Bahns and Eldaw1993; Granger, Reference Granger and Cowie1998; Laufer & Waldman, Reference Laufer and Waldman2011; Lorenz, Reference Lorenz1999; Serrano et al., Reference Serrano, Stengers and Housen2015). This evidence has led researchers to claim that collocational competence is particularly difficult for L2 learners. However, research has only partially supported this assumption (Schmitt, Reference Schmitt2010), with some studies suggesting that learners’ use of collocations may be similar to that of L1 speakers (Siyanova & Schmitt, Reference Siyanova and Schmitt2008, Study 1; Omidian et al., Reference Omidian, Beliaeva, Todd and Siyanova-Chanturia2017) and that they can be learnt at a rate similar to that of other aspects of lexical mastery (Pellicer-Sánchez, Reference Pellicer-Sánchez2017; Webb & Kagimoto, Reference Webb and Kagimoto2009).
Incidental learning of collocations from reading
Incidental learning has been defined as the learning of linguistic features that accrues as a by-product of language usage without explicit intention to learn (Schmitt, Reference Schmitt2010). Incidental learning is usually contrasted with intentional learning, when task instructions specifically ask learners to pay attention to the target items, and/or when learners are forewarned about the existence of vocabulary tests (Nation & Webb, Reference Nation and Webb2011).
Reading has been shown to be an important source of incidental vocabulary learning in a L1 (Freebody & Anderson, Reference Freebody and Anderson1983; Nagy et al., Reference Nagy, Herman and Anderson1985; Saragi et al., Reference Saragi, Nation and Meister1978) and L2 (Pellicer-Sánchez & Schmitt, Reference Pellicer-Sánchez and Schmitt2010; Waring & Takaki, Reference Waring and Takaki2003; Webb, Reference Webb2007; Zahar et al., Reference Zahar, Cobb and Spada2001). Although vocabulary research has traditionally focused on the acquisition of single words, recent years have seen an increase in the number of studies examining the acquisition of lexical items above the single word. Previous studies have shown that collocations can be intentionally learnt from different types of activities (Boers et al., Reference Boers, Demecheleer, Coxhead and Webb2014; Laufer, Reference Laufer2011; Laufer & Girsai, Reference Laufer and Girsai2008; Peters, Reference Peters2014; Webb & Kagimoto, Reference Webb and Kagimoto2009, Reference Webb and Kagimoto2011; see Pellicer-Sánchez & Boers, Reference Pellicer-Sánchez, Boers, Siyanova-Chanturia and Pellicer-Sánchez2019, for a review). However, the number of studies exploring the incidental acquisition of collocations is still scarce.
Webb et al. (Reference Webb, Newton and Chang2013) showed that reading-while-listening to a modified graded reader led to a significant increase in learners’ receptive knowledge of the form of the collocations. Sonbul and Schmitt (Reference Sonbul and Schmitt2013) extended these results to a reading-only context. They compared the effects of three learning conditions on the acquisition of adjective-noun collocations: 1) reading-only; 2) enhanced condition (reading a text with the target collocations enhanced); 3) and the decontextualized condition (target collocations embedded in activities). Results of the form recall and recognition post-tests showed that the reading-only condition led to a significant improvement in learners’ collocational knowledge (27% for recall gains and 21% for recognition gains), with a significant advantage of the enhanced condition over the reading-only condition in both recall and recognition tests (37% and 32%, respectively). Similarly, Pellicer-Sánchez (Reference Pellicer-Sánchez2017) examined learning of collocations from repeated exposure in a text. L2 learners in this study read one of two versions of a story containing six adjective-pseudoword collocations that appeared either four or eight times. One week after the reading, learners’ knowledge of the form, meaning, and collocation of the pseudowords were assessed. Results showed that reading led to a significant increase in learners’ collocational knowledge, with learners in both groups being able to recognize 40.5% of the target collocations and to recall around 10% of them. The positive effect of reading on the acquisition of collocations has also been reported for non-adjacent collocations. The presence of intervening words between the components of the collocations does not seem to affect learning, with both adjacent and non-adjacent collocations being learned in a similar way (Vilkaite, Reference Vilkaitė2017). Recent research has also shown that, when compared to other input modes, reading leads to similar gains to listening but to smaller gains than reading-while-listening (Webb & Chang, Reference Webb and Chang2020).
Less optimistic results were reported by Szudarski (Reference Szudarski2012). L2 learners were exposed to a set of target collocations repeated six times each in a reading-only condition or a reading plus condition (reading plus activities on collocational patterns). Results showed that the improvement in collocational knowledge experienced by the reading-only group was not significantly different from that experienced by the control group. Similarly, Szudarski and Carter (Reference Szudarski and Carter2016) compared the effects of reading-only and enhanced reading (i.e., reading condition with target words underlined) on the acquisition of verb-noun and adjective-noun collocations. Results showed that the reading-only condition did not improve learners’ collocational knowledge. Researchers have claimed that the often-low intake of collocations, and other formulaic sequences, from reading is learners’ failure to notice them in the input (Boers, Reference Boers and Webb2020). As Boers (Reference Boers and Webb2020) explains, L2 readers might not pay attention to formulaic sequences during reading if they consist of familiar words (e.g., do your homework) and when their meaning is transparent. Learners might attend to the part of the collocation that carries the most meaning, and the collocational patterning might be unnoticed (Boers, Reference Boers and Webb2020). In fact, empirical evidence suggests that L2 learners prioritize individual words over collocational patterning (Hoang & Boers, Reference Hoang and Boers2016). If learners mainly attend to the part of a collocation that carries the most meaning, learners would be expected to pay little attention to the known component in the known-unknown collocation type investigated in the present study.
Among the different factors affecting the incidental acquisition of new lexical items from reading, frequency of exposure, in particular, has received attention from vocabulary researchers. It is generally accepted that multiple encounters with collocations are needed for learners to develop collocational knowledge (Henriksen, Reference Henriksen, Bardel, Lindquist and Laufer2013; Hill et al., Reference Hill, Lewis, Lewis and Lewis2000). However, only a few studies to date have looked at the effect of frequency of exposure on the incidental acquisition of collocations, and the studies available have produced mixed results. Durrant and Schmitt (Reference Durrant and Schmitt2010) examined L2 learners’ acquisition of adjective-noun collocations under three different conditions (single exposure, repeated exposure in the same sentences, and repeated exposure in different sentences). These authors showed that both repetition conditions outperformed the single exposure condition, suggesting that just one extra exposure was enough to observe significantly higher gains. Webb et al. (Reference Webb, Newton and Chang2013) also found that repeated exposures (1, 5, 10, and 15) had a positive effect on the incidental learning of collocations from reading-while-listening, with 15 exposures needed for sizeable learning to occur. Their findings suggested that five extra exposures were also sufficient to lead to significantly higher gains (as reflected in the comparison between 5–10 and 10–15 exposures). In contrast, other studies reported that a higher number of exposures did not always lead to better results at various levels of collocational competence. Pellicer-Sánchez (Reference Pellicer-Sánchez2017) compared the acquisition of adjective-pseudoword collocations from four vs. eight exposures and reported no significant differences between the two conditions. Similarly, the study by Szudarski and Carter (Reference Szudarski and Carter2016) showed that encountering the target collocations more frequently (6 vs. 12 exposures) did not lead to higher gains.
Eye-tracking and incidental vocabulary learning from reading
Eye-tracking has been used to investigate the incidental acquisition of L2 vocabulary from reading. Recent studies have shown that, when L2 readers encounter unknown lexical items, they spend more time processing them than matched known words (Godfroid et al., Reference Godfroid, Boers and Housen2013; Mohamed, Reference Mohamed2018; Pellicer-Sánchez, Reference Pellicer-Sánchez2016). Number of encounters has a significant role in the processing of unknown words, with fixations and fixation durations decreasing as the number of exposures increases (Elgort et al., Reference Elgort, Brysbaert, Stevens and Van Assche2018; Godfroid et al., Reference Godfroid, Ahn, Choi, Ballard, Cui, Johnston, Lee, Sarkar and Yoon2018; Mohamed, Reference Mohamed2018; Pellicer-Sánchez, Reference Pellicer-Sánchez2016). The processing of unknown lexical items starts to approximate that of known, control items by the eighth encounter (Elgort et al., Reference Elgort, Brysbaert, Stevens and Van Assche2018; Pellicer-Sánchez, Reference Pellicer-Sánchez2016). These studies have also suggested a relationship between reading times on unknown words and vocabulary gains, with longer fixation durations linked to larger vocabulary gains (Godfroid et al., Reference Godfroid, Boers and Housen2013; Mohamed, Reference Mohamed2018; Pellicer-Sánchez, Reference Pellicer-Sánchez2016). Pellicer-Sánchez (Reference Pellicer-Sánchez2016) also showed that advanced L2 readers’ processing behavior was very similar to that of L1 readers, with the only difference being that the effect of frequency of exposure happened earlier for L1 readers than for L2 readers.
The above studies focused on the incidental acquisition of single words. To our knowledge, only one study to date has used eye-tracking to investigate incidental learning of collocations from reading. Choi (Reference Choi2017) examined the effect of textual enhancement on the processing and learning of lexical (e.g., big meal) and grammatical collocations (e.g., a bowl of cereal). Participants read a passage containing 14 target collocations under an enhanced (i.e., target collocations boldfaced) or unenhanced condition. Results showed longer total reading times and more fixations in the enhanced condition than in the unenhanced condition. Eye-movement data showed that participants spent more time and made more fixations on the target collocations that were unknown to them than on those collocations that they already knew, in line with previous studies with individual words (Godfroid et al., Reference Godfroid, Boers and Housen2013; Mohamed, Reference Mohamed2018; Pellicer-Sánchez, Reference Pellicer-Sánchez2016). Both conditions led to significant learning of target collocations, with the enhanced condition outperforming the unenhanced condition.
The present study
The review of the literature suggests a wealth of findings, but also a number of notable gaps. First, the mixed results of previous studies question the effectiveness of reading-only conditions for the incidental acquisition of L2 collocational knowledge (Szudarski, Reference Szudarski2012; Szudarski & Carter, Reference Szudarski and Carter2016) and the role of frequency of exposure in this process (Szudarski & Carter, Reference Szudarski and Carter2016; Pellicer-Sánchez, Reference Pellicer-Sánchez2017). Secondly, the majority of previous studies have used offline post-reading tasks. Thus, our understanding of the processing of the different components of novel collocations throughout repeated exposures in reading and of the effect that different amounts of exposure may have on the development of processing fluency is still limited. Moreover, the relationship between online reading behavior and collocation learning has not been examined yet. Finally, no research to date has explored how L2 processing patterns compare to those of L1 readers when encountering novel collocations in reading. The present investigation aimed to address these gaps by asking the following questions:
-
1. Does frequency of exposure (four vs. eight exposures) have an effect on the learning of new words and their collocates from L1 and L2 reading?
-
2. How are novel collocations read throughout repeated exposures in L1 and L2 reading?
-
3. Are there any differences between the processing of novel collocations encountered four times versus those encountered eight times in L1 and L2 reading?
-
4. Is there a relationship between the online processing of novel collocations and learning, as measured by offline tests?
In order to address these questions, L1 and L2 speakers were asked to read a text containing novel adjective-pseudoword collocations (e.g., magic salp) while their eye movements were recorded and to complete a battery of tests assessing their knowledge of the pseudowords (nodes) and their collocates. Eye movements to the components of the collocations throughout the repeated encounters in the text were examined. The effect of frequency of exposure was also explored by comparing the learning and processing of novel collocations after having encountered them four versus eight times in reading. A maximum of eight exposures were used as most studies have shown that considerable gains are achieved after 8–10 exposures. This was also the maximum number of exposures deemed possible given the length and duration of the experiment. The minimum number of repetitions was four to ensure that some learning could still take place, as research has shown that one or two exposures might not lead to detectable gains. Participants were randomly assigned to one of three conditions (Target8: eight occurrences of target collocations, Target4: four occurrences of target collocations, and Control: eight occurrences of control collocations). The combination of offline data (vocabulary post-tests) and eye-movement data allowed us to examine not only whether novel adjective-pseudoword combinations could be learnt from reading but also how the attention paid to the novel collocations (and their components) changed with repeated encounters, and whether the potential improvement in the processing speed differed after having seen the items four versus eight times. The combination of methods also allowed us to examine, for the first time, whether reading times on novel collocations predict their learning.
Method
Participants
Fifty-two L1 speakers of English (47 females; age range 18–20, M = 19, SD = 0.7) and 60 L2 learners of English (45 females, age range 19–39, M = 26.5, SD = 4.2) took part in the study. L1 participants were full-time undergraduate students at a university in the UK and received course credit, while L2 participants were post-graduate students at the same institution and received a small compensation. The L2 speakers of English, who came from a range of L1 backgroundsFootnote 1 , were advanced learners who had met the English language entry requirement to study in the above institution. On average, these participants had spent 27.43 months in an English-speaking country, including their time in the UK (range in months 2–132, SD = 23.2l; descriptive statistics by group are presented in the Supplementary materials S1). Prior to the experiment, the L2 participants completed a self-rating English proficiency test (Reading: M = 8.2, SD = 1.2; Writing: M = 7.6, SD = 1.3; Listening: M = 7.9, SD = 1.2; Speaking: M = 7.4, SD = 1.5). Statistical analysis revealed that there were no significant differences between the three conditions (Target8, Target4, Control) in the proficiency self-ratings, age of first contact with English, number of years living in an English-speaking country, and number of years learning English (p > .1, inferential statistics are presented in Supplementary materials S2). The research was carried out fulfilling ethical requirements in accordance with the standard procedures at the university where the experiment took place.
Target items
Because the study involved L1 and proficient L2 speakers of English, it was decided that collocations containing pseudowords would best allow us to investigate incidental learning of novel vocabulary from reading without needing to control for previous knowledge. Specifically, the study focused on adjective-pseudoword (pseudonoun) collocations. We were interested in examining the processing and learning of collocations in which the node was unknown, and the adjective was known to the participants.
First, a provisional pool of 63 pseudowords (varying in length and number of syllables) was selected from the ARC Nonword Database (http://www.cogsci.mq.edu.au/research/resources/nwdb/nwdb.html). They were selected based on the following criteria: neighborhood size (min = 1, max = 5), number of body neighbors (min = 1, max = 5), and number of phonological neighbors (min = 1, max = 5). In addition, no pseudohomophones were used, and only orthographically existing onsets and orthographically existing bodies, and only legal bigrams were extracted. Second, the pool of pseudowords was piloted with L1 speakers of English. Fifteen L1 speakers of English were asked to rate 63 pseudowords intermixed with 12 low-frequency real words (e.g., burlap, scab, churn) on a six-point Likert scale according to how English-like, or real word-like, their form was (1 = very unlikely to be an English word, and 6 = very likely to be an English word). Based on the scores provided, we selected six pseudowords whose mean score was at least 4 (trobe, redaster, salp: M = 4; blaunts: M = 4.5; glabe, nuse: M = 5). These items were thus judged as plausible English words in terms of their form.
As a second step, ten L1 speakers of English (not involved in the above procedure) were asked to rate the six pseudowords intermixed with seven low-frequency words (e.g., stasis, vagary, aegis) and seven other pseudowords on a six-point Likert scale according to how likely the connection between the item and a given meaning was (1 = very unlikely that this is the meaning of the pseudoword, and 6 = very likely that this is the meaning of the pseudoword). All target pseudowords had a mean score below 3 (glabe: M = 1.5; trobe: M = 2.8; redaster, blaunts: M = 2; nuse: M = 2.5; salp: M = 1.8), suggesting that there were no apparent connections between the form of the pseudowords and the meaning we attached to them.
The six pseudowords were used to replace six high-frequency real nouns in a story, which were the items for the control condition. The real nouns and the pseudowords were of the same length (in characters and syllables). Finally, we searched for common collocates (adjectives) of the nouns replaced, ensuring that the adjectives were sufficiently common (Table 1), the resulting collocations were sufficiently frequent (frequency of 13 or above occurrences in the British National Corpus) and statistically significant (Mutual Information score of 3 or above)Footnote
2
, and that the forward (adjective
 $$ \to $$
noun) and backward association strength (noun
$$ \to $$
noun) and backward association strength (noun
 $$ \to $$
adjective) was comparable (the Edinburgh Associative Thesaurus database was used, http://www.eat.rl.ac.uk/). The resulting pseudo- and control collocations contained the same adjective and were identical in length (Table 2).
$$ \to $$
adjective) was comparable (the Edinburgh Associative Thesaurus database was used, http://www.eat.rl.ac.uk/). The resulting pseudo- and control collocations contained the same adjective and were identical in length (Table 2).
The pseudowords, control words, collocates, and their characteristics

a Frequency band: 1K = first 1,000 most frequency words in the corpus; 2K = first 2,000 most frequent words in the corpus.
The resulting pseudo-collocations, control collocations, and their characteristics

Reading materials
The target and control collocations were inserted in a story previously designed and piloted by Pellicer-Sánchez (Reference Pellicer-Sánchez2016). This story was originally created to examine the incidental learning of six nouns repeated eight times throughout the story. For the purpose of the present study, those nouns were replaced by the adjective-pseudoword collocations. We kept the original meanings of the replaced words but selected a new set of better-controlled pseudowords and added the adjectives. Three versions of the original story were created. Two versions contained eight and four occurrences of the six pseudo-collocations, respectively (henceforth, Target8 and Target4 conditions). The third, control version contained eight occurrences of the six control collocations (henceforth, Control condition). The target collocations and their exposures were spread evenly across the text in the three versions. Minor changes were made to the original story to make sure that the collocations fitted in the context. The three versions of the story were 2,265 (Target4) and 2,324 (Target8 and Control) words in length. They were presented on a computer screen in black over white background. The text was presented in Courier New font, size 18, with double spacing, across 25 screens; the text presented on each screen was of a similar length (eight lines, between 76–104 words). Each screen contained a maximum of two (different) pseudo-collocations. No target item appeared at the beginning or at the end of a line or a sentence (Rayner, Reference Rayner1977).
All words in the three versions of the story were from the first 4,000 most frequent words in English, except for the six target pseudowords, and three lower-frequency words (someday, downstairs, and forever). This meant a 2.2% of unknown words in versions Target8 and Control and a 1.2% in version Target4. Given the advanced level of proficiency of learners, it was assumed that they would be familiar with the first 4,000 most frequent words in English, ensuring a lexical coverage of about 98%. A true-false comprehension test containing 12 statements assessed participants’ general comprehension of the story. None of the target items appeared in the comprehension questions. (Text for Target8 and Target4 versions available at http://www.iris-database.org and in the Supplementary materials S3 and S4).
Post-reading tests
Five vocabulary tests were used in the present study to assess the knowledge of the form and meaning of the pseudowords and their collocates. The tests were taken from Pellicer-Sánchez (Reference Pellicer-Sánchez2017) and modified by replacing the target items with the ones developed for the present study. The first test assessed participants’ ability to recognize the form of the pseudoword from a set of four options provided. The second test measured participants’ ability to recall the meaning of the pseudowords and was conducted by means of personal interviews (see Procedure section). Participants’ ability to recognize the meaning of the target pseudowords was assessed in a multiple-choice test that presented the correct meaning of the target item and three options. An “I don’t know option” was included in the recognition tests to minimize guessing effects. The distractors were all from the same word class and were semantically related to the content of the story to make them plausible options. The fourth test assessed participants’ ability to recall the correct collocate of the target pseudowords and was conducted by means of interviews (see Procedure section). The last test assessed participants’ ability to recognize the correct collocate from a set of five options (the correct collocate, three distractors, and an “I don’t know” option). The distractors had the same word class and were all semantically related to the content of the story, to make the discrimination only possible when learners could recognize the collocate (vocabulary recognition tests available at http://www.iris-database.org and in the Supplementary materials S5). Having separate tests assessing knowledge of the pseudowords and the collocates allowed us to examine whether with this type of known-unknown combinations, readers would learn only the form and meaning of the pseudonouns or would also learn the form of collocates that appeared with those pseudonouns.
Procedure
The participants were randomly assigned to one of the three conditions (Target8, Target4, Control). Participants’ eye movements (monocular recording, left eye) were monitored using a desktop-mounted, EyeLink 1000 Plus eye-tracker (SR Research, Canada), which samples data at 1000 Hz, with an accuracy of 0.25–0.5°, and a precision < 0.01°. Participants’ head movements were minimized using a head rest. The experiment took place individually in a psycholinguistic laboratory. At the beginning of the session, L2 participants completed a language background questionnaire. The task was explained to the participants, and they were asked to read the story for comprehension in their most natural way. They were made aware of the comprehension questions that followed but were not informed about the presence of pseudowords in the story, or about the five vocabulary tests. The experiment started with a practice session (a five-page text and four True/False comprehension questions) to familiarize participants with the procedure. A nine-point calibration took place before and after the practice session and halfway through the experiment. Drift correction was performed before each screen.
Participants pressed the “Enter” key to proceed from one screen to the next. They could not go back to previously read screens. After reading the story, participants responded to the True/False comprehension questions by pressing the “yes” or “no” buttons on the keyboard. Participants then completed the five vocabulary tests in the following order: pseudoword form recognition, pseudoword meaning recall, pseudoword meaning recognition, collocate recall, and collocate recognition. The form recognition, meaning recognition, and collocate recognition tests were completed individually on paper. The meaning recall and collocate recall tests were conducted by means of an interview. The researcher showed the participants cards with one pseudoword at a time and invited them to say everything they could remember about their meaning (in the meaning recall test) and about the adjectives or any other words that frequently occurred with the pseudowords (in the collocate recall test). The experiment took about 45 minutes to complete in conditions Target8 and Target4, and about 30 minutes in Control condition, as the latter did not involve the vocabulary post-tests.
Analysis
A score of 0 was given for incorrect responses and 1 for correct responses in the five vocabulary tests. Results of the two recall tests (pseudoword meaning recall and collocate recall) were scored following a strict procedure which did not give credit for partial knowledge. This was deemed important considering the small number of items. Only those instances where the expected response was provided were scored as correct. For example, if the word pottery was provided for the pseudoword nuse (“bowl”), it was considered incorrect, even though participants had shown a certain degree of semantic knowledge. The analysis of the offline measures included data from 31 L1 speakers (Target8 = 16, Target4 = 15) and 40 L2 speakers (Target8 = 20, Target4 = 20) (as participants in the control condition did not complete the vocabulary tests).
Regarding the eye-movement data, data from 41 L1 participants (Target8 = 12, Target4 = 14, Control = 15) and 45 L2 participants (Target8 = 15, Target4 = 15, Control = 15) were included in the analysisFootnote 3 . In addition, fixations shorter than 70 ms and longer than 1000 ms in any of the target and control adjectives and pseudowords were discarded. The data cleaning procedure resulted in 3.18% (or 115 data points) of L1 data, and 4.37% (or 228 data points) of L2 data being discarded. The lost data were equally distributed across the three conditions (p > .1). This produced a total of 3432 data points; 696 in the Target4 condition, 1296 in the Target8 condition, and 1440 in the Control condition.
The six adjective-pseudoword collocations in the Target8 and Target4 conditions and the six adjective-noun collocations in the Control condition were set as interest areas for the analysis. Following the approach suggested by Carrol and Conklin (Reference Carrol and Conklin2015), analyses were conducted with both the whole adjective-pseudoword combination as interest areas and with each component of the combination as a separate interest area. Examining the processing of each component allowed us to find out whether any potential decrease in reading times and number of fixations with subsequent exposures of a collocation was driven by either component (the noun/pseudoword or the adjective collocate) or generally distributed over both. The eye-movement measures of interest were as follows: First Fixation Duration (the duration in milliseconds of the first fixation falling on an interest area); First-Run Reading Time (the sum of all fixation durations in milliseconds the first time an interest area was fixated, before exiting the region. This measure is often also called first-pass reading time, when it refers to a string longer than one word, and gaze duration, when it refers to one word in text); Total Reading Time (the sum of all fixation durations in milliseconds on the interest areas); and Fixation Count (the number of fixations on an interest area; Conklin et al., Reference Conklin, Pellicer-Sánchez and Carrol2018; Siyanova-Chanturia, Reference Siyanova-Chanturia2013). First, Fixation Duration and First-Run Reading Time were chosen as early eye-movement measures that reflect lexical decoding processes. They provide information about learners’ efforts to recognize and retrieve words from their lexicons. Total Reading Time and Fixation Count were chosen as aggregate late eye-movement measures that reflect word-to-text integration. As observed in previous vocabulary learning studies (e.g., Elgort et al., Reference Elgort, Brysbaert, Stevens and Van Assche2018; Pellicer-Sánchez, Reference Pellicer-Sánchez2016), a decrease in both early and late measures was expected as a function of exposure.
The eye-tracking data were analyzed via linear mixed-effect model run in R v3.6.1 (R Core Team, 2019), using the lme4 package v1.1-21 (Bates et al., Reference Bates, Maechler, Bolker and Walker2015). The random structure for models fitted to the whole dataset included random intercepts and random slopes for participants within exposure; the random slopes were dropped to simplify the structure and ensure convergence when subsetting the data by word class. Data from the vocabulary tests were analyzed via binary logistic regressions using the base-R stats package. Post hoc comparisons were performed with the emmeans package v1.6.0 (Lenth, Reference Lenth2021).
Results
Both L1 and L2 participants showed adequate comprehension of the story (L1 speakers: M = 11, SD = 1.15; L2 speakers: M = 11.1; SD = 0.99, Max = 12). There were no significant differences in the comprehension scores between L1 and L2 participants. Below, we first report on the analysis and results of the vocabulary test data and then the eye-tracking data.
Vocabulary tests
We first investigated whether significant differences existed between participant groups (L1 vs. L2) and between reading conditions (Target8 vs. Target4) in terms of participants’ scores in the five vocabulary tests (pseudoword form recognition, pseudoword meaning recall, pseudoword meaning recognition, collocate recall, and collocate recognition). Table 3 presents the descriptive statistics for each of the five vocabulary measures.
Post-reading vocabulary test scores for L1 and L2 speakers across the two frequency conditions (Target8 and Target4)

a Max score = 6
A binary logistic regression was fitted to each vocabulary measure to test for the main effects of and interactions between participant group and condition. Table 4 shows significant main effects of participant group for all measures pertaining to the pseudonouns, but not the collocates, with scores of L2 speakers being significantly lower than those of L1 speakers. Importantly, reading condition did not appear to directly affect learning outcomes.
Summary of the binary logistic regressions to the 0–1 learning outcome measures using participant group (L1 vs. L2 speakers) and frequency condition (Target8 vs. Target4) as predictors

Eye-movement data
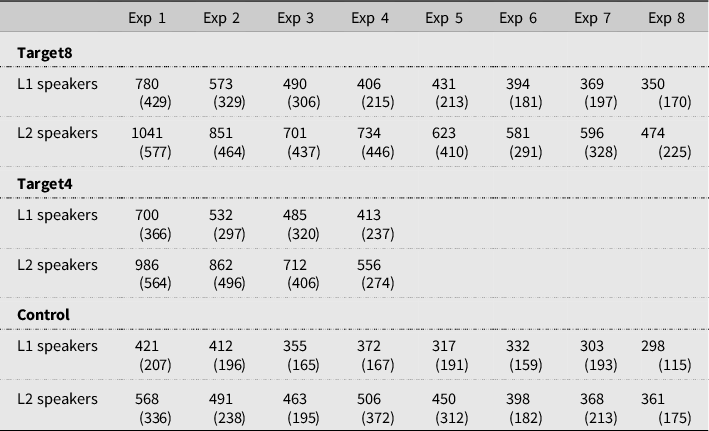
Analyses of the eye-tracking data were conducted first on the collocation (adjective + pseudoword) as a single interest area. Table 5 presents descriptive statistics for total reading time on the target and control collocations (Descriptive statistics for the remaining measures are included in the Supplementary materials S6).
Total reading time – Means (in ms) for the whole collocation for all conditions and each of the exposures (SD in brackets)
The Total and First-Run Reading Time measures, as well as the First Fixation Duration measure, displayed the typical gamma distribution generally observed in eye-tracking (and, more generally, response-time) data. For this reason, these were log-transformed, achieving good residual normalization (one of the assumptions of linear mixed models). An initial maximal model was fitted with main effects of and interactions between participant group (L1 speakers vs. L2 speakers), condition (Target8, Target4, Control – with Control condition dummy-coded as baseline), and exposures (1-8 for Target8 and Control conditions, 1-4 for Target4 condition, with exposure 1 dummy-coded as baseline). The random structure included random intercepts and random slopes for exposure within participant, to account for potential between-subject differences in the rate of the predicted decrease in reading time with subsequent presentations of a collocation. Type III ANOVA with Satterthwaite approximation (Satterthwaite, 1946) was then run on the models to obtain omnibus statistics for the effects of the factors of interest. These results are presented in Table 6.
F and chi-square statistics for the effects and interactions from the maximal model fitted to Total Reading Time, First-Run Reading time, First Fixation Duration, and Fixation Count for the whole collocation. Effect sizes (η2p and Cramer) and their 90% confidence intervals are also provided for significant effects and interactions

As expected, the results in Table 6 showed a main effect of participant group for Total Reading Time, First-Run Reading Times, and First Fixation Durations, with L2 speakers having longer reading times and fixation durations. These measures were also found to decrease as a function of exposure. A significant main effect of condition was found for all measures except First Fixation Duration, showing slower reading in conditions Target8 and Target4 relative to the control condition across exposures. Importantly, a significant interaction between condition and exposure was also found for Total Reading Time and Fixation Count. Post hoc comparisons with Holm correction for multiple comparisons were performed on the interaction between condition and exposure. Given a large number of comparisons, we focus here on the comparisons at the initial and final exposures, that is, between the three conditions at the first and fourth exposures, between conditions Target8 and Control at the last (eighth) exposure, and between the last exposures in each condition (i.e., fourth in Target4 vs. eighth in Target8 vs. eighth in Control). These findings indicated a rapid habituation to the collocations in both Target8 and Target4 conditions (see Figure 1). As expected, at the first encounter, participants read control collocations faster than the pseudo-collocations in Target8 (Total Reading Time: β = −0.61, SE = 0.07, z = −7.98, p = < .001; Fixation Count: β = −1.64, SE = 0.27, z = −5.92, p = < .001) and Target4 (Total Reading Time: β = −0.52, SE = 0.07, z = −6.96, p = < .001; Fixation Count: β = −1.17, SE = 0.27, z = −4.33, p = .003) conditions. None of the comparisons at the fourth exposure were significant. Comparisons of the final presentation of the collocations in the three conditions showed that most of the comparisons were not significant either, suggesting that by the last exposure (eighth in conditions Target8 and Control, and fourth in condition Target4), novel adjective-pseudoword collocations were read in a similar way to control combinations, regardless of the condition. The comparisons at the final exposure also showed that target collocations were read in a similar way after having seen them four or eight times. The only difference was in Total Reading Time. The Total Reading Time for the collocations at the fourth exposure in condition Target4 was longer than the last (eighth) exposure of the control condition (β = 0.33, SE = 0.07, z = 4.41, p = .002). Total Reading Time also yielded significant differences between conditions Target8 and Control at exposures 5, 6, and 7, only converging at exposure 8 (Figure 1).
Interaction Between Condition (Target8, Target4, vs. Control) and Exposure (1–8) for the Total Reading Time (log) Measure for the Whole Collocation. Bars Indicate 95% Confidence Intervals.

The subsequent analyses aimed at exploring the processing of each component of the collocations. The eye-tracking measures were recomputed for the two words in each collocation as distinct interest areas. Given the similar patterns observed for Total Reading Time and Fixation Count (Figure 1), for this second set of analyses the models were only fitted to Total Reading Time and First-Run Reading time as a late and early measure of reading, respectively.
An initial model was fitted to the dependent variables with participant group (L1 speakers vs. L2 speakers), condition (Target8, Target4, Control – with Control condition dummy-coded as baseline), word class (Noun vs. Adjective), and exposure (1-8 for conditions Target8 and Control, 1-4 for condition Target4, with exposure 1 dummy-coded as baseline) as fixed effects with all interactions modeled. The random structure included random intercepts for the specific target words (e.g., “redaster” or “wooden”), to allow for the possibility that different words may be read differently at the first presentation, as well as random slopes for the effect of exposure within subject, to account for the possibility that Total Reading Time might change differently across subsequent presentations between participants. This model revealed a number of significant effects and interactions (presented in Table 7), including a three-way interaction between condition, word class, and exposure for both Total Reading Time and First-Run Reading Time.
F statistics for the effects and interactions from the model fitted to Total Reading Time and First-Run Reading Time including word class as a fixed factor. Effect sizes (η2p) and their 90% confidence intervals are also provided for significant effects and interactions

In order to more easily interpret the observed three-way interactions and remove word class as a factor, the dataset was split by word class. However, given the smaller size of the resulting datasets, a model with a simpler random structure (with only random intercepts for each target word and for each participant) and excluding the fixed effect of word was fitted to the data. Table 8 reports the results of these models for both dependent variables and word classes. For the adjectives (Table 8), the main effect of condition revealed that total reading times, averaged across exposures and participant groups, were significantly longer in the target conditions than in the control condition (for both Target8, t(1927) = 8.45, p < .0001, and Target4, t(881) = 5.17, p < .0001), but that they did not differ between Target8 and Target4, t(1236) = 1.45, p = 0.1. The most notable effect was a significant interaction between participant group and exposure for the First-Run Reading Time measure, showing a steeper decrease across subsequent presentations but never catching up to the L1 speakers, who were already significantly faster than L2 speakers at baseline (Figure 2). The interaction between condition and exposure was not significant, indicating that the decrease in reading times across exposures did not differ by condition.
F statistics for the effects and interactions from the model fitted to Total Reading Time and First-Run Reading Time for the adjective and the noun/pseudonoun data. Effect sizes (η2p) and their 90% confidence intervals are also provided for significant effects and interactions

Interaction Between Participant Group (L1 vs. L2) and Exposure (1–8) for the First-Run Reading Time (log) Measure for the Adjectives. Shaded Areas Indicate 95% Confidence Intervals.

For the nouns/pseudonouns (Table 8), the pattern of results was more complex, with significant interactions between condition and exposure for both measures and a three-way interaction for Total Reading Time. Post hoc comparisons on this interaction showed that, at baseline (first exposure), reading times for control nouns (Control condition) were significantly shorter than for target pseudonouns for both participant groups in the Target8 (L1 speakers: β = −0.77, SE = 0.12, z = −6.32, p = <.0001; L2 speakers: β = −0.66, SE = 0.11, z = −5.77, p = <.0001) and Target4 (L1 speakers: β = −0.68, SE = 0.11, z = −5.78, p = <.0001; L2 speakers: β = −0.70, SE = 0.11, z = −6.06, p = <.0001) conditions, but that reading times on pseudonouns did not differ between Target4 and Target8 conditions. By the fourth exposure, reading times on the nouns did not differ between any of the conditions for L1 speakers, but for L2 speakers, reading times remained significantly different between Target8 and Target4 conditions (β = −0.25, SE = 0.09, z = −2.69, p = .02), as well as between Target8 and Control (β = −0.54, SE = 0.11, z = −4.66, p = <.0001) and between Target4 and Control (β = −0.28, SE = 0.11, z = −2.43, p = .04) (see Figure 3). At the last exposure, L2 speakers spent longer time reading pseudonouns in Target8 condition than the control nouns (β = −0.29, SE = 0.11, z = −2.50, p = .03). None of the other comparisons were significant. First-Run Reading Time showed a similar pattern (Figure 4).
Interaction Between Participant Group, Exposure, and Condition (Control vs. Target8 vs. Target4) for Total Reading Time (log) for the Noun/Pseudonoun Components of Collocations. Bars Indicate 95% Confidence Intervals.

Interaction Between Participant Group, Exposure, and Condition (Control vs. Target8 vs. Target4) for First-Run Reading Time (log) for the Noun/Pseudonoun Components of Collocations. Bars Indicate 95% Confidence Intervals.

Lastly, we explored whether reading patterns across multiple exposures to the adjective and noun parts of the collocations could predict participants’ learning accuracy for the form and meaning of the collocations. Because different outcomes relate to learning of different parts of the collocations (i.e., adjective collocate or pseudoword), the analyses were run by word class (i.e., noun vs. adjective). A cumulative reading time measure was computed by adding together the total reading times of all exposures to each target pseudoword or adjective and was used as a predictor, together with participant group, in a series of binary logistic regressions (since the data from individual trials were not used, and given the overall smaller number of data points, a regression was preferred to a linear mixed-effect model in this case). Log-transforming the reading time measure did not change the pattern of results, so the model presented here (Table 9) was fitted using the cumulative reading time measure in its natural scale (ms) for ease of interpretation. Across all other learning outcome variables, modeling an interaction between the predictors did not improve model fit, and only participant group was found to produce significant effects. Globally, these results show a lower learning performance for the L2 group compared to L1 speakers, but cumulative reading time did not significantly predict these differences.
Summary of the binary logistic regression models fitted to the 0–1 learning outcome measures using cumulative reading time and participant group (L1 vs. L2) as predictors

General discussion
In the present investigation, we combined recordings of eye movements and a battery of post-reading vocabulary tests to examine the learning and processing of novel collocations in L1 and L2 reading, as well as the effect of frequency of occurrence on this process.
In response to the first research question (Does frequency of exposure have an effect on the learning of new words and their collocates in L1 and L2 reading?), our findings provided evidence that both L1 and L2 speakers can acquire knowledge of both new words and their collocates incidentally from repeated exposures in reading, in line with previous research (Pellicer-Sánchez, Reference Pellicer-Sánchez2017; Sonbul & Schmitt, Reference Sonbul and Schmitt2013). We found that not only did L1 and L2 readers acquire knowledge of the form and meaning of new words they encountered while reading, but they also gained knowledge of their recurring collocates. As expected, recognition scores were higher than recall scores, again, akin to previous studies on collocation learning (Pellicer-Sánchez, Reference Pellicer-Sánchez2017; Peters, Reference Peters2016; Szudarski, Reference Szudarski2012; Webb et al., Reference Webb, Newton and Chang2013). The results of this study have shown that, overall, L1 speakers could recall 39% of the correct collocates (Target8 = 41%; Target4 = 37%), while L2 learners were able to recall 27% (Target8 = 32%; Target4 = 23%). These recall figures are in line with those reported by Sonbul and Schmitt (Reference Sonbul and Schmitt2013) for advanced L2 learners (27%) and higher than those reported in Pellicer-Sánchez (Reference Pellicer-Sánchez2017) for intermediate L2 learners (11%). The recognition knowledge acquired by the L2 participants in this study is also higher than that reported in previous studies on incidental collocation learning, which ranged from 21 % (Sonbul & Schmitt, Reference Sonbul and Schmitt2013) to around 50% (Pellicer-Sánchez, Reference Pellicer-Sánchez2017; Webb et al., Reference Webb, Newton and Chang2013). The comparison of the present results with those of Pellicer-Sánchez (Reference Pellicer-Sánchez2017) suggests a proficiency effect, with the more advanced learners in the current study achieving higher gains. The results of the offline measures have also shown that the scores are significantly lower for L2 speakers than for L1 speakers. Importantly, the lack of a main effect of condition on the vocabulary scores across both participant groups questions the effect of frequency of exposure on incidental learning of collocations. This is in line with the results of Pellicer-Sánchez (Reference Pellicer-Sánchez2017) and Szudarski and Carter (Reference Szudarski and Carter2016) but is contrary to other studies that have shown a significant effect of exposure (Durrant & Schmitt, Reference Durrant and Schmitt2010; Webb et al., Reference Webb, Newton and Chang2013). This shows that increased exposure does not necessarily improve learning, at least when the difference between the number of exposures is relatively small (i.e., four vs. eight). The differences between the results of this study and those of earliest studies, both in terms of the benefits of reading and the effect of frequency of exposure, are likely due to the different nature of the target lexical items selected, the different assessment instruments used, the different number of exposures provided (ranging from 1 vs. 2 exposures in Durrant & Schmitt, Reference Durrant and Schmitt2010, to 15 exposures in Webb et al., Reference Webb, Newton and Chang2013), and the length of the reading task. A longer reading text and a different number of target items might have revealed a significant effect of frequency.
In response to the second research question (How are novel collocations read throughout repeated exposures in L1 and L2 reading?), the analyses of the whole collocations showed that at the first encounter, both L1 and L2 speakers read novel collocations more slowly than controls, in line with previous studies with single words in L1 and L2 contexts (Chaffin et al., Reference Chaffin, Morris and Seely2001; Godfroid et al., Reference Godfroid, Boers and Housen2013; Pellicer-Sánchez, Reference Pellicer-Sánchez2016) and with L2 collocation studies (Choi, Reference Choi2017). After the first exposure, there was a decrease in the number and durations of fixations across subsequent exposures, also supporting the findings of previous studies with single words (Elgort et al., Reference Elgort, Brysbaert, Stevens and Van Assche2018; Godfroid et al., Reference Godfroid, Ahn, Choi, Ballard, Cui, Johnston, Lee, Sarkar and Yoon2018; Mohamed, Reference Mohamed2018; Pellicer-Sánchez, Reference Pellicer-Sánchez2016). Differences in the processing of target and control collocations started to disappear by the fourth exposure in some of the measures analyzed. By the eighth exposure, target collocations were read in a similar way to control collocations.
Interesting differences emerged regarding the manner in which the collocation components were processed. Results showed that L1 and L2 speakers read both the pseudonoun and the adjective, but processing patterns differed. Concerning the processing of the node of the collocation – the pseudowords – results were similar to the patterns reported for the whole collocation. At the first encounter, readers took longer to process the pseudowords in Target8 and Target4 conditions than the control words. There was a significant decrease in the number and durations of fixations after this first exposure. By the fourth exposure, there were no differences across conditions for L1 speakers, while L2 speakers still took longer to process them than control words (in line with Pellicer-Sánchez, Reference Pellicer-Sánchez2016). Interestingly, by the eighth encounter, L2 speakers still processed the pseudowords in Target8 condition more slowly than control words (and almost at significance level when comparing the last exposures in Target8 and Target4 conditions). This is interesting as it goes against previous research showing no difference between the processing of target and control words by the eighth encounter (Elgort et al., Reference Elgort, Brysbaert, Stevens and Van Assche2018; Pellicer-Sánchez, Reference Pellicer-Sánchez2016). The potential attempts to link the pseudowords with their collocates, as reflected in the collocate tests, might have interfered with the processing, slowing down the processing of the pseudoword. It might be the case that L2 readers might need more exposures to develop this speed and processing fluency when novel words are accompanied by a collocate.
Importantly, when examining the processing of the adjective collocate, results showed that readers spent more time processing the adjectives in Target8 and Target4 conditions than in the control condition. This suggests that readers paid attention to the collocate, not only to the unknown component, and that more attention was paid to the adjective when it appeared as part of an unknown collocation than when it was part of a known combination. This might reflect attempts to integrate the collocate to the pseudonouns in Target8 and Target4 conditions. Crucially, as suggested by the lack of interaction between condition and exposure, the decrease in reading times did not differ by condition. This analysis also showed that the component that was driving the significant interaction between condition and exposure in the analysis of the whole collocation was the pseudoword and provides further evidence for the need to look at individual collocation constituents as well as at the entire sequence in eye-tracking studies (Carrol & Conklin, Reference Carrol and Conklin2015; Jiang et al., Reference Jiang, Jiang and Siyanova-Chanturia2020).
Interestingly, few differences were observed in the processing patterns of L1 and L2 speakers. As reported above, L2 speakers were generally slower when processing the whole collocations, and their reading times on target pseudonouns by the eighth exposure were still longer than those on control words. The lack of other differences between the two participant groups could be due to the advanced proficiency of the L2 group, as well as to the experimental materials used. A more challenging text and a larger number of target items might have yielded other significant differences.
In response to the third research question (Are there any differences between the processing of novel collocations encountered four times versus those encountered eight times in L1 and L2 reading?), results showed that target collocations (and the pseudowords) were processed in a similar way after being seen eight times (Target8 condition) and four times (Target4 condition), as revealed in the comparison of the last exposure in both conditions. This suggests that the frequency manipulation in the present study (four vs. eight) did not seem to make a difference in the development of speed and fluency with which the new items were read. This conclusion, based on the analysis of the online data, is further supported by the lack of frequency effect found in the analysis of the offline post-reading test data. This further supports recent claims in the literature that the number of encounters is not the only, or the major, factor known to affect incidental vocabulary learning from reading, as other factors such as relevance, salience, and distribution, also play a role (e.g., Laufer & Rozovski-Roitblat, Reference Laufer and Rozovski-Roitblat2015; Szudarski & Carter, Reference Szudarski and Carter2016; Webb & Chang, Reference Webb and Chang2015). In their meta-analysis, Uchihara et al. (Reference Uchihara, Webb and Yanagisawa2019) showed that the significant effect of frequency of exposure on incidental vocabulary learning was moderated by learner (age, vocabulary knowledge), treatment (spaced learning, visual support, engagement, range in number of encounters), and methodological (nonword use, forewarning of upcoming comprehension test, vocabulary test format) variables. The use of pseudowords as the node of a collocation, as well as the salience of the repeated items in a short treatment, is likely to have moderated the effect of frequency in the present study. It is important to note, though, that a different frequency manipulation (e.g., 2 vs. 8, or 4 vs. 10) might have yielded significant effects of frequency. Different frequency manipulations should thus be explored in future research.
Finally, in response to the fourth research question (Is there a relationship between the online processing of novel collocations and learning, as measured by offline tests?), the results of the present investigation revealed no significant relationship between the processing of collocations and learning gains for any of the participant groups. This finding goes against the results of previous studies with single words which indicated that increased attention to target items was positively related to learning gains (Godfroid et al., Reference Godfroid, Boers and Housen2013; Godfroid et al., Reference Godfroid, Ahn, Choi, Ballard, Cui, Johnston, Lee, Sarkar and Yoon2018; Mohamed, Reference Mohamed2018; Pellicer-Sánchez, Reference Pellicer-Sánchez2016). However, it is in line with results of the study by Elgort et al. (Reference Elgort, Brysbaert, Stevens and Van Assche2018) which also failed to find a reliable relationship. This lack of connection between reading times on words and vocabulary scores also supports the findings of studies in other vocabulary learning contexts (e.g., Bisson et al., Reference Bisson, Van Heuven, Conklin and Tunney2015). While several incidental vocabulary learning studies have reported a positive relationship between longer reading times and improved performance in vocabulary tests, other studies have shown that longer reading times were connected to lower vocabulary scores, with longer reading times representing processing difficulties (Montero Perez et al., Reference Montero Perez, Peters and Desmet2015). Results of this study provide further evidence for the complexity of the relationship between eye movements and performance measures (Pellicer-Sánchez, Reference Pellicer-Sánchez2020), and the possibility that the number and duration of fixations on novel lexical items may reflect different subprocesses (Godfroid et al., Reference Godfroid, Ahn, Choi, Ballard, Cui, Johnston, Lee, Sarkar and Yoon2018), calling for further research in the area.
While the results of this study are novel in that they address a notable gap in the literature, it is important to note that they are primarily applicable to one type of collocation – adjective-noun collocations where the adjective collocate is known and the noun is unknown. The online processing and learning of items of different characteristics (e.g., different parts of speech, both vs. one unknown component, idiomatic vs. literal meaning) may show a different pattern. Future research should thus explore the effect of exposure on the learning and processing of different types of word combinations. Notably, the use of pseudowords in place of high-frequency real words (as in the present study) might mean that, when encountering the pseudowords, participants accessed the meaning of the high-frequency word against their existing collocational knowledge. The knowledge demonstrated in the test might then be a reflection of the knowledge acquired from reading, as well as of the existing collocational knowledge of the high-frequency word. Exposure to the pseudowords in the first three tests could have also prompted knowledge of the collocates that was assessed in later tests. It is also important to note that the high-recognition scores reported in this study could be due to the small number of target items. Future studies should consider having a longer experimental text that would allow for the inclusion of a higher number of target items while maintaining the required lexical coverage. Furthermore, while the learning condition examined in the present study was considered incidental, the repeated exposure to the target items in a relatively short text may have rendered the target items rather salient for the readers, making the learning more intentional than incidental, thus influencing processing patterns and learning gains. The results reported could have also been affected by participant’s characteristics that were not controlled for in the present study, such as gender and L1 background. Future studies should also use measures of proficiency that involve objective measurements, instead of the self-ratings used in the present study, and include these as variables in the analyses. It will also be interesting in future research to examine the role that important individual differences, such as working memory capacity, have on the processing of novel collocations.
Conclusions
The results of the present study have shown that repeated exposures in L1 and L2 reading led to improved knowledge of unknown words and their collocates, as well as to improved fluency with which the novel adjective-pseudoword combinations were read, with reading times decreasing as a function of exposure. These findings further attest to the benefits of repeated exposures in reading for the development of several aspects of vocabulary knowledge. The analysis of eye movements on the whole collocations suggests that eight exposures were enough to develop processing speed and to be able to read novel collocations in a way similar to controls, with L1 speakers developing processing fluency earlier than L2 learners. However, the analysis of the unknown component of the collocation (i.e., the pseudoword) showed that for L2 speakers, eight exposures were not enough to process unknown pseudowords similar to known words, suggesting that more exposures are needed to develop processing fluency when unknown words are embedded in this type of known-unknown collocations. Importantly, the frequency manipulation in the present study (four vs. eight) did not seem to lead to major differences in the learning or processing of known-unknown collocations. Cumulative reading times were not a predictor of vocabulary gains, providing further evidence for the complex relationship between eye movements and outcome measures and calling for further research in this area.
Acknowledgements
We are grateful to the editor and the three anonymous reviewers for their insightful comments on earlier versions of the manuscript.


 Open access