


1. Introduction
The financial performance of an insurance company depends on the difference between incomes and costs. With the insurance contract, the insurer undertakes to provide coverage to the insured in case certain events occur. At the beginning of the contract, the exact amount and timing of benefits are uncertain. The premium and benefit during this coverage period may occur at different time points in long-term intervals. For insurance, when premium and benefit consider as income and cost, it will be misleading as insurance products in the relevant period will not fully reflect profit and loss. Assessing how the premium is earned over time and the costs associated with that premium is complicated. To address this challenge, the International Accounting Standards Board (IASB) introduced the novel International Financial Reporting Standard 17 (IFRS 17) Insurance Contracts standard in 2017, inspired by Solvency II. IFRS 17 establishes key principles governing the recognition and measurement of insurance contracts, ensuring a faithful representation of the financial performance of insurance companies. Implementing these principles will significantly impact insurance companies’ financial positions, particularly regarding when profits and losses are recognized. Ultimately, the standard is expected to enhance the comparability of financial information among insurance companies, furnishing shareholders and investors with more accurate insights.
From an actuarial perspective, the investigation of IFRS 17 is still in its infancy, primarily due to the recent implementation of the standard. In their scientific studies, Chevallier et al. (Reference Chevallier, Moro, Krvavych and Rudenko2018) present a comprehensive framework designed to estimate the probability of actuarial reserve adequacy under IFRS 17, focusing on life insurance products. Their proposed model comprehensively addresses two key risks inherent in a life insurance portfolio: interest rate risk and biometric risk. Hirz and Fleischmann (Reference Hirz and Fleischmann2018) provide insights into the formulation of both the block building approach and the variable fee approach. Simultaneously, England et al. (Reference England, Verrall and Wüthrich2019) adopt a dual methodology, integrating analytical and simulation-based approaches to assess risk margins under Solvency II and risk adjustments under IFRS 17. This research parallels with reserve risk evaluations using analytical formula-based methods presented by Mack (Reference Mack1993) for the lifetime perspective and Merz and Wüthrich (Reference Merz and Wüthrich2008) for the 1-year view under Solvency II.
Palmborg et al. (Reference Palmborg, Lindholm and Lindskog2021a) examine the financial position and performance of insurance companies within the framework of IFRS 17. Their contribution involves the development of algorithms, coupled with a mathematical interpretation, suggesting a risk-based methodology for valuing a portfolio of insurance contracts. Collectively, these studies establish a foundation for a more profound comprehension of the actuarial implications of IFRS 17, paving the way for subsequent research endeavors and practical implementations.
In recent years, there have been many actuarial studies regarding the unexpected jump in mortality. Kwon and Nguyen (Reference Kwon and Nguyen2019) emphasize the importance of considering cause-of-death measurements in actuarial risk management and monitoring mortality improvement trends. Schnürch et al. (Reference Schnürch, Kleinow, Korn and Wagner2022) examine the effect of jumps in death rates on actuarial valuations. Zhang et al. (Reference Zhang, Liao and Chen2021) conclude that the life insurer's liability after COVID-19 is higher than before COVID-19 and that COVID 19 has a negative impact on the financial sustainability of the insurance.
In this article, in addition to examining the financial effects of an unexpected jump in mortality rates within the framework of IFRS 17, an evaluation of discounted cash flows over time, an crucial aspect of the standard, is also conducted. The mortality shock manifests in two forms: permanent and temporary. The decrease in the probability of death resulting from advances in technology and medical science is explained by the permanent mortality jump model. This phenomenon is by commonly employed mortality models such as Lee–Carter, Cairns–Blake–Dowd, etc. In contrast, the temporary jump model refers to an unexpected increase in mortality rates, typically triggered by events such as pandemics or natural disasters. It causes a temporary negative effect on mortality rates and stabilizes over time (Zhang et al., Reference Zhang, Liao and Chen2021). This phenomenon results in a logarithmic parallel shift in mortality rates. Using the Poisson-log bilinear Lee–Carter model, a permanent mortality jump model (general mortality structure) is estimated for both genders in the United States. Parameter assumptions and estimations are made for a temporary jump model that would induce a parallel shift in this mortality structure, utilizing COVID-19 data. Starting in 2018, a 10-year simulation is conducted for both models. While no jump occurs in the permanent mortality jump model, it is assumed that jump occurs 2 years later, in 2020, in the temporary mortality jump model. A survival benefit portfolio is established based on these simulations, and the cash flows of the liability are analyzed using both undiscounted and discount rates estimated with the Vasicek model. By applying IFRS 17 principles, this paper examines the impact of mortality rate jumps and discounted values on the financial performance of the survival benefit portfolio that might help insurance companies develop risk management strategies against such events and improve their financial reporting processes.
The paper is structured as follows: section 2 thoroughly investigates cash flow liabilities, introducing fresh concepts within the context of IFRS 17. Section 3 discusses the Poisson-log bilinear Lee–Carter model, the transient mortality jump model, and the Vasicek model used to calculate the discount factor. Section 4 discusses the parameter estimation results using US mortality data and simulations are created. The two mortality jump models generated and valuations are evaluated and compared using the framework specified in IFRS 17. Section 5 summarizes the concluding remarks and general findings.
2. Liability cash flow
Let L (t) denote the value of the outstanding liability cash flow at time t. Consider the set of time periods T + : = {t 0, t 0 + 1, …} where contracts issued during the time t ∈ T + are in the interval (t − 1, t]. The outstanding liability cash flow comprises two parts: cash flows corresponding to claims incurred but not yet reported, denoted as $L_{IC}^{( t) }$ , and remaining liabilities not yet incurred, expressed as $L_{RC}^{( t) }$
 . Equation (1) formalizes the outstanding liability cash flow (Palmborg et al., Reference Palmborg, Lindholm and Lindskog2021a):

As shown in equation (2), $L_{RC}^{( t) }$ is the combination of $L_{SP}^{( t) }$
 and $L_{FS}^{( t) }$
 . $L_{SP}^{( t) }$
 denotes liabilities allocated to services provided between times t and t + 1, whereas $L_{FS}^{( t) }$
 denotes the liabilities for future services allocated at time t (after t + 1) (Palmborg et al., Reference Palmborg, Lindholm and Lindskog2021a):

In calculating liability cash flows, it is imperative to consider the time value of money. From a modeling standpoint, the model's parameters for short-term interest rates, corresponding to the money market, should be selected to align with the model's discount rates. The discount rates for liability cash flows should mirror the time value of money and the liquidity characteristics of insurance contracts (International Accounting Standards Board, 2017a).
In adherence to IFRS 17, companies are obligated to compute the contractual service margin (CSM) and loss component (LC) each period to depict their financial performance.
2.1. IFRS 17: concepts and principles
2.1.1. Initial recognition: CSM and LC
Consider a group of contracts acknowledged during the reporting period t 0. The CSM constitutes a tack of the asset or liability associated with the group of insurance contracts, representing the unearned profit that the entity expecting recognizing in future service provisions. The CSM cannot take a negative value. Hence, if the insurance liability value exceeds any cash, liabilities from contracts on that date are considered as an LC incorporated into the liability value rather than contributing to the CSM (International Accounting Standards Board, 2017a).
Upon recognition of the group of contracts, either the contractual service margin $\hbox{CSM}^{( t_0) }$ or the loss component $\hbox{LC}^{( t_0) }$
 will be determined. Let $P^{( t_0) }$
 denote the premium amount at t 0. The following equations define the (initial) recognition at t 0 (Palmborg et al., Reference Palmborg, Lindholm and Lindskog2021a):


It is crucial that the initial recognition does not incorporate the influence of discount rates and the time value of money. Additionally, during the initial recognition, any collective unearned profits are not obligatory to be allocated to profit or loss (International Accounting Standards Board, 2017a). In accordance with the standard, the CSM remaining at the end of the reporting period is evenly distributed among the units of coverage provided and the anticipated remaining coverage units throughout the period (International Accounting Standards Board, 2017b).
2.1.2. The weighting of the contractual service margin (W t)
The CSM encompasses weights W t, reflecting the rate of unearned profit for the period post-t at time t. W t is a random variable within the range [0, 1], known at time t. W t acts as a weighting factor that ensures the profit recognition process is proportional to the remaining coverage obligations, allowing a more accurate reflection of unearned profits as they are earned over time. This weighting captures the time-based progression of profit realization in accordance with the remaining service provided by the contract. 1 − W t signifies the proportion of unearned profit at period t allocated to profit or loss at time t.
The quantity of coverage units within an insurance group is determined by the benefits conferred under a contract and its anticipated coverage period (International Accounting Standards Board, 2017a). Let $B_s^{( k) }$ , $s = t + 1,\; \, \dots ,\; \, t_0 + \tau$
 , represent the coverage provided under the k-th contract in period s. Additionally, $T_t^{( k) }$
 denote the time remaining from time t to the contract end date. Equation (5) defines the coverage unit $\hbox{CU}_s^{( t, k) }$
 in period s for T ≤ s:

Here, ${\opf I}$ is an indicator function, and $\hbox{CU}_s^{( t, k) }$
 is known at time t. When $T_t^{( k) } = 0$
 , $\hbox{CU}_t^{( t, k) } = B_t^{( k) }$
 represents the last unit of coverage provided under the contract, and $\hbox{CU}_t^{( t, k) }$
 is defined for (t − 1, t]. The coverage unit $\hbox{CU}_s^{( t) }$
 is the total of the coverage units $\hbox{CU}_s^{( t, k) }$
 summed over the index k (Palmborg et al., Reference Palmborg, Lindholm and Lindskog2021a).
W t is defined as the ratio of the expected number of remaining coverage units at time t to the total number of coverage units for the group. The coverage unit is described by Palmborg et al. (Reference Palmborg, Lindholm and Lindskog2021a):

2.1.3. Weighting of the loss component (U t)
The CSM cannot serve as a representation for unearned losses. Instead, IFRS 17 necessitates an entity to account for the excess of the expected present value of future cash flows over the expected present value of future cash flows adjusted for risk, reflecting this in profit or loss (International Accounting Standards Board, 2017b). U t denotes the distribution of specific changes in the liability value during period t, differentiating between the LC of the remaining liability and the coverage liability value excluding the LC. Following the accounting for an impaired group of insurance contracts, this distribution is allocated based on weighting. The weight is defined as ${\hbox{LC}^{( t-1) }}/{L_{RC}^{( t-1) }}$ (Palmborg et al., Reference Palmborg, Lindholm and Lindskog2021a).
2.1.4. Contractual service margin and loss component
At the conclusion of the reporting period, the carrying amount of the CSM for a group of contracts encompasses the impact of several factors. These factors include the effects from newly initiated contracts, the interest incorporated into the CSM throughout the period, alterations in fulfillment cash flows, and the influence of currency exchange differences on the CSM (International Accounting Standards Board, 2017a). Let's consider (W t)t∈T and (U t)t∈T.
If CSM(t−1) ≥ 0 and LC(t−1) : = 0, are,

becomes $\hbox{CSM}^{( t) } {\, \colon = }\ W_t \Delta _1^ +$ and $\hbox{LC}^{( t) } {\, \colon = }\ \Delta _1^-$
 for the next period.
If CSM(t−1) = 0 and LC(t−1) > 0, are,


calculate with $\hbox{CSM}^{( t) } {\, \colon = } \ W_t \Delta _3^ +$ and $\hbox{LC}^{( t) }{\, \colon = } \ \Delta _3^-$
 for the next period (Palmborg et al., Reference Palmborg, Lindholm and Lindskog2021a).
$L_{FS, t_0}^{( t-1) }$ represents the liability value at t − 1 allocated to cash flows occurring after time t measured with initial discount rates at t 0. ($L_{RC, t_0}^{( t_0) } = L_{RC}^{( t_0) }$
 , $L_{FS, t_0}^{( t_0) } = L_{FS}^{( t_0) }$
 ). (${d_{t_0, t-1}}/{d_{t_0, t}}) L_{FS, t_0}^{( t-1) }$
 is the adjustment for the liability measured with the initial discount rate (at time t 0). $d_{t_0, t}$
 is the discount factor between t 0 and t, known at time t 0 ($d_{t_0, t_0} = 1$
 ). (${d_{t_0, t-1}}/{d_{t_0, t}}) L_{FS, t_0}^{( t-1) } - L_{RC, t_0}^{( t) }$
 is the change in the value of the future service liability during the period, measured at the discount rates determined at the initial recognition of contracts. P (t) and L (t−1) − L (t) denote premiums in period t and the change in total liability value, respectively. It is needed to assess whether an economically disadvantaged group results in a CSM at the end of the period. At the end of the contract, both the CSM and the LC equal zero ($\hbox{LC}^{( t_0 + \tau ) } = 0$
 , $\hbox{CSM}^{( t_0 + \tau ) } = 0$
 ).
).
2.1.5. Profit or loss (P&L)
Let I t represent the net cash flow in (t − 1, t]. The following equation shows profit or loss for reporting time t (Palmborg et al., Reference Palmborg, Lindholm and Lindskog2021a):

More comprehensive information regarding the principles of IFRS 17 can be found in Palmborg et al. (Reference Palmborg, Lindholm and Lindskog2021a, Reference Palmborg, Lindholm and Lindskog2021b).
3. Mortality and interest rate model
3.1. Mortality model
Life insurance companies commonly utilize fixed mortality rates in calculating present values. However, this deterministic approach fails to capture the current mortality rates accurately. In contrast, introducing randomness through stochastic mortality models can address this limitation. However, stochastic models do not reflect the effects of shocks on mortality rates, as observed during the recent COVID-19 pandemic. The present study integrates a mortality model with a jump component. First, the Poisson log-bilinear model, which we consider as the permanent jump model, is addressed in this section. Later, the temporary mortality jump model is defined to explain unexpected changes in mortality.
3.1.1. Poisson log-bilinear Lee–Carter model
The paper is based on calculating the parameters of the Poisson log-bilinear model for death rates, which was put out by Brouhns et al. (Reference Brouhns, Denuit and Vermunt2002). In this model, a Poisson regression model is incorporated into the Lee–Carter model for mortality rates. Herein, let D x,t represent the number of deaths in the population at the age of x in the period t. The probability distribution of D x,t conditioned on E x,t and μ x,t is expressed as a Poisson distribution:

At age x, in period t, E x,t shows risk exposure, and μ x,t denotes the mortality rate. The formulation of the mortality rate model is presented by

Here, a x represents the age effect, κ t expresses the mortality trend, and β x is the age sensitivity of the change in κ t. Notably, κ t is a Gaussian random walk, where δ is the drift parameter and ξ t is an independent and identically distributed (i.i.d.) variable with $\xi _t \sim N( 0,\; \, \sigma _k^2)$ . The constraints $\sum _t \kappa _t = 0$
 and $\sum _x \beta _x = 1$
 are maintained. It is assumed that the mortality rates remain constant after the age of 90. Furthermore, the mortality trend is characterized as a non-stationary series. The derivation of survival probabilities using this model is presented in detail in Appendix A.
3.1.2. Mortality risk including temporary jump
The mortality model, incorporating the temporary jump, is expressed as

Here, μ x,t represents the force of mortality without the jump, as defined in equation (12). The transient mortality jump process H x,t is defined by

Here, τ j represents the time of the j-th adverse mortality event, and b j is the maximum severity of the j-th jump event. The time τ j can be modeled as the arrival times of a Poisson process with a jump size b j > 0. B j(x) distributes the jumping effect of the mortality rate among different ages (0 ≤ B j(x) ≤ 1). For instance, in the flu epidemic of 1918, people younger than 50 were more likely to be affected, while the situation was vice versa for COVID-19. As demonstrated by these examples, the impact of the jump in the mortality rate may vary according to age. The term $\exp ( -k_j ( t-\tau _j) )$ is used to model the temporal nature of the shock, k j can be estimated using historical data or set to 1, as commonly done in the literature. The higher k j implies a faster cessation of the jump's effect. ${\opf I}$
 is the indicator function, equal to 1 if a jump event occurs and 0 otherwise.
3.2. Modeling short rate
Interest rates play a significant role in determining the present value of future cash flows and assessing risks from a financial perspective. The insurance industry often relies on a fixed-rate assumption. However, this approach may struggle to adapt to markets with high financial volatility. In contrast, stochastic interest rates offer a more realistic approach to modeling uncertainties and fluctuations in the real world. Acknowledging this, the Vasicek model, well-known for its convenience and widespread use, was selected as the preferred framework for modeling stochastic interest rates in this study.
Vasicek model was introduced by Vasicek (Reference Vasicek1977) to model short-term interest rates under the assumption that of interest rates can based on a single stochastic factor. Vasicek model is described by

γ, θ, and σ are non-negative constants. W t represents the random market risk defined as the Wiener process, θ represents the long-term average interest rate, γ indicates the rate of return to θ, and σ is the volatility of the short-term interest rate. The short-term rate is pushed up and pulled down, respectively, when it tends below and above the long-term rate (Burgess, Reference Burgess2014).
The Vasicek model is the Ornstein–Uhlenbeck process. The interest rate for a future time t, where 0 ≤ s ≤ t, is defined by (Burgess, Reference Burgess2014)

The parameters of the Vasicek model, where r t is the current interest rate, can be estimated by using the maximum-likelihood method. The estimation of parameters is

where $dt = t_i - t_{i-1},\; \, i = 1,\; \, 2,\; \, \dots ,\; \, n$ (Tanaka et al., Reference Tanaka, Xiao and Yu2020).
The discount rate is used to calculate the present value of cash flows expected in a certain period. The discount rate is shown with the interest rate as

4. Numerical illustration
Our aim is to examine the effect of the pandemic and interest rates on the insurance company using the framework of IFRS 17. To this end, data sourced from the United States is used to generate simulations pertaining to both interest and mortality rates. A 10-year simulation is generated, starting at 2018. Moreover, a second simulation is developed that takes into consideration the pandemic scenario occurring in 2020.
First, parameter estimation of mortality and interest rate are given. Then coverage of survival benefit and its valuation over time are presented. Finally, the valuation of survival insurance with IFRS 17 are presented.
4.1. Mortality
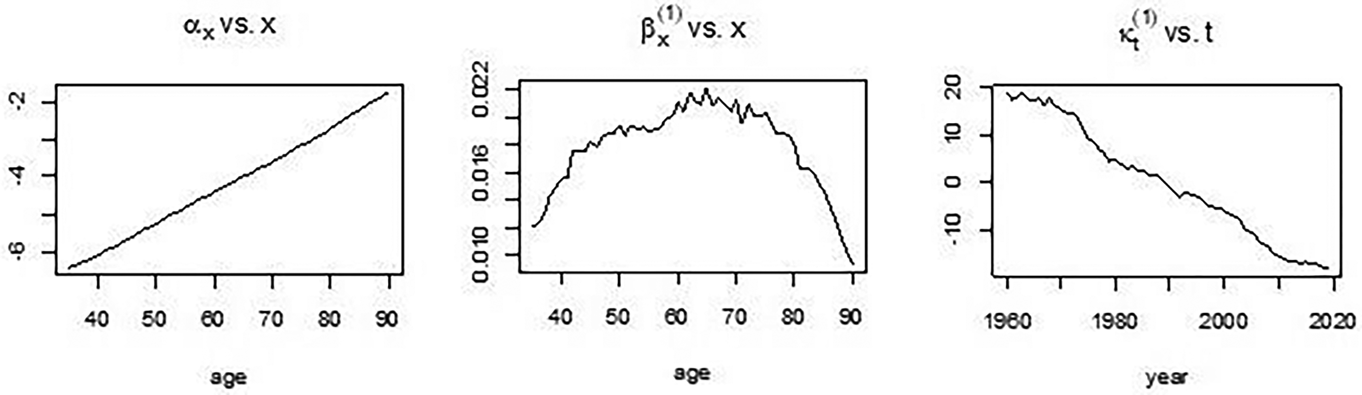
We use mortality table for both sexes from age of 35 to 90 in the United States from 1960 to 2019 that is taken from the Human Mortality Database (The Human Mortality Database, 2023), Mortality rates and parameter estimations are derived using Poisson log-bilinear mortality model and the R package “StMoMo” is employed for this purpose (Lee Carter, Reference Lee and Carter1992; Brouhns et al., Reference Brouhns, Denuit and Vermunt2002; Villegas et al., Reference Villegas, Millossovich and Kaishev2018). The most suitable model for the mortality trend is the ARIMA(0,1,0), with parameters δ = −0.6291, $\sigma _k^2 = 0.5961$ . Figure 1 presents the results of the parameter estimation for the mortality model.
Parameters estimation of mortality model for the United States.

The parameters shown in Figure 1, α x and β x vary with age, while κ t varies with time. κ t represents a time series modeled with ARIMA(0,1,0), and κ t for the next decade is predicted using this time series. To estimate the probabilities of permanent jumps, 10,000 simulations are generated using a 10-year time series forecast of κ t.
COVID-19 data are utilized to estimate the parameters for the transient mortality model (H x,t) as defined in equations (13) and (14). For the COVID-19 data, excess deaths in the United State between 2020 and 2022, as reported by the Center for Disease Control and Prevention (CDC) (Center for Disease Control and Prevention, 2023), are taken into account. Figure 2 shows the distribution of excess deaths by age group from the CDC. Notably, the distribution of excess deaths by age groups has changed over the years. As demonstrated in Figure 2, COVID-19 has a notable impact on people in middle age and older. The year 2020 observed the highest deaths attributed to COVID-19 among those 85 years and older. However, following years, notably 2022, observed a decline in fatalities owing to pandemic control measures and widespread vaccination efforts. Additionally, the demographic groups most severely affected by COVID-19 have shifted over time. For instance, while the number of deaths among people aged 85 and older was higher in 2020, the number of deaths in the 65–74 and 75–84 age groups was higher in 2021. It cannot be determined in which age group COVID-19 is more effective with the excess death numbers, but this conclusion can be reached by examining the excess death rates.
Excess death numbers from 2020 to 2022.

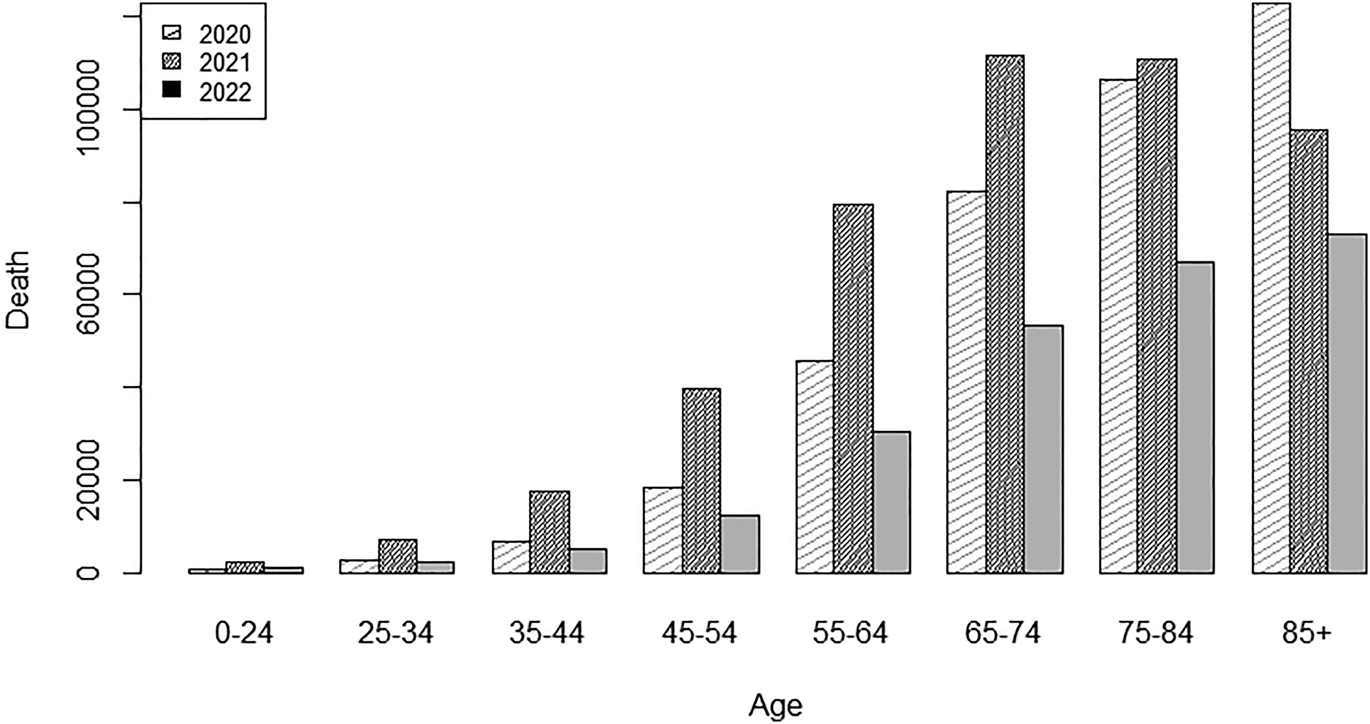
The excess death rate for each age group is calculated as (Zhang et al., Reference Zhang, Liao and Chen2021)

Table 1 shows the excess death rate computed for each age group.
Excess death rate for each age group from 2020 to 2022

The linear interpolation method is used to estimate excess mortality for each age. This method depends on the assumption that the probabilities of deaths presented in Table 1 represent the median value for each age group. Additionally, it is assumed that those under 24, and over 85 years old remained constant. In other words, the excess mortality rate for people within this age range is determined by the median value, and no interpolation is applied.
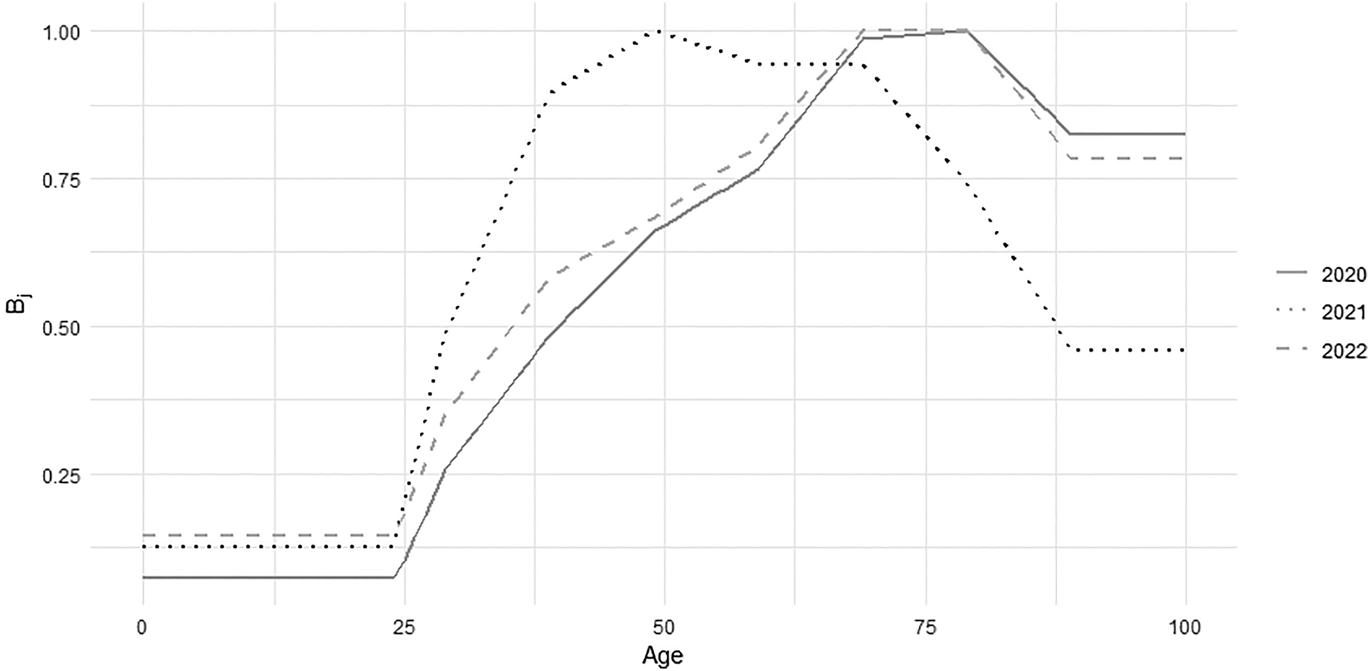
The rates estimated for each age are utilized to construct a distribution the impact of mortality rate. This distribution denotes the adverse mortality effect and is denoted by B j(x) for x age. Since pandemic data from 2020 to 2022 are utilized in the paper, the parameter B j can be estimated for these years. In years beyond 2022, it is assumed that the distribution observed in 2022, denoted as B j, continues to be utilized. Figure 3 shows the predicted B j values. While the age distributions for 2020 and 2022 exhibit similarities in adverse mortality effects, the influence of COVID-19 is more pronounced among younger age groups in 2021. This trend could be attributed to the increased transmission rate of the epidemic during that period.
Adverse mortality effect across ages.

b j signifies the maximum size of the jump event. The maximum value in Table 1 for excess death rates is considered as the value of b j for the respective year.
Considering the Spanish flu that occurred between 1918 and 1920 and the ongoing COVID-19 pandemic that began in 2019, it can be inferred that pandemic events occur approximately once every century (Zhang et al., Reference Zhang, Liao and Chen2021). In addition, according to studies in the literature, the probability of the event occurring is accepted as τ j = 0.01. This assumption is also accepted in the paper.
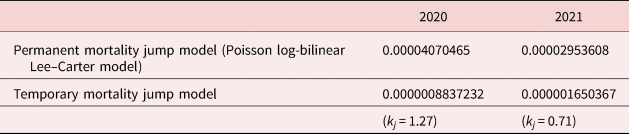
The k j value shown in equation (14) reflects information about the duration of the pandemic. If k j, greater than 1, the jump effect ends quickly; otherwise, it persists for a long time. The k j can be estimated using mortality data for 2020 and 2021. However, due to not announced of mortality data for the years after 2021, the assumption k j = 1, which is frequently used in the literature, is accepted. The mean square error is utilized to estimate k j for 2020 and 2021. These estimates are evaluated in 0.001 increments for 0 < k j ≤ 2. k j is estimated as 1.27 for 2020. Assuming that the k j in 2020 is 1.27, k j for 2021 is estimated as 0.71.
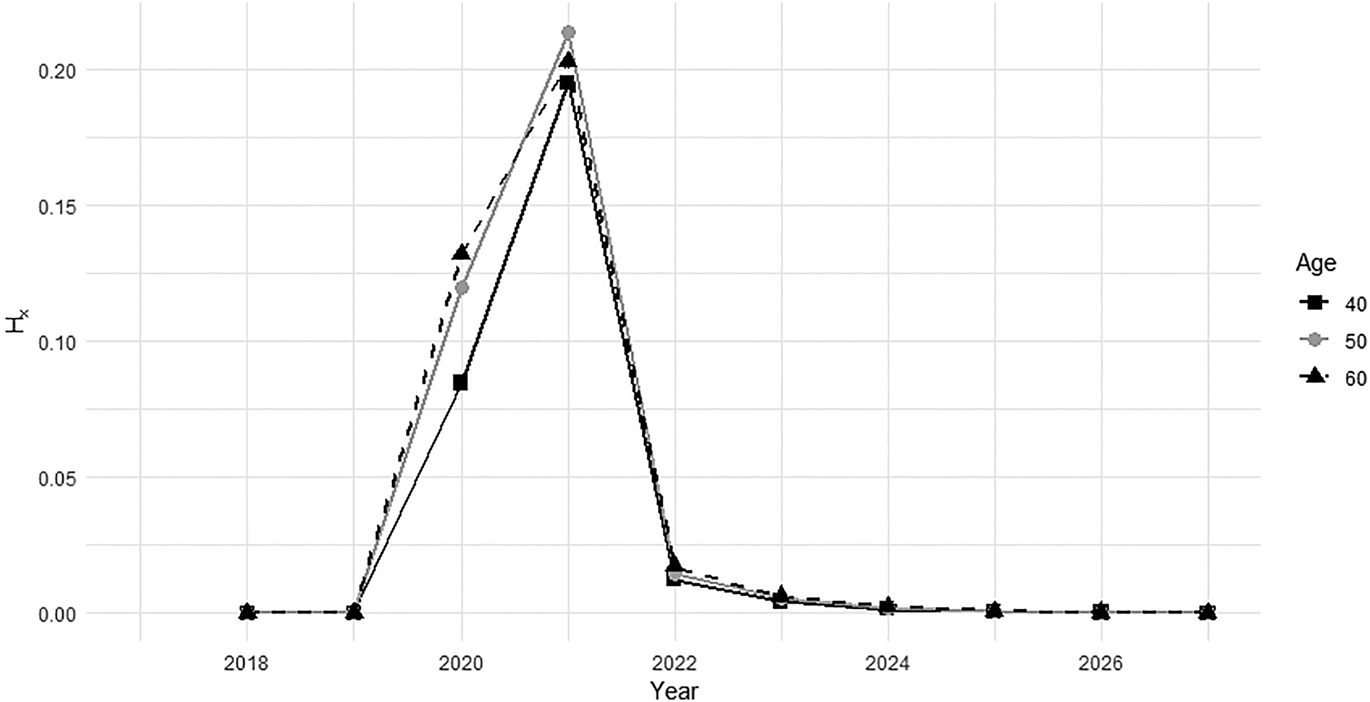
Figure 4 shows the transient death jump process H x,t with parameters based on some assumptions and estimates. Figure 4 reflects the changes in the temporal jump process over the years for ages 40, 50, and 60. The impact of shocks on mortality increases in the first 2 years and decreases in the following years. After 2024, although the impact of the pandemic has eased, it still has an impact on mortality. As shown in Figure 3, the impact of the temporary shock on mortality across ages varies by year.
Temporary mortality jump for simulation in the next decade for ages 40, 50, and 60, starting from 2018. The point values in the chart represent the value at the end of the year.

The coherence of the simulations created using the estimated parameters with the observed values is shown in Table 2 and Figure 5.
Estimation of k j for 2020 and 2021 with mean square error

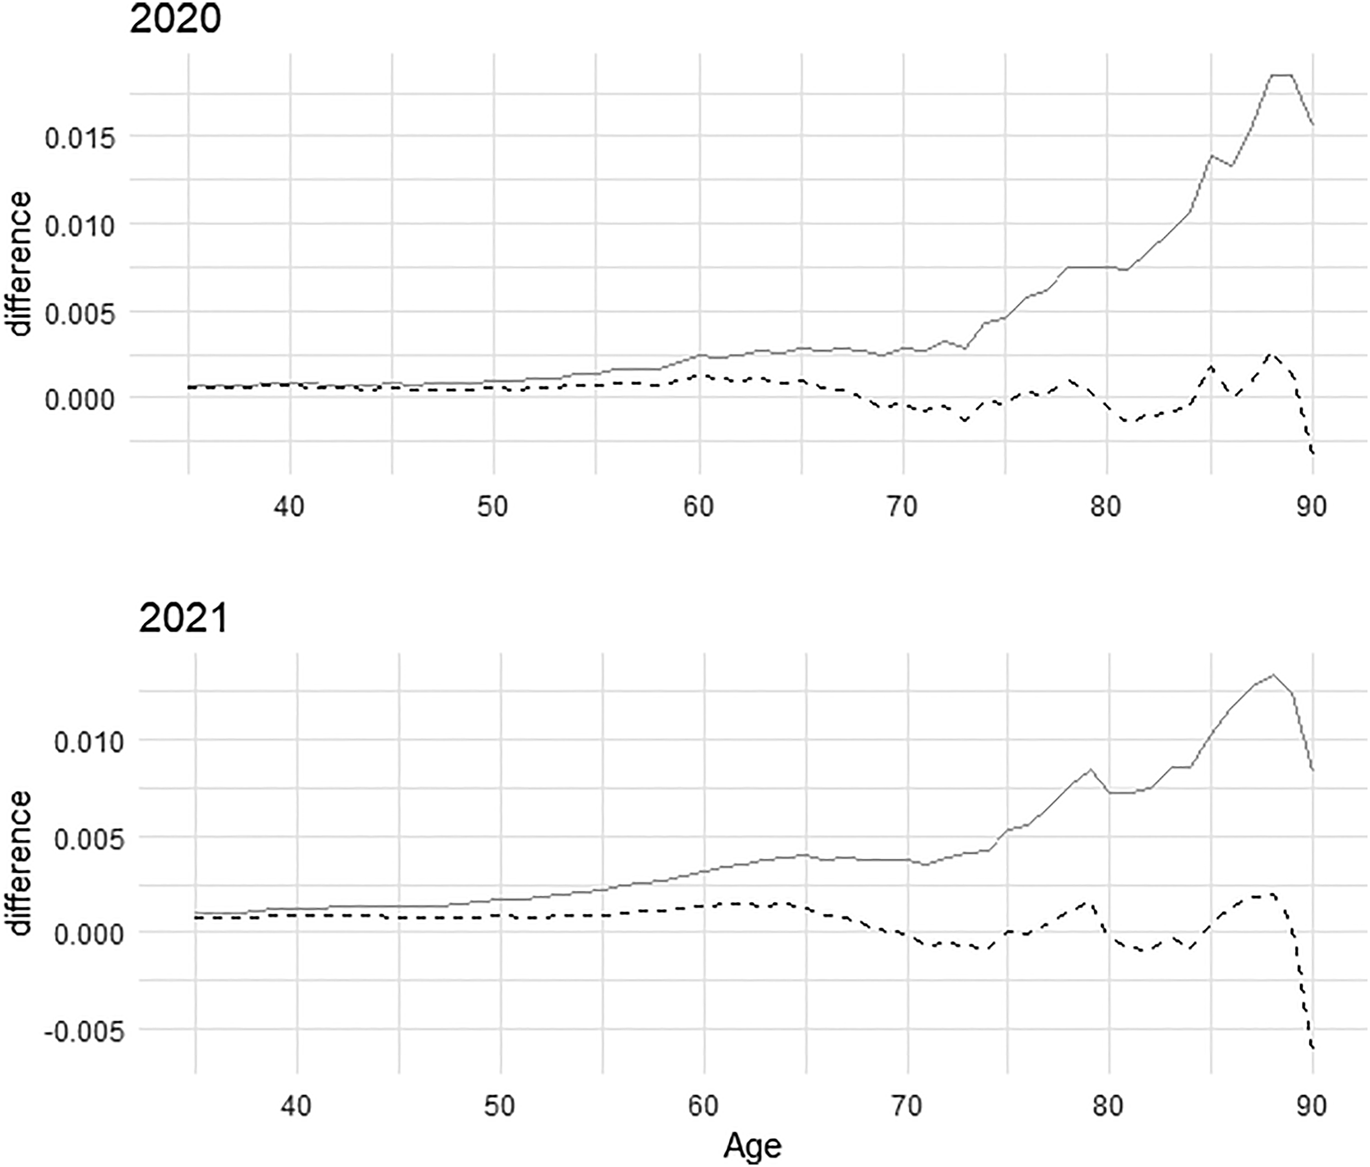
Estimation of mortality rate and observed mortality rate for 2020 and 2021.
Note: The observed mortality rate is estimated using q x = m x/(1 + 0.5m x). The solid black dashed line indicates the difference between the observed mortality probabilities and the predicted temporary mortality jump model. The solid gray line represents the difference between the observed mortality probabilities and the permanent mortality jump model.

Table 2 contains the mean square errors of the temporary and permanent model for 2020 and 2021. The persistent jump model contains probabilities from simulations created with Poisson-log bilinear Lee–Carter model estimated parameters. The temporary jump model contains the probabilities obtained from the jump model added to the mortality model. As can be seen from Table 2, the temporary mortality jump model is a more appropriate model to explain the unexpected shock in mortality.
Figure 5 presents a detailed analysis of simulation results for 2020 and 2021, focusing on age-specific discrepancies between observed mortality rates and modeled outcomes. Interestingly, both years show similar results for people aged 35–45 across both models, suggesting a minimal pandemic impact on this group. In particular, the difference between the temporary mortality jump model and observations is less for the middle and elderly population, which is significantly affected by the pandemic. In other words, the temporary mortality jump model provides a more realistic simulation for all ages.
4.2. Interest rate
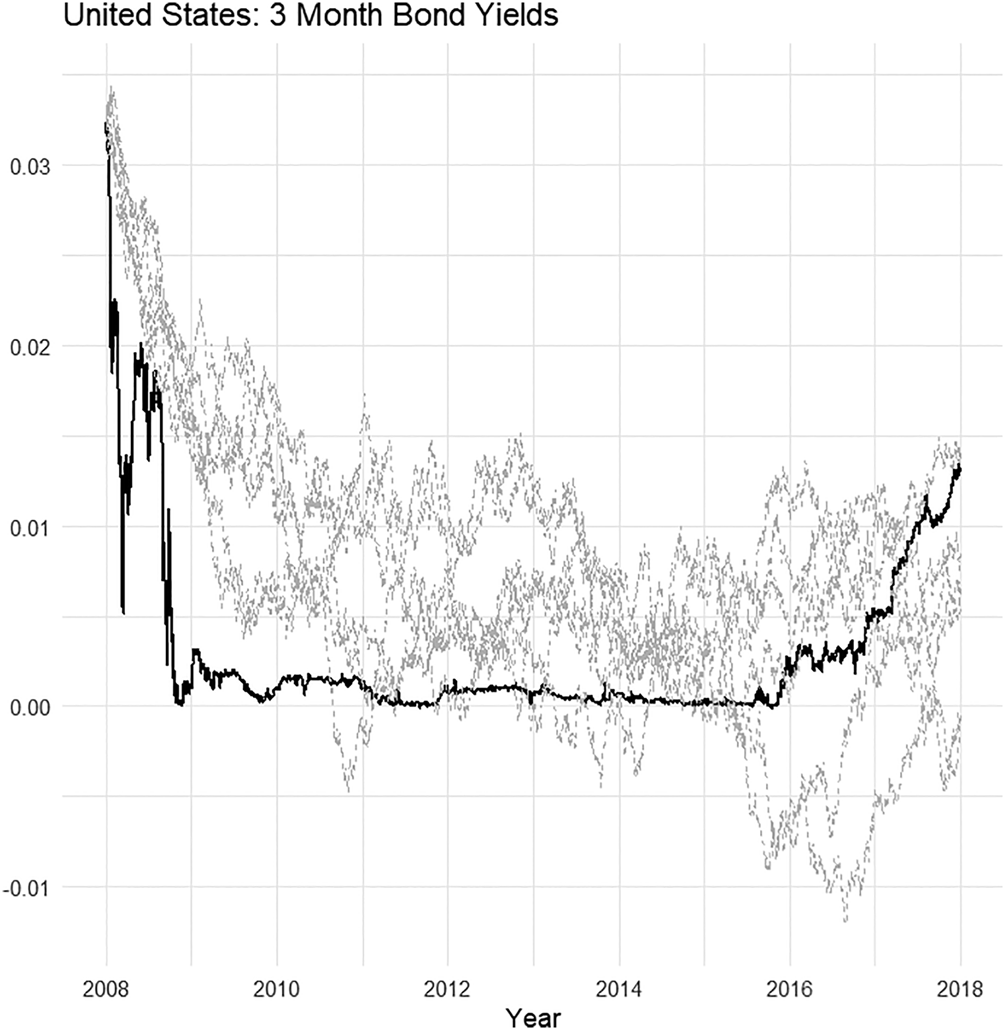
We utilize daily data of 3-month bond yields of the United States from January 2, 2008 to December 29, 2017. Data are sourced from the Federal Reserve Bank of St. Louis and are shown in Figure 6.
3-Month bond yields: actual data and simulated paths.
Note: The solid black lines represent the actual daily data of 3-month bond yields for the United States, while the dashed lines illustrate a few examples of simulation paths based on parameters from Table 3.

Parameter estimation for Vasicek model

Maximum-likelihood calibration is applied to estimate the parameters of the Vasicek model. Table 3 involves parameter estimates. Moreover, Figure 6 presents several simulated paths generated using the estimated parameters from Table 3. The simulated paths closely match the actual data trends, demonstrating a strong alignment between them. Showing only a few selected simulation paths is sufficient to illustrate this consistency, as they effectively represent the overall behavior of bond yields during this period.
A value greater than one for γ indicates that interest rates return to their average level more quickly and fluctuations reach equilibrium more quickly. The parameters also show that the interest pattern moves steadily within a certain range of variability in the long run. With estimates of parameters, 10,000 simulations are created, starting in 2018 and continuing until 2028.
4.3. Insurance coverage
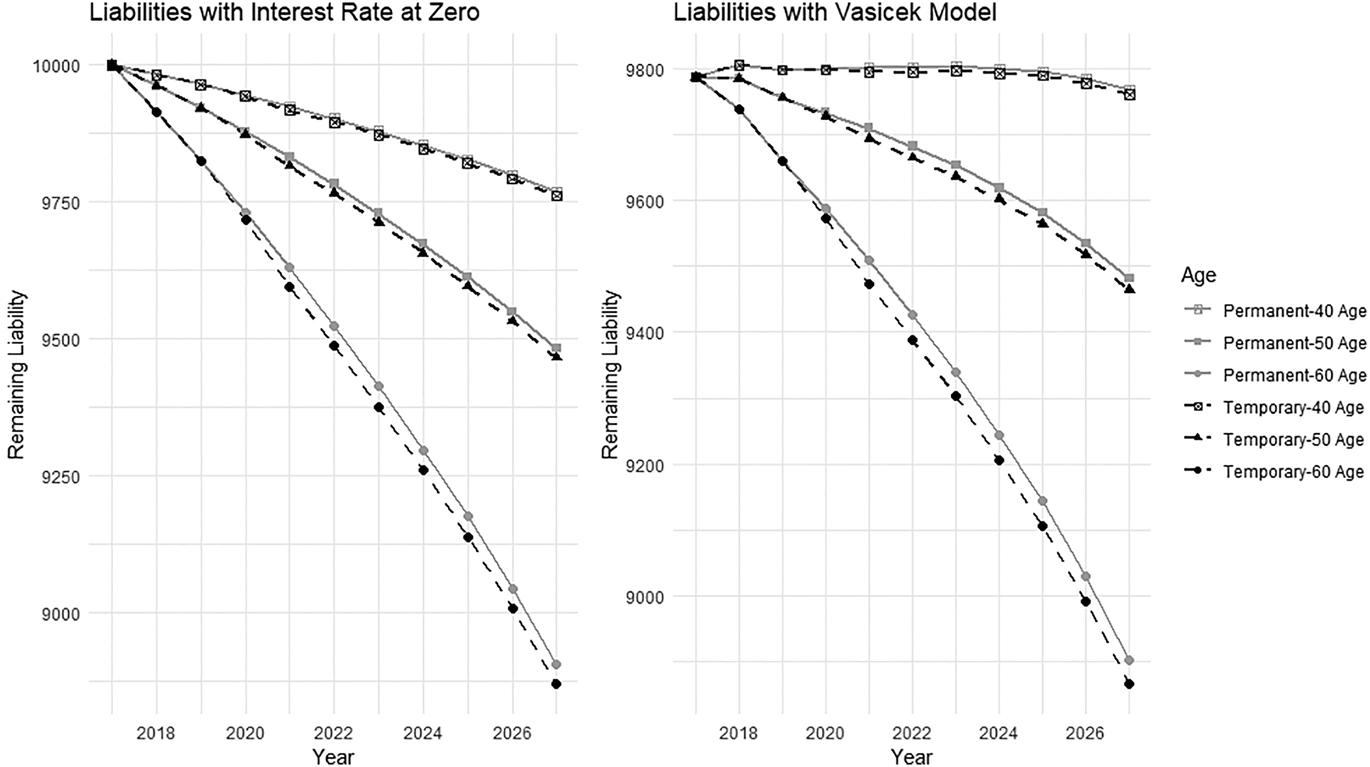
Financial performance of the insurance company is analyzed using estimated interest rates with both zero interest rates and the Vasicek model. It is assumed that the starting point is t 0 = 2018. Moreover, no new survival benefit policies are introduced. Three distinct cohorts were considered for people aged 40, 50, and 60 years, each comprising 10,000 people. The survival benefit policy is considered to yield benefits (B = 1) if the policyholder lives for 10 years or more; if not, the policyholder is not eligible for benefits. Considering these assumptions, the insurer's liability over the years is estimated for a portfolios of 10,000 people and the average of the resulting simulated outcomes is calculated.
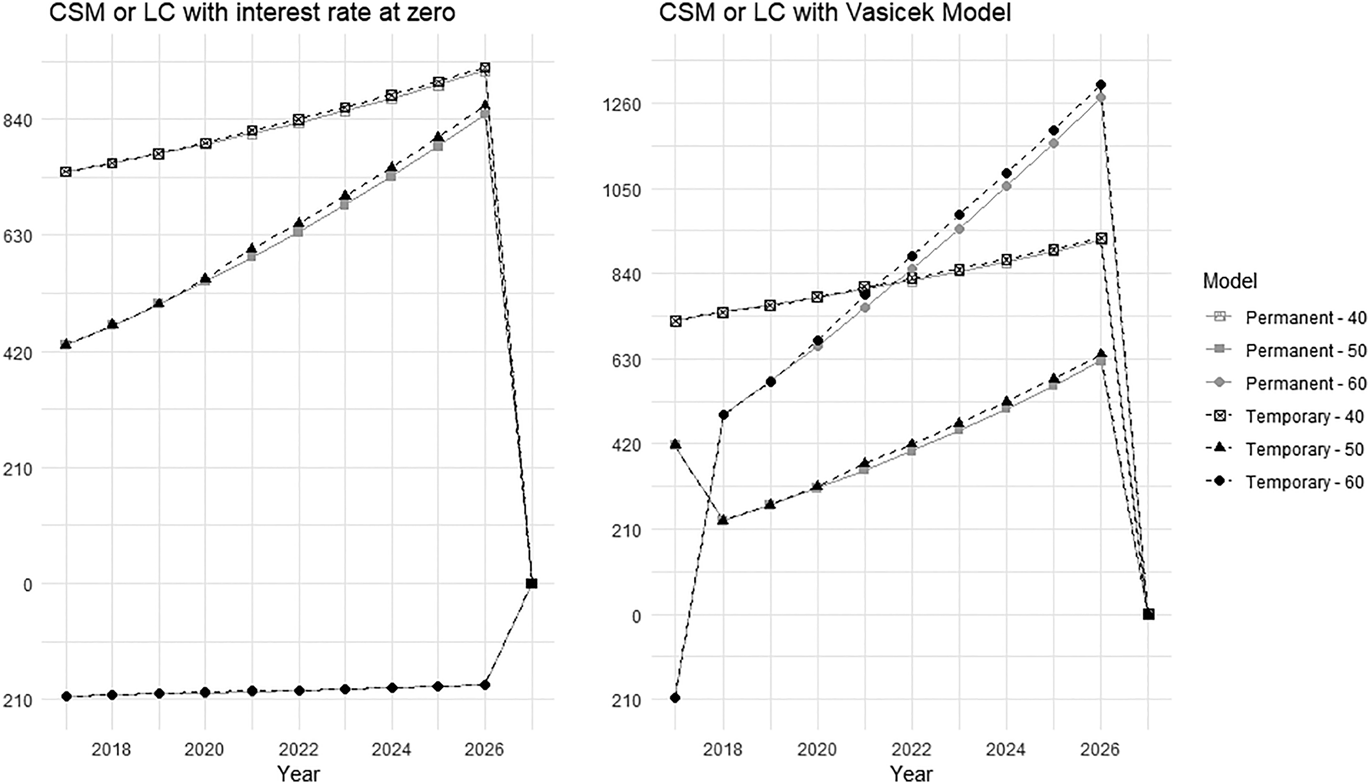
Figure 7 shows the insurer's remaining liability over time for the ages of 40, 50, and 60 for both temporary and permanent mortality jump models. For the two-mortality model, the values of the liability over time are depicted, both with and without consideration of the interest rate. Additionally, it is important to note that the disparity in the value of the remaining liability at the initial time (t 0 = 2018) stems from interest rate. The temporary jump model, unlike the permanent jump model, leads to a decrease in liabilities with an increase in mortality. Every year, a consistent decline in the insurer's liability is observed, albeit at varying rates. It is a well-known fact that mortality rates increase with age. This trend is particularly pronounced for older ages, especially during the COVID-19 pandemic. As reflected in the graphs, the difference between the two mortality models increases proportionally with age. This phenomenon remains unchanged when the interest rate is taken as zero or estimated using the Vasicek model. Furthermore, the fluctuation in liabilities depending on the applied interest rates highlights the impact of interest rate adjustments on the insurer's financial position.
Average remaining liability of the two models by years.
Note: The probabilities and the methodology for calculating liabilities are elucidated in Appendices A and B.

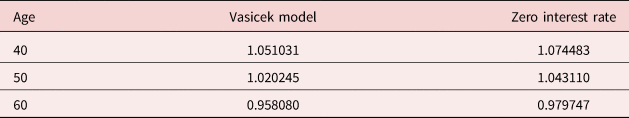
The premium amount for the insurance portfolio is estimated from the actuarial equilibrium equation. Pure premiums that equalize the liability for each age are obtained. A loading factor is added to the pure premium (P pure) to cover the insurer's operational expenses, administrative and risk costs, and profit margin. Thus, the premium (P) for each age is estimated as P = (1 + m)P pure. Premiums for each age are shown in Table 4, assuming that the premium (P) is received only at time t 0 = 2018 and m = 0.1.
Premiums

In the paper, benefits are committed to those who are survive at the end of 10 years. Since the 40-year-old is considered more risky by the insurance company compared to other ages, higher premiums are requested. Also, based on the data within the scope of the paper, it can be said that interest rates play an important role in determining insurance premiums.
The premium at time t 0 is an crucial factor affecting the CSM and LC. Higher premium can increase insurance companies’ future profit and increase CSM while at the same time providing greater financial assurance against future benefits and reducing LC.
The results derived from the CSM and LC defined by equations (7), (8), and (9) through simulation are presented in Figure 8 over the years. CSM and LC must equal zero at the end of the contract. The initial values of CSM and LC resulting from premiums and liabilities at time t 0 are differ for each age. The impact of the mortality increase in 2020 is reflected differently in CSM and LC; in this case, it acts more on the CSM and less on the LC. The effect of evaluating interest rates with the Vasicek model on CSM and LC can be observed in the figure. The existence of the interest rate for ages 40 and 50 causes a change in the CSM value, but the result is still as CSM. When the interest rate is zero for the 60 age, it is recognized as LC; however, when assumed with the Vasicek model, the result is recognized as CSM.
Contractual service margin (CSM) and loss component (LC).

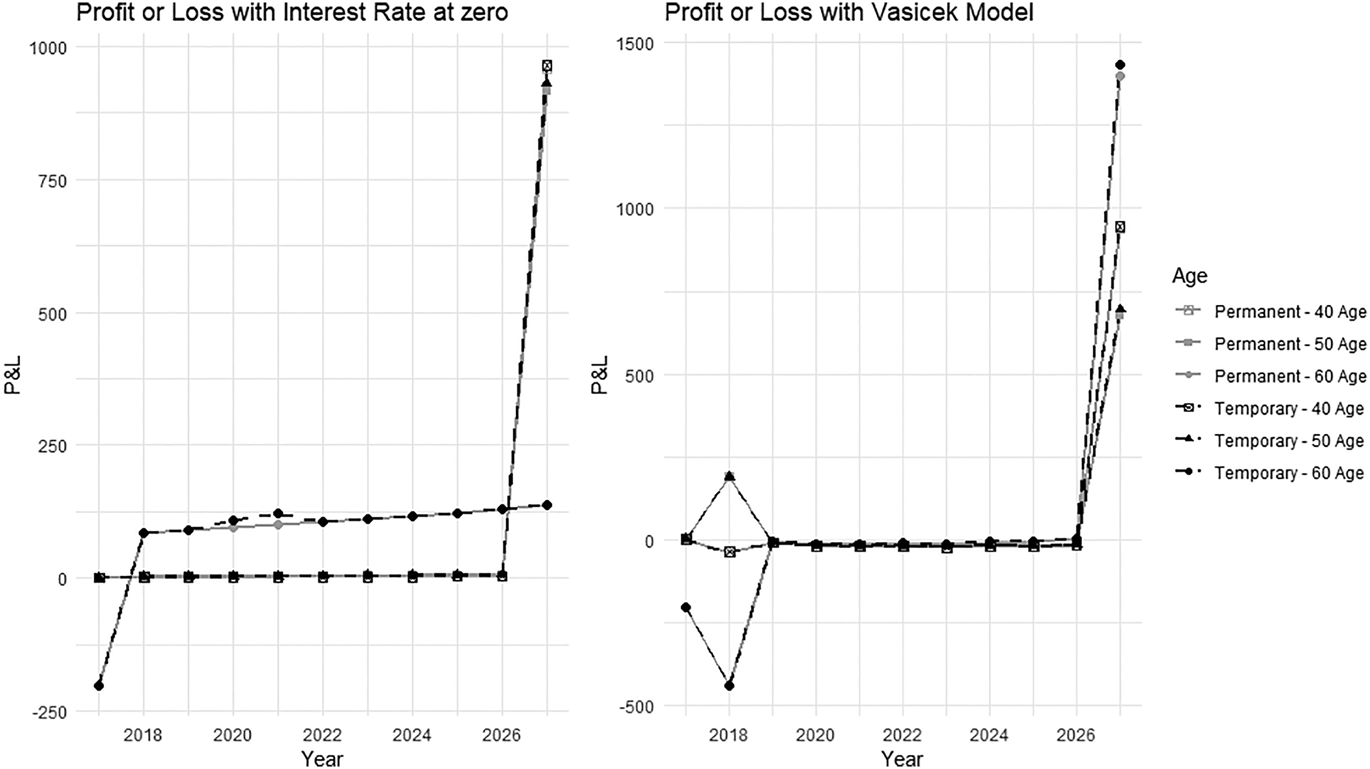
CSM and LC are financial estimates and cannot be directly recognized as profit or loss. CSM and LC are used to help evaluate the financial performance, while indicators such as profit or loss are often used to assess financial position and performance. The profit or loss assessment of the insurance portfolio within the scope of the paper is shown in Figure 9.
Distribution of profit or loss for different margins by year.

Figure 9 shows profits or losses of the insurance portfolios over years. Specifically, for adults aged 40 and 50, Figure 8 clearly indicates that the contract service margin will translate into profit. However, the situation is different for those over 60. Although there is a loss at the beginning, there is a trend in which profits increase over time. It is noted that among 60-year-olds, who are most impacted by the jump in mortality, this effect is more distinctly reflected in profit or loss compared to other ages.
When evaluating the implementation of the Vasicek model, it is noticeable that the profit or loss is more variable over the years. Especially in some years, significant losses or profits become evident. It can be expressed that interest rates cause fluctuations in profit and loss, and financial performance is more variable.
According to the results, the financial position of the portfolios varies over the years. However, it has been observed that all portfolios, including those that started with a loss, were in a profit position, albeit with different amounts, at the time the contract ended. In addition, the volatility of financial performance and position increases over the years, especially when the interest rate model is taken into account. This volatility may require portfolio managers to pursue a more careful risk management strategy. Additionally, financial positions in the portfolio may need to be managed more dynamically due to the impact of interest rates.
5. Conclusions
With the introduction of the IFRS 17 standard, aimed at providing a more accurate portrayal of insurance companies’ financial performance and position, significant changes have occurred in the presentation of financial statements. Embracing this changes, this paper addresses the impact of the COVID-19 pandemic on mortality rates and its reflections on the insurance industry, especially within the scope of IFRS 17. It reveals the complex interaction of unexpected jump in mortality and interest rates on financial performance. The financial position and performance of a survival benefit scenario is analyzed for different ages through various mortality and interest rate models, such as the Poisson-log bilinear Lee–Carter and Vasicek models.
According to the results, integration of a temporary mortality jump model reflecting COVID-19 deaths provides a more realistic assessment of the effects of the pandemic and less impact on insurer financial condition compared to interest rate fluctuations. Additionally, it seems that another significant factor affecting the financial situation is premium. Therefore, accurate and precise premium forecasting is critical to ensure insurance companies present a sound financial picture. The study demonstrates the critical importance of mortality, interest rate, and premium in determining financial performance under IFRS 17. As a result, insurers need to adapt to changing market conditions to ensure financial stability and profitability in the face of unexpected events.
Acknowledgments
This study is based on Çğidem Lazoğlu's Ph.D. thesis and supervised by Uğur Karabey.
Author contributions
Çğidem Lazoğlu: investigation, methodology, writing – original draft, resources, software, and visualization. Uğur Karabey: methodology, supervision, validation, writing – review and editing.
Competing interests
None.
Appendix A.
Let N x,t be the number of active contracts at age x at time t. We assume that the deaths of the insured at time t due to mortality rates at time t − 1 are independent events. The number of active contracts at time t with the “nested” binomial process by

n x−t,0 is the number of insured at the beginning of the insurance coverage (at time 0). Distribution of N x,t is (Palmborg et al., Reference Palmborg, Lindholm and Lindskog2021a)

The probability of a person aged x surviving from time t to time t + u is expressed as follows:

The mortality trend for the USA with ARIMA(0,1,0) time series is

We know that $\xi _t\sim N( 0,\; \, \sigma _k^2)$ . Thus

The expected value of the mortality rate from the lognormal distribution can be expressed as follows:

With $\kappa _0^{( t) } = \kappa _t$ , the probability of survival of a person aged x from time t to time t + u is shown as follows:

Equation (A.1) estimates the number of people who will die in the next 10 years under insurance for the age of x (Palmborg et al., Reference Palmborg, Lindholm and Lindskog2021a). The temporary mortality jump model is

Assuming that H x,t and μ x,t are independent of each other:

Using the linearity property of expectation, the equation can be expressed as follows:

Assuming that $\log ( \mu _{x, t})$ has a normal distribution, the expected value of $\mu _{x, t}^j$
 is expressed as follows:

The variance $\mu _{x, t}^j$ can be expressed as

The second moment and variance of the log-normal distribution are represented by

Determining a generally applicable distribution for H x,t is challenging. Closed-form expressions for its variance and mean are elusive, necessitating the use of simulation methods.
Appendix B.
Let $( X_t) _{( t = 1) }^{\tau }$ be the cash flow corresponding to the outstanding liability at time t. In this insurance system, we need the expected value (${\opf E}[ R^{( t) } \vert H_0^{( t) }]$
 ) and variance ($\hbox{Var}[ R^{( t) } \vert H_s^{( t) }]$
 ) of the total cash flow liability to calculate the liability at time t, where $R\, \colon = \sum _{s = 1}^{\tau } X_s$
 . Let $N_s^{( t) }$
 represent the number of active contracts at time s ≥ t, which gives the variation of the mortality trend up to time t concerning $( \kappa _s) _{s = 1}^{t}$
 . The σ-algebra filter produced by $( H_s) _{s = 0}^{\tau -t}$
 cash flows with contract end date τ depends only on the number of contracts at time t:

The outstanding liability at time t is (Engsner et al., Reference Engsner, Lindholm and Lindskog2017; Palmborg et al., Reference Palmborg, Lindholm and Lindskog2021a)

c 0 is a measure of risk. According to IFRS 17, there is no specific use for the risk measure. Value at risk ($\hbox{VaR}_{( 99.5\%) }$ ) is used in the paper. The measure of risk c t is as follows (Palmborg et al., Reference Palmborg, Lindholm and Lindskog2021a; Engsner et al., Reference Engsner, Lindensjö and Lindskog2020):

η t represents the capital cost ratio. The capital ratio in Solvency II is considered as η 0 = 0.06 since it is a fixed rate of 6% per annum.

 Open access