

Introduction
Ice-core records provide evidence of past changes in atmospheric chemistry and transport linked both to global-and regional-scale climate variability (e.g. Reference MayewskiMayewski and others, 1994; Reference Kreutz and SholkovitzKreutz and Sholkovitz, 2000; Reference Fischer, Siggaard-Andersen, Ruth, Röthlisberger and WolffFischer and others, 2007) and to anthropogenic pollution and land-use changes (Reference McConnell, Lamorey, Lambert and TaylorMcConnell and others, 2002, 2007; Reference Vallelonga, Van de Velde, Candelone, Morgan, Boutron and RosmanVallelonga and others, 2002; Reference OsterbergOsterberg and others, 2008) on a range of timescales. Impurities in glacial ice come from the deposition of particulate and soluble aerosols on the snow surface, which in turn are sourced from mineral dust, volcanic eruptions, sea spray, biological emissions and anthropogenic pollution. The physical and chemical properties of these impurities allow detection using a range of analytical tools. The analysis of trace elements using inductively coupled plasma mass spectrometry (ICP-MS) has become widely used for reconstructing past changes in the atmospheric burden of pollutants such as Pb (e.g. Reference McConnell, Lamorey, Lambert and TaylorMcConnell and others, 2002; Reference Vallelonga, Van de Velde, Candelone, Morgan, Boutron and RosmanVallelonga and others, 2002; Reference HongHong and others, 2004; Reference OsterbergOsterberg and others, 2008; Reference GrossGross and others, 2012) and the deposition of important bioactive metals such as Fe (e.g. Reference Edwards, Sedwick, Morgan and BoutronEdwards and others, 2006; Reference GaspariGaspari and others, 2006). In addition, changes in the composition of dust, signaling changes in its source, have been inferred using ICP-MS measurements (Reference Kreutz and SholkovitzKreutz and Sholkovitz, 2000; Reference GabrielliGabrielli and others, 2010).
Ice-core samples are prepared for ICP-MS analysis by melting and acidification, and are then either injected directly into the mass spectrometer (Reference McConnell, Lamorey, Lambert and TaylorMcConnell and others, 2002) or analyzed in individual vials, in both cases usually without filtration (Reference Knüsel, Piguet, Schwikowski and Ga¨ggelerKnüsel and others, 2003; Reference Osterberg, Handley, Sneed, Mayewski and KreutzOsterberg and others, 2006). Acidification of ice-core samples is necessary in order to maintain sample stability during analysis. Methods for acidifying samples vary in terms of the mineral acid used, acid strength and acid contact time. Samples are commonly acidified to 1% (v/v) nitric acid, whether as discrete samples (e.g. Reference Osterberg, Handley, Sneed, Mayewski and KreutzOsterberg and others, 2006) or as a liquid stream for continuous injection (e.g. Reference McConnell, Lamorey, Lambert and TaylorMcConnell and others, 2002), though a weaker 0.5% nitric acid addition has also been used (e.g. Reference Krachler, Zheng, Fisher and ShotykKrachler and others, 2005, 2008; Reference Grotti, Soggia, Ardini and MagiGrotti and others, 2011). Hydrochloric acid has been used to acidify samples, but is less common (Reference Edwards, Sedwick, Morgan and BoutronEdwards and others, 2006). Perhaps the greatest source of methodological difference is the acid contact time. Continuous injection ICP-MS allows for an acid contact time of seconds to minutes, while discrete samples may be acidified for any length of time. Although few ice-core studies have stated explicitly how long samples were acidified prior to ICP-MS analysis (table 1 of Reference Rhodes, Baker, Millet and BertlerRhodes and others, 2011), it is apparent that 24 hours is a common length of acidification (Reference Krachler, Zheng, Fisher and ShotykKrachler and others, 2005; Reference Osterberg, Handley, Sneed, Mayewski and KreutzOsterberg and others, 2006).
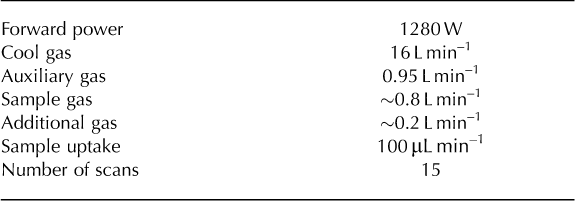
ICP-SFMS instrument conditions and measurement parameters
A study using synthetic dust samples has suggested that acidification time has a significant impact on measured trace-element concentrations (Reference Rhodes, Baker, Millet and BertlerRhodes and others, 2011), but no systematic test has been conducted on actual snow or ice-core samples. Considering the variety of techniques commonly used in ice-core trace-element analysis, we conducted a 3 month experiment to evaluate trace-element dissolution from atmospheric dust in West Antarctic surface snow samples at nitric acid concentrations of 0.1, 1.0 and 10.0% (v/v). The goal was to evaluate the effects of acid strength and time on dust dissolution and the impact that differential dissolution rates could have on calculated crustal enrichment factors. In addition, we used a time series of snow-pit samples collected from Denali National Park, Alaska, USA, and measured twice (383 days apart, at 1% (v/v) nitric acid) to investigate the concentration dependence of measured increases in trace-element concentrations through time. Our study expands the work of Rhodes and others (2011) by testing the effects of both acid strength and time on real environmental samples from Alaska and Antarctica, two important ice-core drilling locations. Dust particles deposited in the snowpack at both sites are likely to have experienced significant weathering relative to their source rock, particularly during atmospheric transport (Reference Cwiertny, Young and GrassianCwiertny and others, 2008). Our results are directly relevant to ice-core studies of trace-element deposition. In addition, we evaluate the concentration dependence of relative changes in four trace-element concentrations (Al, Ca, Fe and S) measured over 1 year of acidification. Our results imply that ice-core time-series records developed after relatively short acidification periods likely underestimate both the magnitude and the variability of trace-element concentrations, potentially leading to bias in paleoclimate calibration work, which in turn could impact interpretations of past climate variability based on trace-element proxies.
Methods
Sample collection: WAIS Divide, Antarctica
Snow samples were collected from a 2.6 m snow pit dug in 2008 at the West Antarctic ice sheet (WAIS) Divide ice-core site (79.468° S, 112.086° W; 1766 m a.s.I.) within the clean-air sector of camp. Once the snow pit was excavated, one wall was cut back an additional ~20 cm using a plastic shovel cleaned with Citranox detergent and Millipore MilliQ deionized water. The wall was subsequently scraped back an additional ~4 cm using plastic scrapers that had been decontaminated using nitric acid and Milli-Q water. Sampling personnel wore Tyvek clean suits and double pairs of gloves; gloves were replaced whenever they became torn. Snow samples were collected using a specially built pure Ti sampling tool, which had been washed with Citranox detergent and Milli-Q water. Each acid-washed sample bottle was double-bagged for storage and shipment using plastic Ziploc bags to reduce contact with the environment. Samples were shipped frozen to the University of Maine and stored in a freezer until melting and analysis.
Experimental set-up
We combined Antarctic snow from several sample bottles and melted it in an acid-cleaned, capped Teflon® perfluoroalkoxy (PFA)-coated bottle using a warm water bath. Once the snow was fully melted, we homogenized it by shaking and inverting the bottle, then poured the water into three additional PFA bottles (~110 mL each). We then added Optima grade nitric acid (Fisher Scientific) to each bottle, resulting in volumetric concentrations of 0.1, 1.0 and 10% acid, respectively. We evaluated possible sorption of metals to the walls of the bottle used for melting the snow by swishing the bottle with a 10% nitric acid solution. Metal sorption was negligible (~0.5% of initial measured concentrations).
We analyzed samples after 20 min, 24 hours, 5 days, 14 days, 28 days, 56 days and 91 days. At each analysis time, we poured five replicates from each bottle (to avoid potential contamination from a pipette) into acid-cleaned 4 mL polypropylene (PP) vials for analysis. Samples were either analyzed immediately or frozen until later analysis. We analyzed samples using a Thermo Finnigan Element II inductively coupled plasma sector-field mass spectrometer (ICP-SFMS) with an ESI Apex sample introduction system and a PFA-ST nebulizer. Instrumental settings for the ICP-SFMS are given in Table 1. Procedural blanks (Milli-Q water) were treated identically and analyzed in parallel (e.g. 0.1, 1.0 and 10.0% (v/v) Optima grade nitric acid concentrations). All bottles were shaken periodically (about once a week) and prior to subsampling, and were kept in the dark at room temperature. All sample handling was conducted in a class 1000 clean room under a laminar flow High Efficiency Particle Air (HEPA) bench. Unfortunately, because we poured off replicates (rather than using a pipette for volumetric accuracy), we ran out of sample earlier than planned, and were not able to quantify recovery rates using hydrofluoric acid (HF) digestion.
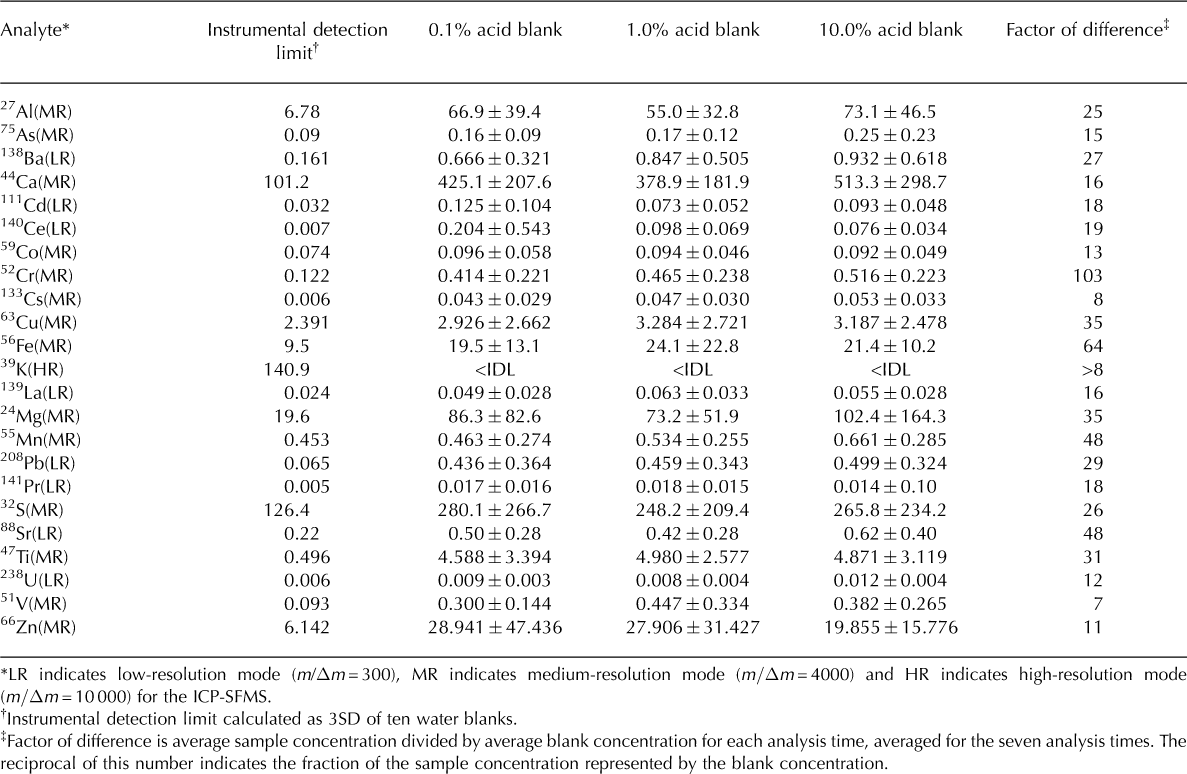
All five replicates were included in the calculations of mean concentration and standard deviation; the error bars shown are one standard deviation (1SD) of the mean concentration for each analysis time. Because melted snow and ice samples include both dissolved and suspended impurities, they are inherently heterogeneous; therefore, the standard deviation of each set of replicates likely represents real sample variability. We subtracted the average of five blank replicate measurements (for each acid treatment, at each analysis time) from each mean sample concentration, to correct for potential analytical inconsistencies. Blank concentrations remained well below the sample concentrations throughout the experiment (over an order of magnitude for most elements; Table 2). Data from this study will be made publicly available through the US National Snow and Ice Data Center (NSIDC).
Instrumental detection limit (IDL) and mean of 35 blank measurements with 1SD error. Blanks acidified to 0.1, 1.0 and 10.0% (v/v) nitric acid, respectively; all values reported in ng L–1. The number of reported decimal places reflects the analytical precision associated with measurement of each element
Sample collection and treatment: Denali National Park, Alaska
Snow samples were collected from a 4 m pit dug at Kahiltna Pass, Denali National Park, in 2008 (63.076° N, 151.174° W; 2957 m a.s.I.; Reference CampbellCampbell and others, 2012). Samples were collected at 5 cm resolution using trace metal clean techniques (as described above), and were stored in acid-washed bottles. Snow samples were shipped frozen, then melted and acidified to 1% (v/v) with Optima grade nitric acid under a HEPA bench. Samples were analyzed using ICP-SFMS at two time intervals spaced 383 days apart, and were stored at room temperature in the intervening time. All sample handling was conducted in a class 1000 clean laboratory.
Results and Discussion
Effects of acid strength and acidification time on measured concentrations
We tested the effects of two variables, acid strength and acidification time, on the measured concentration of trace elements in West Antarctic snow samples. While both variables had a positive effect on the measured concentration, we observed that the magnitude of concentration change depended on the element analyzed (Fig. 1). In general, increases with time were greater for the 0.1% acid treatment, because the initial concentration was low compared with the 1.0 and 10.0% acid treatments. Elements that increased minimally (i.e. <100%) relative to the initial concentration for all acid treatments include Mg, S, K, Ca and Cs. Elements that increased substantially with time (>100% after ≤1 month) for all three acid treatments include Al, Mn, Fe, Cu, Cd, La, Ce, Pb and U. We also observed large differences among the acid treatments, particularly early in the experiment. For example, from 20 min to 24 hours, Al increased by 7, 10 and 20%, respectively, for the 0.1, 1.0 and 10.0% acid treatments. From 20 min to 5 days, Al increased by 32, 62 and 82%, respectively, and, after 3 months, Al concentrations increased by 345, 374 and 397% for the three treatments. Although the relative differences among acid treatments decreased with time, Al concentrations at 3 months were still significantly different among the three treatments (2.1 ±0.18, 2.5±0.11 and 3.0±0.11 mg L–1, respectively; errors given are 1SD). Elements generally associated with soil dust (e.g. Al, Ti, V, Fe, Mn, La, Ce, Pr) were consistently leached more effectively by stronger acid; at the end of the 3 month experiment, concentrations of these elements were >1SD different from each other (e.g. Fe and Mn dissolution curves in Fig. 2). In contrast, more soluble elements such as K and Ca reached equivalent concentrations among the three acid treatments after 2–4 weeks (e.g. Ca dissolution curve in Fig. 2).
Bar plot showing percent increase in elemental concentration relative to the 20 min analysis, for selected acidification times, for each acid treatment. Snow-pit samples collected in Antarctica.

Concentrations of Ca, Cd, Fe and Mn with acidification time for each acid treatment measured in snow-pit samples from Antarctica.

Our second observation concerns the shape of the concentration profile. Figure 2 shows the four dominant patterns we observed. The Ca curve reveals that acid strength is the dominant factor affecting its measured concentration during the first 2 weeks, after which point the concentrations become statistically indistinguishable. K, Cs and As show a similar pattern (not shown). In addition, we observe that for the 1% and 10% acid treatments, the Ca concentration increases by ~1 mg L–1 from 20 min to 24 hours, then decreases by ~1.5 mg L–1 at 5 days, after which it increases by ~0.5 mg L–1 to its final value. We infer that some of the Ca precipitated and redissolved during this interval. The Cd, Fe and Mn curves show a common feature of the concentration profiles of most elements: a change in slope that occurs after about 2 weeks to 1 month. While the Cd and Mn concentrations appear to be reaching a steady state, the slope of the 10% acid Fe concentration curve suggests that at 3 months, Fe is still actively leaching into solution; Al has a similar pattern (not shown). The concentrations of all other dust-borne elements appear to have a decreasing slope from 1 to 3 months, suggesting that their concentrations are approaching a maximum acid-leachable fraction. This difference in slope between Fe and Al and other lithogenic elements may be explained by results from an East Antarctic trace-element study. Grotti and others (2011) used 0.45 µm filtration and two acid treatments (0.5% (v/v) nitric acid and an HF digestion) to evaluate particulate vs dissolved and acid-leachable vs total fractions of trace elements in surface snow. They found that 80–100% of Fe and Al was contained within the particulate fraction, while the particulate fraction of the lithogenic elements Co, Cr, Mn, Pb and V ranged from 20 to 70% (Reference Grotti, Soggia, Ardini and MagiGrotti and others, 2011). Thus the prolonged increases of Fe and Al concentrations in our samples likely reflect continuing dissolution of relatively refractory aluminosilicate and oxide minerals in dust.
Our results are consistent with those from other studies. Although they used a different type of acid (hydrochloric, added to reach pH 1.9), Edwards and others (2006) found that Fe concentrations leaching out of dust in snow samples from Law Dome, Antarctica, increased by a factor of three within the first month of acidification, and continued to increase for up to 3 months. Rhodes and others (2011) found that elemental dissolution from four different crushed rock standards (JG-2, granite; Nod-P-1, ferromanganese nodule; BHVO-2, basalt; and W-2, dolerite) acidified at 1% (v/v) nitric acid was both time- and mineral-dependent. Over the course of 2 months at room temperature, Al and Mn increased by ~350–5000% and ~100–500%, respectively, among the four rock standards (Reference Rhodes, Baker, Millet and BertlerRhodes and others, 2011). Elemental dissolution rates varied substantially: Mn concentrations in the JG-2 leachate approximately doubled in the first 3 weeks, then remained constant. In contrast, Al concentrations changed at a relatively consistent rate over the course of 12 weeks, increasing by a factor of ~4 over this time interval (Reference Rhodes, Baker, Millet and BertlerRhodes and others, 2011). In leachate from the Nod-P-1 standard, Al increased by a factor of ~3 in the first ~12 hours, then increased at a slowing rate until around 2 weeks, after which its concentration remained stable. Thus, trace-element dissolution depends on the mineralogy of the rock standard used, a finding that has direct implications for ice-core studies because the composition of dust deposited at ice-core sites changes as dust sources and transport change through time (e.g. Reference Marino, Maggi, Delmonte, Ghermandi and PetitMarino and others, 2004; Revel-Reference RollandRolland and others, 2006; Reference BoryBory and others, 2010).
The significant increases observed in trace-element concentrations as a function of acidification time have direct relevance to the different ICP-MS methodologies currently employed by the ice-core community. As stated earlier, the major difference among studies is the use of continuous vs discrete ICP-MS sample analysis, and the resulting differences in acid contact time. Although we did not analyze samples within seconds to minutes of acidification, our results show that the concentrations of most elements measured after 20 min of acidification did not represent those achieved after 3 months (Fig. 1). Knüsel and others (2003) undertook a direct comparison of conventionally cut and decontaminated ice-core samples with samples melted continuously and analyzed using a continuous-injection ICP-MS. They found that the continuous-injection method achieved similar concentrations of relatively soluble elements such as Na, Mg and Sr, but measured significantly lower concentrations of Al, V, Fe, As, Rb, Cd, Sb, Cs, Ba, La, Ce, Pr, Nd, Sm, Pb, Bi, Th and U compared with the conventional method. They attributed the lower concentration results of these lithogenic elements to reduced acid contact time (Reference Knüsel, Piguet, Schwikowski and Ga¨ggelerKnüsel and others, 2003). It is clear that results obtained using these two approaches are not comparable because of the inherent differences in the duration of acidification prior to analysis.
Effect of variable elemental dissolution on calculated crustal ratios and crustal enrichment factors
Lithogenic elements such as Al, Ce, Fe, La and Mn are commonly used as crustal dust tracers (e.g. Reference McConnell, Aristarain, Banta, Edwards and SimoesMcConnell and others, 2007). In turn, the enrichment of various trace elements (such as Pb, Bi and As) relative to their ratio to a given lithogenic element (or elements) in the upper continental crust (UCC) is used to infer the presence of non-crustal sources, or of changes in dust provenance through time (Reference GabrielliGabrielli and others, 2005; Reference OsterbergOsterberg and others, 2008; Reference MarteelMarteel and others, 2009; Reference DixonDixon and others, 2013). The crustal enrichment factor EFc is defined as Rsample/RUCC , where R is the ratio of the element of interest to a given reference element, such as Al. Although Reimann and De Caritat (2000) argued that enrichment factors have limited utility in environmental geochemistry, they remain a widely used tool within the ice-core community.
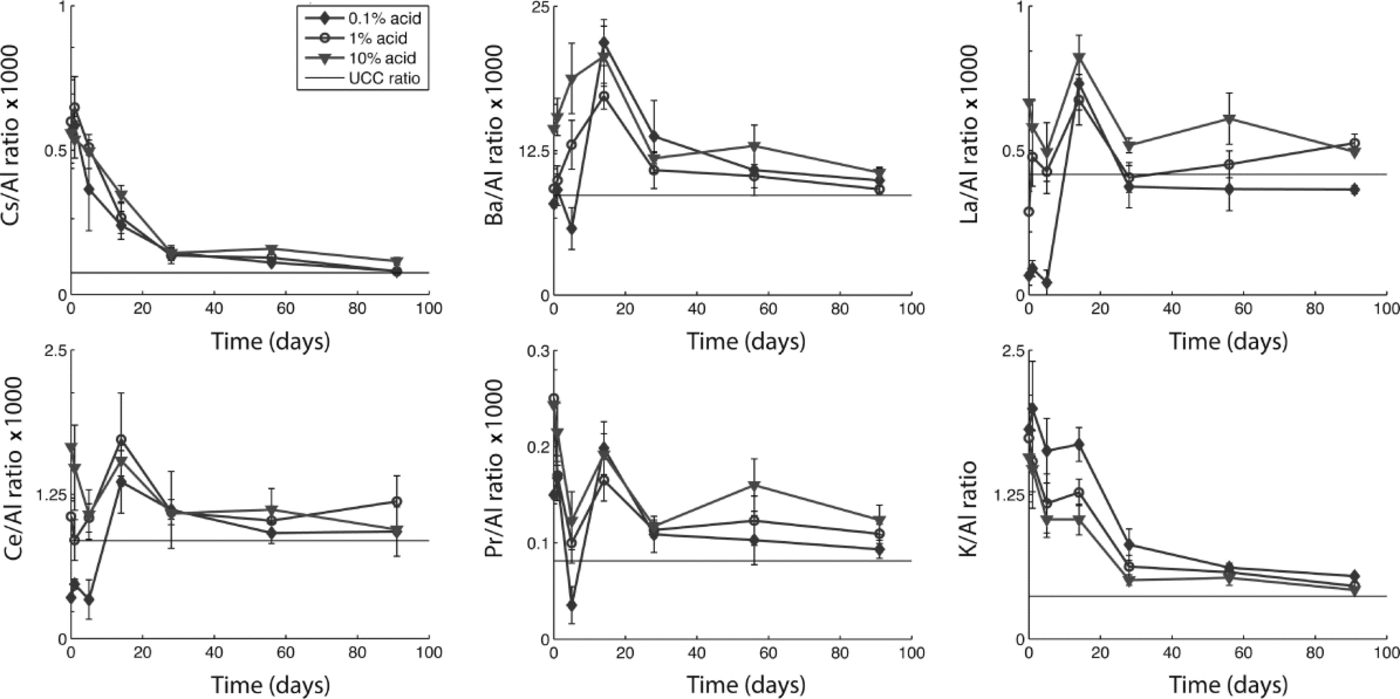
To explore how differential dissolution rates affect calculated crustal ratios and enrichment factors, we evaluated all trace elements in relation to Al, Ce, Fe, La and Mn. While our analysis suggests that many elements have sources other than continental dust (i.e. marine and volcanic aerosols), some elements do approach their UCC ratio after 1 month, suggesting that with sufficient acidification time they may be used as dust indicators. Figure 3 shows changes in the elemental ratios to Al through time for each acid treatment for Cs, Ba, La, Ce, Pr and K, along with their ratio in the UCC (Reference WedepohlWedepohl, 1995). While all these elements approach their UCC ratio to Al within 1–3 months (suggesting that they are dust-derived), it is clear that during the first month the ratio changes dramatically. Indeed, Ba/Al, La/Al, Ce/Al and Pr/Al fall both below and above the UCC ratio during the first week of acidification. Differences in the ratios among the three acid treatments are most apparent within the first month. With time, the ratios become more similar among treatments and closer to the UCC ratio. We found similar results for elemental ratios to Ce, Fe, La and Mn (not shown). These results suggest that dust flux estimates derived using elemental concentrations and crustal ratios will depend on the duration of acidification prior to analysis, and may vary depending on the relative solubility of different minerals.
Ratios of selected elements to Al with acidification time for each acid treatment measured in snow-pit samples from Antarctica. UCC ratios from Wedepohl (1995).
In order to see how incongruent element leaching might affect interpretations about possible anthropogenic pollution sources, we calculated crustal enrichment factors of Cs, Pb, As, Cr, Zn and U using Al as a reference element, and found that they all decreased with acidification time, by a factor of ~1.3 (Pb) to a factor of ~8 (Cs) (Fig. 4). In addition, the enrichment factors of Pb, As, Cr, Zn and U showed increases within the first month, likely as a result of higher solubility relative to Al. As Al continued to leach into solution, these enrichment factors all decreased to their final values, as measured at 3 months.
Calculated crustal enrichment factors of selected elements in Antarctic snow-pit samples, using Al as a reference element, for each acid treatment.

The differences in enrichment factors that we observed with acidification time can be compared with those measured during both preindustrial times and recent decades. We find that the observed change in EFc (As), a factor of ~2.6, is the same as that observed on glacial/interglacial timescales in the European Project for Ice Coring in Antarctica (EPICA) Dome C ice core. This was interpreted to suggest additional non-dust sources, or a possible shift in dust source area or transport parameters (Reference GabrielliGabrielli and others, 2005). In contrast, EFc (Pb) measured in the Mount Logan ice core, Canada, is a factor of ~15 above natural background (Reference OsterbergOsterberg and others, 2008), while we observed changes in EFc (Pb) of a factor of ~1.4. Thus, while our results suggest that enrichment factors calculated within the first month of dissolution are likely to be erroneously high, they would likely not be of the same order as those resulting from anthropogenic pollution.
Our results are supported by additional experimental and field measurements. Rhodes and others (2011) found that different rates of element dissolution from crushed rock standards led to very different ratios relative to the UCC ratio through time. They calculated crustal enrichment factors for a hypothetical dust created from four rock standards and leached at 1% nitric acid for 1 week, and found that EFc (U) decreased by a factor of ~2, using Al as a reference element (Reference Rhodes, Baker, Millet and BertlerRhodes and others, 2011). This is comparable with the change in EFc (U) that we observed over 3 months. Grotti and others (2011) determined that, compared with a full acid digestion, <20% of Fe and Al contained in Antarctic dust dissolved in a 0.5% nitric acid treatment. They cautioned against the calculation of crustal enrichment factors using these elements, unless fully digested.
One approach to minimize possible enrichment factor variation due to incongruent dissolution of trace elements is to use multiple reference elements (Reference OsterbergOsterberg and others, 2008). Given our results that lithogenic elemental ratios approached unity with the UCC ratio and that calculated enrichment factors of trace metals remained relatively constant after 1 month, we suggest that samples to be used for the calculation of enrichment factors are allowed to sit acidified at room temperature for at least 1 month prior to analysis. However, it must be kept in mind that incomplete dissolution of minerals will likely lead to some degree of overestimation of enrichment due to incongruent leaching; therefore, complete digestion using HF is the best approach when the intent is to calculate crustal enrichment.
Concentration dependence of measured elemental concentration increase
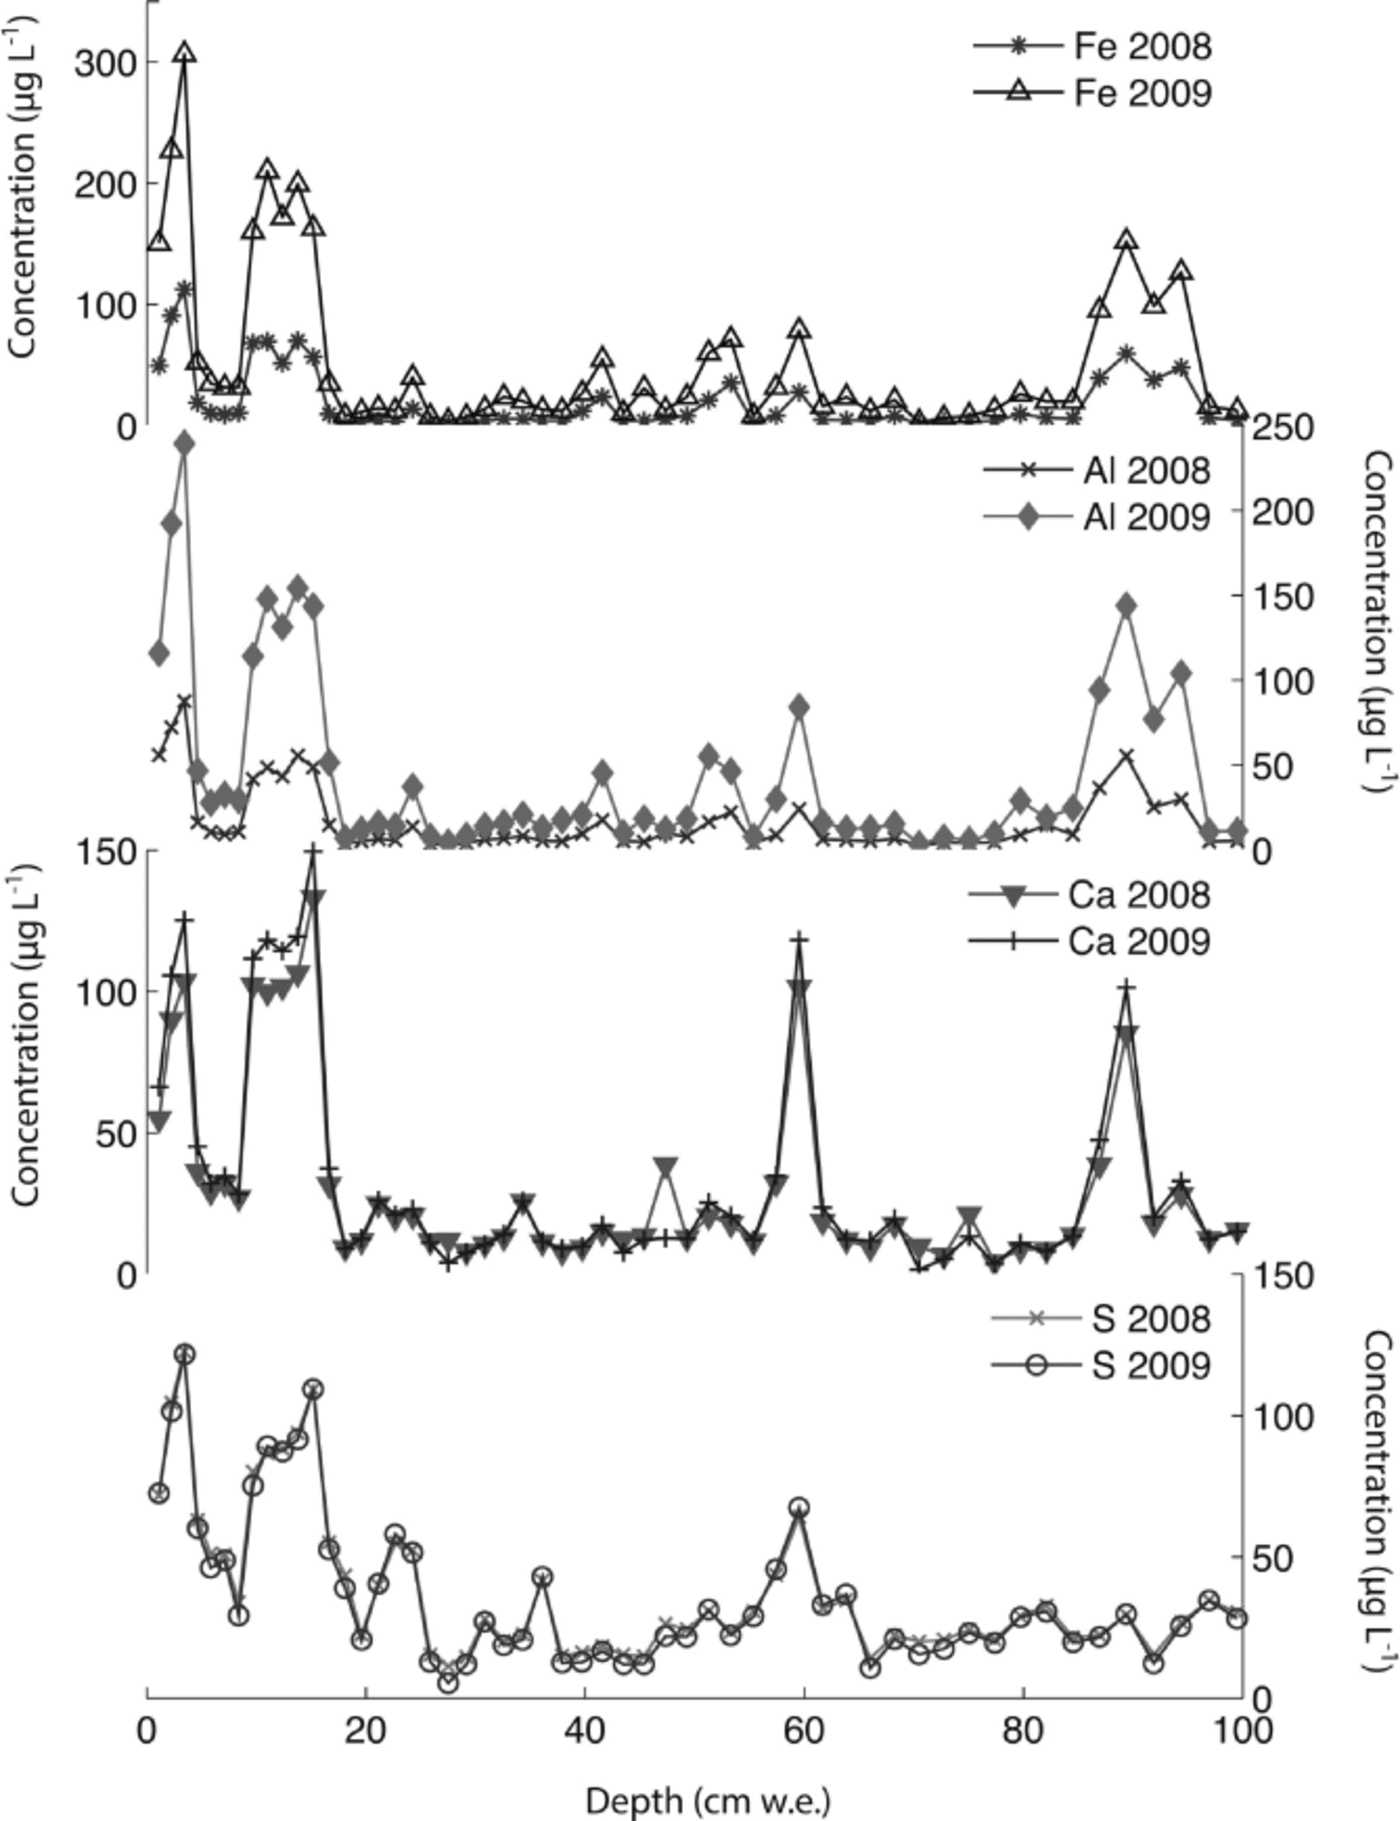
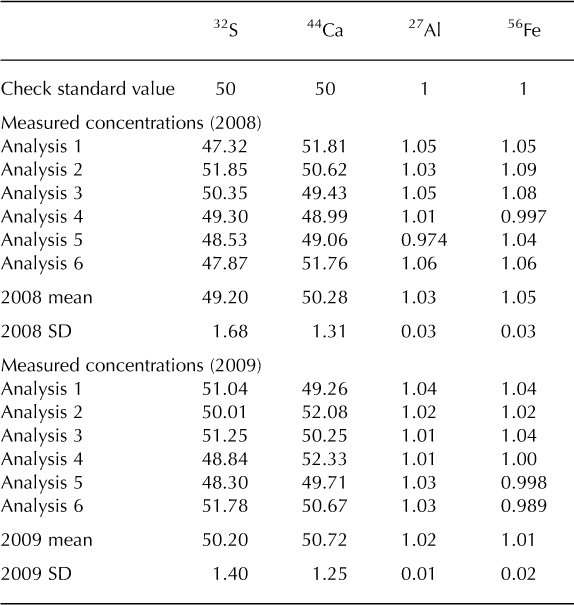
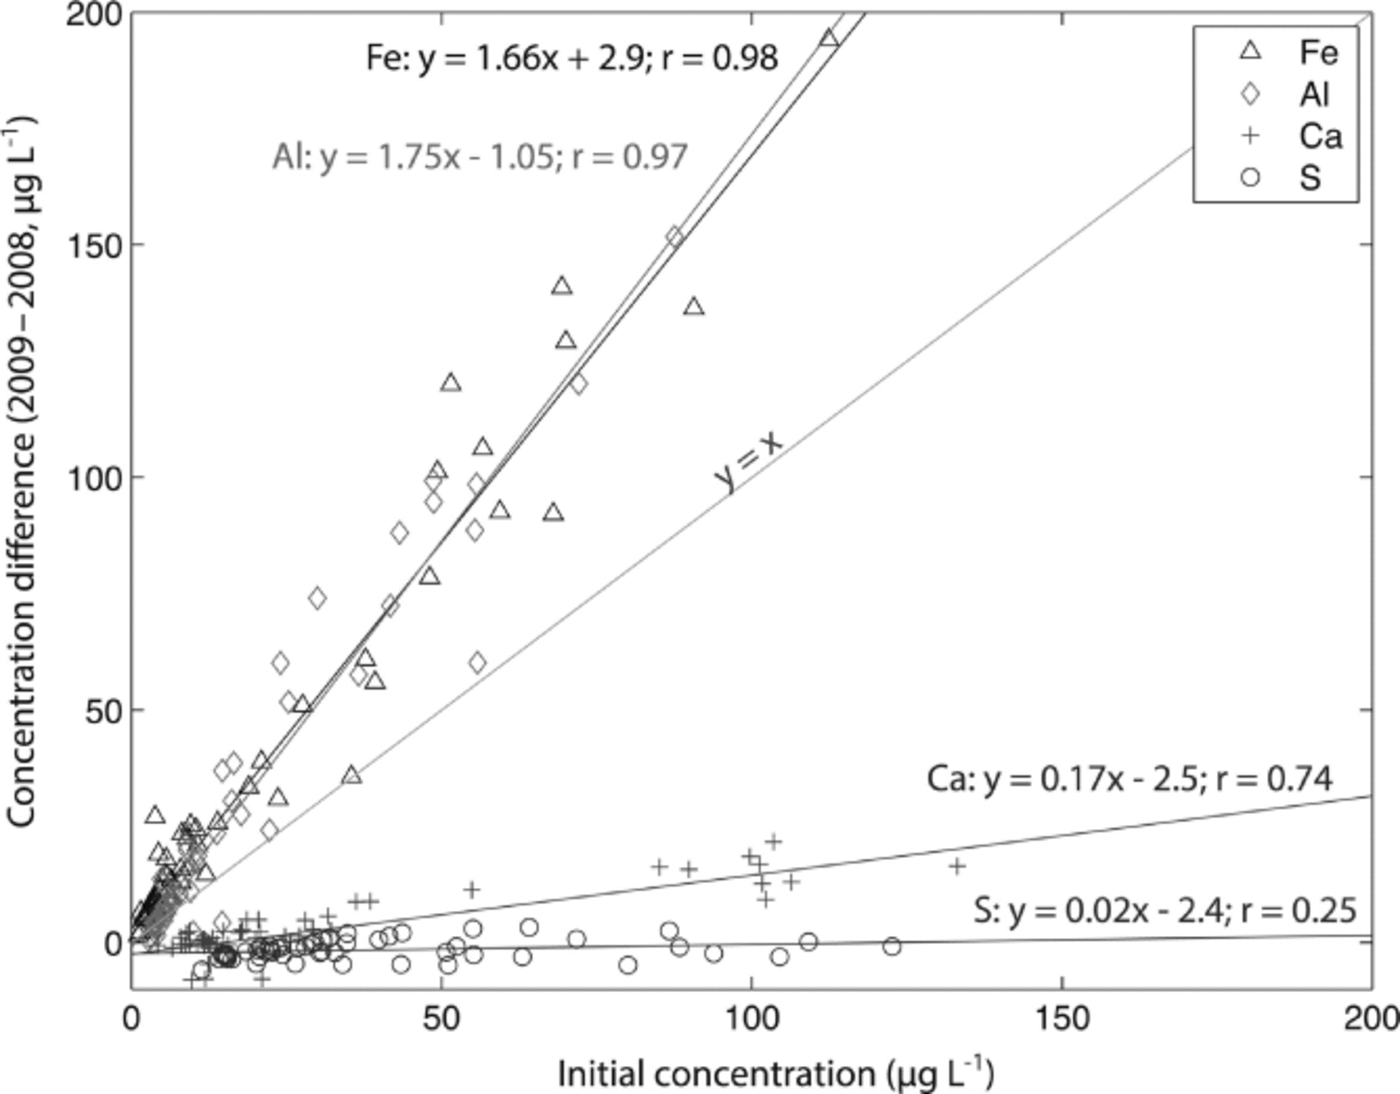
The Denali snow-pit data allow us to observe concentration changes over an extended time period (383 days) and to evaluate the effect of initial elemental concentration on the observed concentration increase during this time interval. We focus on four elements with different solubilities: S, Ca, Al and Fe. Al samples were treated with 1% (v/v) nitric acid. Figure 5 shows the measured concentrations of these four elements with depth, for both analysis times. The S curves are indistinguishable, while the Ca curves are very similar, but with some noticeable increases in concentration at the peak concentrations (e.g. at 3.4, 9.6–15.0, 59.5 and 89.4 cm depth). The Al and Fe curves show enhanced concentrations for nearly all values with time, and larger concentration changes within the peaks (as with Ca). Repeat measurements of instrumental check standards demonstrate the reproducibility of these data (Table 3). Figure 6 shows the concentration difference between 2009 and 2008 relative to the initial (2008) concentration. The S data remain around 0 and show no relationship with initial concentration (linear regression slope = 0.02; r = 0.25). The Ca data show a weak linear relationship between the change in concentration and the initial concentration (linear regression slope = 0.17; r = 0.74). In contrast, the Fe and Al data show strong positive linear relationships between measured concentration difference and initial concentration (Fe linear regression slope = 1.66; r = 0.98; Al linear regression slope = 1.75; r = 0.97). While Ca, Fe and Al all exhibit a linear relationship between initial concentration and concentration change with time, it is clear that the concentration dependence is much greater for Fe and Al than for Ca, suggesting that these elements are being leached from relatively refractory mineral phases. Rhodes and others (2011) used three different concentrations of the W-2 rock standard to look at how leachate concentration related to dust concentration. They found strong linear correlations (r = 0.98–1.00) between dust concentration and leachate concentration after 12 hours for Sr and Ce, in agreement with our results.
Concentrations of S, Ca, Al and Fe in Denali snow-pit samples analyzed 383 days apart in 2008 and 2009.
Concentrations (mg L–1) of internal check standard run with the Denali snow-pit samples in 2008 and 2009
Change in concentration over 383 days of acidification (2009–2008) vs initial concentration (2008) for S, Ca, Al and Fe measured in a Denali snow pit. Linear regressions are given for each element, and the y = x line is plotted for reference.
Potential implications for snow and ice-core data interpretation
The finding that analytical methods affect measured trace-element concentrations is not unique. It has been well documented in the oceanographic community, as marine chemists have sought to make clean reproducible measurements of Fe and other trace elements in the upper ocean (Reference Bruland, Franks, Knauer and MartinBruland and others, 1979; Reference Achterberg, Holland, Bowie, Mantoura and WorsfoldAchterberg and others, 2001; Reference Bowie, Townsend, Lannuzel, Remenyi and Van der MerweBowie and others, 2010) and in dust aerosols (Reference Sholkovitz, Sedwick, Church, Baker and PowellSholkovitz and others, 2012). However, a quantitative understanding of how methods affect measured chemical concentrations in ice cores is just beginning to emerge (Reference Knüsel, Piguet, Schwikowski and Ga¨ggelerKnüsel and others, 2003; Reference RuthRuth and others, 2008; Reference Rhodes, Baker, Millet and BertlerRhodes and others, 2011). Because of the significant differences we observed between measured elemental concentrations at different acid strengths and times, we emphasize that it is essential to treat all samples within individual studies in an identical manner. Moreover, given the variety of methods currently employed in ice-core studies, it is unlikely that two laboratories measuring trace elements in the same samples would achieve the same concentrations, unless they used identical methods.
To estimate the differences between continuous and discrete approaches to ICP-MS analysis of snow and ice-core samples, we use our 20 min acidification data as a proxy for continuous-injection ICP-MS and compare with our 1 month data (1% (v/v) nitric acid treatments for both cases). We find that Al increases from 0.534 ± 0.096 to 1.74 ± 0.226 µg L–1, an increase of 232%, and Fe increases from 0.402 ± 0.040 to 1.45 ± 0.187 µg L–1, an increase of 260%. Pb increases from 4.481 ± 0.450 to 11.505 ± 1.025 ng L–1, an increase of 157%, while EFc (Pb) decreases by a factor of 1.4, from 41.1 ± 6.1 to 29.8 ± 1.2. Similarly, As increases from 1.569 ± 0.234 to 2.481 ± 0.335 ng L–1, an increase of 158%, while EFc (As) decreases by a factor of 2.6, from 117.7 ± 10.0 to 43.8 ± 4.7. Thus, both elemental concentrations and calculated crustal enrichment factors show significant differences between these two methodological approaches.
Based on these results, we suggest that trends and general patterns (i.e. locations of peaks and troughs in a time-series record) should be consistent among different studies, while absolute concentrations and peak-to-trough amplitudes are likely to differ significantly depending on the acidification method used. Samples to be used for calculation of atmospheric fluxes and crustal enrichment factors must be acidified for at least 1 month prior to analysis to prevent potentially erroneous interpretations of trace-element data, and researchers should bear in mind that incomplete and incongruent leaching is likely to produce overestimates of crustal enrichment. Complete digestion using HF offers the best way to quantify deposition of the full range of trace elements (Reference CorreiaCorreia and others, 2003; Reference Grotti, Soggia, Ardini and MagiGrotti and others, 2011). Incorporating HF digestion even at low temporal resolution in ice-core studies would allow for the quantification of recovery rates, which will be a useful way to compare results obtained from different laboratories. More importantly, quantification of recovery rates would provide some level of standardization among studies conducted in different geographic locations, allowing for more accurate interpretations of spatial and temporal variability in trace-element deposition. Given the range of evidence presented here, we suggest that continuous-injection ICP-MS is not an appropriate tool for the quantitative analysis of Al, Ba, Cd, Ce, Co, Cr, Cu, Fe, La, Li, Mg, Mn, Pb, Pr, Sr, Ti, U, V or Zn in ice-core samples. Further, we believe there is a pressing need for a laboratory intercomparison study within the ice-core trace-element community.
Our results also have implications for the use of trace-element concentrations as proxies for past climate variability. Proxy development relies on finding meaningful, statistically significant relationships between trace-element concentration records and physical components of the climate system, such as zonal wind strength or sea-ice cover (Reference MayewskiMayewski and others, 1994; Reference Kreutz and SholkovitzKreutz and others, 2000; Reference Goodwin, Van Ommen, Curran and MayewskiGoodwin and others, 2004; Reference Yan, Mayewski, Kang and MeyersonYan and others, 2005; Reference DixonDixon and others, 2012). Relationships are established using observational or climate reanalysis data in the modern era, and interpretations are extended into the past using the ice-core proxy data. Because the commonly used Pearson’s linear correlation coefficient depends on actual values (rather than ranked values), our data suggest that the strength of correlation will depend on the relative concentrations of trace elements. Thus, different acidification methods could lead to potentially different so-called ‘calibrations’ of ice-core data, and therefore different interpretations about past climate variability, particularly in terms of the magnitude of events.
Conclusions
We conducted a 3 month experiment to test the effects of acid strength and acidification time on measured trace-element concentrations and calculated crustal enrichment factors in snow samples from West Antarctica. In addition, we used snow-pit samples from Alaska to evaluate the concentration dependence of measured increases in lithogenic element concentrations through time. Our analyses build on previous work (Reference Knüsel, Piguet, Schwikowski and Ga¨ggelerKnüsel and others, 2003; Reference Grotti, Soggia, Ardini and MagiGrotti and others, 2011; Reference Rhodes, Baker, Millet and BertlerRhodes and others, 2011) by providing clear evidence that trace-element relative concentrations in environmental samples depend on both acid strength and acidification time. Our results suggest the following conclusions:
-
1. Acid strength and acidification time significantly increase measured trace-element concentrations leached from impurities in snow samples collected from remote locations. Ice-core trace-element studies should allow at least 1 month for dissolution of particulate material in order to achieve a representative acid-leachable fraction. All studies should quantify the recovery rates achieved by their analytical methods using HF digestion.
-
2. Incongruent dissolution of elements leads to widely varying elemental ratios relative to their UCC ratios through time. Although we observed that many elements approached their crustal ratios after 1 month of acidification, we caution that complete congruent element dissolution can be achieved only through a full acid digestion. Therefore, crustal enrichment factors calculated for samples that have not been digested should be interpreted with this caveat in mind.
-
3. Lithogenic element dissolution is linearly dependent on dust concentration, though the slope of this relationship is element-specific and may change with dust lithology. Because relative trace-element concentrations depend on the acidification method used, trace-element proxies of past climate variability may not accurately represent the magnitude of past variability in the climate system.
-
4. An interlaboratory comparison study is needed within the ice-core trace-element community.
Acknowledgements
This work was supported by US National Science Foundation grants ANT-0636740, AGS-1203838 and ARC-0713974 and by the University of Maine Dissertation Research Fellowship to B.G.K. We thank the WAIS Divide Science Coordination Office, Ice Drilling Design and Operations Group, the National Ice Core Laboratory, Raytheon Polar Services Company and the 109th New York Air National Guard for field support in Antarctica. We also thank Timothy Bartholomaus, Thomas Bauska, Seth Campbell, John Fegyveresi, Shelly Griffin, Jonathan Hayden, Logan Mitchell, Anaı¨s Orsi, Mike Waskiewicz and Gifford Wong for field and laboratory assistance. We thank Nelia Dunbar, Stephen Norton, Rachael Rhodes and an anonymous reviewer for providing helpful comments which improved the manuscript.


