





Introduction
Depression is a prevalent mood disorder that imposes a significant burden on the world, both through direct medical costs and indirect productivity losses (Gore et al., Reference Gore, Bloem, Patton, Ferguson, Joseph, Coffey and Mathers2011; McCarron, Shapiro, Rawles, & Luo, Reference McCarron, Shapiro, Rawles and Luo2021). A large number of patients with depression do not receive timely medication, which may contribute to the development of major depressive disorder (MDD) (M. Zhang, Reference Zhang2010; Zhu et al., Reference Zhu, Jiang, Lang, Zhang, Fu, Zhang and Zhang2023). The lifetime prevalence of MDD, the second leading cause of disability in the Chinese population, is approximately 1.8% (G. Yang et al., Reference Yang, Wang, Zeng, Gao, Liang, Zhou and Murray2013). A cross-sectional study conducted in China revealed that only 0.5% of patients diagnosed with MDD received medication or psychotherapy (Lu et al., Reference Lu, Xu, Huang, Li, Ma, Xu and Zhang2021). This considerable discrepancy between the high prevalence of the disorder and the low treatment rate makes MDD a major public health problem that requires urgent attention in the realm of mental health in China. Unfortunately, our understanding of MDD remains limited, especially given the highly heterogeneous nature of the disorder, which is characterized by complex clinical subtypes and diverse symptoms (Lynch, Gunning, & Liston, Reference Lynch, Gunning and Liston2020).
Currently, the pathogenesis of MDD remains elusive, leading to significant heterogeneity across various domains such as symptomatology, biochemistry, genetics, and neuroimaging (Huang, Li, Shen, Liang, & Li, Reference Huang, Li, Shen, Liang and Li2023; Kunugi, Hori, & Ogawa, Reference Kunugi, Hori and Ogawa2015; B. Zhang et al., Reference Zhang, Li, Shen, Zhao, Yu and Tang2023; Drysdale et al., Reference Drysdale, Grosenick, Downar, Dunlop, Mansouri, Meng and Liston2017). To address this heterogeneity, classifying MDD into different subtypes is a promising approach (Buch & Liston, Reference Buch and Liston2021; Grosenick et al., Reference Grosenick, Shi, Gunning, Dubin, Downar and Liston2019; Han, Xu et al., Reference Han, Xu, Guo, Fang, Wei, Liu and Cheng2023). Researchers have categorized MDD from different perspectives (Huang et al., Reference Huang, Li, Shen, Liang and Li2023; Martin et al., Reference Martin, Wollny-Huttarsch, Nikolin, McClintock, Alonzo, Lisanby and Loo2020; Meng et al., Reference Meng, Wang, O’Donnell, Caron, Meaney and Li2022). For example, Martin et al. (Reference Martin, Wollny-Huttarsch, Nikolin, McClintock, Alonzo, Lisanby and Loo2020) aimed to classify patients with MDD based on cognitive symptoms, whereas Huang et al. (Reference Huang, Li, Shen, Liang and Li2023) identified two different subtypes of MDD based on the expression of endoplasmic reticulum stress genes. However, these classification methods are often based on phenomenological or genetic criteria only, resulting in a weak link to the underlying neuroanatomical pathophysiology. Phenomenology-based classification methods fail to establish clear diagnostic thresholds, while classification methods based on genetic factors have limited clinical relevance (Han, Xu, et al., Reference Han, Xu, Guo, Fang, Wei, Liu and Cheng2023; Okada et al., Reference Okada, Nakao, Sanematsu, Murayama, Honda, Tomita and Kanba2015). Therefore, there is a need to investigate alternative classification methods to better understand the heterogeneity of MDD.
In recent years, magnetic resonance imaging (MRI) has become a widely used tool for studying MDD disease-related patterns (Rolls et al., Reference Rolls, Cheng, Gilson, Qiu, Hu, Ruan and Feng2018; F.-F. Zhang, Peng, Sweeney, Jia, & Gong, Reference Zhang, Peng, Sweeney, Jia and Gong2018). Brain structure covariance-based networks represent a cutting-edge concept in this field. It suggests that inter-individual variations in brain morphological features tend to show covariation with changes in other brain regions (Alexander-Bloch, Giedd, & Bullmore, Reference Alexander-Bloch, Giedd and Bullmore2013; Chong, Dumkrieger, & Schwedt, Reference Chong, Dumkrieger and Schwedt2017). This phenomenon reflects the underlying functional organization of the network and highlights anatomical connectivity (Chong et al., Reference Chong, Dumkrieger and Schwedt2017; Lerch et al., Reference Lerch, Worsley, Shaw, Greenstein, Lenroot, Giedd and Evans2006). In a previous study, Xiong et al. (Reference Xiong, Dong, Cheng, Jiang, Sun, He and Yao2021) reported that patients with current MDD and those with a history of MDD exhibited reduced path length and small-world properties in their structural covariance networks. In addition, Nestor et al. (Reference Nestor, Mir-Moghtadaei, Vila-Rodriguez, Giacobbe, Daskalakis, Blumberger and Downar2022) demonstrated that these alterations in the structural covariance networks of patients with MDD were associated with their response to repetitive transcranial magnetic stimulation (rTMS) therapy. However, most of these studies have focused primarily on group-level differences, thereby neglecting heterogeneity among individuals with MDD (Wolfers et al., Reference Wolfers, Doan, Kaufmann, Alnæs, Moberget, Agartz and Marquand2018). This emphasis on group averages may mask the unique experiences and symptoms of individual patients. Therefore, it is imperative to investigate imaging heterogeneity in MDD patients from an individual perspective.
Liu et al. proposed the network template perturbation method to calculate the individualized differential structural covariance network (IDSCN) in 2021 (Liu, Palaniyappan et al., Reference Liu, Palaniyappan, Wu, Zhang, Du, Zhao and Feng2021). In their study, the researchers used the IDSCN of schizophrenia patients as a feature and successfully classified these patients into two subtypes, demonstrating the heterogeneity of schizophrenia from an individual perspective. To the best of our knowledge, there is no study using the network template perturbation method to investigate the heterogeneity of first-episode and drug-naive (FEDN) MDD patients. In this study, we calculated the IDSCN of each FEDN MDD patient, classified all patients into two subtypes based on the IDSCN features, and described the associated symptomatological and neuroimaging features of each subtype in a large multicenter sample in China.
Materials and methods
Participants
Structural magnetic resonance imaging (sMRI) data utilized in this study were obtained from the REST-meta-MDD project consortium (Yan, Wang, Zuo, & Zang, Reference Yan, Wang, Zuo and Zang2016). This consortium consists of 25 research teams from 18 hospitals in China (P. Liu, Li, et al., Reference Liu, Li, Zhang, Sun, Li, Chen and Zhang2021; Yan et al., Reference Yan, Wang, Zuo and Zang2016). Participants included in the study were required to meet the diagnostic criteria for MDD as defined by either ICD-10 or DSM-IV. For participants included in the study, the consortium members provided only basic information, including diagnosis, gender, age, educational background, and scores on the 17-item Hamilton Depression Rating Scale (HAMD-17) and the 14-item Hamilton Anxiety Rating Scale (HAMA-14). Prior to participation in the study, each participant submitted written informed consent to the local institution, which ensured the ethical integrity of the study and protected the rights of the participants.
Specific inclusion criteria for FEDN MDD patients were as follows: (1) meeting diagnostic criteria for MDD as assessed by the Structured Clinical Interview for the Diagnostic and Statistical Manual of Mental Disorders-IV (DSM-IV) or the International Classification of Diseases 10 (ICD-10); (2) a first episode of MDD; and (3) not having received any previous medication.
Exclusion criteria for all participants were as follows: (1) patients with remission or late-onset depression; (2) patients lacking basic demographic or clinical information, including gender, age, educational background, HAMD-17 scores, or HAMA-14 scores; and (3) patients with poor-quality imaging data, such as inadequate spatial normalization (Yan et al., Reference Yan, Chen, Li, Castellanos, Bai, Bo and Zang2019).
Based on the above criteria, we excluded 88 patients with a diagnosis of MDD and 38 healthy controls from the analysis (Yan et al., Reference Yan, Chen, Li, Castellanos, Bai, Bo and Zang2019). Of the eligible patients, we assessed 164 patients with FEDN MDD who met the criteria and selected 164 healthy controls (HCs) with similar sex ratios, age, and educational backgrounds to the patient group for analysis.
Clinical measures
In this study, we used the HAMD-17 to assess the severity of depression, and the HAMA-14 to assess the severity of anxiety in FEDN MDD patients. Higher scores on these scales indicate greater severity of depression or anxiety, respectively. Both the HAMD-17 and the HAMA-14 have demonstrated good reliability and validity in the Chinese population(Maier, Buller, Philipp, & Heuser, Reference Maier, Buller, Philipp and Heuser1988; Zheng et al., Reference Zheng, Zhao, Phillips, Liu, Cai, Sun and Huang1988).
MRI data acquisition, and preprocessing
T1-weighted MRI data were preprocessed using DPARSF software (Chao-Gan & Yu-Feng, Reference Chao-Gan and Yu-Feng2010) and then further processed using SPM 8 and VBM 8 toolbox (http://dbm.neuro.unijena.de/vb) (Yan et al., Reference Yan, Wang, Zuo and Zang2016). Images were normalized to template space and segmented into grey matter (GM), white matter (WM), and cerebrospinal fluid (CSF). Alignment to MNI space was done by the normalization function of the Diffeomorphic Anatomical Registration Through Exponentiated Lie algebra (DARTEL) toolbox.
Finally, the GM maps of each subject were smoothed using an 8 mm full-width at half maximum (FWHM) Gaussian kernel. In addition, we used the automated anatomical labeling atlas (AAL3) atlas (Rolls, Huang, Lin, Feng, & Joliot, Reference Rolls, Huang, Lin, Feng and Joliot2020) to divide the brain into 166 distinct regions and extracted the grey matter volume (GMV) of these regions for each individual for subsequent analysis.
Construction of IDSCN
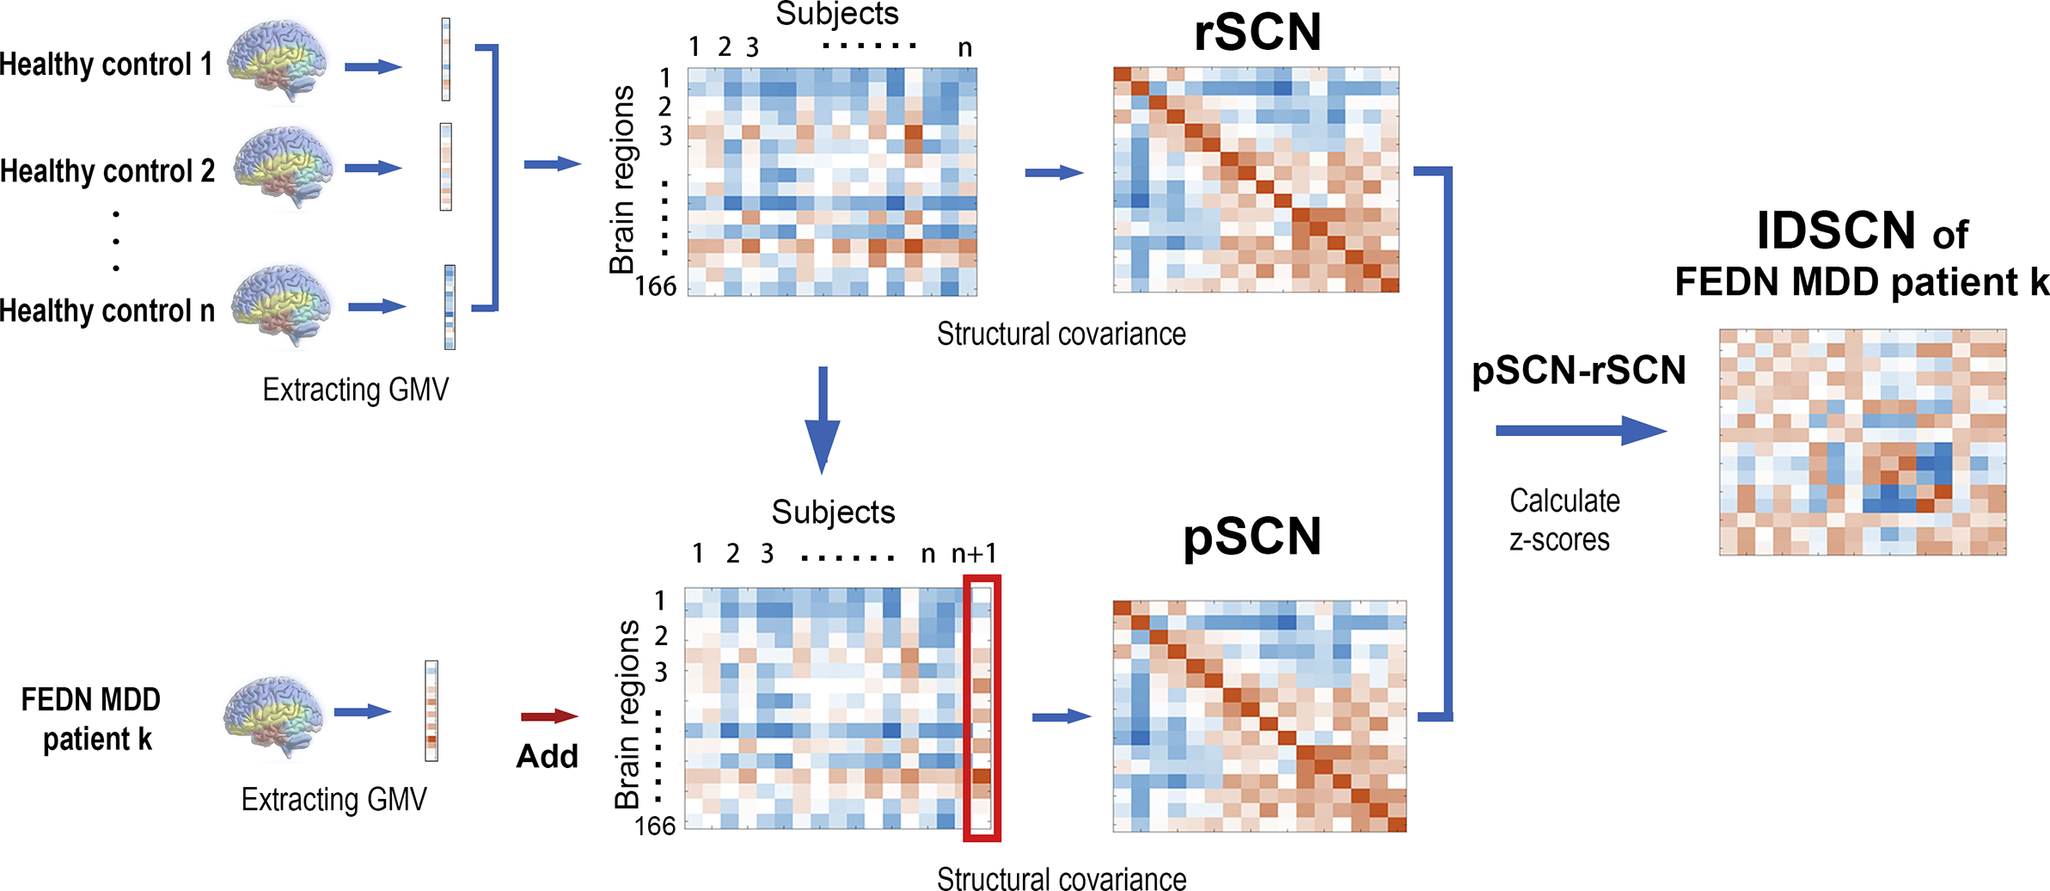
We constructed the IDSCN using the network template perturbation method, and we briefly described the method here (see Figure 1; Z. Liu, Li, et al., Reference Liu, Li, Zhang, Sun, Li, Chen and Zhang2021). (1) First, for the 164 HCs, we constructed the reference SCN (rSCN) by computing Pearson correlation coefficients of GMV between each pair of brain regions, with age, gender, educational level, and site information included as covariates. (2) Next, we divided a FEDN MDD patient (denoted as k) into HCs and repeated the previous step to construct the perturbed SCN (pSCN). (3) Then, we calculated the difference between the pSCN and rSCN to derive the difference SCN (dSCN), defined as dSCN = pSCN – rSCN. (4) Finally, the following equation was applied to derive the Z-value of dSCN to construct the IDSCN for patient k.
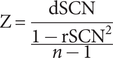 $$ \mathrm{Z}=\frac{\mathrm{dSCN}}{\frac{1-{\mathrm{rSCN}}^2}{n-1}} $$
Flowchart of IDSCN construction.
IDSCN, individualized structural covariance network; rSCN, reference SCN; pSCN, perturbed SCN.
We repeated the above steps for each FEDN MDD patient, constructing an IDSCN for each individual.
Subtyping FEDN MDD patients using the IDSCN
We calculated the p-value for each edge based on the Z-score of the edge in the IDSCN of each patient. After Bonferroni’s test (p < 0.001), we identified the edges in each patient’s IDSCN that were significantly different from the rSCN and counted the number of patients with significant differences in each edge. Ten edges with significant changes in at least 5% (i.e., 8 patients) of the patients were selected as features for k-mean cluster analysis. The number of clusters was set between 2 and 10, with the optimal number of subgroups determined by the maximum mean silhouette value, and 100 clusters were performed at each number of clusters to obtain the final clustering index (with maximum mean silhouette value).
Statistical analysis
Demographic and symptom scale data of all patients were analyzed using SPSS version 23.0. The chi-square test was used for gender differences between MDD patients and HCs and between the two subtypes of FEDN MDD patients. Two-sample t-tests were performed for continuous variables such as age, education, and symptom scores. The significance threshold for differences in data and clinical symptom scores was set at a p-value of <0.05.
To compare IDSCN edges between subtypes, we used the GRETNA toolkit with gender, age, education, and site information as covariates and analyzed the data using a two-sample t-test (Bonferroni corrected p < 0.05). In addition, we performed Pearson correlation analyses to investigate the relationship between altered edges and clinical symptom scores.
We used a two-sample t-test in the SPM12 software (http://www.fil.ion.ucl.ac.uk/spm/software/spm12/) to compare GMV in the two subtypes of patients with FEDN MDD. In addition, we included gender, age, education, and site information as covariates in the analyses. Multiple comparisons were controlled with a cluster-extent threshold combined with a height threshold of 0.001, to produce clusters with a family-wise error (FWE) of p < 0.05.
Results
Demographics
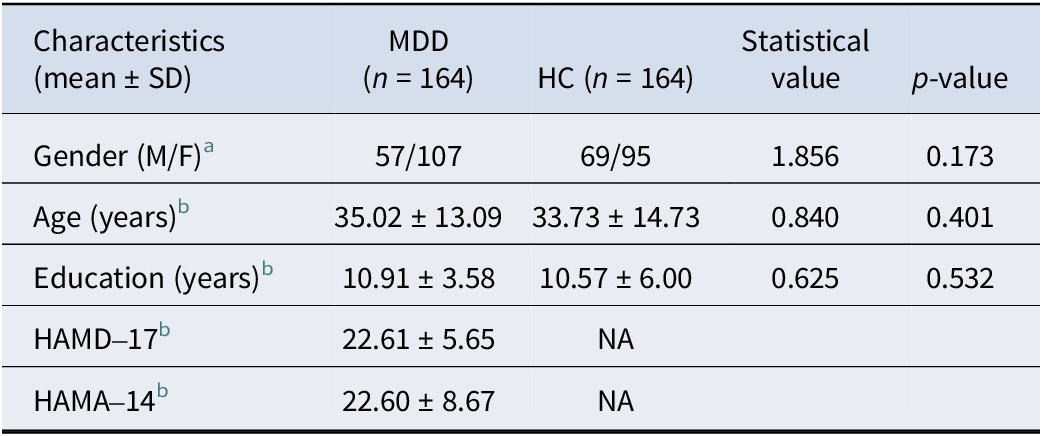
After quality control, a total of 164 patients with MDD and 164 HCs were included in this study. The demographic data and clinical characteristics of all subjects are shown in Table 1. There were no significant differences between MDD patients and HCs in terms of gender, age, and education (p > 0.05).
Demographic and clinical characteristics of all participants
Abbreviations: HC, ‘healthy controls’; MDD, ‘major depressive disorder’.
a Chi-square test.
b Two-sample t tests.
* p < 0.05.
Heterogeneity of IDSCNs in FEDN MDD patients
We constructed an IDSCN for each FEDN MDD patient based on AAL3. Subsequently, we obtained differential structural covariance edges for each FEDN MDD patient (p < 0.001, Bonferroni corrected 13695 edges). Of these difference edges, 10641 were shared by at least one patient, whereas 2635 difference edges were shared by at least two patients, further demonstrating the heterogeneity of covariance edges in the FEDN MDD structure.
Subtypes of FEDN MDD patients identified by IDSCN
We sorted all edges in descending order based on the number of patients exhibiting significant edge variation. We used the Z-scores of the top 10 connected edges that exhibited significant differences in at least 5% of patients as features for k-means clustering. When the silhouette coefficient reached its maximum value, we determined that the optimal number of clusters was 2. Therefore, we divided the FEDN MDD patients into two subgroups, which were identified as two different subtypes of FEDN MDD patients (subtype 1, n = 117; subtype 2, n = 47).
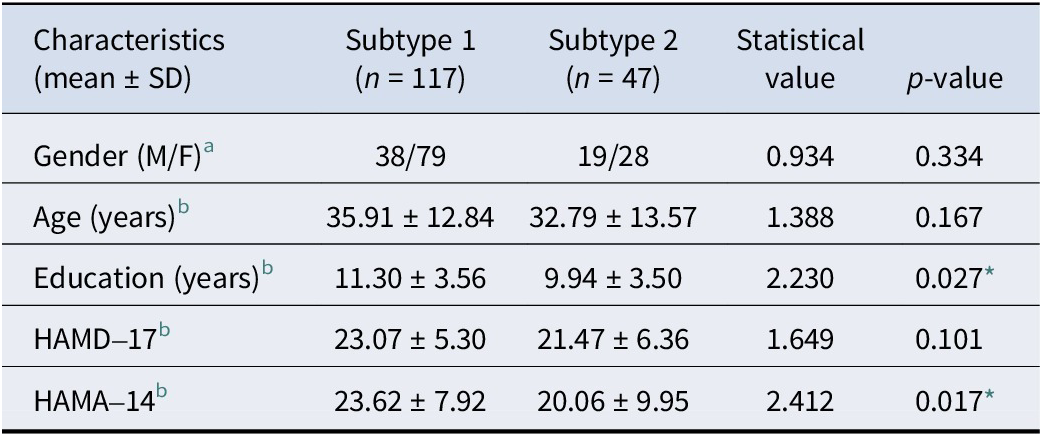
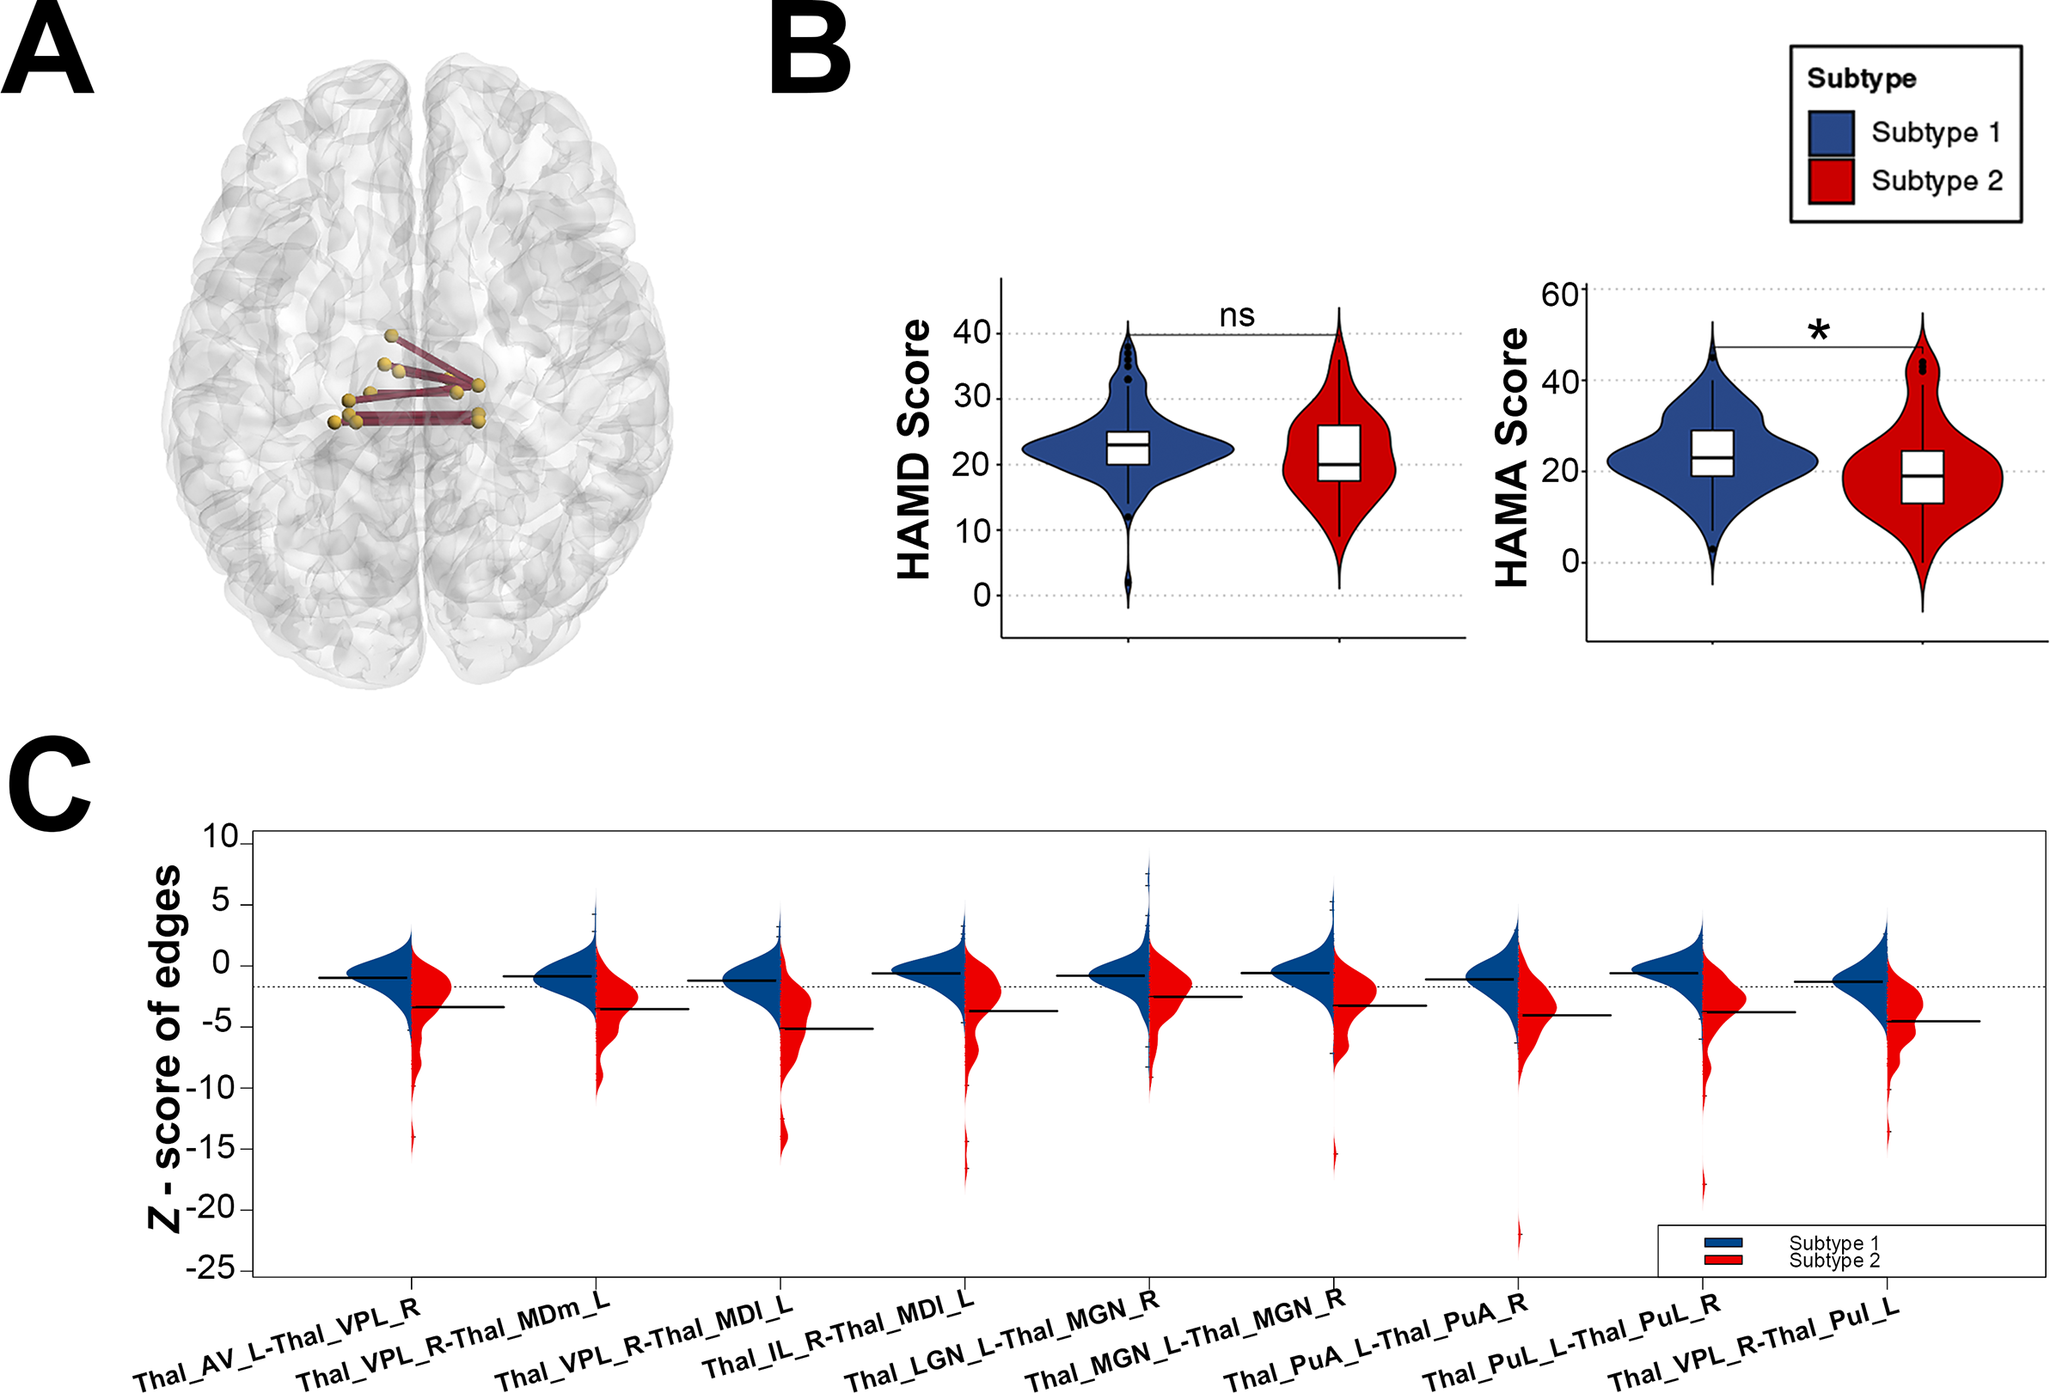
In addition, we compared the general demographic data of the two FEDN MDD subtypes and found no differences between the two subtypes in terms of age distribution and gender; however, there was a significant difference in terms of education (t = 2.230, p = 0.027) (see Table 2). In terms of clinical symptoms, patients with both FEDN MDD subtypes had similar levels of depressive symptoms; however, patients with subtype 2 had significantly higher levels of anxiety symptoms compared to subtype 1 (t = 2.412, p = 0.017) (see Table 2 and Figure 2B).
Demographic and clinical characteristics of two FEDN MDD subtypes
Abbreviations: HC, ‘healthy controls’; MDD, ‘major depressive disorder’.
a Chi-square test.
b Two-sample t-tests.
* p < 0.05.
(A) Structural covariance edges significantly stronger in subtype 1 than in subtype 2; (B) Differences in symptom scale scores between the two subtypes; (C) Differences in Z-scores of structural covariate edges between the two subtypes.
Thal_AV_L = Thalamus, Anteroventral, Left;Thal_VPL_R = Thalamus, Ventral posterolateral, Right; Thal_MDm_L = Thalamus, Mediodorsal medial magnocellular, Left;Thal_IL_R = Thalamus, Intralaminar, Right; Thal_MDl_L = Thalamus, Mediodorsal lateral parvocellular, Left;Thal_LGN_L = Thalamus, Lateral geniculate, Left;Thal_MGN_R = Thalamus, Medial Geniculate, Right;Thal_MGN_L = Thalamus, Medial Geniculate, Left;Thal_PuA_L = Thalamus, Pulvinar anterior, Left;Thal_PuA_R = Thalamus, Pulvinar anterior,Right;Thal_PuL_L = Thalamus, Pulvinar lateral, Left;Thal_PuL_R = Thalamus,Pulvinar lateral, Right;Thal_PuI_L = Thalamus, Pulvinar inferior, Left.
Differential structural covariance edges for the two FEDN MDD subtypes
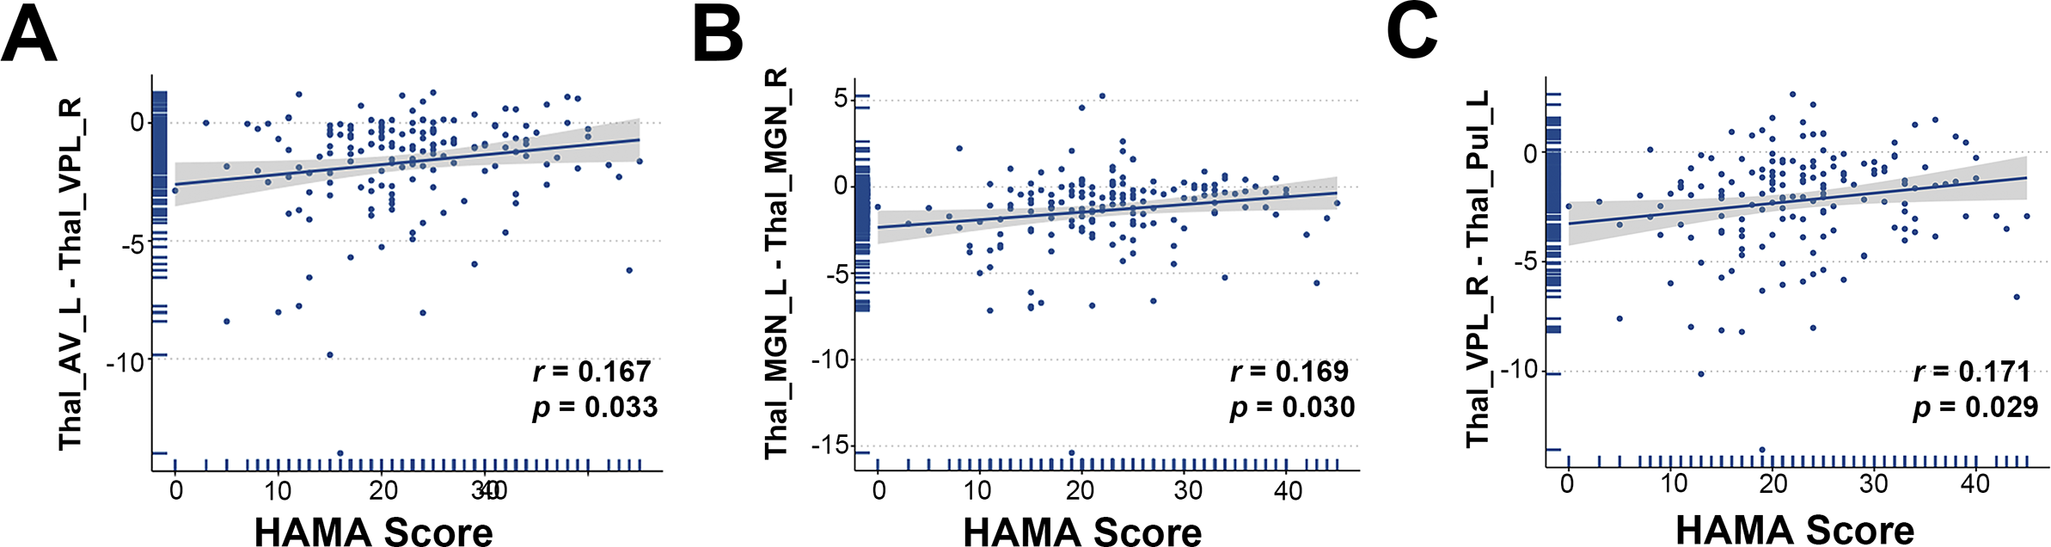
Nine of the top 10 structural covariance edges of the IDSCN were significantly different between the two FEDN MDD subtypes (Bonferroni corrected p < 0.05; Figure 2A). All nine edges belonged to the same category, and the Z-scores of their connecting edges were significantly higher in subtype 1 than in subtype 2 (Figure 2C and Table 3). These edges were mainly located in the thalamus. As shown in Figure 3, the Z-scores for all three edges, from the left anteroventral region of the thalamus to the right Ventral posterolateral region of the thalamus (Thal_AV_L-Thal_VPL_R), from the left medial geniculate region of the thalamus to the right medial geniculate region of the thalamus (Thal_MGN_L-Thal_MGN_R), and from the right ventral posterolateral region of the thalamus to the left pulvinar inferior region of the thalamus (Thal_VPL_R-Thal_PuI_L), were positively correlated with the anxiety symptom scores.
Structural covariance edges significantly stronger in subtype 1 than in subtype 2
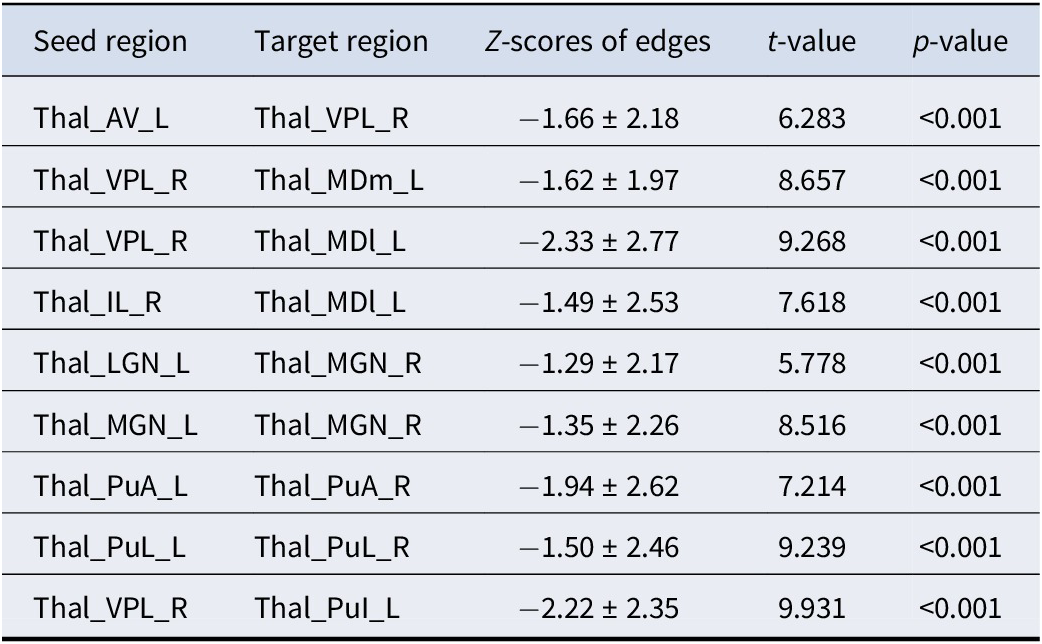
Thal_AV_L = Thalamus, Anteroventral, Left; Thal_VPL_R = Thalamus, Ventral posterolateral, Right; Thal_MDm_L = Thalamus, Mediodorsal medial magnocellular, Left; Thal_IL_R = Thalamus, Intralaminar, Right; Thal_MDl_L = Thalamus, Mediodorsal lateral parvocellular, Left; Thal_LGN_L = Thalamus; Lateral geniculate, Left; Thal_MGN_R = Thalamus, Medial Geniculate, Right; Thal_MGN_L = Thalamus, Medial Geniculate, Left; Thal_PuA_L = Thalamus, Pulvinar anterior, Left; Thal_PuA_R = Thalamus, Pulvinar anterior, Right; Thal_PuL_L = Thalamus, Pulvinar lateral, Left; Thal_PuL_R = Thalamus, Pulvinar lateral, Right;Thal_PuI_L = Thalamus, Pulvinar inferior, Left.
Scatterplot of the correlation between Z-scores of structural covariance edges and HAMA scores.
Thal_AV_L = Thalamus, Anteroventral, Left; Thal_VPL_R = Thalamus, Ventral posterolateral, Right;Thal_MGN_R = Thalamus, Medial Geniculate, Right;Thal_MGN_L = Thalamus, Medial Geniculate, Left;Thal_PuI_L = Thalamus, Pulvinar inferior, Left.
GMV differences between the two FEDN MDD subtypes
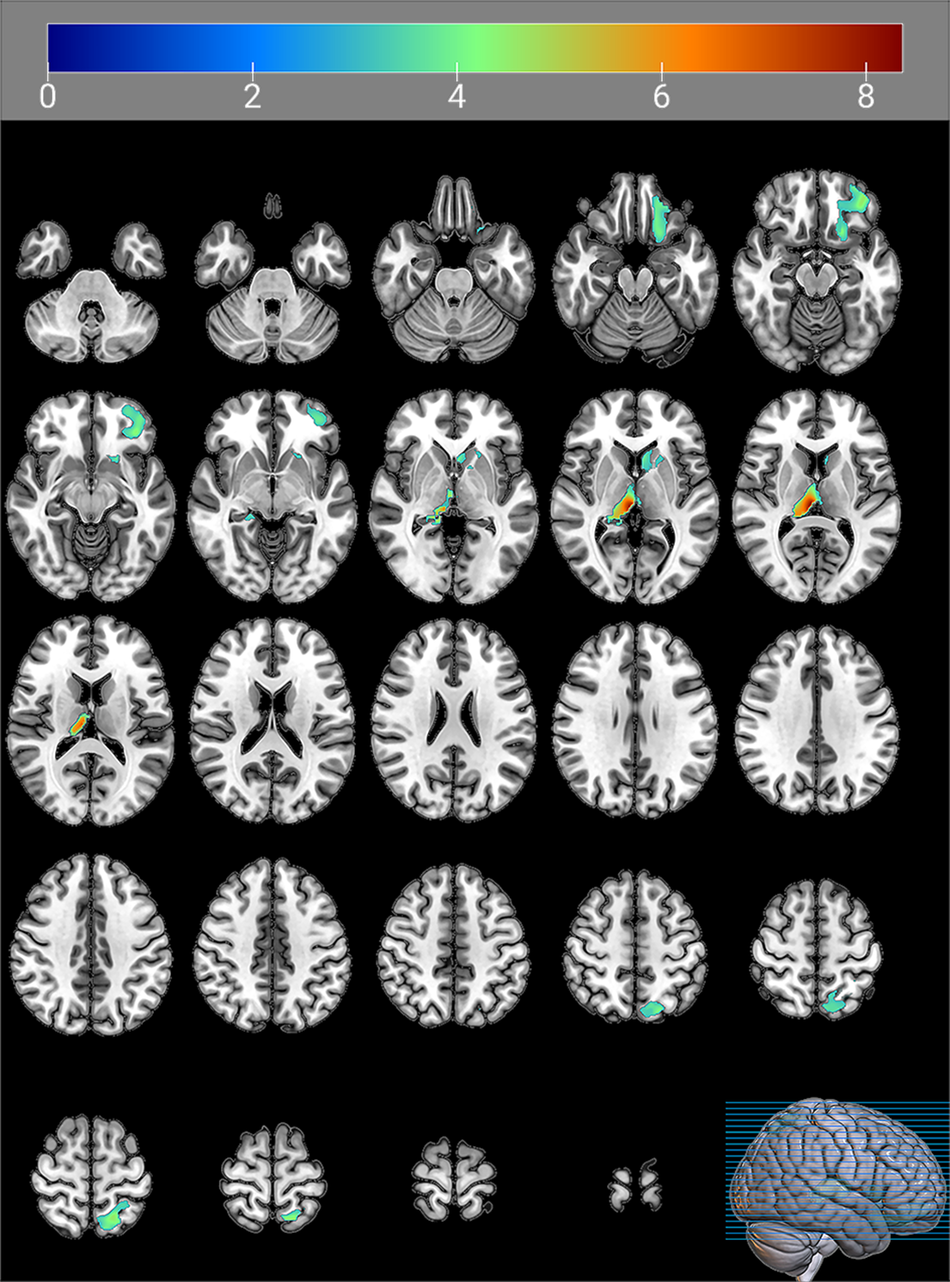
Significant differences in GMV were observed in three brain regions: the left hemisphere of the inferior orbital gyrus (Frontal_Inf_Orb_2_L), the right side of the middle nucleus of the thalamic pituitary nucleus (Thal_PuM_R), and the left hemisphere of the superior parietal gyrus (Parietal_Sup_L). Subtype 1 had lower GMV in all three regions than Subtype 2 (Table 4 and Figure 4).
Brain regions with significantly higher GMV in subtype 2 than GMV in subtype 1

Abbreviations: MNI coordinates, Coordinates of primary peak locations in the Montreal Neurological Institute space; Frontal_Inf_Orb_2_L, Inferior frontal gyrus pars orbitalis, Left; Thal_PuM_R, Thalamus, Medial Geniculate, Right; Parietal_Sup_L, Superior parietal gyrus, Left.
Brain regions with significantly higher GMV in subtype 2 than GMV in subtype 1.
The color bars indicate the t-value (FWE correction, cluster-p < 0.05, voxel-p < 0.001).
Discussion
In this study, we investigated the heterogeneity of FEDN MDD by IDSCN for the first time in a large multicenter sample in China. We successfully identified two distinct subtypes of FEDN MDD patients using edges in the IDSCN as features. These two subtypes differed significantly in clinical symptoms and neuroimaging findings. This study deepens our understanding of the heterogeneity of FEDN MDD patients from a neuroimaging perspective, providing new insights and informing a reference for precision medicine for FEDN MDD patients.
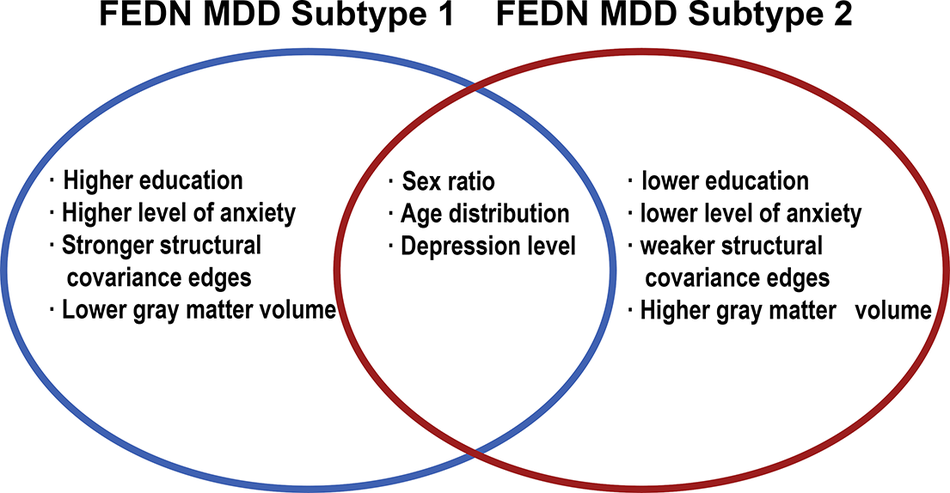
MDD is a disorder characterized by complexity and heterogeneity (Suseelan & Pinna, Reference Suseelan and Pinna2023). A complex interplay of psychological, social, biological, and other factors contributes to the onset and progression of MDD (Albert & Newhouse, Reference Albert and Newhouse2019; Demyttenaere et al., Reference Demyttenaere, Bruffaerts, Posada-Villa, Gasquet, Kovess and Lepine2004; Ménard, Hodes, & Russo, Reference Ménard, Hodes and Russo2016; Suseelan & Pinna, Reference Suseelan and Pinna2023). However, in clinical practice, MDD is often viewed as a universal disease, thus neglecting the various subtypes with varying manifestations. This oversight can lead to misdiagnosis of patients with MDD, adversely affecting subsequent accurate treatment (Kessler et al., Reference Kessler, van Loo, Wardenaar, Bossarte, Brenner, Ebert and Zaslavsky2017; Suseelan & Pinna, Reference Suseelan and Pinna2023). Misdiagnosis of MDD is very common, especially in differentiating it from bipolar disorder (Chen et al., Reference Chen, Jiang, Hou, Yue, Zhang, Zhao and Yuan2019; R. Yang et al., Reference Yang, Zhao, Tan, Lai, Chen, Zhang and Liu2023; H. Liu et al., Reference Liu, Zhao, Shi, Chen, Yao and Lu2018). A community-based study showed that only 38.4% of people with MDD met the diagnostic criteria (Mojtabai, Reference Mojtabai2013). Taken together, the heterogeneity of MDD poses a significant challenge to accurate diagnosis and treatment, while obscuring the underlying neuropathological mechanisms of the disease (Sun et al., Reference Sun, Liu, Ma, Duan, Wang, Xu and Xia2021). In response to the heterogeneity of MDD, researchers have attempted to classify MDD into different subtypes with a biological basis. In this study, we classified patients with FEDN MDD into two subtypes (subtype 1 and subtype 2) based on their IDSCN characteristics. Notably, there were significant differences in clinical symptoms between the two FEDN MDD subtypes; specifically, subtype 1 showed more severe anxiety symptoms than subtype 2 (see Figure 5). This finding suggests that the two FEDN MDD subtypes defined by neuroimaging features can manifest distinct clinical and behavioral phenotypes.
Summary of FEDN MDD subtypes.
In a previous study distinguishing subtypes based on MRI, Han, Zheng et al. (Reference Han, Zheng, Li, Zhou, Jiang, Fang and Cheng2023) used the same IDSCN approach as we did. Although Han et al. succeeded in classifying depressed patients into two strong neuroanatomical subtypes, their findings suggest that these subtypes are based purely on neuroimaging. They found differences in the IDSCN in motor and subcortical-cerebellar networks but did not observe significant differences in clinical symptoms, which contrasts with the findings in our current study. Notably, our sample was derived from the large, multi-center FEDN MDD cohort. Our study had a larger sample size, greater severity of depression, and greater representativeness than the study by Han, Zheng et al. (Reference Han, Zheng, Li, Zhou, Jiang, Fang and Cheng2023). The discrepancies between our findings and those of Han, Zheng et al. (Reference Han, Zheng, Li, Zhou, Jiang, Fang and Cheng2023) underscore that although MDD is a subtype of depression, it exhibits no less heterogeneity in neuroimaging than depression. The diagnostic criteria for MDD are more stringent than those for depression. According to the DSM-5 criteria, a diagnosis of MDD requires the presence of five out of nine symptoms, including depressed mood or anhedonia. This implies that even with such stringent criteria, there are 227 possible combinations of symptoms that can lead to an MDD diagnosis, highlighting the substantial heterogeneity of MDD (American Psychiatric Association, 2013). Therefore, identifying biologically relevant MDD diagnostic subtypes, elucidating its heterogeneity, and developing a dimensional rating system that goes beyond traditional MDD diagnostic categories are important directions for future neuroimaging research in MDD patients (Lynch et al., Reference Lynch, Gunning and Liston2020).In addition, Yang et al. (Reference Yang, Chen, Liu, Fan, Ouyang, Tao and Yang2025) recently classified 65 patients with FEDN MDD into two neurobiological subtypes using the Louvain community detection algorithm and cortical surface area as a feature. The clustering results of the study by Yang et al. showed that morphological heterogeneity was associated with the severity of anxiety symptoms, which is in line with the results of our study, and further supports the idea that the presence of subtypes defined by morphological features is associated with anxiety symptoms.
In this study, we found significant differences in IDSCN between the two FEDN MDD subtypes. Specifically, of the 10 structural covariance edges that were altered in 5% of patients, nine edges were significantly stronger in subtype 1 than in subtype 2, all of which were located in the thalamus. As the central hub of the cerebral cortical network, the thalamus is critical to the functioning of the cerebral cortex (W. Liu et al., Reference Liu, Heij, Liu, Liebrand, Caan, van der Zwaag and van Wingen2025). The thalamus is a key node for transmitting sensory signals to the brain and plays an important role in emotion regulation due to its close connections with regions such as the limbic system (Barson, Mack, & Gao, Reference Barson, Mack and Gao2020; B.-Z. Li et al., Reference Li, Cao, Zhang, Chen, Gao, Peng and Zhang2021; Saalmann, Pinsk, Wang, Li, & Kastner, Reference Saalmann, Pinsk, Wang, Li and Kastner2012). A study investigating thalamic networks showed significantly increased connectivity variability between higher-order cortical networks and the thalamus in patients with MDD compared to healthy individuals (Yu et al., Reference Yu, Zou, Nie, Li, Chen, Du and Luo2024). An extensive multicenter study, also based on REST-meta-MDD, found that the mean value of nodal efficiency in the thalamus was significantly abnormal in patients with MDD compared to healthy individuals (Zhou et al., Reference Zhou, Zhu, Ye, Jiang, Zhang, Kong and Consortium2024). Impaired top-down emotion regulation due to thalamic neuroarchitectural changes may be one of the etiological factors for patients with MDD (Webb, Weber, Mundy, & Killgore, Reference Webb, Weber, Mundy and Killgore2014). In addition, several studies have found that the thalamus is associated with anxiety. For example, Langhammer et al. found that connectivity between the thalamus and insula was significantly increased in patients with anxiety disorders (Langhammer et al., Reference Langhammer, Hilbert, Adolph, Arolt, Bischoff, Böhnlein and Lueken2024), suggesting that the thalamus plays a modulatory role in anxiety to some extent. This mechanism may be related to major projection sites in the medial nucleus of the thalamus, which include the prefrontal cortex, hippocampus, and amygdala regions that are closely associated with emotions such as anxiety and depression (Boelens Keun et al., Reference Boelens Keun, van Heese, Laansma, Weeland, de Joode, van den Heuvel and van der Werf2021; W. Liu et al., Reference Liu, Heij, Liu, Liebrand, Caan, van der Zwaag and van Wingen2025). This relationship could explain the significant differences in anxiety levels between the two FEDN MDD subtypes that we found based on structural covariation edges within the thalamus.
In addition, our present study found that subtype 1, which has significantly higher anxiety levels, exhibited lower GMV in the frontal lobe, parietal lobe, and thalamus. The frontal lobe is a core region of the human brain characterized by its large size and complex gyrus structure, which plays a crucial role in cognitive control and emotion regulation in patients with MDD (Catani, Reference Catani2019; Cheng et al., Reference Cheng, Rolls, Qiu, Liu, Tang, Huang and Feng2016; C. Li et al., Reference Li, Ren, Liu, Li, Liu, Wu and Wang2025). In patients with MDD, frontal and limbic circuits are thought to be intricately linked to emotion regulation. These circuits integrate bottom-up and top-down mechanisms associated with MDD and are critical to understanding the pathophysiology of this condition (Aleksandrova, Wang, & Phillips, Reference Aleksandrova, Wang and Phillips2019; Lai, Reference Lai2021). The importance of this key brain structure has been emphasized by both machine learning studies and basic experimental research (Aleksandrova et al., Reference Aleksandrova, Wang and Phillips2019; Gao, Calhoun, & Sui, Reference Gao, Calhoun and Sui2018). Studies have shown that the frontal and parietal lobes are key components of the Theory of Mind sub-network, influencing patients’ social cognitive and social perceptual abilities (Lai, Reference Lai2021; Wang, Wang, Chen, Zhu, & Wang, Reference Wang, Wang, Chen, Zhu and Wang2008). This may represent an important aspect of the pathophysiological basis of MDD. The two FEDN MDD subtypes identified in this study showed differences in anxiety symptoms and structural differences in the aforementioned brain regions. Furthermore, correlation analyses indicated a potential relationship between these structural changes and anxiety symptoms. However, the link between the anxiety-depression subtype (which has previously shown structural changes) and the subtypes defined in the present study has not been thoroughly investigated (Juan et al., Reference Juan, Shiwan, Yurong, Jiabo, Yu, Shui and Qing2024; Qiao et al., Reference Qiao, Tao, Wang, Shi, Chen, Tian and Lu2020). Future research needs to further explore the potential link between the newly defined subtypes in this study and widely recognized MDD subtypes such as anxious depression.
Several limitations should be acknowledged in this study. First, our assessment was limited to anxiety and depressive symptoms in MDD patients. Due to the limited availability of detailed scale data from some research institutions in the REST-meta-MDD consortium, we were unable to analyze individual dimensions in the HAMD-17 and HAMA-14 in more detail. Future studies should incorporate more diverse assessment tools to allow for more comprehensive and nuanced analyses of MDD patients. Second, although we explored the neuroimaging and clinical characteristics of the two subtypes identified in this study, our analyses did not extend to the genetic level, which distinguishes our work from similar studies in the field. This is an important area for future investigation within the framework of the FEDN MDD study.
Conclusions
In this study, we conducted cluster analysis based on individual-level characteristics, utilizing each patient’s unique IDSCN to identify patients with FEDN MDD into two stable subtypes. These subtypes exhibited distinctive neuroanatomical features and clinical symptom profiles. Notably, this subtype differentiation has often been overlooked in previous population-based analyses. Our multicenter, large-scale study not only revealed significant neuroimaging heterogeneity in FEDN MDD patients at the individual level but also provided valuable insights for advancing personalized therapeutic strategies and precision medicine approaches in MDD treatment.
Data availability statement
The data used in this study were obtained from the official REST-meta-MDD website (https://www.scidb.cn/en/detail?dataSetId=cbeb3c7124bf47a6af7b3236a3aaf3a8).
Acknowledgments
This study thanks all subjects who participated in this project, and all members of the REST-meta-MDD consortium.
Author contributions
Xiangyang Zhang designed the study, Songhao Hu analyzed the data and drafted the work, and Li Zhu revised the draft. All three authors have consented to the submission of this manuscript. Songhao Hu and Li Zhu share the first authorship.
Funding statement
This study was supported by National Clinical Key Specialty Construction Project of China, Anhui Province Medical and Health Key Specialty Construction Project, and Open Fund Project of the Anhui Province Key Laboratory of Philosophy and Social Sciences for Adolescent Mental Health and Crisis Intelligent Intervention (SYS2023C07). The funders were not involved in any aspect of the study, including its design, execution, data collection, management, analysis, interpretation, manuscript preparation, review, approval, or the decision to publish.
Competing interests
The authors all declare no conflict of interest.
Ethical standard
The authors assert that all procedures contributing to this work comply with the ethical standards of the relevant national and institutional committees on human experimentation and with the Helsinki Declaration of 1975, as revised in 2008.


 Open access

