


Introduction
Major depressive disorder (MDD) is a debilitating condition that is associated with a considerable reduction in quality of life, functional disability, and social impairment (Dunn, Reference Dunn2012; Bockting et al., Reference Bockting, Hollon, Jarrett, Kuyken and Dobson2015). In the search for etiological factors that explain the development of MDD, systemic low-grade inflammation has been suggested as a candidate mechanism. Sickness behavior-related symptoms, such as fatigue, loss of energy, motor slowing, or social withdrawal, resemble symptoms that are associated with depression (Dantzer et al., Reference Dantzer, O'Connor, Freund, Johnson and Kelley2008). It has therefore been proposed that depression may constitute a maladaptive or exacerbated form of sickness behavior occurring in cases where inflammation is permanent and systemic (Smith, Reference Smith1991; Dantzer et al., Reference Dantzer, O'Connor, Freund, Johnson and Kelley2008; Haroon et al., Reference Haroon, Raison and Miller2012).
Several recent meta-analyses examining cross-sectional and prospective links between depressive symptoms or MDD on the one hand, and inflammatory markers on the other, have either yielded small effects (Valkanova et al., Reference Valkanova, Ebmeier and Allan2013; Haapakoski et al., Reference Haapakoski, Mathieu, Ebmeier, Alenius and Kivimäki2015; Köhler et al., Reference Köhler, Freitas, Maes, de Andrade, Liu, Fernandes, Stubbs, Solmi, Veronese, Herrmann, Raison, Miller, Lanctôt and Carvalho2017; Horn et al., Reference Horn, Long, Nelson, Allen, Fisher and Byrne2018; Smith et al., Reference Smith, Au, Ollis and Schmitz2018), or no effects in a selection of higher quality studies (Horn et al., Reference Horn, Long, Nelson, Allen, Fisher and Byrne2018). Effect sizes for specific inflammatory markers such as C-reactive protein (CRP), interleukin-6 (IL-6), and tumor necrosis factor α (TNF-α) show considerable heterogeneity, both across individual studies and individual meta-analyses. These findings indicate remaining uncertainty regarding the relationship between depression and inflammation. They also highlight the important role of demographic, lifestyle, or disease-related covariates, since relations are often attenuated or disappear completely when additional factors are considered (O'Connor et al., Reference O'Connor, Bower, Cho, Creswell, Dimitrov, Hamby, Hoyt, Martin, Robles, Sloan, Thomas and Irwin2009; Smith et al., Reference Smith, Au, Ollis and Schmitz2018).
We see three reasons for the inconsistency in the literature that we aim to address in the present study. First, studies differed regarding the specific inflammatory markers studied. While a detailed review of the literature is beyond the scope of the present paper, it is worth noting that different markers serve different biological functions and are not interchangeable. CRP and IL-6, for instance, are increasingly understood as markers of somatic maintenance rather than an acute inflammatory response, contrasting TNF-α (Del Giudice and Gangestad, Reference Del Giudice and Gangestad2018).
Second, studies differed regarding covariates accounted, which might in part explain differences in results (O'Connor et al., Reference O'Connor, Bower, Cho, Creswell, Dimitrov, Hamby, Hoyt, Martin, Robles, Sloan, Thomas and Irwin2009; Köhler et al., Reference Köhler, Freitas, Maes, de Andrade, Liu, Fernandes, Stubbs, Solmi, Veronese, Herrmann, Raison, Miller, Lanctôt and Carvalho2017; Smith et al., Reference Smith, Au, Ollis and Schmitz2018). This calls for work that includes several inflammatory markers; includes more covariates; and examines relations between depression and inflammatory markers before and after covariate adjustment.
Third, most previous studies investigated the link between inflammatory markers and a sum of depressive symptoms or MDD diagnoses, which leaves open the possibility that links between markers and symptoms occur differentially. If only a subset of symptoms is related to inflammatory markers, sum scores or diagnoses would lack the power to pick up associations. Differential relations are plausible given recent work in the emerging field Symptomics, showing that individual depressive symptoms differ in their associations with risk factors (Fried et al., Reference Fried, Nesse, Zivin, Guille and Sen2014), neural activity (Stringaris et al., Reference Stringaris, Vidal-Ribas Belil, Artiges, Lemaitre, Gollier-Briant, Wolke, Vulser, Miranda, Penttilä, Struve, Fadai, Kappel, Grimmer, Goodman, Poustka, Conrod, Cattrell, Banaschewski, Bokde, Bromberg, Büchel, Flor, Frouin, Gallinat, Garavan, Gowland, Heinz, Ittermann, Nees, Papadopoulos, Paus, Smolka, Walter, Whelan, Martinot, Schumann and Paillère-Martinot2015), impairment of functioning (Tweed, Reference Tweed1993; Fried and Nesse, Reference Fried and Nesse2014), in response to life events (Keller et al., Reference Keller, Neale and Kendler2007), and in response to antidepressant treatment (Hieronymus et al., Reference Hieronymus, Emilsson, Nilsson and Eriksson2016) (see Fried and Nesse, Reference Fried and Nesse2015 for a review). In sum, differential relations between depressive symptoms and inflammatory markers could explain inconsistent results in the literature, and offer an opportunity to move the field forward.
Seven studies provide preliminary evidence for such differential relations between depressive symptoms and inflammation. Jokela et al. (Reference Jokela, Virtanen and Batty2016) modeled associations between nine DSM-5 symptoms and CRP, and identified robust relations of CRP with sleep problems, tiredness, and changes in appetite. Fairly consistent with this study, White et al. (Reference White, Kivimäki, Jokela and Batty2017) found specific relations between CRP and restless sleep, fatigue, low energy, and feeling depressed. Lamers et al. (Reference Lamers, Milaneschi, de Jonge, Giltay and Penninx2018) identified robust associations between the MDD symptom increased appetite and markers CRP and TNF-α. Chu et al. (Reference Chu, Stochl, Lewis, Zammit, Jones and Khandaker2019) found that IL-6, but not CRP levels at age 9 predicted diurnal mood variation, concentration difficulties, fatigue, and sleep disturbances at age 18; somatic and psychological symptom dimensions were related to IL-6, but not CRP. Duivis et al. (Reference Duivis, Vogelzangs, Kupper, de Jonge and Penninx2013) split depressive symptoms into a cognitive and a somatic subscale, and found associations between somatic symptoms and CRP, IL-6, and TNF-α; the relationships disappeared when covariates were controlled for. Moriarity et al. (Reference Moriarity, Mac Giollabhui, Ellman, Klugman, Coe, Abramson and Alloy2019) examined a prospective cohort of adolescents and investigated predictive relationships of baseline inflammatory markers on changes in five depression subscales. CRP levels – but not IL-6, IL-8, IL-10, or TNF-α levels – predicted increases in the lack of personal and social interest subscale, controlling for several demographic and biological variables. Finally, Lamers et al. (Reference Lamers, Bot, Jansen, Chan, Cooper, Bahn and Penninx2016) identified differences between the relation of melancholic and atypical depression subtypes to inflammatory markers, which could be driven by differences between individual symptoms.
In the present study, we explore links between the markers CRP, IL-6, and TNF-α and depressive symptoms with and without covariate adjustment in a large diverse sample of 2321 participants. In doing so, we extend the prior literature in seven aspects. First, some prior studies decomposed the depression sum-score into subtypes or subscales – often with limited reliability (Moriarity et al., Reference Moriarity, Mac Giollabhui, Ellman, Klugman, Coe, Abramson and Alloy2019) – but did not model individual symptoms. Second, studies that modeled individual symptoms focused on a limited subset of symptoms such as the DSM-5 criteria (Jokela et al., Reference Jokela, Virtanen and Batty2016) or the eight-item CES-D (White et al., Reference White, Kivimäki, Jokela and Batty2017). However, DSM descriptions are narrower than descriptions of MDD found in textbook literature (Kendler, Reference Kendler2016), and common rating scales for depression feature over 50 distinct symptoms (Fried, Reference Fried2017). To maximize content validity, we chose to model 28 depressive symptoms. Third, most studies featured a limited set of inflammatory markers and covariates, which we extend in the present study to three markers and seven covariates. Fourth, we utilize a large sample of 2321 participants along the whole continuum of depression severity. Fifth, we use network models specifically developed for uncovering unique shared associations in highly multivariate data (Epskamp and Fried, Reference Epskamp and Fried2018). The goal is to test whether specific symptoms of depression are related to specific inflammatory markers after controlling for all other depressive symptoms, markers, and covariates. Sixth, we provide the first conceptual replication of a prior study on depressive symptoms and inflammatory markers (Jokela et al., Reference Jokela, Virtanen and Batty2016), using the same variables. Finally, we model the relationships between markers and symptoms in various stages of complexity, from networks with four nodes to networks of 38 nodes, and specifically investigate the impact covariate adjustment has on the relationships. Given the inconsistency of the prior literature, we have no strong a priori hypotheses; the nature of the paper is exploratory.
Method
Participants
The present study used data gathered as part of the Netherlands Study of Depression and Anxiety (NESDA), a multisite, naturalistic, longitudinal cohort study that observes the course of mood and anxiety disorders (for details, see Penninx et al., Reference Penninx, Beekman, Smit, Zitman, Nolen, Spinhoven, Cuijpers, De Jong, Van Marwijk, Assendelft, Van Der Meer, Verhaak, Wensing, De Graaf, Hoogendijk, Ormel and Van Dyck2008). Participants in this study were recruited from Dutch primary care practices, specialized mental health institutions, as well as from community samples. The total sample comprises 2981 participants: 373 healthy subjects, 1701 participants with a current depressive and/or anxiety disorder, and 907 participants with earlier episodes of these disorders or at high risk for their development. We included all 2321 participants who had no missing data, covering the whole continuum of depressive symptomatology from healthy to severe clinical depression. We excluded 122 participants with CRP levels above 10 mg/L to avoid bias due to acute infection; a Welch two-sample t test revealed that these participants (M = 22.67, s.d. = 12.58, N = 122) did not differ from the analytic sample (M = 20.85, s.d. = 14.1, N = 2321) on the Inventory of Depressive Symptomatology (IDS), t (137.48) = 1.55, p = 0.123. The Ethical Commission of each participating care center approved the study protocol. All participants provided written informed consent.
Measurement instruments
Inventory of Depressive Symptomatology
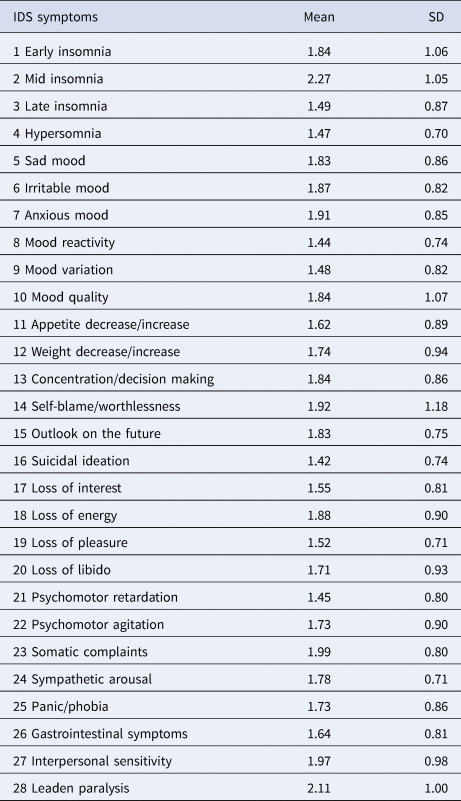
NESDA used the self-rated version of the Inventory of Depressive Symptomatology to assess depression severity (IDS-SR; Rush et al., Reference Rush, Gullion, Basco, Jarrett and Trivedi1996; see Table 1). Symptoms were scored 0–3 and rated regarding frequency in the last week before assessment. We analyzed 28 symptoms, nine DSM-5 MDD criteria, and the sum-score. Symptoms 11 and 12 on the IDS constitute compound measures that assess appetite increase/decrease and weight increase/decrease; unfortunately, their coding scheme did not allow us to separate increase from decrease. To estimate scores on DSM-5 MDD criteria, individual IDS symptoms were compounded by their maximum value (e.g. sleep problems was coded as the highest score on any of the four sleep-related items).
IDS symptoms
Inflammation biomarkers
Plasma blood samples were used to assess systemic baseline levels of CRP, IL-6, and TNF-α (for details see online Supplementary Materials). Markers were selected because they are most commonly studied.
Covariates
Choice of demographic, lifestyle, and chronic disease-related covariates was based on previous research (Duivis et al., Reference Duivis, Vogelzangs, Kupper, de Jonge and Penninx2013; Haapakoski et al., Reference Haapakoski, Mathieu, Ebmeier, Alenius and Kivimäki2015). We included age; sex; alcohol intake measured with the Alcohol Use Disorders Identification Test (AUDIT; Saunders et al., Reference Saunders, Aasland, Babor, de la Fuente and Grant1993); smoking status assessed via self-report (never smoker, former smoker, current smoker); body mass index (BMI); general disease burden measured by the number of chronic diseases currently being treated; and physical activity measured with the International Physical Activity Questionnaire (IPAQ; Craig et al., Reference Craig, Marshall, Sjöström, Bauman, Booth, Ainsworth, Pratt, Ekelund, Yngve, Sallis and Oja2003) in minutes of exercise per week corrected for the amount of energy that a given activity required (MET minutes).
Statistical analyses and procedure
We used the statistical software R (version 3.4.4) to carry out the statistical analyses. Skewed distributions of CRP, IL-6, TNF-α, alcohol, exercise, and IDS total score were normalized using the non-paranormal transformation (Liu et al., Reference Liu, Lafferty and Wasserman2009). The R code to reproduce all analyses is available in the online Supplementary Materials (https://osf.io/5832e/); we also provide all model output such as adjacency to make the analyses reproducible.
Network estimation
We estimated seven network models (see Table 2 for an overview), from simple to more complicated models.
Overview of the seven network models

a All = sex, age, alcohol, smoking, chronic diseases, BMI, exercise.
b Conceptual replication of the study by Jokela et al. (Reference Jokela, Virtanen and Batty2016).
c Model 4 equals model 3b, with the only difference that model 3b is regularized (which puts small coefficients to exact zero) and leads to a much more conservative estimate of relations, whereas model 4 only controls for multiple testing.
We estimated unique relations among symptoms, markers, and covariates. In network models, variables are considered ‘nodes’, and ‘edges’ between nodes are conditional dependence relations that can be understood as partial correlations. Given that our data consisted of categorical, ordinal, continuous, and count variables, we estimated Mixed Graphical Models (MGMs) with the R-package mgm (Haslbeck and Waldorp, Reference Haslbeck and Waldorp2019). To avoid false-positive findings, mgm uses the least absolute shrinkage and selection operator (LASSO, Tibshirani, Reference Tibshirani1996), leading to a sparse network structure. The LASSO shrinks all edge-weights toward zero and sets small weights to exactly zero. The strength of the penalty is controlled by a parameter λ, which we selected using the Extended Bayesian Information Criterion (EBIC; Foygel and Drton, Reference Foygel and Drton2010). For a tutorial paper on regularized network models, see Epskamp and Fried (Reference Epskamp and Fried2018). The EBIC itself has a tuning parameter γ, which we set to 0 for the main models in the paper (see online Supplementary Materials for a detailed rationale). As recommended in recent literature, we also estimated the final model without any regularization (Williams et al., Reference Williams, Rhemtulla, Wysocki and Rast2019) whilst still controlling for the false-positive rate.
We also estimated node predictability, which quantifies how well a node can be predicted by nodes it shares an edge with. This can be interpreted akin to R 2 (Haslbeck and Fried, Reference Haslbeck and Fried2017; Haslbeck and Waldorp, Reference Haslbeck and Waldorp2018).
We used the R-package qgraph (Epskamp et al., Reference Epskamp, Cramer, Waldrop, Schmittmann and Borsboom2012) to visualize the network structures. Blue edges represent positive conditional dependence relations among variables, red edges depict negative relations. We used bootstrapping routines implemented in the package bootnet (Epskamp et al., Reference Epskamp, Borsboom and Fried2017) to gain information on the precision of parameter estimates (see online Supplementary Materials).
Results
Sample characteristics
The final sample (n = 2321) included 808 men (34.8%) and 1513 women (65.2%). Mean age was 42.9 years (s.d. = 12.9) for men and 40.5 years for women (s.d. = 12.9); age range was 18–65. IDS scores ranged from 0 to 69. Half of all participants were not or only mildly depressed. Mean BMI was 25.25 (s.d. = 4.6). In total, 870 participants were current smokers (37.7%); 780 used to smoke (33.4%); and 671 had never been regular smokers (28.8%). The mean score on the AUDIT was 4.9 (s.d. = 4.7), indicating that problematic drinking was absent, on average. Mean exercise scores amounted to 3685 MET minutes per week (s.d. = 3096). Finally, 75% of all participants reported treatment for none or one chronic disease; 25% reported more.
The means and standard deviations of all symptoms are presented in Table 1. Inflammatory markers were inter-related, with correlations of r = 0.30 (CRP and IL6), r = 0.16 (IL6 and TNF-α), and r = 0.14 (CRP and TNF-α), which is consistent with different biological functions among markers (Del Giudice and Gangestad, Reference Del Giudice and Gangestad2018). In the remaining analyses, sex is coded as men = 0 and women = 1; a positive association between, e.g. depression and sex therefore implies that women scored higher on depression.
Depression sum-score model
We report edge weights and predictability values that were most relevant to our research questions. Unless stated otherwise, edge weights represent positive relationships.
Figure 1 shows the relationship between IDS total score and inflammatory markers without covariates (1a) and with covariates (1b). In network 1a, the IDS total score was related to CRP and IL-6. Inflammatory markers were related amongst each other, with the highest regularized partial correlation between CRP and IL-6. IL-6 and CRP yielded the highest predictability estimates (10.9% and 10.2%, respectively). Predictability of the IDS sum score was 1.4%, indicating that it shared little variance with the other variables.
Network displaying the relationship between IDS total score and inflammatory markers before (panel A) and after controlling for covariates (panel B). Blue edges constitute positive partial correlations between variables, red edges constitute negative partial correlations; rings around nodes convey variance in a given variable with shadowed parts displaying that part of the variance in each node that is explained by nodes that connect with it.

When corrected for covariates (1b), the relationship between IDS total score and IL-6 was attenuated, and the link with CRP disappeared. Instead, the IDS total score shared an edge with all covariates, the strongest of which were chronic diseases and smoking. The IDS total score was negatively related to exercise; CRP was positively related to sex, IL-6, and TNF-α negatively; CRP and IL-6 were related to BMI. BMI had the highest predictability value (25.7%); followed by 21.4% for CRP, 15% for IL-6, and 4.8% for TNF-α. Predictability for the IDS total score increased to 7.9%.
Replication and extension of Reference Jokela, Virtanen and BattyJokela et al.
Figure 2 depicts the results that build on and extend the findings of Jokela et al. (Reference Jokela, Virtanen and Batty2016). Network 2a shows the relationship between DSM-5 MDD criteria and CRP with sex and age as covariates. CRP was associated with ‘sleep problems’, ‘energy level’, and ‘appetite/weight’ – the same symptoms identified by Jokela et al. (Reference Jokela, Virtanen and Batty2016) – and further with age and sex. Highest predictability scores were observed for ‘interest/pleasure’ (58.6%), ‘sad mood’ (54.4%), and ‘energy level’ (51.1%). CRP predictability was 3.4%.
(a) Network displaying the results of the conceptual replication of the study by Jokela et al. (Reference Jokela, Virtanen and Batty2016), featuring DSM-5 MDD criteria, CRP, and covariates. (b) Extension of the original study, excluding five additional covariates. Blue edges constitute positive partial correlations between variables, red edges constitute negative partial correlations; rings around nodes convey variance in a given variable with shadowed parts displaying that part of the variance in each node that is explained by nodes that connect with it.

When corrected for the influence of additional covariates, CRP shared an edge with ‘sleep problems’ and ‘energy level’ (2b). Moreover, CRP showed a strong edge with BMI as well as connections with sex and smoking. Age and chronic diseases were correlated. Highest predictability values were observed for ‘interest/pleasure’ (58.5%), ‘sad mood’ (54.3%), and ‘level of energy’ (51.8%). CRP predictability increased to 17.3%; predictability for BMI was 26.3%.
Regularized full model
Figure 3 displays the relationship between 28 depressive symptoms and inflammatory markers without covariates (3a) and with covariates (3b). In network 3a, CRP and IL-6 were associated with ‘aches and pain’. Symptoms tended to have higher predictability values (e.g. ‘sad mood’, 65.3%; ‘interest’, 55.2%; ‘energy level’, 59.4%) than inflammatory markers (CRP, 9.2%; IL-6, 10.8%; TNF-α, 3%).
Network displaying the relationship between depressive symptoms and inflammatory markers before (a) and after controlling for covariates (b). Blue edges constitute positive partial correlations between variables, red edges constitute negative partial correlations; rings around nodes convey variance in a given variable with shadowed parts displaying that part of the variance in each node that is explained by nodes that connect with it.

When corrected for covariates (3b), no single edge emerged between markers and depressive symptoms emerged, while connections among inflammatory markers remained robust. CRP was connected with sex and BMI; IL-6 shared an edge with age and BMI; TNF-α was connected with chronic diseases. Predictability was 19.8% for CRP, 11.9% for IL-6, and 4.4% for TNF-α. Predictability of depressive symptoms varied considerably, from 9.1% for ‘sleeping too much’ to 65.3% for ‘feeling sad’. Predictability values were 26.6% for BMI and 17.2% for chronic diseases.
Non-regularized full model
We re-estimated the final network 3b without regularization while still controlling the false-positive rate. This led to a sparse network (40.3% of all edges were exact zero), for which numerous symptom–marker relations emerged. Four symptoms were consistently related to all three inflammatory markers: ‘trouble falling asleep’, ‘sleep too much’, ‘aches and pain’, and ‘irritability’. All except one relationship (‘irritability’ with IL-6) were positive (Fig. 4).
(a) Network displaying a less conservative estimation of network 3b containing all variables, without regularization but controlling for multiple testing. (b) The same network as in (a), except that we only display and zoom in on relations between markers and symptoms to facilitate interpretation.

Sensitivity and stability analyses
In the results, edges between symptoms and markers disappeared in two cases when entering more variables: 2b featured two symptom–marker edges (CRP with ‘energy level’ and ‘sleep problems’), 3b featured none. Similarly, 3a contained two symptom–marker edges (CRP and IL-6 with ‘aches and pain’), which disappeared in 3b upon adding covariates. We conducted sensitivity analyses (see online Supplementary Materials) to investigate whether these differences could be explained by power differences: 3b had many more parameters (703) than 3a (465) or 2b (136), and therefore less power to detect very small relationships with equal sample size. Our analyses revealed that symptom–marker edges from 2b would not be detected anymore in a network the size of 3b due to lower power, but symptom–marker relations in 3a would be detected in a network the size of 3b.
Sensitivity analyses also indicated that all network models re-estimated with a more conservative γ of 0.25 were identical or nearly identical to the main models (all correlations of adjacency matrices r > 0.99). For 3a, ‘aches and pains’ were no longer associated with either CRP or IL-6.
Stability analyses in which we bootstrapped all models 500 times showed that some edges were estimated reliably (i.e. they were included in all or nearly 500 bootstrapped samples), but there also was considerable variability in the edge parameters across the bootstrapped models. Individual edges and their rank order should be interpreted with care.
Discussion
Contrasting prior research based on sum-scores and diagnoses that have yielded inconsistent results regarding the relationship between depression and inflammation, we explored links between individual depressive symptoms, inflammatory markers, and demographic-, lifestyle-, and disease-related covariates in several consecutive models.
A sum-score of depression was linked with IL-6 and CRP in an unadjusted model (1a). When corrected for demographic, lifestyle, and chronic disease-related covariates, the link with IL-6 was greatly reduced, and the relationship with CRP disappeared (1b). Instead, the depression total score shared edges with demographic, lifestyle, and disease-related covariates. Markers, especially CRP, were associated with BMI and sex. In a conceptual replication of Jokela et al. (Reference Jokela, Virtanen and Batty2016), results closely resembled the original study: sleep problems, energy level, and weight/appetite changes were associated with CRP (2a). When we additionally included BMI, exercise, alcohol, smoking, and chronic diseases as lifestyle and disease-related covariates (2b), only sleep problems and energy level remained associated with CRP. Moreover, strong edges emerged between CRP and BMI, as well as between CRP and sex. When relationships between inflammatory markers and 28 depressive symptoms were investigated (3a), markers were only associated with aches and pain but no other depressive symptoms. Upon adding lifestyle covariates to the final model (3b), markers and symptoms were unrelated. A strong edge was present between CRP and BMI, while CRP and sex, IL-6 and BMI, and IL-6 and age shared somewhat smaller links. Although markers were related to each other across all models, TNF-α was the least connected marker. When repeating model 3b without regularization while controlling for multiple testing, three symptoms were consistently and positively connected to all three inflammatory markers: trouble falling asleep, hypersomnia, and aches and pain. Irritability showed two positive (CRP, TNF-α) and one negative (IL-6) association.
Overall, the most likely symptoms to share unique associations with inflammatory markers, based on our and previous cross-sectional work, are: sleep problems, including insomnia and hypersomnia (identified by models 2a, 2b, 3b without regularization, Jokela et al., Reference Jokela, Virtanen and Batty2016; White et al., Reference White, Kivimäki, Jokela and Batty2017); energy level (models 2a, 2b, Jokela et al., Reference Jokela, Virtanen and Batty2016; White et al., Reference White, Kivimäki, Jokela and Batty2017); appetite/weight changes (model 2a, Jokela et al., Reference Jokela, Virtanen and Batty2016; Lamers et al., Reference Lamers, Milaneschi, de Jonge, Giltay and Penninx2018); aches and pains (models 3a, 3b without regularization); and irritability (model 3b without regularization, including both positive and negative relations).
In all models, BMI was strongly associated with CRP, but weight change and appetite change were not (3a and 3b). One explanation is the comparably low power to detect very small effects, although our sensitivity analyses showed that this explanation is unlikely. It is more likely that potential associations between weight/appetite change and markers were obscured because the symptoms were compound items representing both weight and appetite increases and decreases. Given that CRP is released in adipose tissue (You and Nicklas, Reference You and Nicklas2006; de Heredia et al., Reference de Heredia, Gómez-Martínez and Marcos2012), we would expect specifically increases in appetite and weight to associate with CRP. Lamers et al. (Reference Lamers, Milaneschi, de Jonge, Giltay and Penninx2018) separated out appetite increase v. decrease, based on CIDI symptoms that allow such a disaggregation, unlike the IDS symptoms used for the present report, and indeed found that increased appetite was related to inflammation, specifically CRP and TNF-α.
Our results show that relationships between depression and inflammation are strongly attenuated after BMI adjustment. This is consistent with some studies in the literature (Elovainio et al., Reference Elovainio, Aalto, Kivimäki, Pirkola, Sundvall, Lönnqvist and Reunanen2009; Liu et al., Reference Liu, Al-Sayegh, Jabrah, Wang, Yan and Zhang2014), but contrasts with other results of more robust associations (Haapakoski et al., Reference Haapakoski, Mathieu, Ebmeier, Alenius and Kivimäki2015) (however, note that Haapakoski et al. investigated MDD, not depression severity). In addition to the role as inflammatory markers, CRP and IL-6 are synthesized in response to factors emitted by adipose tissue. People with more body fat have higher levels of circulating CRP and IL-6 (You and Nicklas, Reference You and Nicklas2006; de Heredia et al., Reference de Heredia, Gómez-Martínez and Marcos2012) which offers one explanation for the strong relation between markers and BMI scores. When considering that adipose tissue produces a significant part of CRP and IL-6, the question arises whether it is sufficient to account for this fact merely by adjusting for BMI as a covariate. It could be that weight represents a major explanatory factor that accounts for the link between depression and inflammation, and that inflammation can occur in depressed patients because certain depressive symptoms emerge as a result from a shared pathophysiology with obesity and metabolic conditions (Lamers et al., Reference Lamers, Milaneschi, de Jonge, Giltay and Penninx2018; Milaneschi et al., Reference Milaneschi, Simmons, van Rossum and Penninx2018). Future studies may benefit from more closely investigating weight changes and obesity, given that waist circumference and waist-to-hip ratio have been shown to relate to CRP (Choi et al., Reference Choi, Joseph and Pilote2013). In addition to that, it may be helpful to include information about dietary patterns as numerous studies have shown that diet links with levels of systemic inflammation (Slyepchenko et al., Reference Slyepchenko, Maes, Jacka, Köhler, Barichello, McIntyre, Berk, Grande, Foster, Vieta and Carvalho2017; for an overview, see Berk et al., Reference Berk, Williams, Jacka, O'Neil, Pasco, Moylan, Allen, Stuart, Hayley, Byrne and Maes2013). Finally, objective assessment of physical activity may increase insight on top of self-report exercise questionnaires such as the IPAQ. Multiple studies have shown that both acute and regular exercise involve the differential release of substances that are also active during inflammation. For example, regular exercise has been shown to down-regulate the levels of CRP and IL-6 (Zhou et al., Reference Zhou, Fragala, McElhaney and Kuchel2010; Hayashino et al., Reference Hayashino, Jackson, Hirata, Fukumori, Nakamura, Fukuhara, Tsujii and Ishii2014).
It is worth noting that there are numerous other factors that influence inflammation processes, such as physical activity (Zhou et al., Reference Zhou, Fragala, McElhaney and Kuchel2010; Hayashino et al., Reference Hayashino, Jackson, Hirata, Fukumori, Nakamura, Fukuhara, Tsujii and Ishii2014) or hormonal changes for women in relation with the menstrual cycle, hormonal contraceptives, or menopause (Vogelzangs et al., Reference Vogelzangs, Duivis, Beekman, Kluft, Neuteboom, Hoogendijk, Smit, de Jonge and Penninx2012). Studies examining inflammation as a potential contributor to depression will benefit from taking these potential explanatory variables into account. This would further address one of the major gaps in the literature (O'Connor et al., Reference O'Connor, Bower, Cho, Creswell, Dimitrov, Hamby, Hoyt, Martin, Robles, Sloan, Thomas and Irwin2009; Köhler et al., Reference Köhler, Freitas, Maes, de Andrade, Liu, Fernandes, Stubbs, Solmi, Veronese, Herrmann, Raison, Miller, Lanctôt and Carvalho2017) that we aimed to address here, i.e. that the inconsistent results reported in previous investigations likely occurred at least in part due to the fact that studies varied in the number and nature of included covariates. Future analyses may also benefit from separately analyzing female and male participants, which was not possible due to power considerations in the current study.
Overall, the relationship between depression, inflammation, and covariates is likely highly multivariate and multicausal and warrants further investigation. This includes the possibility of reverse causation where depression is not a consequence, but the cause of higher levels of inflammation. For instance, depression as stressor could potentially lead to changes in lifestyle factors such a reduced activity and a poorer diet, which may in turn increase adiposity and thus inflammatory markers.
Limitations and future research
The present paper goes beyond the existing literature in several aspects. We used a large sample of 2321 participants along the whole continuum of depression severity; examined relations between different operationalizations of depression severity, three inflammatory markers, and seven covariates; tested the relationships between markers and MDD in various stages of complexity; tested the impact of covariates on associations by estimating models with and without covariates; used network analysis specifically developed for uncovering unique shared associations in highly multivariate data; and provide the first conceptual replication of a symptom–marker study (Jokela et al., Reference Jokela, Virtanen and Batty2016) in this emerging field.
Nevertheless, results need to be interpreted with caution. First, we used an observational, cross-sectional design. Cause and effect cannot be established, and conclusions about the direction of a possible relationship between depression, inflammation, and covariates cannot be drawn. Longitudinal follow-up work should investigate whether the candidate symptoms identified here are predictive of or predicted by inflammatory markers (Smith et al., Reference Smith, Au, Ollis and Schmitz2018). Second, there is some evidence that inflammatory markers are related to antidepressant medication (Hiles et al., Reference Hiles, Baker, de Malmanche and Attia2012; White et al., Reference White, Kivimäki, Jokela and Batty2017). We did not control for different types of medication because subgrouping would have created insufficient statistical power for network estimation, and future studies should consider studying the link between depression and inflammation in participant clusters grouped by type of medication. There are numerous other covariates that might be related to inflammation (O'Connor et al., Reference O'Connor, Bower, Cho, Creswell, Dimitrov, Hamby, Hoyt, Martin, Robles, Sloan, Thomas and Irwin2009; Smith et al., Reference Smith, Au, Ollis and Schmitz2018), and numerous further inflammatory markers, which should be studied in the future. Third, we excluded participants with CRP levels above 10 mg/L to avoid bias due to acute infection, which does not necessarily remove all individuals with minor acute illnesses that could influence both depressive symptoms and inflammatory markers. Fourth, many different depression scales exist, and these scales differ considerably in symptom content (Santor et al., Reference Santor, Gregus and Welch2006; Fried, Reference Fried2017). We used a comprehensive scale with as many symptoms as possible, but it is an open question if our findings will replicate in a different set of symptoms. This relates to the challenge discussed above that weight and appetite changes could not be disaggregated in the current study, which should be done in the future. Finally, more general challenges to network psychometrics in psychopathology research are presented in detail elsewhere (Fried and Cramer, Reference Fried and Cramer2017; Guloksuz et al., Reference Guloksuz, Pries and Van Os2017).
Conclusion
Despite substantial efforts to effectively investigate depression etiology, understanding of this debilitating disorder is limited and research investigating inflammation as a core etiological factor has produced inconsistent results. We aimed to contribute to this ongoing debate by approaching the link between depression and inflammation from a different angle via embracing the potential complexity of the depression–inflammation link. We hope that our results may ultimately help disentangle the role that inflammation may play in the development and course of depression.
Supplementary material
The supplementary material for this article can be found at https://osf.io/5832e/.
Data
According to European law (GDPR), data containing potentially identifying or sensitive patient information are restricted; our data involving clinical participants are not freely available in the manuscript, online Supplementary Materials, or in a public repository. Data access can be requested via the NESDA Data Access Committee (https://www.nesda@ggzingeest.nl).
Acknowledgements
The infrastructure for the NESDA study (https://www.nesda.nl) is funded through the Geestkracht program of the Netherlands Organisation for Health Research and Development (ZonMw, grant number 10-000-1002) and financial contributions by participating universities and mental health care organizations (VU University Medical Center, GGZ inGeest, Leiden University Medical Center, Leiden University, GGZ Rivierduinen, University Medical Center Groningen, University of Groningen, Lentis, GGZ Friesland, GGZ Drenthe, Rob Giel Onderzoekscentrum). Assaying of inflammatory markers was supported by the Neuroscience Campus Amsterdam. During writing this paper, EIF was in part funded by the ERC Consolidator Grant no. 647209.
Financial support
The infrastructure for the NESDA study (https://www.nesda.nl) is funded through the Geestkracht program of the Netherlands Organisation for Health Research and Development (ZonMw, grant number 10-000-1002) and financial contributions by participating universities and mental health care organizations (VU University Medical Center, GGZ inGeest, Leiden University Medical Center, Leiden University, GGZ Rivierduinen, University Medical Center Groningen, University of Groningen, Lentis, GGZ Friesland, GGZ Drenthe, Rob Giel Onderzoekscentrum). Assaying of inflammatory markers was supported by the Neuroscience Campus Amsterdam. During writing this paper, EIF was in part funded by the ERC Consolidator Grant no. 647209.
Conflict of interest
None.


 Open access