


1. Introduction
Galaxy clusters are large gravitationally-bound structures, containing hundreds to thousands of galaxies, with typical masses of $10^{14}$
to
$10^{14}$
to $10^{15}$
M_ M
$10^{15}$
M_ M $_\odot$
. Approximately 80% of this mass is Dark Matter, 15
$_\odot$
. Approximately 80% of this mass is Dark Matter, 15 $-$
17% is the intra-cluster medium (ICM), and only 3
$-$
17% is the intra-cluster medium (ICM), and only 3 $-$
5% is the galaxies that make up the cluster (Feretti et al., Reference Feretti, Giovannini, Govoni and Murgia2012). The ICM consists of heated gas situated between the galaxies, including hot X-ray emitting gas at temperatures of
$-$
5% is the galaxies that make up the cluster (Feretti et al., Reference Feretti, Giovannini, Govoni and Murgia2012). The ICM consists of heated gas situated between the galaxies, including hot X-ray emitting gas at temperatures of $10^7$ $-$
$-$ $10^8$
K (Ghirardini et al., Reference Ghirardini, Eckert and Ettori2019). Galaxy clusters have also been inferred to have magnetic fields of the order of 0.1 to 1
$10^8$
K (Ghirardini et al., Reference Ghirardini, Eckert and Ettori2019). Galaxy clusters have also been inferred to have magnetic fields of the order of 0.1 to 1 $\unicode{x03BC}$
G (e.g. Clarke et al., Reference Clarke, Kronberg and Böhringer2001; Carilli & Taylor, Reference Carilli and Taylor2002; Bonafede et al., Reference Bonafede, Feretti and Murgia2010; Donnert et al., Reference Donnert, Vazza and Brüggen2018).
$\unicode{x03BC}$
G (e.g. Clarke et al., Reference Clarke, Kronberg and Böhringer2001; Carilli & Taylor, Reference Carilli and Taylor2002; Bonafede et al., Reference Bonafede, Feretti and Murgia2010; Donnert et al., Reference Donnert, Vazza and Brüggen2018).
Diffuse radio emission is often observed in clusters (van Weeren et al., Reference van Weeren, de Gasperin and Akamatsu2019; Paul et al., Reference Paul, Kale and Datta2023) and is generated by synchrotron radiation, indicating the presence of relativistic particles and magnetic fields (van Weeren et al., Reference van Weeren, Brunetti and Brüggen2016; Hurley-Walker et al., Reference Hurley-Walker, Payne, Filipović, Tothill, Filipović and Tothill2021). Because the synchrotron emitting electrons have a limited lifetime, the relativistic particles must either be re-accelerated or created in place (Jaffe, Reference Jaffe1977; Filipović & Tothill, Reference Filipović and Tothill2021).
The spectral energy distribution of the synchrotron radio emission is a function of the ages of the electron populations, the strength of the magnetic fields, and the possible shock-driven re-acceleration from merger events (Feretti et al., Reference Feretti, Giovannini, Govoni and Murgia2012; Bonafede et al., Reference Bonafede, Feretti and Murgia2014; Hurley-Walker et al., Reference Hurley-Walker, Payne, Filipović, Tothill, Filipović and Tothill2021).
The radio emission from galaxy clusters can be broadly classified into four categories, depending on the location, morphology, and polarisation properties (see van Weeren et al., Reference van Weeren, de Gasperin and Akamatsu2019, for a recent review): (a) radio emission from the constituent galaxies, including bent-tail galaxies; (b) diffuse halos of radio emission (radio halos) broadly positioned on the centre of the cluster; (c) diffuse elongated radio shocks typically found on the periphery of the cluster; and (d) fossil radio galaxies.
Radio halos are sources of diffuse radio emission, which are thought to occur more frequently in clusters linked with merger activity, and are associated with the centre of the merging galaxy clusters (Brunetti et al., Reference Brunetti, Cassano, Dolag and Setti2009; van Weeren et al., Reference van Weeren, Brunetti and Brüggen2016). The halo spans the region where most of the X-ray emission from the ICM is observed, with recent energy injection into the ICM and corresponding high X-ray temperature and luminosity (e.g. Giovannini et al., Reference Giovannini, Tordi and Feretti1999; Cuciti et al., Reference Cuciti, Cassano and Brunetti2021a,b; Paul et al., Reference Paul, Kale and Datta2023; Tümer et al., 2023).
Radio halos have traditionally been categorised into two classes based primarily on their sizes: giant radio halos (or just ‘radio halos’) with a typical linear size of $\sim$
1 Mpc, and mini-halos which typically have a size of less than 500 kpc. Radio halos have a low surface brightness and a steep radio spectrum, with typical integrated spectral indices of
$\sim$
1 Mpc, and mini-halos which typically have a size of less than 500 kpc. Radio halos have a low surface brightness and a steep radio spectrum, with typical integrated spectral indices of $-1.4<\alpha<-1.1$
Footnote a.
$-1.4<\alpha<-1.1$
Footnote a.
Other important distinctions between mini-halos and giant radio halos include the fact that mini-halos are almost exclusively found in cool-core clusters (van Weeren et al., Reference van Weeren, de Gasperin and Akamatsu2019), with the mini-halo centered on the radio-loud Brightest Cluster Galaxy (BCG). Gitti et al. (Reference Gitti, Tozzi and Brunetti2015) show the size of the mini-halo is comparable to that of the central cooling region in the cluster, although recent results with the SKA Pathfinders and Precursors (e.g. Riseley et al., Reference Riseley, Rajpurohit and Loi2022a; Biava et al., Reference Biava, de Gasperin and Bonafede2024) show diffuse synchrotron emission from mini-halos outside this central cooling region. In addition, Cassano et al. (Reference Cassano, Gitti and Brunetti2008) found that regardless of the origin of the emitting electrons, even though radio halos and mini-halos have similar radio power, a mini-halo radius is typically $\sim$
4 times smaller than a radio halo; implying an
$\sim$
4 times smaller than a radio halo; implying an $\sim$
50 times larger synchrotron emissivity for the mini-halo; however, some studies (e.g. Riseley et al., Reference Riseley, Rajpurohit and Loi2022a, Reference Riseley, Biava and Lusetti2023) show larger sizes in high sensitivity data, with mini-halos often on size scales comparable to “normal” radio halos.
$\sim$
50 times larger synchrotron emissivity for the mini-halo; however, some studies (e.g. Riseley et al., Reference Riseley, Rajpurohit and Loi2022a, Reference Riseley, Biava and Lusetti2023) show larger sizes in high sensitivity data, with mini-halos often on size scales comparable to “normal” radio halos.
Botteon et al. (2022) note the difficulty of using a scale size to distinguish between ‘normal’ radio halos and mini-halos, given the wide range of cluster masses, so do not distinguish between a mini-halo and a radio halo. As detailed above, recent high sensitivity observations also show ambiguity in the ability to distinguish between these sources based on size. Similarly, we do not make this distinction.
Radio shocks (a.k.a. ‘relics’ or ‘gischts’) are regions of elongated, diffuse emission that do not have an optical counterpart; typically found around the periphery of a cluster. Their radio spectrum is typically a steep power-law, with spectral indices in the range $-1.5<\alpha<-1.0$
, indicating electron cooling in the post-shock region of a shock wave travelling outward (e.g. Giacintucci et al., 2008; van Weeren et al., Reference van Weeren, Röttgering, Brüggen and Hoeft2010, Reference van Weeren, Hoeft and Röttgering2011; Stroe et al., Reference Stroe, Sobral, Röttgering and van Weeren2014; Hindson et al., Reference Hindson, Johnston-Hollitt and Hurley-Walker2014; Riseley et al., Reference Riseley, Bonnassieux and Vernstrom2022b). Radio shocks have been found to be polarised at the level of
$-1.5<\alpha<-1.0$
, indicating electron cooling in the post-shock region of a shock wave travelling outward (e.g. Giacintucci et al., 2008; van Weeren et al., Reference van Weeren, Röttgering, Brüggen and Hoeft2010, Reference van Weeren, Hoeft and Röttgering2011; Stroe et al., Reference Stroe, Sobral, Röttgering and van Weeren2014; Hindson et al., Reference Hindson, Johnston-Hollitt and Hurley-Walker2014; Riseley et al., Reference Riseley, Bonnassieux and Vernstrom2022b). Radio shocks have been found to be polarised at the level of $\sim 10-60$
% above 1 GHz in merging galaxy clusters (e.g. Ensslin et al., Reference Ensslin, Biermann, Klein and Kohle1998; Giovannini & Feretti, Reference Giovannini and Feretti2004; van Weeren et al., Reference van Weeren, Röttgering, Brüggen and Hoeft2010; Rajpurohit et al., Reference Rajpurohit, Hoeft and Wittor2022). They exhibit strong depolarisation at frequencies
$\sim 10-60$
% above 1 GHz in merging galaxy clusters (e.g. Ensslin et al., Reference Ensslin, Biermann, Klein and Kohle1998; Giovannini & Feretti, Reference Giovannini and Feretti2004; van Weeren et al., Reference van Weeren, Röttgering, Brüggen and Hoeft2010; Rajpurohit et al., Reference Rajpurohit, Hoeft and Wittor2022). They exhibit strong depolarisation at frequencies $<1$
GHz (Brentjens, 2008; Pizzo, Reference Pizzo2011; Ozawa et al., Reference Ozawa, Nakanishi and Akahori2015).
$<1$
GHz (Brentjens, 2008; Pizzo, Reference Pizzo2011; Ozawa et al., Reference Ozawa, Nakanishi and Akahori2015).
Fossil radio galaxies (sometimes known as ‘phoenices’ or ‘revived fossil plasma’ (Kempner et al., Reference Kempner, Blanton, Clarke, Reiprich, Kempner and Soker2004), and confusingly, occasionally as ‘relics’), are the remains of dead radio-loud active galactic nuclei (AGN) in which radio plasma from previous AGN activity is compressed by a shock wave. The shock increases both the magnetic field strength inside the plasma and the energy of the plasma particles, resulting in an increase in synchrotron emission. Compared with radio shocks, these sources are generally found at smaller cluster-centric distances (Feretti et al., Reference Feretti, Giovannini, Govoni and Murgia2012) and have sizes ranging from $\lesssim 100$
kpc as seen in Abell 2063 and Abell 4038, up to
$\lesssim 100$
kpc as seen in Abell 2063 and Abell 4038, up to $\sim 350$
kpc as seen in Abell 85. The emission in many cases has a steep curved spectrum (e.g. Riseley et al., Reference Riseley, Bonnassieux and Vernstrom2022b; Rudnick et al., Reference Rudnick, Brüggen and Brunetti2022a; Slee et al., Reference Slee, Roy, Murgia, Andernach and Ehle2001; Venturi et al., Reference Venturi, Bardelli and Dallacasa2017), typically steeper than
$\sim 350$
kpc as seen in Abell 85. The emission in many cases has a steep curved spectrum (e.g. Riseley et al., Reference Riseley, Bonnassieux and Vernstrom2022b; Rudnick et al., Reference Rudnick, Brüggen and Brunetti2022a; Slee et al., Reference Slee, Roy, Murgia, Andernach and Ehle2001; Venturi et al., Reference Venturi, Bardelli and Dallacasa2017), typically steeper than $\alpha \sim -1.5$
, characteristic of an old population of electrons. The remnant is found close to the source galaxy, in the inner tens of kpc from the galaxy cluster. When observed with sufficient angular resolution (Slee et al., Reference Slee, Roy, Murgia, Andernach and Ehle2001) the sources are often filamentary.
$\alpha \sim -1.5$
, characteristic of an old population of electrons. The remnant is found close to the source galaxy, in the inner tens of kpc from the galaxy cluster. When observed with sufficient angular resolution (Slee et al., Reference Slee, Roy, Murgia, Andernach and Ehle2001) the sources are often filamentary.
In recent years there has been a dramatic increase in the discovery of ICM filaments associated with radio galaxies and galaxy clusters, thanks to high-resolution low frequency sub-GHz observations with new generation telescopes such as the Australian Square Kilometre Array Pathfinder (ASKAP), MeerKAT, and the Low Frequency Array (LOFAR) (e.g. Pasini et al., Reference Pasini, Edler and Brüggen2022; Rudnick et al., Reference Rudnick, Brüggen and Brunetti2022a; Velović et al., Reference Velović, Cotton and Filipović2023).
Abell S1136 is located in the Pisces-Cetus supercluster, at RA(J2000) = 23 $^{\rm h}$
36
$^{\rm h}$
36 $^{\rm m}$
17.0
$^{\rm m}$
17.0 $^{\rm s}$
DEC(J2000) =
$^{\rm s}$
DEC(J2000) = $-$
31
$-$
31 $^{\circ} $
36
$^{\circ} $
36 $^{\prime}$
37
$^{\prime}$
37 $^{\prime\prime}$
, and was first observed as part of the Abell Catalogue ‘Southern Survey’ in 1988 (Olowin, Reference Olowin1988). It is reported in the Meta-Catalogue of X-ray Detected Clusters of Galaxies as MCXC J2336.2-3136 (Piffaretti et al., 2011) with luminosity
$^{\prime\prime}$
, and was first observed as part of the Abell Catalogue ‘Southern Survey’ in 1988 (Olowin, Reference Olowin1988). It is reported in the Meta-Catalogue of X-ray Detected Clusters of Galaxies as MCXC J2336.2-3136 (Piffaretti et al., 2011) with luminosity $L_{500}=0.50\times10^{37}$
W and mass
$L_{500}=0.50\times10^{37}$
W and mass $M_{X,500}=1.29\times10^{14}$
M
$M_{X,500}=1.29\times10^{14}$
M $_\odot$
within an
$_\odot$
within an $R_{500}=0.75$
Mpc radius. The Abell S1136 cluster has a spectroscopic redshift of
$R_{500}=0.75$
Mpc radius. The Abell S1136 cluster has a spectroscopic redshift of $z=0.0622$
(De Propris et al., Reference De Propris, Couch and Colless2002; Campusano et al., Reference Campusano, Marinello and Clowes2018) on the BCG ESO 470–20 (Lauberts & Valentijn, Reference Lauberts and Valentijn1989).
$z=0.0622$
(De Propris et al., Reference De Propris, Couch and Colless2002; Campusano et al., Reference Campusano, Marinello and Clowes2018) on the BCG ESO 470–20 (Lauberts & Valentijn, Reference Lauberts and Valentijn1989).
Observations with the Murchison Widefield Array (MWA; Tingay et al., Reference Tingay, Goeke and Bowman2013; Bowman et al., 2013) at 168 MHz (Offringa et al., Reference Offringa, Trott and Hurley-Walker2016; Duchesne et al., Reference Duchesne and Johnston-Hollitt2021) found Abell S1136 to host steep-spectrum, diffuse emission (Duchesne et al., Reference Duchesne and Johnston-Hollitt2021, their section 3.2.21). The observed features of the emission were consistent with a number of cluster radio sources including radio halos, radio relics, and remnant radio galaxies. There is no corresponding 1400 MHz or 843 MHz emission seen in the NRAO VLA Sky Survey (NVSS) (Condon et al., Reference Condon, Cotton and Greisen1998) or the Sydney University Molonglo Sky Survey (SUMSS) (Bock et al., Reference Bock, Large and Sadler1999; Mauch et al., Reference Mauch, Murphy and Buttery2003), implying a steep spectral index.
We present observations of Abell S1136 using the ASKAP (Johnston et al., Reference Johnston, Bailes and Bartel2007, Reference Johnston, Taylor and Bailes2008; McConnell et al., Reference McConnell, Allison and Bannister2016; Hotan et al., Reference Hotan, Bunton and Chippendale2021), as part of the Early Science program of the Evolutionary Map of the Universe (EMU) survey (Norris et al., Reference Norris, Hopkins and Afonso2011). Section 2 describes the observations, which were taken to investigate the structure of the diffuse radio emission centered on the Abell S1136 galaxy cluster. In Section 3 we present our results, while in Section 4 we discuss the intra-cluster filamentary structure discovered in the Abell S1136 galaxy cluster, and the implications of these results.
This paper assumes a flat $\Lambda \mathrm{CDM}$
cosmology with
$\Lambda \mathrm{CDM}$
cosmology with $H_{0}=68\,\mathrm{km}\,\mathrm{s}^{-1}\,\mathrm{Mpc}^{-1}, \Omega_{m}=0.3,$
and
$H_{0}=68\,\mathrm{km}\,\mathrm{s}^{-1}\,\mathrm{Mpc}^{-1}, \Omega_{m}=0.3,$
and $\Omega_{\Lambda}=0.7$
. Using these cosmological parameters, this gives a scale of 1.234 kpc arcsec
$\Omega_{\Lambda}=0.7$
. Using these cosmological parameters, this gives a scale of 1.234 kpc arcsec $^{-1}$
at a redshift of
$^{-1}$
at a redshift of $z=0.0622$
(the preferred redshift of Abell S1136).
$z=0.0622$
(the preferred redshift of Abell S1136).
2. Observations
2.1. ASKAP observations
We observed Abell S1136 on 29 $^{\rm th}$
July 2019 with the ASKAP, as part of the EMU Early Science Broadband (700-1800 MHz) Survey, under Project Code AS034 (Table 1). The observation used a 33 antenna array with a maximum baseline of 6 km. We used a centre frequency of 888 MHz, and the full instantaneous bandwidth of 288 MHz available at the time, divided into 288
$^{\rm th}$
July 2019 with the ASKAP, as part of the EMU Early Science Broadband (700-1800 MHz) Survey, under Project Code AS034 (Table 1). The observation used a 33 antenna array with a maximum baseline of 6 km. We used a centre frequency of 888 MHz, and the full instantaneous bandwidth of 288 MHz available at the time, divided into 288 $\times$
1-MHz channels.
$\times$
1-MHz channels.
Observation and image details of the ASKAP data.

Only 33 of the 36 ASKAP antenna were available for this observation. For this observation the 36 Phased Array Feed (PAF) beams on each antenna were set at a pitch of 0.90 degrees with a 45-degree rotation, and formed into a ‘closepack36’ footprint which provides uniform sensitivity without interleaving (Norris et al., Reference Norris, Marvil and Collier2021).
The resulting synthesised beam is 12.6 $^{\prime\prime}$ $\times$
10.1
$\times$
10.1 $^{\prime\prime}$
at 888 MHz for robust
$^{\prime\prime}$
at 888 MHz for robust $=0$
weighting. The observation was performed as a single field with 10 hours on source. PKS 1934
$=0$
weighting. The observation was performed as a single field with 10 hours on source. PKS 1934 $-$
638 was used as the primary and secondary calibrator, to provide bandpass and gain calibration for imaging. Data calibration and imaging were performed using the ASKAPsoft (Guzman et al., Reference Guzman, Whiting and Voronkov2019) data processing pipeline, running at the Pawsey Supercomputing Centre. We produced two sets of images: one at robust
$-$
638 was used as the primary and secondary calibrator, to provide bandpass and gain calibration for imaging. Data calibration and imaging were performed using the ASKAPsoft (Guzman et al., Reference Guzman, Whiting and Voronkov2019) data processing pipeline, running at the Pawsey Supercomputing Centre. We produced two sets of images: one at robust $=0$
weighting (Briggs, Reference Briggs1995), and the other at robust
$=0$
weighting (Briggs, Reference Briggs1995), and the other at robust $=+2.0$
(Table 1).
$=+2.0$
(Table 1).
As a check on amplitude calibration across the 888 MHz ASKAP observing tile, we cross-matched the ASKAP data with the 887.5 MHz Rapid ASKAP Continuum Survey (RACS) (McConnell et al., Reference McConnell, Hale and Lenc2020) data. We identified 15 unresolved point sources in and around the Abell S1136 cluster, and measured their flux densities in the ASKAP and RACS data using the Cube Analysis and Rendering Tool for AstronomyFootnote b (carta; Comrie et al., Reference Comrie, Wang and Hsu2021). The flux densities are in good agreement, with an average Mean Absolute Deviation error of 5.81%.
2.2. MWA observations
We observed Abell S1136 with the Murchison Widefield Array (MWA; Tingay et al., Reference Tingay, Goeke and Bowman2013) Phase 2 in its ‘extended’ configuration (hereafter MWA 2; Wayth et al., Reference Wayth, Tingay and Trott2018; Beardsley et al., 2019), for the MWA project G0045 (PI Duchesne). This observation was to perform a follow-up survey of the diffuse, non-thermal galaxy cluster emission originally detected by the MWA in its Phase 1. The MWA 2 data cover 72 $-$
231 MHz, with five 30 MHz observing bands centred on 88 MHz, 118 MHz, 154 MHz, 185 MHz, and 215 MHz. The observing strategy and data reduction process is described in detail by Duchesne et al. (Reference Duchesne, Johnston-Hollitt, Zhu, Wayth and Line2020). We used robust
$-$
231 MHz, with five 30 MHz observing bands centred on 88 MHz, 118 MHz, 154 MHz, 185 MHz, and 215 MHz. The observing strategy and data reduction process is described in detail by Duchesne et al. (Reference Duchesne, Johnston-Hollitt, Zhu, Wayth and Line2020). We used robust $=0$
weighting and present the observation and image details in Table 2.
$=0$
weighting and present the observation and image details in Table 2.
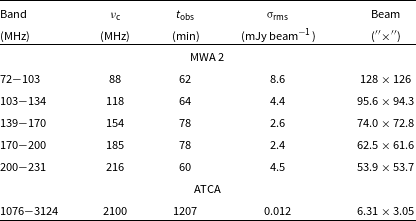
Observation and image details of the MWA 2 and Australia Telescope Compact Array (ATCA) data.
2.3. Australia telescope compact array observations
We observed Abell S1136 with the Australia Telescope Compact Array (ATCA; Frater et al., Reference Frater, Brooks and Whiteoak1992; Nelson, Reference Nelson1992; Wilson et al., Reference Wilson, Ferris and Axtens2011) over two sessions and using two compatible array configurationsFootnote c, at 1100 $-$
3100 MHz (the weighted central frequency after the removal of radio frequency interference is 2120 MHz). The first observation was with a 6A array on the 29
$-$
3100 MHz (the weighted central frequency after the removal of radio frequency interference is 2120 MHz). The first observation was with a 6A array on the 29 $^{\rm th}$
April 2016 (PI Duchesne) under project code CX356. This array consists of baselines ranging from 337 m to 6 km, with only 3 of the 15 baselines shorter than 1087 m (337 m, 628 m, and 872 m). The second observation was on 15
$^{\rm th}$
April 2016 (PI Duchesne) under project code CX356. This array consists of baselines ranging from 337 m to 6 km, with only 3 of the 15 baselines shorter than 1087 m (337 m, 628 m, and 872 m). The second observation was on 15 $^{\rm th}$
November 2020 (PI Macgregor) using a 6B array, under project code CX476. This array consists of baselines ranging from 214 m to 6 km, with only 4 of the 15 baselines shorter than 1270 m (214 m, 536 m, 750 m, and 949 m). This gives a predicted RMS (1
$^{\rm th}$
November 2020 (PI Macgregor) using a 6B array, under project code CX476. This array consists of baselines ranging from 214 m to 6 km, with only 4 of the 15 baselines shorter than 1270 m (214 m, 536 m, 750 m, and 949 m). This gives a predicted RMS (1 $\unicode{x03C3}$
) noise level for a 12 hour observation of 9
$\unicode{x03C3}$
) noise level for a 12 hour observation of 9 $\unicode{x03BC}$
Jy beam
$\unicode{x03BC}$
Jy beam $^{-1}$
which is close to what we measure in our image as 1
$^{-1}$
which is close to what we measure in our image as 1 $\unicode{x03C3}$
= 12
$\unicode{x03C3}$
= 12 $\unicode{x03BC}$
Jy beam
$\unicode{x03BC}$
Jy beam $^{-1}$
.
$^{-1}$
.
The data were calibrated using miriad (Sault et al., Reference Sault, Teuben, Wright, Shaw, Payne and Hayes1995). The primary calibrator for each observation was PKS 1934 $-$
638, and gain calibrators PKS 2313
$-$
638, and gain calibrators PKS 2313 $-$
340 (CX356) and PKS 2337
$-$
340 (CX356) and PKS 2337 $-$
334 (CX476). We imaged the observation using mfclean, with the bandwidth left at 2000 MHz, and robust
$-$
334 (CX476). We imaged the observation using mfclean, with the bandwidth left at 2000 MHz, and robust $=0$
. Three rounds of phase-only self-calibration were performed, and images were cleaned using mfclean down to 3 times the RMS noise. The ATCA observation and image details are shown in Table 2.
$=0$
. Three rounds of phase-only self-calibration were performed, and images were cleaned using mfclean down to 3 times the RMS noise. The ATCA observation and image details are shown in Table 2.
The primary beam of the ATCA at 2100 MHz centre frequency is 23.1 $^{\prime}$
Full Width at Half-Maximum (FWHM), which is comparable with the size of the images shown in this paper. The Compact Array Broadband Backend (CABB) (Wilson et al., Reference Wilson, Ferris and Axtens2011) provides a 2 GHz bandwidth when observing at 2100 MHz; this gives a FWHM of 45.07
$^{\prime}$
Full Width at Half-Maximum (FWHM), which is comparable with the size of the images shown in this paper. The Compact Array Broadband Backend (CABB) (Wilson et al., Reference Wilson, Ferris and Axtens2011) provides a 2 GHz bandwidth when observing at 2100 MHz; this gives a FWHM of 45.07 $^{\prime}$
at 3214 MHz, and a 15.52
$^{\prime}$
at 3214 MHz, and a 15.52 $^{\prime}$
FWHM at 1076 MHz. Although the ATCA data are corrected for the primary beam shape, the flux densities of sources far (i.e.
$^{\prime}$
FWHM at 1076 MHz. Although the ATCA data are corrected for the primary beam shape, the flux densities of sources far (i.e. $\gtrsim$
11.5
$\gtrsim$
11.5 $^{\prime}$
radius/23
$^{\prime}$
radius/23 $^{\prime}$
diameter) from the pointing centre (at RA(J2000) = 23
$^{\prime}$
diameter) from the pointing centre (at RA(J2000) = 23 $^{\rm h}$
36
$^{\rm h}$
36 $^{\rm m}$
17.23
$^{\rm m}$
17.23 $^{\rm s}$
DEC(J2000) =
$^{\rm s}$
DEC(J2000) = $-$
31
$-$
31 $^{\circ} $
36
$^{\circ} $
36 $^{\prime}$
14.
$^{\prime}$
14. $^{\prime\prime}$
22, which is close to the BCG), may be unreliable as, at points beyond the FWHM the effective observing frequency varies with distance from the pointing centre (Thompson et al., Reference Thompson, Moran and Swenson2017), and the errors on the flux estimates become larger.
$^{\prime\prime}$
22, which is close to the BCG), may be unreliable as, at points beyond the FWHM the effective observing frequency varies with distance from the pointing centre (Thompson et al., Reference Thompson, Moran and Swenson2017), and the errors on the flux estimates become larger.
Additionally, as the ATCA observations had limited short spacing information, they were insensitive to the extended diffuse emission; so we do not attempt to derive spectral indices of the diffuse emission from the ATCA data, but use the ATCA observations only for compact sources and narrow filaments.
3. Results
3.1. Filamentary structures
With the higher sensitivity and resolution of the ASKAP data, the steep-spectrum and diffuse cluster emission previously identified by Duchesne et al. (Reference Duchesne and Johnston-Hollitt2021), can be seen in Figure 1(a) and (b) to break up into several more compact structures. Radio continuum emission detected in these images are divided into regions of diffuse emission with filamentary structure. We identify three filamentary structures:
1. The ‘Northern Filament’, which appears to extend north-east from WISEA J233615.95 $-$
313534.4, the source labelled ‘A’. This filament is
$\sim\,140$
kpc in length (assuming a distance to Abell S1136 of 250 Mpc), and appears detached from source A.
$-$
313534.4, the source labelled ‘A’. This filament is
$\sim\,140$
kpc in length (assuming a distance to Abell S1136 of 250 Mpc), and appears detached from source A.2. The ‘BCG Filament’, which appears to extend south-east from WISEA J233616.55
$-$
313609.3/ESO 470
$-$
20, which is the Abell S1136 Brightest Cluster Galaxy (Lauberts & Valentijn, Reference Lauberts and Valentijn1989) labelled ‘B’. This filament is
$\sim 140$
kpc long, and appears to be in projection, or to be attached to, source ‘B’.3. The ‘Southern Filament’, which appears to extend nearly horizontally under WISEA J233616.10
$-$
313741.1, the source labelled ‘C’. The filament appears to be oriented tangentially to the cluster. This filament is the shortest at
$\sim 80$
kpc in length.


Sources A and B are cluster radio galaxies, while C is a likely background source, as described below.
Figure 1(a) shows that the Abell S1136 galaxy cluster has multiple AGN located near the centre, with a radio-loud BCG. In Figure 1(b), the large-scale diffuse radio emission is largely symmetric around the BCG, with a morphology that resembles a Wide-Angle-Tail (WAT) source. However, Figure 1(a) shows that the high-resolution image does not resemble a WAT, in that it consists of two relatively straight filaments that do not curve towards each other, unlike the jets of most WATs. Furthermore, the northern filament is not connected to the BCG filament or to the BCG. It might be argued that the low-resolution 154 MHz image in Figure 2(c) shows two radio lobes, but at higher resolution (e.g. Figure 2(f)) these break up into a combination of diffuse emission and compact sources, in which the filaments do not point to the patches of diffuse emission. Therefore, while we cannot rule out that the Northern and BCG filaments are sections of a WAT associated with the BCG, this would be a very unusual WAT.
3.2. Abell S1136 flux density measurements
We imaged the Abell S1136 galaxy cluster and its filamentary and diffuse components (see Table 3) using data from the MWA Phase II at 154 MHz, 185 MHz, and 216 MHz, ASKAP at 888 MHz and ATCA at 2100 MHz, as shown in Figure 2.
Integrated flux densities and spectral indices of the Abell S1136 emission components. The flux densities of the filaments and diffuse regions (and their one-sigma uncertainties) were measured using NoiseChisel, as described in Section 3.2. These errors do not account for systematic errors (generally 10%). No spectral index is given for the filaments as the ATCA measurements may be affected by missing short spacings.
 ${}^{\text{a}}$
The green diffuse region is shown in Figure 2(a).
${}^{\text{a}}$
The green diffuse region is shown in Figure 2(a). ${}^{\text{b}}$
The box totals have been calculated within the cyan box shown in Figure 2(c). This includes both diffuse emission and discrete sources.
${}^{\text{b}}$
The box totals have been calculated within the cyan box shown in Figure 2(c). This includes both diffuse emission and discrete sources. ${}^{\text{c}}$
The spectral index measurement also includes both diffuse and discrete sources, and as discussed in the text is probably flatter than the emission from the diffuse emission alone.
${}^{\text{c}}$
The spectral index measurement also includes both diffuse and discrete sources, and as discussed in the text is probably flatter than the emission from the diffuse emission alone.
For each of the diffuse regions and filaments measured in the ASKAP image, we used NoiseChisel (see below) to measure the integrated flux density of the same regions in the ATCA data at 2100 MHz, after images were regridded and convolved to the ASKAP beam size using miriad (Sault et al., Reference Sault, Teuben, Wright, Shaw, Payne and Hayes1995).
ASKAP 888 MHz radio continuum images of the galaxy cluster Abell S1136. (a) The high resolution 12.6 $^{\prime\prime}$ $\times$
10.0
$\times$
10.0 $^{\prime\prime}$
robust
$^{\prime\prime}$
robust $=-0.5$
image shows the sources associated with the newly discovered filaments (detailed in Table 5): (A) WISEA J233615.95
$=-0.5$
image shows the sources associated with the newly discovered filaments (detailed in Table 5): (A) WISEA J233615.95 $-$
313534.4 (B) WISEA J233616.55
$-$
313534.4 (B) WISEA J233616.55 $-$
313609.3 and (C) WISEA J233616.10
$-$
313609.3 and (C) WISEA J233616.10 $-$
313741.1 labelled together with the radio bright head-tail galaxy PKS 2333
$-$
313741.1 labelled together with the radio bright head-tail galaxy PKS 2333 $-$
318. The contour levels in red start at 2
$-$
318. The contour levels in red start at 2 $\unicode{x03C3}$
= 80
$\unicode{x03C3}$
= 80 $\unicode{x03BC}$
Jy beam
$\unicode{x03BC}$
Jy beam $^{-1}$
and scale by a factor of
$^{-1}$
and scale by a factor of $\sqrt{2}$
to 750
$\sqrt{2}$
to 750 $\unicode{x03BC}$
Jy beam
$\unicode{x03BC}$
Jy beam $^{-1}$
. (b) shows the 25.5
$^{-1}$
. (b) shows the 25.5 $^{\prime\prime}$ $\times$
21.3
$\times$
21.3 $^{\prime\prime}$
low resolution robust
$^{\prime\prime}$
low resolution robust $=+2.0$
image of the same sources, plus the diffuse cluster emission. The contour levels in blue start at 2
$=+2.0$
image of the same sources, plus the diffuse cluster emission. The contour levels in blue start at 2 $\unicode{x03C3}$
= 220
$\unicode{x03C3}$
= 220 $\unicode{x03BC}$
Jy beam
$\unicode{x03BC}$
Jy beam $^{-1}$
and scale by a factor of
$^{-1}$
and scale by a factor of $\sqrt{2}$
to 750
$\sqrt{2}$
to 750 $\unicode{x03BC}$
Jy beam
$\unicode{x03BC}$
Jy beam $^{-1}$
. The contour levels in red are the same as Figure 1a. The diffuse emission component, excluding point sources, was measured at 4.88 mJy
$^{-1}$
. The contour levels in red are the same as Figure 1a. The diffuse emission component, excluding point sources, was measured at 4.88 mJy $\pm$
0.50; see
$\pm$
0.50; see ${\rm{\S}}$
3.2.1 and Table 3.
${\rm{\S}}$
3.2.1 and Table 3.

Detections in the galaxy cluster Abell S1136. (a) ASKAP 888 MHz (12.6 $^{\prime\prime}$ $\times$
10.0
$\times$
10.0 $^{\prime\prime}$
). The green region shows the NoiseChisel-detected region (
$^{\prime\prime}$
). The green region shows the NoiseChisel-detected region ( $9.7\unicode{x03C3}$
). The purple outline regions show the pixels within each filament using a 100
$9.7\unicode{x03C3}$
). The purple outline regions show the pixels within each filament using a 100 $\unicode{x03BC}$
Jy beam
$\unicode{x03BC}$
Jy beam $^{-1}$
cut-off. (b) ASKAP 888 MHz (12.6
$^{-1}$
cut-off. (b) ASKAP 888 MHz (12.6 $\times10.0$
arcsec
$\times10.0$
arcsec $^2$
). The diffuse region is manually divided into the blue and red regions (Diffuse 1 and Diffuse 2) to measure the significance of the detection in them (
$^2$
). The diffuse region is manually divided into the blue and red regions (Diffuse 1 and Diffuse 2) to measure the significance of the detection in them ( $6.6\unicode{x03C3}$
and
$6.6\unicode{x03C3}$
and $7.1\unicode{x03C3}$
, respectively). Other putative detections in the image at the same level are shown as black pixels, demonstrating that there are no other regions in the image with similar extended and contiguous emission. (c) to (g) show the images obtained by each telescope at the frequency shown. (c),(d),(e) are from MWA 2 with resolutions at 74.0
$7.1\unicode{x03C3}$
, respectively). Other putative detections in the image at the same level are shown as black pixels, demonstrating that there are no other regions in the image with similar extended and contiguous emission. (c) to (g) show the images obtained by each telescope at the frequency shown. (c),(d),(e) are from MWA 2 with resolutions at 74.0 $^{\prime\prime}$ $\times$
72.8
$\times$
72.8 $^{\prime\prime}$
, 62.5
$^{\prime\prime}$
, 62.5 $^{\prime\prime}$ $\times$
61.6
$\times$
61.6 $^{\prime\prime}$
, and 53.9
$^{\prime\prime}$
, and 53.9 $^{\prime\prime}$ $\times$
53.7
$\times$
53.7 $^{\prime\prime}$
; (f) is from ASKAP (12.6
$^{\prime\prime}$
; (f) is from ASKAP (12.6 $^{\prime\prime}$ $\times$
10.0
$\times$
10.0 $^{\prime\prime}$
, and (g) is from ATCA (6.31
$^{\prime\prime}$
, and (g) is from ATCA (6.31 $^{\prime\prime}$ $\times$
3.05
$\times$
3.05 $^{\prime\prime}$
). The blue box in figure (c) is the region in which the total emission is measured, in order to exclude any contribution from PKS 2333
$^{\prime\prime}$
). The blue box in figure (c) is the region in which the total emission is measured, in order to exclude any contribution from PKS 2333 $-$
318.
$-$
318.

3.2.1. Properties of the diffuse emission and filaments
To detect and measure diffuse emission, we used the NoiseChisel Footnote d and MakeCatalog tools, which are part of the GNU Astronomy Utilities (Gnuastro; Akhlaghi & Ichikawa, Reference Akhlaghi and Ichikawa2015; Akhlaghi, Reference Akhlaghi, Molinaro, Shortridge and Pasian2019b). NoiseChisel uses very low thresholds to nonparametrically detect extended regions of elevated brightness, to very low signal-to-noise (S/N) ratios (Akhlaghi, Reference Akhlaghi2019a).
To measure the uncertainty of this integrated flux density, we used MakeCatalog’s –upperlimit: the footprint of the region was randomly placed in parts of the image with similar noise propertiesFootnote e, discarding any position where the displaced footprint overlaps with a detection, and the sum of pixel values was measured. The process was terminated after 10 000 successful measurements (–upnum=10 000). The sigma-clipped median ( $m_r$
) and standard deviation (
$m_r$
) and standard deviation ( $\unicode{x03C3}_r$
) of this random distribution were calculated and compared with the total sum within the region (s), giving an estimate of significance of
$\unicode{x03C3}_r$
) of this random distribution were calculated and compared with the total sum within the region (s), giving an estimate of significance of $(s-m_r)/\unicode{x03C3}_r$
.
$(s-m_r)/\unicode{x03C3}_r$
.
Figure 2(a) shows the NoiseChisel detection of diffuse emission in Abell S1136 as the green-shaded pixels. Figure 2(b) shows other likely detections in the image at the same level, as black pixels, showing that similar extended regions of diffuse emission are not found elsewhere in the image.
Using the 888 MHz ASKAP robust $=0$
image, shown in Figure 2(a), we used NoiseChisel to measure the flux density of the three filaments above a surface brightness threshold of 100
$=0$
image, shown in Figure 2(a), we used NoiseChisel to measure the flux density of the three filaments above a surface brightness threshold of 100 $\unicode{x03BC}$
Jy beam
$\unicode{x03BC}$
Jy beam $^{-1}$
(shown as a purple outline in the green emission in Figure 2(a)). Similarly, we measured the flux density of the diffuse emission (shown in green) using only NoiseChisel-detected pixels above this threshold. The results are listed in Table 3. In each case, uncertainties were estimated as described above.
$^{-1}$
(shown as a purple outline in the green emission in Figure 2(a)). Similarly, we measured the flux density of the diffuse emission (shown in green) using only NoiseChisel-detected pixels above this threshold. The results are listed in Table 3. In each case, uncertainties were estimated as described above.
Using the uncertainty estimation technique described above, we obtain a significance for this detection of $9.7\unicode{x03C3}$
. To confirm that this high fraction is not due to a concentrated region (that may have been missed in the masking) and is mostly uniform, we manually divided the diffuse region into two, shown as blue and red in Figure 2(b). We found a significance of
$9.7\unicode{x03C3}$
. To confirm that this high fraction is not due to a concentrated region (that may have been missed in the masking) and is mostly uniform, we manually divided the diffuse region into two, shown as blue and red in Figure 2(b). We found a significance of $6.6\unicode{x03C3}$
and
$6.6\unicode{x03C3}$
and $7.1\unicode{x03C3}$
for the blue and red regions, respectively. The results of all measurements are shown in Table 3.
$7.1\unicode{x03C3}$
for the blue and red regions, respectively. The results of all measurements are shown in Table 3.
3.2.2. Total flux density
The total integrated flux density measurements for the cluster were obtained using images at all frequency bands, shown Figure 2(c $-$
g). In the lowest resolution MWA 2 image at 154 MHz, the galaxy cluster Abell S1136 and the head-tail radio galaxy PKS 2333
$-$
g). In the lowest resolution MWA 2 image at 154 MHz, the galaxy cluster Abell S1136 and the head-tail radio galaxy PKS 2333 $-$
318 are the only significant radio detections. To measure the integrated spectral index of Abell S1136, we defined a region, shown as a cyan box in Figure 2(c), to exclude the emission from PKS 2333
$-$
318 are the only significant radio detections. To measure the integrated spectral index of Abell S1136, we defined a region, shown as a cyan box in Figure 2(c), to exclude the emission from PKS 2333 $-$
318 and contain only the emission from Abell S1136. For the other frequencies (185, 215, 888, and 2100 MHz) we measured the integrated flux density within the same box. The resulting integrated flux densities and spectral index are shown in Table 3.
$-$
318 and contain only the emission from Abell S1136. For the other frequencies (185, 215, 888, and 2100 MHz) we measured the integrated flux density within the same box. The resulting integrated flux densities and spectral index are shown in Table 3.
3.3. Spectral index
A low-resolution spectral index map was produced using robust $=0$
images from MWA 2 at 154, 185, and 215 MHz, and ASKAP at 888 MHz. The data were regridded to the finest pixel grid (ASKAP 888 MHz 12.6
$=0$
images from MWA 2 at 154, 185, and 215 MHz, and ASKAP at 888 MHz. The data were regridded to the finest pixel grid (ASKAP 888 MHz 12.6 $^{\prime\prime}$ $\times$
10.0
$\times$
10.0 $^{\prime\prime}$
) and convolved to the largest beam (MWA 2 154 MHz 73.95
$^{\prime\prime}$
) and convolved to the largest beam (MWA 2 154 MHz 73.95 $^{\prime\prime}$ $\times$
72.85
$\times$
72.85 $^{\prime\prime}$
). The images were then stacked together, with the individual pixels in the stacked images processed through a simple weighted linear regression algorithm, with the slope of the best line of fit saved to a new image and output as a fits file. This image is shown in Figure 4. It is important to note that the resolution of the low frequency measurements does not allow the separation of the spectral index of the diffuse emission from that of the compact sources.
$^{\prime\prime}$
). The images were then stacked together, with the individual pixels in the stacked images processed through a simple weighted linear regression algorithm, with the slope of the best line of fit saved to a new image and output as a fits file. This image is shown in Figure 4. It is important to note that the resolution of the low frequency measurements does not allow the separation of the spectral index of the diffuse emission from that of the compact sources.
The MWA integrated flux measurements at 154, 185, and 215 MHz (see Table 3 and Figure 3), show a clear indication of a very steep spectrum $\alpha\sim-$
3.88 component at low frequencies. Inclusion of the 888 MHz ASKAP integrated flux flattens the overall measured spectral index to
$\alpha\sim-$
3.88 component at low frequencies. Inclusion of the 888 MHz ASKAP integrated flux flattens the overall measured spectral index to $\alpha\sim-$
1.68, shown by the solid black line in Figure 3. This is consistent with a steep-spectrum diffuse component which dominates at low frequencies but is faint at high frequencies, combined with a number of flatter-spectrum compact sources which dominate the total flux density at high frequencies, helping to flatten the spectral index fit. It is therefore difficult to determine if the diffuse emission alone is consistent with a power-law spectrum (van Weeren et al., Reference van Weeren, de Gasperin and Akamatsu2019).
$\alpha\sim-$
1.68, shown by the solid black line in Figure 3. This is consistent with a steep-spectrum diffuse component which dominates at low frequencies but is faint at high frequencies, combined with a number of flatter-spectrum compact sources which dominate the total flux density at high frequencies, helping to flatten the spectral index fit. It is therefore difficult to determine if the diffuse emission alone is consistent with a power-law spectrum (van Weeren et al., Reference van Weeren, de Gasperin and Akamatsu2019).
The spectral index measurements using the integrated flux of the diffuse emission and compact components in the Abell S1136 galaxy cluster. The flux measurements from Table 3 have been weighted and plotted with error bars derived from a quadrature sum of estimated 10% systematic errors plus the errors from Table 3. The solid black line shows the fit between MWA 154, 185, and 215 MHz, and ASKAP 888 MHz, with a spectral index of $\alpha\sim-$
1.68. The ATCA 2100 MHz spectral index is plotted in blue and shown here as a lower limit. As described in Section 2.3, the ATCA flux is not included in the fit as the short spacings are not sensitive to the extended diffuse emission in Abell S1136. There is indication of a very steep spectrum component at low frequencies in the three MWA data points, with a spectral index of
$\alpha\sim-$
1.68. The ATCA 2100 MHz spectral index is plotted in blue and shown here as a lower limit. As described in Section 2.3, the ATCA flux is not included in the fit as the short spacings are not sensitive to the extended diffuse emission in Abell S1136. There is indication of a very steep spectrum component at low frequencies in the three MWA data points, with a spectral index of $\alpha\sim-$
3.88. This is consistent with a steep-spectrum diffuse component which dominates at low frequencies, but is faint at high frequencies. Including both compact sources and diffuse emission means there are a number of flatter-spectrum compact sources which dominate the total flux density, helping to flatten the spectral index; particularly at higher frequencies.
$\alpha\sim-$
3.88. This is consistent with a steep-spectrum diffuse component which dominates at low frequencies, but is faint at high frequencies. Including both compact sources and diffuse emission means there are a number of flatter-spectrum compact sources which dominate the total flux density, helping to flatten the spectral index; particularly at higher frequencies.

The spectral index map of the galaxy cluster Abell S1136. The map was created using images from MWA 2 @ 154 MHz (74.0 $^{\prime\prime}$ $\times$
72.8
$\times$
72.8 $^{\prime\prime}$
), 185 (62.5
$^{\prime\prime}$
), 185 (62.5 $^{\prime\prime}$ $\times$
61.6
$\times$
61.6 $^{\prime\prime}$
) MHz, and 215 MHz (53.9
$^{\prime\prime}$
) MHz, and 215 MHz (53.9 $^{\prime\prime}$ $\times$
53.7
$\times$
53.7 $^{\prime\prime}$
), and ASKAP 888 MHz (12.6
$^{\prime\prime}$
), and ASKAP 888 MHz (12.6 $^{\prime\prime}$ $\times$
10.0
$\times$
10.0 $^{\prime\prime}$
). Contours in black are at 100
$^{\prime\prime}$
). Contours in black are at 100 $\unicode{x03BC}$
Jy beam
$\unicode{x03BC}$
Jy beam $^{-1}$
from the ASKAP 888 MHz image. The data were regridded to the finest pixel grid and convolved to the largest beam. The MWA 2 beam is shown in the bottom left corner.
$^{-1}$
from the ASKAP 888 MHz image. The data were regridded to the finest pixel grid and convolved to the largest beam. The MWA 2 beam is shown in the bottom left corner.

3.4. X-ray data
Figure 5 shows the X-ray image of Abell S1136 from observations with the XMM-Newton X-ray telescope (Id 0765041001) obtained as part of the extremely expanded HIghest X-ray FLUx Galaxy Cluster Sample (eeHIFLUGCS) follow-up project (Reiprich, Reference Reiprich, Ness and Migliari2017; Ramos-Ceja et al., Reference Ramos-Ceja, Pacaud and Reiprich2019; Migkas et al., Reference Migkas, Schellenberger and Reiprich2020; Pacaud et al. in prep.).
XMM-Newton X-ray image (0.5 $-$
2 keV) of the galaxy cluster Abell S1136 convolved to ASKAP 888 MHz low resolution image (Figure 1(b); 25.51
$-$
2 keV) of the galaxy cluster Abell S1136 convolved to ASKAP 888 MHz low resolution image (Figure 1(b); 25.51 $^{\prime\prime}$ $\times$
21.27
$\times$
21.27 $^{\prime\prime}$
), showing an X-ray peak located at RA(J2000) = 23
$^{\prime\prime}$
), showing an X-ray peak located at RA(J2000) = 23 $^{\rm h}$
36
$^{\rm h}$
36 $^{\rm m}$
16.54
$^{\rm m}$
16.54 $^{\rm s}$
DEC(J2000) =
$^{\rm s}$
DEC(J2000) = $-$
31
$-$
31 $^{\circ} $
36
$^{\circ} $
36 $^{\prime}$
09.
$^{\prime}$
09. $^{\prime\prime}$
5, coincident with the radio emitting BCG ESO 470-G020. ASKAP contours (red) are at 0.1, 0.15, 0.3, 0.6, and 1.0 mJy beam
$^{\prime\prime}$
5, coincident with the radio emitting BCG ESO 470-G020. ASKAP contours (red) are at 0.1, 0.15, 0.3, 0.6, and 1.0 mJy beam $^{-1}$
. PKS 2333
$^{-1}$
. PKS 2333 $-$
318 (to the north-west of the cluster centre) is well within the projected extent of the Abell S1136 galaxy cluster ICM. The yellow rectangle (30
$-$
318 (to the north-west of the cluster centre) is well within the projected extent of the Abell S1136 galaxy cluster ICM. The yellow rectangle (30 $^{\prime\prime}$
wide) indicates a possible ‘channel’ of marginal (
$^{\prime\prime}$
wide) indicates a possible ‘channel’ of marginal ( $\sim 4.3 \unicode{x03C3}$
) significance. The statistical significance of the channel was calculated using emission between 1 and 2
$\sim 4.3 \unicode{x03C3}$
) significance. The statistical significance of the channel was calculated using emission between 1 and 2 $^{\prime}$
of the cluster centre (indicated by the inner and outer green rings) but excluding the region delineated by the two radial green lines, as described in Section 4.2.
$^{\prime}$
of the cluster centre (indicated by the inner and outer green rings) but excluding the region delineated by the two radial green lines, as described in Section 4.2.

The data were processed and calibrated using the standard XMM-SAS processing tools (version 18.0.0). The calibrated event-lists were filtered for possible particle flare contamination based on a Poisson distribution fit to the [0.3-10.0] keV light curve values in time bins of 52/26s (resp. for the MOS/PN detectors). Time bins with count arrival rates outside the 3 $\unicode{x03C3}$
central range of the Poisson distribution were excluded as contaminated. This resulted in the exclusion of only 9% of the total exposure time. The instrumental background for each XMM-Newton (XMM)/EPIC exposure was modelled based on Filter Wheel Closed observations rescaled using the signal observed in the unexposed CCD corners. Images were extracted in the [0.5-2.0] keV band, resulting in the instrumental background subtracted, exposure corrected surface brightness map displayed in Figure 5. The morphology of the X-ray map confirms the emission peak to be coincident with the BCG defined at the coordinates in the ASKAP observations. The BCG is often associated with the geometric and kinematic galaxy centre, as well as the peak of the cluster X-ray emission (Lin & Mohr, Reference Lin and Mohr2004; Hudson et al., Reference Hudson, Mittal and Reiprich2010).
$\unicode{x03C3}$
central range of the Poisson distribution were excluded as contaminated. This resulted in the exclusion of only 9% of the total exposure time. The instrumental background for each XMM-Newton (XMM)/EPIC exposure was modelled based on Filter Wheel Closed observations rescaled using the signal observed in the unexposed CCD corners. Images were extracted in the [0.5-2.0] keV band, resulting in the instrumental background subtracted, exposure corrected surface brightness map displayed in Figure 5. The morphology of the X-ray map confirms the emission peak to be coincident with the BCG defined at the coordinates in the ASKAP observations. The BCG is often associated with the geometric and kinematic galaxy centre, as well as the peak of the cluster X-ray emission (Lin & Mohr, Reference Lin and Mohr2004; Hudson et al., Reference Hudson, Mittal and Reiprich2010).
Some features are further visible in the map that connects to the radio emission; (a) a possible excess coincident with the BCG filament, seen as a bright ridge which extends along the BCG radio emission, and (b) a possible ‘channel’ of missing thermal plasma at the position of the northern filament, shown by the yellow rectangle in Figure 5. We discuss this further in Section 4.2.
3.4.1. X-ray temperature and spectral profile analysis
To perform a more detailed spectroscopic analysis of the X-ray data, and measure other X-ray properties, we created a mask of the X-ray point sources to be excluded from the analysis. We first modelled the sky background from the outer regions of the pointing assuming that it consists of a contribution from the unresolved AGN population (an absorbed power-law spectrum with an X-ray spectral index of 1.46), the emission from the Milky Way halo (an absorbed Astrophysical Plasma Emission Code (APEC) thermal model with solar metal abundance and a fitted temperature of $\sim$
0.2 keV) and that of the local hot bubble (again absorbed solar metalicity APEC, with a temperature
$\sim$
0.2 keV) and that of the local hot bubble (again absorbed solar metalicity APEC, with a temperature $\sim$
0.1 keV). Our spectral modelling relied on version 3.0.9 of the APEC model and a fixed hydrogen column density of
$\sim$
0.1 keV). Our spectral modelling relied on version 3.0.9 of the APEC model and a fixed hydrogen column density of $1.23\times10^{20}$
cm
$1.23\times10^{20}$
cm $^{-2}$
derived from the Leiden/Argentine/Bonn (LAB) survey (Górski et al., Reference Górski, Hivon and Banday2005; Kalberla et al., Reference Kalberla, Burton and Hartmann2005; Land & Slosar, Reference Land and Slosar2007). Then we proceeded with extracting and modelling spectra in regions of interest, adding a further cluster APEC component to the area-rescaled sky background.
$^{-2}$
derived from the Leiden/Argentine/Bonn (LAB) survey (Górski et al., Reference Górski, Hivon and Banday2005; Kalberla et al., Reference Kalberla, Burton and Hartmann2005; Land & Slosar, Reference Land and Slosar2007). Then we proceeded with extracting and modelling spectra in regions of interest, adding a further cluster APEC component to the area-rescaled sky background.
The red and grey points in Figure 6(b) show the average cluster temperature estimated in apertures of increasing size. The dashed line shows the average $R_{500}-T$
relation for a cluster at
$R_{500}-T$
relation for a cluster at $z = 0.062$
, based on the galaxy cluster mass-temperature (M
$z = 0.062$
, based on the galaxy cluster mass-temperature (M $-$
T) relation of Arnaud et al. (Reference Arnaud, Pointecouteau and Pratt2005). The average temperature of the Abell S1136 galaxy cluster at the
$-$
T) relation of Arnaud et al. (Reference Arnaud, Pointecouteau and Pratt2005). The average temperature of the Abell S1136 galaxy cluster at the $R_{500}$
radius of 8.4
$R_{500}$
radius of 8.4 $^{\prime}$
is
$^{\prime}$
is $\sim$
1.82 keV, shown by the intersection of the dashed and red lines in Figure 6(a). This enables us to estimate an approximate cluster
$\sim$
1.82 keV, shown by the intersection of the dashed and red lines in Figure 6(a). This enables us to estimate an approximate cluster $R_{500} / M_{500}$
(the halo mass
$R_{500} / M_{500}$
(the halo mass $M_{500}$
out to a radius
$M_{500}$
out to a radius $R_{500}$
within which the total mass density is 500 times the critical density of the Universe). Other cluster average properties are estimated from a direct fit to spectra extracted within
$R_{500}$
within which the total mass density is 500 times the critical density of the Universe). Other cluster average properties are estimated from a direct fit to spectra extracted within $R_{500}$
and shown in Table 4.
$R_{500}$
and shown in Table 4.
The X-ray temperature profiles of the Abell S1136 galaxy cluster; in both Figures the red line is the result leaving the metal abundance free, the grey line is for a fixed value of 0.3 solar. The location on the x-axis on both plots is the radial distance from the BCG at which the measurement is taken. Figure 6(a) shows the average cluster temperature (expressed as kT), estimated in apertures of increasing size from the cluster centre. The dashed line shows the average $R_{500}-T$
relation for a cluster at
$R_{500}-T$
relation for a cluster at $z = 0.062$
, based on the galaxy cluster mass-temperature (M
$z = 0.062$
, based on the galaxy cluster mass-temperature (M $-$
T) relation of Arnaud et al. (Reference Arnaud, Pointecouteau and Pratt2005). The average temperature of the Abell S1136 galaxy cluster at 8.4
$-$
T) relation of Arnaud et al. (Reference Arnaud, Pointecouteau and Pratt2005). The average temperature of the Abell S1136 galaxy cluster at 8.4 $^{\prime}$
(the
$^{\prime}$
(the $R_{500}$
radius) is
$R_{500}$
radius) is $\sim$
1.82 keV, shown by the intersection of the dashed and red lines in Figure 6(a). Figure 6(b) shows the Abell S1136 X-ray temperature profile, with the cluster temperature plotted against radial distance in arcminutes from the cluster centre. The temperature profile appears linear from the centre to the edge, with no drop in temperature towards the cluster centre.
$\sim$
1.82 keV, shown by the intersection of the dashed and red lines in Figure 6(a). Figure 6(b) shows the Abell S1136 X-ray temperature profile, with the cluster temperature plotted against radial distance in arcminutes from the cluster centre. The temperature profile appears linear from the centre to the edge, with no drop in temperature towards the cluster centre.

We note that the values shown in Table 5 differ slightly from the earlier ROSAT measurements (Migkas et al., Reference Migkas, Schellenberger and Reiprich2020; Piffaretti et al., 2011) because (a) the ROSAT data include contributions from AGN such as PKS 2333 $-$
318, and (b) the ROSAT temperature is based on data in the radius range
$-$
318, and (b) the ROSAT temperature is based on data in the radius range $0.2-0.5 \times R_{500}$
(i.e. excluding the central 2
$0.2-0.5 \times R_{500}$
(i.e. excluding the central 2 $^{\prime}$
) whereas ours is based on all the emission within
$^{\prime}$
) whereas ours is based on all the emission within $R_{500}$
.
$R_{500}$
.
Because the cluster shows a central surface brightness peak, and seems to be in a relatively relaxed state, we calculated a projected temperature and abundance profile to see if there is a cool core. The X-ray temperature profile is shown in red and grey in Figure 6(b).
3.5. Optical and infrared properties
We show the radio contours overlaid on a WISE image in Figure 7, and in Table 5 we list photometry and spectroscopy for sources A, B and C from the SkyMapper (Onken et al., Reference Onken, Wolf and Bessell2019) and WISE (Wright et al., Reference Wright, Eisenhardt and Mainzer2010) surveys, and the 2dF Galaxy Redshift Survey (De Propris et al., Reference De Propris, Couch and Colless2002). We classified the galaxies using WISE colours following the WISE colourcolour diagram (Wright et al., Reference Wright, Eisenhardt and Mainzer2010).
WISE infrared RGB image of the galaxy cluster Abell S1136, overlaid with radio contours from the ASKAP low resolution image (Figure 1b; 25.51 $^{\prime\prime}$ $\times$
21.27
$\times$
21.27 $^{\prime\prime}$
). The RGB colours are red = 22
$^{\prime\prime}$
). The RGB colours are red = 22 $\unicode{x03BC}$
m, green = 4.6
$\unicode{x03BC}$
m, green = 4.6 $\unicode{x03BC}$
m, blue = 3.4
$\unicode{x03BC}$
m, blue = 3.4 $\unicode{x03BC}$
m. The BCG ESO 470
$\unicode{x03BC}$
m. The BCG ESO 470 $-$
G020 stands out near the image centre.
$-$
G020 stands out near the image centre.

Source A in Figure 1(a), located near the south-west end of the Northern Filament, is detected in both infrared (WISEA J233615.95 $-$
313534.4) and optical (SkyMapper J233615.95
$-$
313534.4) and optical (SkyMapper J233615.95 $-$
313534.4). The WISE colours for this source (W1
$-$
313534.4). The WISE colours for this source (W1 $-$
W2 =
$-$
W2 = $-$
0.049, W2
$-$
0.049, W2 $-$
W3 = 0.746) indicate this is most likely an elliptical galaxy. The redshift for this source is
$-$
W3 = 0.746) indicate this is most likely an elliptical galaxy. The redshift for this source is $z = 0.063 \pm0.002$
, so it is a cluster member.
$z = 0.063 \pm0.002$
, so it is a cluster member.
The Abell S1136 average properties, as determined from the analysis of the XMM data. For the luminosities, the X-ray band (in keV) is indicated by the range in subscript.

Source B in Figure 1(a) is the BCG of the Abell S1136 galaxy cluster and is coincident with the BCG Filament. This source is detected in both infrared (WISEA J233616.55 $-$
313609.3) and optical (SkyMapper J233616.52
$-$
313609.3) and optical (SkyMapper J233616.52 $-$
313609.0). The WISE colours for this source (W1
$-$
313609.0). The WISE colours for this source (W1 $-$
W2 =
$-$
W2 = $-$
0.053, W2
$-$
0.053, W2 $-$
W3 = 0.512) indicate this is most likely an elliptical galaxy. The redshift
$-$
W3 = 0.512) indicate this is most likely an elliptical galaxy. The redshift $z = 0.0622 \pm 0.0031$
for the Abell S1136 galaxy cluster is measured on this source.
$z = 0.0622 \pm 0.0031$
for the Abell S1136 galaxy cluster is measured on this source.
Source C in Figure 1(a), located slightly above the Southern Filament, is detected as a faint source in WISE bands W1 and W2 but not in other optical or IR photometry, giving little indication of the nature of this source, and no redshift is available.
Properties of the Infrared and Optical Sources near the three Abell S1136 Filaments.
 $^\dagger$
20% uncertainty (Norris et al., Reference Norris, Marvil and Collier2021).
$^\dagger$
20% uncertainty (Norris et al., Reference Norris, Marvil and Collier2021). $^\star$
Redshift from 2dFGRS (De Propris et al., Reference De Propris, Couch and Colless2002).
$^\star$
Redshift from 2dFGRS (De Propris et al., Reference De Propris, Couch and Colless2002).
3.6. PKS 2333–318
The radio loud cluster member PKS 2333 $-$
318 lies to the north-west of the Abell S1136 galaxy cluster at RA(J2000) = 23
$-$
318 lies to the north-west of the Abell S1136 galaxy cluster at RA(J2000) = 23 $^{\rm h}$
36
$^{\rm h}$
36 $^{\rm m}$
04.96
$^{\rm m}$
04.96 $^{\rm s}$
DEC(J2000) =
$^{\rm s}$
DEC(J2000) = $-$
31
$-$
31 $^{\circ} $
34
$^{\circ} $
34 $^{\prime}$
51.
$^{\prime}$
51. $^{\prime\prime}$
3. The redshift of PKS 2333
$^{\prime\prime}$
3. The redshift of PKS 2333 $-$
318 is z = 0.06134 (Jones et al., Reference Jones, Read and Saunders2009). PKS 233
$-$
318 is z = 0.06134 (Jones et al., Reference Jones, Read and Saunders2009). PKS 233 $-$
318 has an unusual single fat tail pointing away from the cluster centre. We consider this most likely to be a head-tail radio galaxy in which the jets have been blown back and merged by the ICM. There is evidence of subtle sub-structure as shown in Figure 8, although there is no clear evidence of the double tail often seen in a head-tail galaxy.
$-$
318 has an unusual single fat tail pointing away from the cluster centre. We consider this most likely to be a head-tail radio galaxy in which the jets have been blown back and merged by the ICM. There is evidence of subtle sub-structure as shown in Figure 8, although there is no clear evidence of the double tail often seen in a head-tail galaxy.
ATCA 2100 MHz radio continuum image (6.31 $^{\prime\prime}$ $\times$
3.05
$\times$
3.05 $^{\prime\prime}$
) of the interesting head-tail galaxy PKS 2333
$^{\prime\prime}$
) of the interesting head-tail galaxy PKS 2333 $-$
318, located to the north-west of the Abell S1136 galaxy cluster BCG. The solid black contours at 200, 400, 800, 1200, and 1600
$-$
318, located to the north-west of the Abell S1136 galaxy cluster BCG. The solid black contours at 200, 400, 800, 1200, and 1600 $\unicode{x03BC}$
Jy beam
$\unicode{x03BC}$
Jy beam $^{-1}$
, from the ATCA 2100 MHz image, outline the inner structure of the radio loud single tail emitted from PKS 2333
$^{-1}$
, from the ATCA 2100 MHz image, outline the inner structure of the radio loud single tail emitted from PKS 2333 $-$
318. The dashed red contours, at 80, 160, 320, 640, and 750
$-$
318. The dashed red contours, at 80, 160, 320, 640, and 750 $\unicode{x03BC}$
Jy beam
$\unicode{x03BC}$
Jy beam $^{-1}$
, are from the ASKAP robust
$^{-1}$
, are from the ASKAP robust $=-0.5$
image (12.6
$=-0.5$
image (12.6 $^{\prime\prime}$ $\times$
10.0
$\times$
10.0 $^{\prime\prime}$
) shown in Figure 1(a). The ATCA and ASKAP beams are shown in the bottom left corner as a solid and open ellipses, respectively.
$^{\prime\prime}$
) shown in Figure 1(a). The ATCA and ASKAP beams are shown in the bottom left corner as a solid and open ellipses, respectively.

4. Discussion
Duchesne et al. (Reference Duchesne and Johnston-Hollitt2021) detected diffuse emission from Abell S1136 using the MWA. While they say the diffuse emission could be categorised as a cluster halo, potential alternative interpretations include the presence of a cluster relic obstructing the line of sight towards the cluster, or the possibility of a dormant radio galaxy that might have previously been associated with the BCG, ESO 470 $-$
20. With the higher resolution and sensitivity of ASKAP (Figure 1(a), we now see that the diffuse emission detected with the MWA consists of several components: (a) a cloud of diffuse emission about 450 kpc in extent; (b) three filaments of emission; and (c) a number of compact sources, one of which we identify as the BCG.
$-$
20. With the higher resolution and sensitivity of ASKAP (Figure 1(a), we now see that the diffuse emission detected with the MWA consists of several components: (a) a cloud of diffuse emission about 450 kpc in extent; (b) three filaments of emission; and (c) a number of compact sources, one of which we identify as the BCG.
4.1. The diffuse radio emission
The diffuse emission (shown in green in Figure 2(a)) is about 450 kpc in extent. We consider whether the diffuse emission can be attributed to a radio halo, which is typically $\sim$
700 kpc to
$\sim$
700 kpc to $\sim$
1 Mpc in size and found in disturbed clusters (Chon et al., Reference Chon, Böhringer and Smith2012; Chon & Böhringer, Reference Chon and Böhringer2017), or to a mini-halo which is typically smaller; measuring less than 500 kpc in size, and found in relaxed clusters.
$\sim$
1 Mpc in size and found in disturbed clusters (Chon et al., Reference Chon, Böhringer and Smith2012; Chon & Böhringer, Reference Chon and Böhringer2017), or to a mini-halo which is typically smaller; measuring less than 500 kpc in size, and found in relaxed clusters.
Radio halos are probably caused by electrons accelerated by turbulence in the wake of cluster collisions. They are extended in size and trace the presence of cosmic rays and magnetic fields in the ICM, and are seen in many merging galaxy clusters (see e.g. van Weeren et al., Reference van Weeren, de Gasperin and Akamatsu2019). However, both the mass and the X-ray luminosity of the Abell S1136 galaxy cluster as reported here lie below any reported clusters with a radio halo (see eg Figure 9 in van Weeren et al. (Reference van Weeren, de Gasperin and Akamatsu2019)).
Radio mini-halos are normally found at the centre of relaxed cool-core clusters, and are associated with a radio galaxy that injects the electrons into the ICM. Mini-halo sizes extend to $\sim$
200 kpc from the central AGN, with some evidence of radial radial spectral steepening as seen in the Perseus cluster (Gitti et al., Reference Gitti, Brunetti and Setti2002), Abell 2626 (Gitti et al., 2004), and Ophiucus (Murgia et al., Reference Murgia, Eckert and Govoni2010). However, the higher sensitivity of the latest generation radio surveys is finding that many ‘mini’-halos are far more extended than previously thought, with sizes up to approximately 0.5 Mpc; approaching the linear scales more commonly found for standard radio halos (e.g. Savini et al., Reference Savini, Bonafede and Brüggen2018, 2019; Biava et al., Reference Biava, de Gasperin and Bonafede2021; Riseley et al., Reference Riseley, Rajpurohit and Loi2022a, Reference Riseley, Biava and Lusetti2023, 2024).
$\sim$
200 kpc from the central AGN, with some evidence of radial radial spectral steepening as seen in the Perseus cluster (Gitti et al., Reference Gitti, Brunetti and Setti2002), Abell 2626 (Gitti et al., 2004), and Ophiucus (Murgia et al., Reference Murgia, Eckert and Govoni2010). However, the higher sensitivity of the latest generation radio surveys is finding that many ‘mini’-halos are far more extended than previously thought, with sizes up to approximately 0.5 Mpc; approaching the linear scales more commonly found for standard radio halos (e.g. Savini et al., Reference Savini, Bonafede and Brüggen2018, 2019; Biava et al., Reference Biava, de Gasperin and Bonafede2021; Riseley et al., Reference Riseley, Rajpurohit and Loi2022a, Reference Riseley, Biava and Lusetti2023, 2024).
In Section 3.4, we showed that Abell S1136 has some properties expected for relaxed clusters, but with no evidence of a cool core. The X-ray and radio emission were found to be coincident with the centre of the galaxy cluster, located on the BCG ESO 470 $-$
20 (Lauberts & Valentijn, Reference Lauberts and Valentijn1989).
$-$
20 (Lauberts & Valentijn, Reference Lauberts and Valentijn1989).
The radio halo of a relaxed cluster classically consists of a smooth volume-filling region of radio emission that roughly follows the mass distribution of the cluster, and the radio halo centroid is coincident with the centroid of the X-ray emission, usually with some form of radial symmetry. The diffuse radio emission in Abell S1136, while roughly centred on the BCG and on the centroid of the X-ray emission, is far from being a contiguous or symmetric smooth region about the BCG.
The measured spectral index ( $\alpha\sim-$
1.68) of the diffuse emission in Abell S1136 is typical for radio halos or their smaller mini-halo counterparts (
$\alpha\sim-$
1.68) of the diffuse emission in Abell S1136 is typical for radio halos or their smaller mini-halo counterparts ( $\alpha<-$
1). Revived fossil plasma sources often show steep spectral indices (
$\alpha<-$
1). Revived fossil plasma sources often show steep spectral indices ( $\alpha\lesssim-2$
), and a curved spectrum (Riseley et al., Reference Riseley, Bonnassieux and Vernstrom2022b); we see in Figure 3 the MWA 2 data at low frequencies exhibits a possible break in the simple power law fit, with the spectral index being steeper at the lower frequencies.
$\alpha\lesssim-2$
), and a curved spectrum (Riseley et al., Reference Riseley, Bonnassieux and Vernstrom2022b); we see in Figure 3 the MWA 2 data at low frequencies exhibits a possible break in the simple power law fit, with the spectral index being steeper at the lower frequencies.
Although there might be a curved spectrum in the diffuse emission of the Abell S1136 galaxy cluster, as seen in revived fossil plasma, we are unable to quantify this as there are no measurements between the MWA 215 MHz and ASKAP 888 MHz data points. Therefore, the properties of the diffuse emission do not fit well with either classifications of a giant, or mini, radio halo.
We therefore cannot classify the source as a halo or mini-halo, and defer its classification to the wider discussion of the classification of diffuse emission from clusters (Govoni et al., 2019; Botteon et al., Reference Botteon, van Weeren and Brunetti2020; Knowles et al., Reference Knowles, Cotton and Rudnick2022), prompted by higher resolution and sensitivity observations using telescopes such as ASKAP, MeerKAT, and LOFAR.
4.2. The X-ray channel
Figure 5 shows marginal evidence of a ‘channel’ through the hot gas of the ICM, coincident with the Northern filament. To calculate the statistical significance of this channel, we define a control region (shown in Figure 5) consisting of an annulus between 1 and 2 $^{\prime}$
around the cluster centre, excluding a region immediately surrounding the potential channel. We then fit a radial power law to the flux distribution inside the control annulus, corrected for various small effects, on which we simulate the channel using a MCMC (Markov chain Monte Carlo) with 50 million points. This resulted in an estimated probability of obtaining the observed channel by chance that corresponds to
$^{\prime}$
around the cluster centre, excluding a region immediately surrounding the potential channel. We then fit a radial power law to the flux distribution inside the control annulus, corrected for various small effects, on which we simulate the channel using a MCMC (Markov chain Monte Carlo) with 50 million points. This resulted in an estimated probability of obtaining the observed channel by chance that corresponds to $\sim 4.3 \unicode{x03C3}$
, which we regard as ‘marginally significant’. We therefore acknowledge that this channel may just be a statistical fluctuation in the noise. For example, other similar ‘holes’ in the X-ray surface brightness can be seen in Figure 5, possibly due to the intrinsic variance of the underlying ICM distribution. Furthermore, there is no evidence for an overall anti-correlation between radio and X-ray. However, the alignment with the radio is curious, and therefore merits some discussion. If this channel is real, it might be caused by the interaction of the radio jet from an AGN with the hot X-ray gas in the ICM. Examples of this have been seen in NGC 1275 (Boehringer et al., Reference Boehringer, Voges, Fabian, Edge and Neumann1993), (Rudnick et al., Reference Rudnick, Brüggen and Brunetti2022b) and possibly in Abell S0102 (Read et al., Reference Read, Filipović, Pietsch and Jones2001; Filipovic et al., Reference Filipovic, Crawford, Jones and White2010). However, it is unclear whether the radio emission in the current case is confined by the X-ray medium, with the X-ray gas guiding the radio emission, or is the result of a channel being bored by the radio jet (Jones et al., Reference Jones, Nolting, O’Neill and Mendygral2017) through the hot gas. In either case, the filament would then presumably represent a radio jet from source A. However, we are cautious about over-interpreting this channel as it is of marginal statistical significance (4.3
$\sim 4.3 \unicode{x03C3}$
, which we regard as ‘marginally significant’. We therefore acknowledge that this channel may just be a statistical fluctuation in the noise. For example, other similar ‘holes’ in the X-ray surface brightness can be seen in Figure 5, possibly due to the intrinsic variance of the underlying ICM distribution. Furthermore, there is no evidence for an overall anti-correlation between radio and X-ray. However, the alignment with the radio is curious, and therefore merits some discussion. If this channel is real, it might be caused by the interaction of the radio jet from an AGN with the hot X-ray gas in the ICM. Examples of this have been seen in NGC 1275 (Boehringer et al., Reference Boehringer, Voges, Fabian, Edge and Neumann1993), (Rudnick et al., Reference Rudnick, Brüggen and Brunetti2022b) and possibly in Abell S0102 (Read et al., Reference Read, Filipović, Pietsch and Jones2001; Filipovic et al., Reference Filipovic, Crawford, Jones and White2010). However, it is unclear whether the radio emission in the current case is confined by the X-ray medium, with the X-ray gas guiding the radio emission, or is the result of a channel being bored by the radio jet (Jones et al., Reference Jones, Nolting, O’Neill and Mendygral2017) through the hot gas. In either case, the filament would then presumably represent a radio jet from source A. However, we are cautious about over-interpreting this channel as it is of marginal statistical significance (4.3 $\unicode{x03C3}$
).
$\unicode{x03C3}$
).
4.3. Filaments
Filamentary radio emission in clusters is typically caused by radio shocks, as discussed in Section 1, and are typically aligned tangentially around the periphery of the cluster (van Weeren et al., Reference van Weeren, de Gasperin and Akamatsu2019); With the possible exception of the Southern Filament, the three filaments that we have identified in the Abell S1136 do not follow this pattern. In some cases the filamentary emission can be at the periphery of the cluster, but seen in projection – eg along the line of sight through the cluster, so the periphery is facing us; this might be the case for the Southern Filament.
The Northern Filament is $\sim$
140 kpc long and is oriented towards the radio galaxy A, which is at a similar redshift to the BCG galaxy B. As discussed above in Section 4.2, there is marginal evidence for an X-ray channel coincident with this filament, suggesting the filament may represent a fossil radio jet from source A. Alternatively, since the filament is near the periphery of the cluster, it could be a radio shock.
$\sim$
140 kpc long and is oriented towards the radio galaxy A, which is at a similar redshift to the BCG galaxy B. As discussed above in Section 4.2, there is marginal evidence for an X-ray channel coincident with this filament, suggesting the filament may represent a fossil radio jet from source A. Alternatively, since the filament is near the periphery of the cluster, it could be a radio shock.
The BCG filament appears to extend from the BCG and is $\sim$
140 kpc long. This is most likely to be a fossil jet associated with galaxy B, although we cannot discount the possibility that it might be a section of an unusual WAT.
$\sim$
140 kpc long. This is most likely to be a fossil jet associated with galaxy B, although we cannot discount the possibility that it might be a section of an unusual WAT.
The Southern Filament is only $\sim$
80 kpc long, and may be associated with with radio source C, in which case it might be revived fossil plasma. However, the filament is perpendicular to the radius vector from the BCG, suggesting that it may be a radio shock. No redshift is available for the radio source C, and therefore we do not know whether or not this source is associated with the cluster.
$\sim$
80 kpc long, and may be associated with with radio source C, in which case it might be revived fossil plasma. However, the filament is perpendicular to the radius vector from the BCG, suggesting that it may be a radio shock. No redshift is available for the radio source C, and therefore we do not know whether or not this source is associated with the cluster.
With new deep and high resolution low-frequency observations, such as as upgraded Giant Metrewave Radio Telescope (uGMRT) and MeerKAT, the existence, morphology, and spectral nature of these filaments could be confirmed and studied in more detail. Additionally, deep linear polarisation data such as from the ASKAP Polarisation Sky Survey of the Universe’s Magnetism (POSSUM; Gaensler et al., Reference Gaensler, Landecker and Taylor2010) could reveal the polarisation fraction and orientation of the magnetic fields which may help discern whether these are shocks are not.
4.4. X-ray
In our analysis of the X-ray temperatures in the Abell S1136 cluster, we do not see cooler emission in the central parts, which would be characteristic of a cool core cluster (Hudson et al., Reference Hudson, Mittal and Reiprich2010). Instead the central parts appear significantly hotter, which would indicate either that the cluster is not relaxed, or that the central AGN inside the BCG also emits X-rays, which would harden the spectra. However, we found no evidence for AGN emission. The reduced $\chi^2$
for the spectral modelling of the central bin is not changed significantly by adding a power-law component to account for a central AGN, which does not allow us to dismiss or confirm this hypothesis. However, we note that the best fit AGN contribution would be 10% of the central flux and would flatten the central profile to temperature values comparable to the measurements at 0.2
$\chi^2$
for the spectral modelling of the central bin is not changed significantly by adding a power-law component to account for a central AGN, which does not allow us to dismiss or confirm this hypothesis. However, we note that the best fit AGN contribution would be 10% of the central flux and would flatten the central profile to temperature values comparable to the measurements at 0.2 $-$
0.3
$-$
0.3 $R_\mathrm{500}$
, which is more in line with expectations for a cluster without evidence for a strong merger event. It would also explain quite well the central surface brightness peak in a cluster without a cool core.
$R_\mathrm{500}$
, which is more in line with expectations for a cluster without evidence for a strong merger event. It would also explain quite well the central surface brightness peak in a cluster without a cool core.
5. Conclusions
The diffuse radio emission in the Abell S1136 galaxy cluster appeared in earlier observations to be an amorphous radio blob, similar in appearance to a radio halo.
Our higher-resolution and higher-sensitivity ASKAP observations show that it breaks up into: (a) a region of diffuse emission about 450 kpc in extent; (b) three filaments located within the diffuse emission, each 80 $-$
140 kpc in extent; and (c) a small number of compact radio sources. The diffuse emission shows some structure which was not evident in earlier low-resolution observations, and its properties do not closely match either those of a halo or mini-halo. However, the distinction between halos and mini-halos is becoming less clear in other high-sensitivity observations of clusters.
$-$
140 kpc in extent; and (c) a small number of compact radio sources. The diffuse emission shows some structure which was not evident in earlier low-resolution observations, and its properties do not closely match either those of a halo or mini-halo. However, the distinction between halos and mini-halos is becoming less clear in other high-sensitivity observations of clusters.
The three filaments appear similar to those increasingly being found in high-sensitivity observations of other cluster sources, although we cannot rule out the possibility that they represent an unusual WAT. Further investigation using higher quality spectral index data and polarisation information would be helpful.
Our X-ray analysis of Abell S1136, based on XMM-Newton observations, shows a distinctive X-ray emission pattern closely aligned with the radio emission from the BCG. This alignment reinforces the BCG’s role as both the geometric centre and the locus of the cluster’s X-ray emission. There is a possible ‘channel’ in the X-ray plasm, which aligns with the ‘Northern’ filament; however evidence for the channel is only marginally significant at $4.3\unicode{x03C3}$
. While it is interesting, it may just signify a statistical fluctuation. The X-ray temperature profile shows that the cluster appears to be in a relaxed state, with no evidence of a cool core.
$4.3\unicode{x03C3}$
. While it is interesting, it may just signify a statistical fluctuation. The X-ray temperature profile shows that the cluster appears to be in a relaxed state, with no evidence of a cool core.
We note that these filaments, and the structure in the diffuse emission, were not visible in earlier, low-resolution observations, and we speculate that many cluster radio sources which are currently regarded as smooth extended sources may well show more complex structure, such as that we see in Abell S1136, when observed with next-generation radio telescopes such as ASKAP, MeerKAT, uGMRT and LOFAR. The wealth of such details that we can expect in the next few years may prompt a re-examination of the classifications of the radio properties of clusters that have been based on low-resolution data.
Acknowledgements
This scientific work uses data obtained from Ilyarrimanha Ilgari Bundara, the CSIRO Murchison Radio-astronomy Observatory. We acknowledge the Wajarri Yamaji People as the Traditional Owners and native title holders of the Observatory site. The Australian SKA Pathfinder is part of the Australia Telescope National Facility (https://ror.org/05qajvd42) which is managed by CSIRO. Operation of ASKAP is funded by the Australian Government with support from the National Collaborative Research Infrastructure Strategy. ASKAP uses the resources of the Pawsey Supercomputing Centre. Establishment of ASKAP, the Murchison Radio-astronomy Observatory and the Pawsey Supercomputing Centre are initiatives of the Australian Government, with support from the Government of Western Australia and the Science and Industry Endowment Fund.
The Australia Telescope Compact Array is part of the Australia Telescope National Facility (https://ror.org/05qajvd42) which is funded by the Australian Government for operation as a National Facility managed by CSIRO. We acknowledge the Gomeroi people as the traditional owners of the Observatory site.
This paper includes archived data obtained through the Australia Telescope Online Archive (http://atoa.atnf.csiro.au).
Partial support for LR comes from U.S. National Science Foundation grant AST17-14205 to the University of Minnesota. SWD acknowledges an Australian Government Research Training Program scholarship administered through Curtin University. CJR acknowledges financial support from the ERC Starting Grant ‘DRANOEL’, number 714245. MA acknowledges the financial support from the European Union – NextGenerationEU and the Spanish Ministry of Science and Innovation through the Recovery and Resilience Facility project J-CAVA, as well as The State Research Agency (AEI-MCINN) of the Spanish Ministry of Science and Innovation (SMSI) under the grant PID2019-105602GBI00/10.13039/501100011033 and the IAC Project P/300724, financed by the SMSI, through the Canary Islands Department of Economy, Knowledge and Employment.
This work was partly done using GNU Astronomy Utilities (Gnuastro, ascl.net/1801.009) version 0.15. Work on Gnuastro has been funded by the Japanese Ministry of Education, Culture, Sports, Science, and Technology (MEXT) scholarship and its Grant-in-Aid for Scientific Research (21244012, 24253003), the European Research Council (ERC) advanced grant 339659-MUSICOS, and from the Spanish Ministry of Economy and Competitiveness (MINECO) under grant number AYA2016-76219-P.
Additional data processing and analysis were conducted using the karma Footnote f (Gooch, Reference Gooch1995) software visualisation package.
Data availability
Stokes I Taylor term images of the ASKAP data used in this article are available through the CSIRO ASKAP Science Data Archive (CASDA) under https://doi.org/10.25919/44sn-2x47. The ATCA data are available from the Australia Telescope Online Archive at https://atoa.atnf.csiro.au/query.jsp. DSS and WISE images were obtained through the SkyViewFootnote g servers. The X-ray data were obtained from the XMM-Newton Science Archive (XSA)Footnote h. The MWA I data are available from the MWA node of the All Sky Virtual Observatory (ASVO)Footnote i. The MWA 2 data are available from the corresponding authors upon reasonable request. Catalogue information was obtained from SkyMapperFootnote j and VizieRFootnote k.
The code to reproduce the NoiseChisel results in Section 3.2.1 is available at https://gitlab.com/makhlaghi/abell-s1136.


 Open access