

1. Introduction
Over the past fifteen years, the Circular Economy (CE) framework has gained increasing prominence within French and European policy discourses, and governments have begun to systematically monitor the performance of circularity interventions (Mayer et al. Reference Mayer, Haas, Wiedenhofer, Krausmann, Nuss and Blengini2019). The CE approach seeks to address pressing environmental challenges, including pollution, climate change, and dependence on critical raw materials. It aims to achieve these goals by promoting strategies centred on the reuse, repair, and recycling of products and materials. At the European level, the CE has been institutionalised through the CE Action Plan, a key component of the European Green Deal, which aims to decouple growth from material consumptionFootnote 1 in pursuit of so-called green growth. In parallel, the private sector has increasingly embraced CE practices as opportunities to improve resource efficiency, reduce operational costs, and enhance profitability.Footnote 2
A growing body of literature has examined the macroeconomic implications of transitioning towards a CE (MacArthur et al. Reference MacArthur2013; Aguilar-Hernandez et al. Reference Aguilar-Hernandez, Dias Rodrigues and Tukker2021). Most macroeconomic analyses of CE remain anchored in neoclassical frameworks, typically relying on Computable General Equilibrium (CGE) and macro-econometric models. Recently, Bongers and Casas (Reference Bongers and Casas2022) employed a dynamic CGE model to identify optimal recycling rates, showing that increased circularity can enhance social welfare in a growing economy. Similarly, Brusselaers et al. (Reference Brusselaers, Breemersch, Geerken, Christis, Lahcen and Dams2022), applied a CGE model for Belgium, as a small open economy, to demonstrate that local job creation and reduced import dependency depend critically on global market reactions and national competitiveness. Kalaš et al. (Reference Kalaš, Radovanov, Milenković and Horvat2024) found that government spending, inflation, and tax revenues positively influence CE-related investment in both the short and long run. In parallel, Rizzati and Landoni (Reference Rizzati and Landoni2024) highlighted that agent-based modelling can capture heterogeneity and behavioural complexity in CE transitions, dimensions often abstracted away in CGE models.
A second strand of research has centred on Environmentally Extended Input—Output (EEIO) analysis, which has been widely applied to waste management (Nakamura and Kondo, Reference Nakamura and Kondo2002; Towa et al. Reference Towa, Zeller and Achten2020) and raw material flow assessment (Eriksen et al. Reference Eriksen, Pivnenko, Faraca, Boldrin and Astrup2020; Lederer et al. Reference Lederer, Gassner, Fellner, Mollay and Schremmer2021), typically incorporating the mass-balance principle (Nakamura et al. Reference Nakamura, Nakajima, Kondo and Nagasaka2007). EEIO has also proven valuable for scenario analysis, providing insights into the potential impacts of policy interventions. For example, Gue et al. (Reference Gue, Tan, Chiu and Ubando2022) and Gause et al. (Reference Gause, Liddell, Dollinger, Steen and Cresko2024) employed EEIO to investigate economic growth and policy prioritisation in relation to decarbonisation and resource use. The Stock—Flow Consistent (SFC) approach has contributed to the analysis of fossil-fuel phase-outs and green fiscal policies (Monasterolo and Raberto, Reference Monasterolo and Raberto2019, Reference Monasterolo and Raberto2018), although its application within the CE framework remains limited (Bimpizas-Pinis et al. Reference Bimpizas-Pinis, Genovese, Kaltenbrunner, Kesidou, Purvis, Torres, Fevereiro and Passarella2023). Finally, emerging studies document the CE rebound effect, whereby efficiency improvements may unintentionally stimulate higher consumption and offset environmental gains (Lowe et al. Reference Lowe, Bimpizas-Pinis, Zerbino and Genovese2024; Ferrante et al. Reference Ferrante, Vitti, Facchini and Sassanelli2024), though considerable uncertainty remains regarding data quality and effect magnitude.
On the one hand, despite their widespread use, CGE models exhibit significant limitations in capturing the complex dynamics and structural transformations. As Blanchard (Reference Blanchard2017) observed in his critique of neoclassical macroeconomic models, such approaches must “become less imperialistic and willing to share the scene with other modelling approaches.” Stiglitz (Reference Stiglitz2018) echoed this sentiment, arguing that mainstream macroeconomic models have failed to incorporate essential behavioural and institutional dimensions due to their flawed microfoundations. On the other hand, although SFC and EEIO models offer valuable integration of monetary and ecological flows, they remain limited in their treatment of labour market dynamics, income distribution, and the role of public finance. These shortcomings constrain their ability to address the multidimensional implications of CE strategies. Bridging these gaps is therefore essential for developing simulation tools capable of evaluating environmental, social, and economic aspects of circular transitions in an integrated and coherent manner.
To overcome these limitations, Ecological Macroeconomic Models (EMMs) have emerged over the past decade as a promising alternative (Victor and Jackson, Reference Victor and Jackson2015; Røpke, Reference Røpke2016). These models integrate Stock-Flow Consistent (SFC) and Environmentally Extended Input—Output (EEIO) approaches within a post-Keynesian macroeconomic framework (Fontana and Sawyer, Reference Fontana and Sawyer2016; Hardt and O’Neill, Reference Hardt and O’Neill2017). Their demand-driven structure reflects the assumption of excess productive capacity, enabling non-equilibrium dynamics in which fluctuations in aggregate demand play a central role (Lavoie, Reference Lavoie2014). Situated within the broader intellectual tradition of Ecological Economics, EMMs adopt a strong sustainability perspective (Daly, Reference Daly2007). They treat key dimensions like economic growth, social equity, and environmental integrity as inherently incommensurable (Georgescu-Roegen, Reference Georgescu-Roegen1971). This motivates the integration of a wide set of indicators to capture the multidimensional nature of socio-ecological systems. Moreover, EMMs commonly draw on System Dynamics methodologies, which allow for the explicit modelling of feedback loops, time delays, and path dependencies (Hardt and O’Neill, Reference Hardt and O’Neill2017; Gozluklu and Sterman, Reference Gozluklu and Sterman2023). EMMs are designed to evaluate the long-term implications of alternative policy strategies through scenario analysis (Nieto et al. Reference Nieto, Carpintero, Lobejón and Miguel2020). By incorporating lagged responses and endogenous feedback mechanisms, these models offer a more realistic representation of transition dynamics and are gaining relevance as decision-support tools for policymakers (Calheiros et al. Reference Calheiros, Lourenço, Mediavilla, Alonso, Distefano and Ramos-Diez2022; Distefano and D’Alessandro, Reference Distefano and D’Alessandro2023).
Recent efforts have aimed to assess raw material use from a systemic perspective, accompanied by the development of novel indicators (Talens Peiró et al. Reference Talens Peiró, Martin, Villalba Méndez and Madrid-López2022). Yet, their integration into EMMs remains limited (Capellán-Pérez et al. Reference Capellán-Pérez, de Blas, Nieto, de Castro, Miguel, Carpintero, Mediavilla, Lobejón, Ferreras-Alonso, Rodrigo, Frechoso and Álvarez-Antelo2020). At the same time, there is growing recognition of the need to account for the broader socio-economic and institutional context, which can significantly influence the effectiveness of waste management and circularity policies (Luzzati et al. Reference Luzzati, Distefano, Ialenti and Andreoni2022). More holistic contributions, such as Basu et al. (Reference Basu, Jamasb and Sen2024), highlight structural tensions between economic growth, CE implementation, and climate neutrality. It frames the absence of such win—win situations as a trilemma.
Despite increasing interest in CE transitions, a substantial gap persists in the macroeconomic literature regarding integrated, policy-oriented assessments that jointly consider material circularity, socio-economic outcomes, and environmental sustainability. This study contributes to filling this gap by extending the French EUROGREEN model (D’Alessandro et al. Reference D’Alessandro, Cieplinski, Distefano and Dittmer2020) to incorporate raw material use, waste generation and treatment, and a wide range of CE strategies. The main research questions are: What are the macroeconomic consequences of supply-side CE strategies focused exclusively on improving material efficiency and recycling? To what extent can social policy interventions mitigate potential adverse side effects? Is a contraction in overall consumption necessary to remain within planetary boundaries?
The structure of the paper is outlined as follows: Section 2 delineates the key innovations applied to the EUROGREEN model alongside the policy measures evaluated. In Section 3, an in-depth analysis of each scenario is provided. Section 3.1 elaborates on the parameter calibration process employed for the simulation of CE policy scenarios. Section 4 presents the results of the macrosimulation analysis. Lastly, Section 5 discusses the principal findings and limitations, articulating the primary policy conclusions.
2. Methodology
This section synthesises the principal characteristics of the EUROGREEN model and provides a detailed description of the main innovations introduced to operationalise the CE framework.
2.1 EUROGREEN model in a nutshell
This study extends the EUROGREEN model (for a comprehensive description, see D’Alessandro et al. Reference D’Alessandro, Cieplinski, Distefano and Dittmer2020), which is grounded in the tradition of Ecological Macroeconomics. The model integrates a Post-Keynesian macroeconomic framework with core principles of Ecological Economics, enabling the simulation of social, economic, and environmental outcomes under alternative techno-policy scenarios.
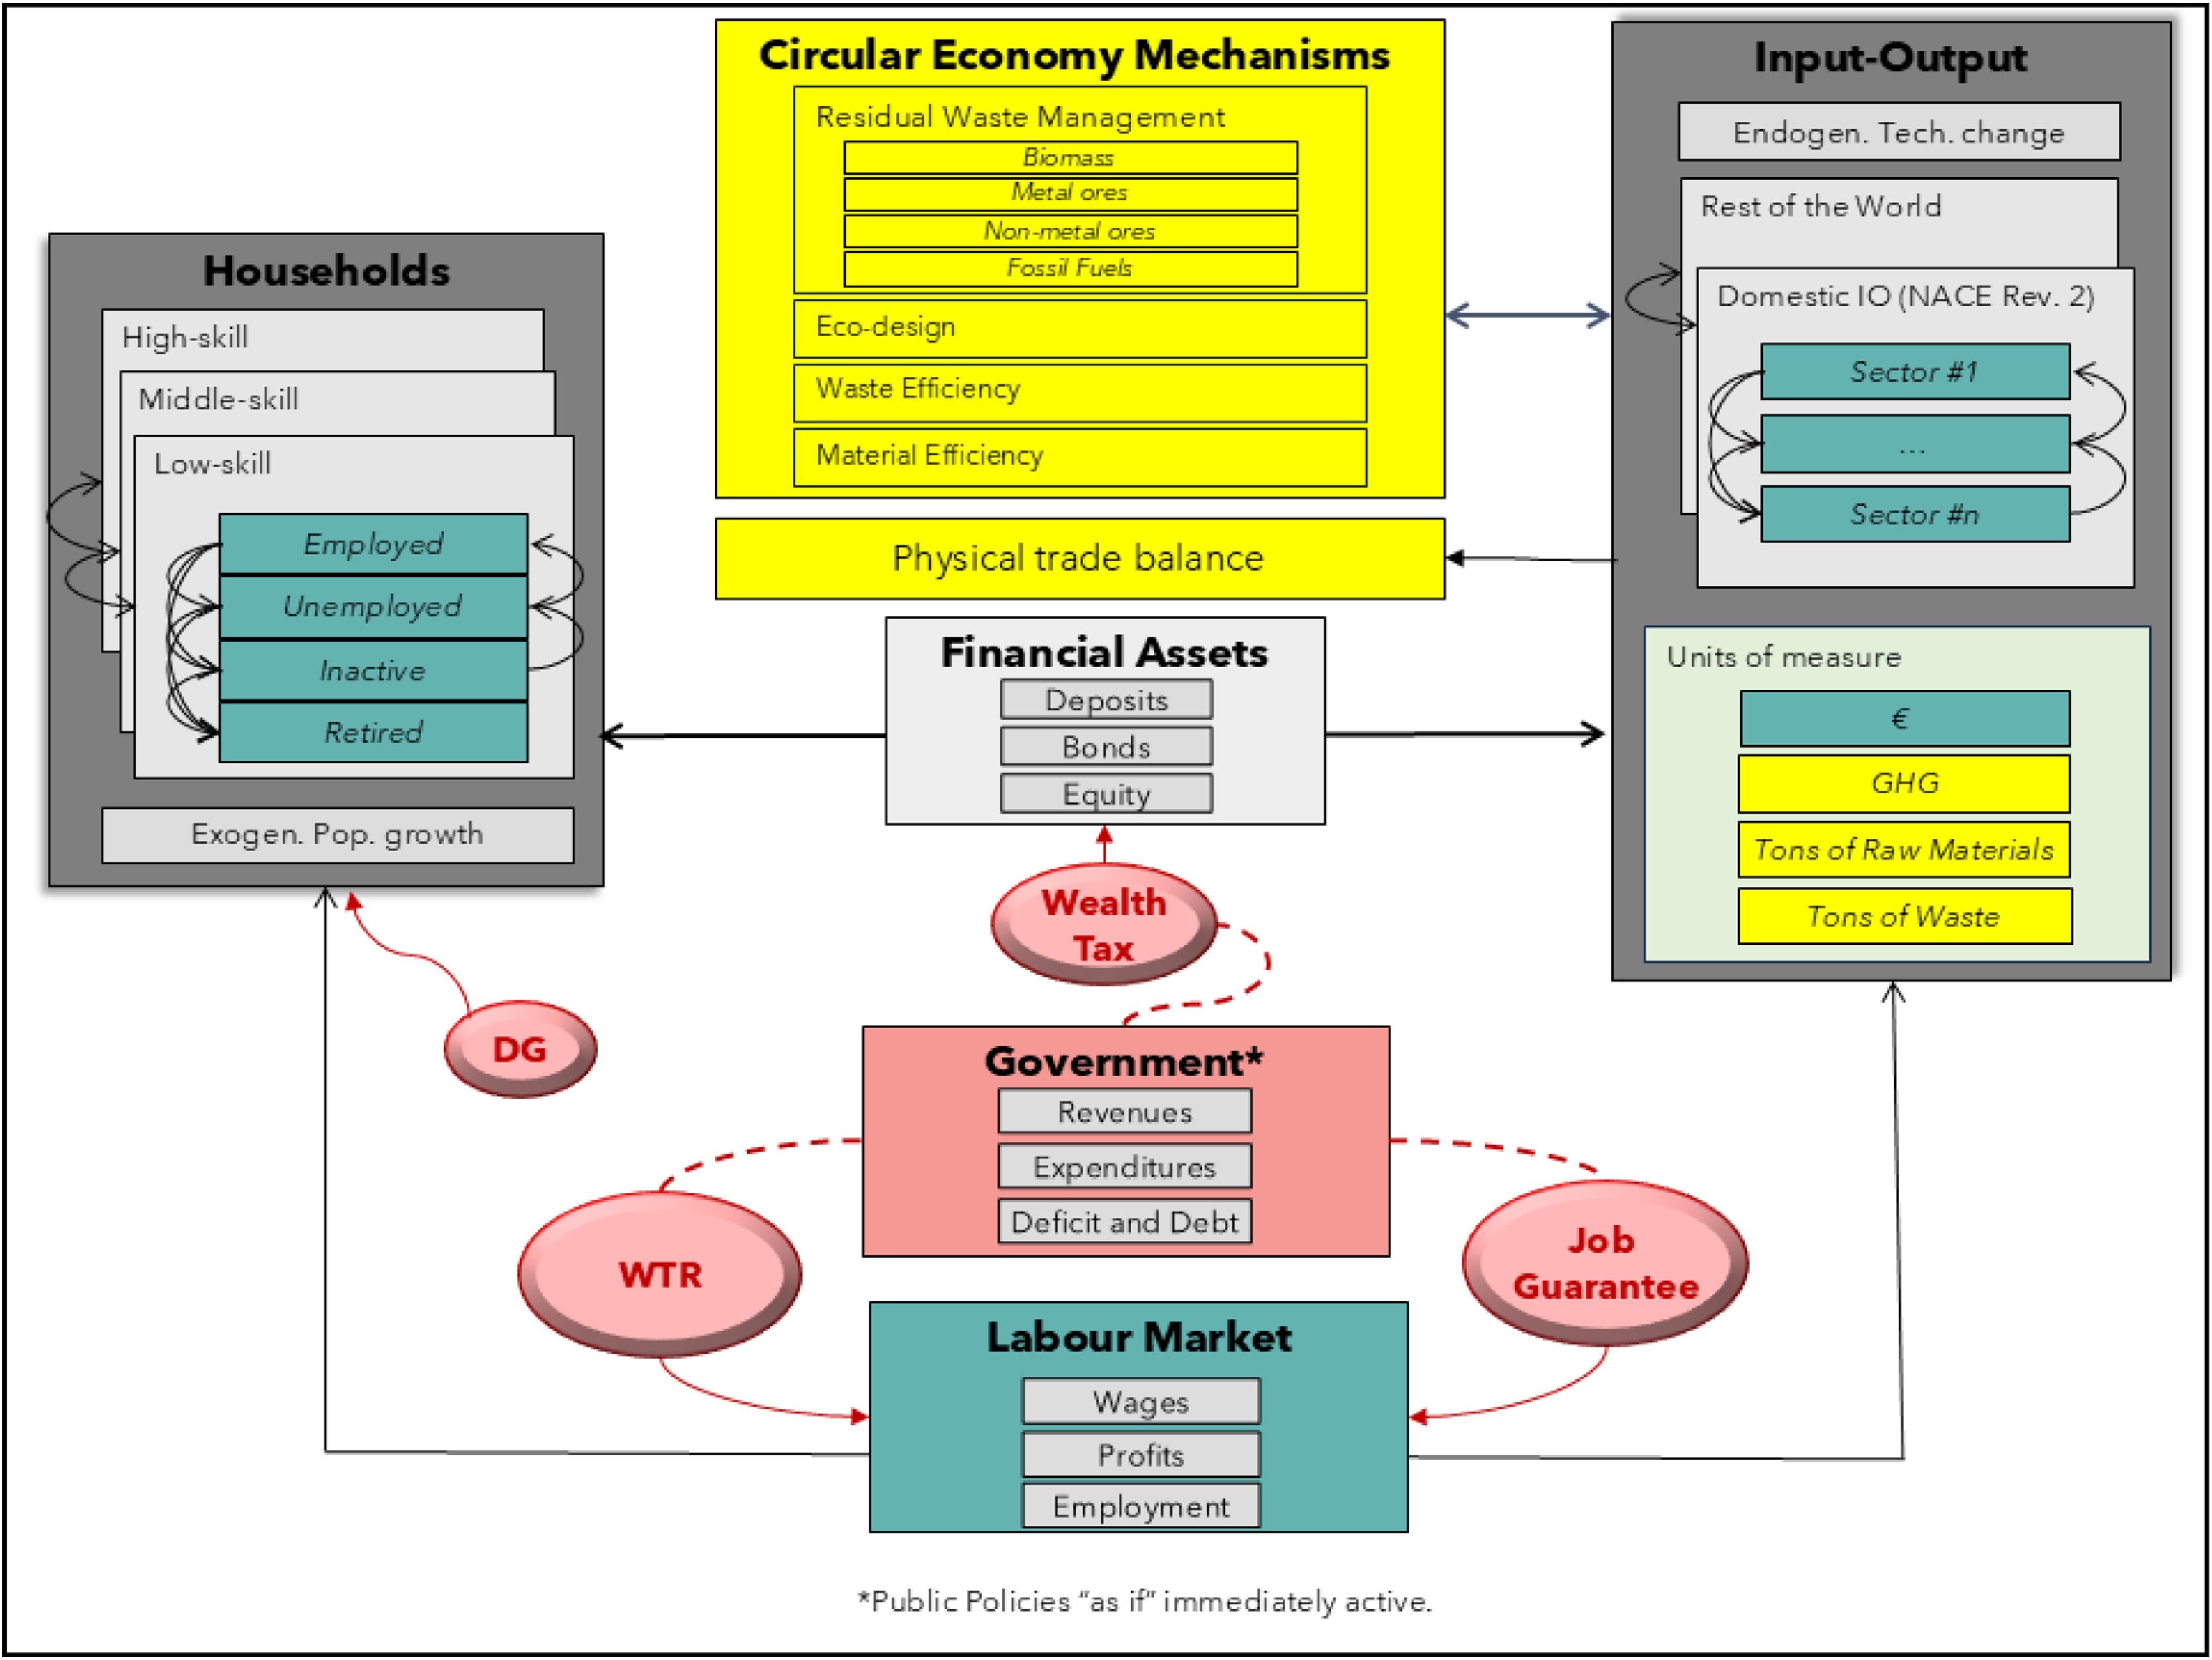
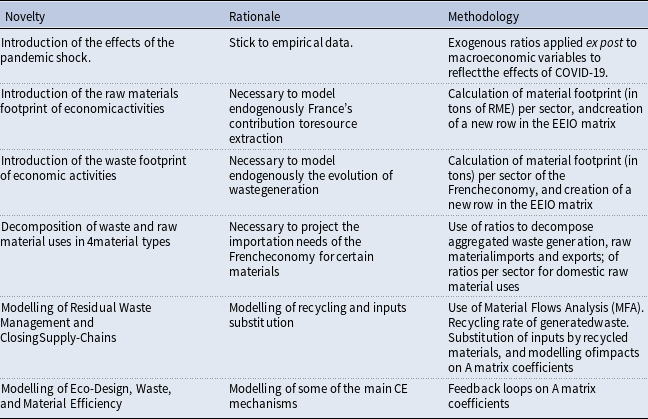
Figure 1 illustrates the extended structure of EUROGREEN used in this study, which incorporates three additional modules: raw materials, waste generation, and recycling. These extensions are described in detail in the subsections that follow and are summarised in Table A3.
Macroview of the model structure. This figure presents the main components and feedback mechanisms of the extended EUROGREEN model (new modules in yellow). The extended model includes France’s raw material footprint, measured as domestic material consumption, into four material categories: biomass, metal ores, non-metal ores, and fossil fuels. Each material type is linked to specific economic sectors (e.g., biomass to agriculture), enabling the assessment of extraction and recycling flows by category. France’s residual waste management system is driven by technological innovations, with improvements in material efficiency influencing both waste generation and the availability of secondary materials. The dynamic substitution of primary raw materials with recycled inputs generates structural adjustments within the economy, captured through time-varying technical coefficients in the EEIO tables. Red circles highlight modules or parameters driven by exogenous assumptions, notably those pertaining to technological change and policy interventions (detailed in Section 3).
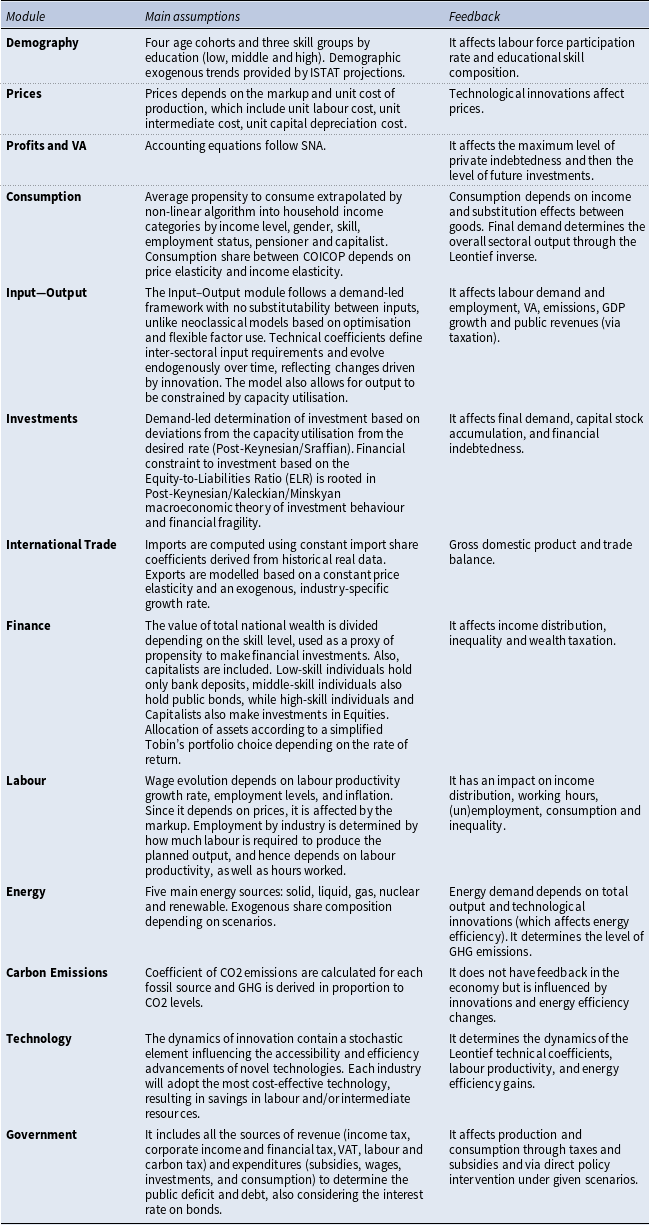
EUROGREEN is a demand-driven macroeconomic model built on the assumption of idle productive capacity. Investment decisions depend on the gap between actual and potential capacity utilisation, on the profit rate, the depreciation rate, and an autonomous investment component that does not expand productive capacity but stabilises the economy against Harrodian instability. The model links the financial and real sectors through a portfolio approach in which households are disaggregated into 13 socio-economic groups, defined by occupational status and skill level. They allocate their wealth across different financial assets. This formulation allows for a detailed evaluation of the distributional implications of public policies. Production is represented using Input—Output (IO) tables, disaggregated into ten sectors. Endogenous technical change is incorporated by allowing technical coefficients (the “A matrix”) to evolve over time. These coefficients quantify the share of inputs required from each sector to produce one unit of output and therefore encode both the production technology and the structural configuration of the economy. Through a system-dynamics approach, the model captures complex and potentially non-linear macroeconomic dynamics emerging from feedback loops. In line with recent macro-simulation studies of energy transition pathways (e.g., Nieto et al. Reference Nieto, Brockway, Sakai and Barrett2024; Di Felice et al. Reference Di Felice, Pérez-Sánchez, Manfroni and Giampietro2024), EUROGREEN endogenously generates key socio-economic variables. Targets for GDP growth, labour productivity, or other macroeconomic indicators are not imposed exogenously; instead, their trajectories emerge from the model’s internal feedback mechanisms and time-lagged structural responses. Table A2, in the Appendix, summarises the core assumptions and key feedback mechanisms linking all modules in the seminal EUROGREEN. The model is grounded on data collected from several databases (Eurostat, KLEMS, IEA, and WIOD) for France, facilitating the replication and calibration of the model to accurately reflect real-world dynamics. Data sources and main parameter settings are described in the Appendix.
In this context, the inclusion of raw material flows, waste generation, and recycling builds on the theoretical foundations of ecological macroeconomics, where the economy is modelled as an open subsystem of the biosphere with material throughput constraints; embedding these processes endogenously enables a systemic evaluation of CE pathways.
2.2 Raw Materials
We apply Material Flow Analysis to model the consumption-based material footprint of the French economy, commonly referred to as Domestic Material Consumption (DMC). Data are taken from EUROSTATFootnote
3
for estimating the material footprint of different economic activities. DMC is calculated using the following formula, with the material footprint of domestically produced output ( $M^d$
), imports (
$M^d$
), imports ( $M^i$
), and exports (
$M^i$
), and exports ( $M^e$
) measured in tons of raw material equivalents:
$M^e$
) measured in tons of raw material equivalents:
 \begin{equation} DMC = M^d + M^i - M^e \end{equation}
Since EUROSTAT does not provide disaggregated data by economic sector, we estimated the raw material intensity coefficient ( $\gamma _s^j$
, in tonnes/
$\gamma _s^j$
, in tonnes/ $\unicode{x20AC}$
) using data from the GLORIA database (Lenzen et al. Reference Lenzen, Geschke, West, Fry, Malik, Giljum, Milà i Canals, Piñero, Lutter, Wiedmann, Li, Sevenster, Potočnik, Teixeira, Van Voore, Nansai and Schandl2022), as reported in Table A6 in Appendix A. This coefficient represents the ratio of the total domestic extraction of raw materials (
$\unicode{x20AC}$
) using data from the GLORIA database (Lenzen et al. Reference Lenzen, Geschke, West, Fry, Malik, Giljum, Milà i Canals, Piñero, Lutter, Wiedmann, Li, Sevenster, Potočnik, Teixeira, Van Voore, Nansai and Schandl2022), as reported in Table A6 in Appendix A. This coefficient represents the ratio of the total domestic extraction of raw materials ( $M^d_j$
), for each category
$M^d_j$
), for each category $j$
, to the total monetary output of the sector
$j$
, to the total monetary output of the sector $s$
(
$s$
( $x_s$
). This can be expressed as:
$x_s$
). This can be expressed as:
 \begin{equation} \gamma _s^j = \frac {M^d_{s,j}}{x_s}, \end{equation}
where $j$
includes four categories: biomass, fossil fuels, metal ores, and non-metal ores. To ensure consistency in the units of measurement, monetary values are expressed in real terms, meaning the output is adjusted for inflation.
$j$
includes four categories: biomass, fossil fuels, metal ores, and non-metal ores. To ensure consistency in the units of measurement, monetary values are expressed in real terms, meaning the output is adjusted for inflation.
These ratios are incorporated into EUROGREEN. In the absence of specific policy scenarios that could affect them (which will be described in the following sections), they are assumed to remain constant in the baseline scenario, based on historical averages. This assumption is supported by empirical observations showing that despite some fluctuations, these ratios tend to be very stable over time, as evidenced by the very low standard deviations presented in Table A6 in Appendix A.
To calculate the footprint and the physical trade balance (expressed as $M^i \hbox{-}\hbox{-} M^e$
), we need to determine the intensity coefficients related to monetary imports and exports, expressed in real terms. In this case, since a single sector is responsible for the near-total extraction of each raw material category (as shown in Table A5), we calculated these coefficients at the national level. Hence,
$M^i \hbox{-}\hbox{-} M^e$
), we need to determine the intensity coefficients related to monetary imports and exports, expressed in real terms. In this case, since a single sector is responsible for the near-total extraction of each raw material category (as shown in Table A5), we calculated these coefficients at the national level. Hence,
 \begin{align} \gamma _e^j & = \frac {M^e_j}{x_e}, \end{align}
 \begin{align} \gamma _i^j & = \frac {M^i_j}{x_i}, \end{align}
where $x_i$
and
$x_i$
and $x_e$
stand for total national imports and exports, respectively.
$x_e$
stand for total national imports and exports, respectively.
Monetary imports and exports fluctuate according to the endogenous dynamics of the economy. In EUROGREEN, imports are calculated as a fraction of domestic intermediate and final demand, both of which are subject to endogenous variations, while exports are tied to GDP growth. Consequently, under different scenarios, the physical value of trade may vary despite constant intensity coefficients. Each year, the model endogenously computes the domestic material consumption of the French economy, disaggregated by material type. The physical trade balance is then derived by subtracting the raw materials embedded in imports from that of exports.
The concept of dematerialisation is central to the mainstream narrative on CE. Material efficiency, in particular, is considered a cornerstone of green growth strategies. It is considered to serve as a critical pathway for decoupling GDP growth from environmental degradation (Del Rey and Lopez-Garcia, Reference Del Rey and Lopez-Garcia2017). We propose two different hypotheses regarding external technological advancements that reduce the raw material content embedded in final products. Under the cases “ $\Delta _\gamma ^{10}$
” and “
$\Delta _\gamma ^{10}$
” and “ $\Delta _\gamma ^{20}$
,” we assume a gradual and linear reduction in the intensity coefficient (
$\Delta _\gamma ^{20}$
,” we assume a gradual and linear reduction in the intensity coefficient ( $\gamma$
) between 2024 and 2050, achieving total reductions of 10% and 20% by the end of the period, respectively. The first case constitutes an optimistic presupposition, considering that historical data has demonstrated a fluctuating pattern with no clear trends. Conversely, the latter scenario presupposes a rate of efficiency enhancement that is twice as rapid as this optimistic assumption. It enables us to evaluate the practical outcomes of very optimistic material efficiency assumptions.
$\gamma$
) between 2024 and 2050, achieving total reductions of 10% and 20% by the end of the period, respectively. The first case constitutes an optimistic presupposition, considering that historical data has demonstrated a fluctuating pattern with no clear trends. Conversely, the latter scenario presupposes a rate of efficiency enhancement that is twice as rapid as this optimistic assumption. It enables us to evaluate the practical outcomes of very optimistic material efficiency assumptions.
2.3 Waste management
We first added waste generation ( $W$
) to EUROGREEN’s EEIO tables. We compiled and harmonised Eurostat data on physical waste generation by sector (
$W$
) to EUROGREEN’s EEIO tables. We compiled and harmonised Eurostat data on physical waste generation by sector ( $W_s$
) to align with EUROGREEN’s classification (from Table A4). We also introduced a coefficient (
$W_s$
) to align with EUROGREEN’s classification (from Table A4). We also introduced a coefficient ( $\omega _h$
) representing the municipal waste (
$\omega _h$
) representing the municipal waste ( $W_h$
) linked to household consumption, which contributes to a small fraction (less than 10%) of French waste generation. This allowed us to create a new vector of waste-to-output coefficients for industries and household consumption, effectively adding a row to EUROGREEN’s EEIO matrix (see Table A7 in the Appendix). This vector allows for an endogenous calculation of annual waste generation in France. Namely,
$W_h$
) linked to household consumption, which contributes to a small fraction (less than 10%) of French waste generation. This allowed us to create a new vector of waste-to-output coefficients for industries and household consumption, effectively adding a row to EUROGREEN’s EEIO matrix (see Table A7 in the Appendix). This vector allows for an endogenous calculation of annual waste generation in France. Namely,
 \begin{align} W_s &= \omega _s \cdot x_s, \end{align}
 \begin{align} W_h &= \omega _h \cdot f, \end{align}
 \begin{align} W &= \sum _s W_s + W_h. \end{align}
where $\omega _s$
is the waste intensity coefficient,
$\omega _s$
is the waste intensity coefficient, $W$
is the total amount of waste at the national level, and
$W$
is the total amount of waste at the national level, and $f$
is the final demand. As per raw material extraction, the intensity coefficients (
$f$
is the final demand. As per raw material extraction, the intensity coefficients ( $\omega$
) are assumed to remain constant in the baseline scenario, as historical data indicates no significant change over time. However, for consistency reasons, we assume that waste generation follows the same reduction trajectory as raw material extraction under the “
$\omega$
) are assumed to remain constant in the baseline scenario, as historical data indicates no significant change over time. However, for consistency reasons, we assume that waste generation follows the same reduction trajectory as raw material extraction under the “ $\Delta _\gamma ^{10}$
” and “
$\Delta _\gamma ^{10}$
” and “ $\Delta _\gamma ^{20}$
” cases.
$\Delta _\gamma ^{20}$
” cases.
This assumption reflects the idea that, if fewer amounts of raw materials were embedded in the output, a corresponding reduction in waste generation would occur. It is important to note, however, that we do not account for any specific waste management plans or changes in product lifespan. In particular, product lifetime extension would affect the durability of goods and the composition of the final demand. However, as the level of sectoral aggregation in EUROGREEN limits the precise evaluation of these effects, such considerations fall beyond the scope of this paper.
In a second step, we calculated waste treatment ( $W^\ast$
) — with
$W^\ast$
) — with $W^\ast = k_w \cdot W$
, and
$W^\ast = k_w \cdot W$
, and $k_w$
constant based on historical data (see Table A7 in the Appendix) — by compiling data by waste category, hazardousness, and waste management operation from Eurostat. It enables us to calculate the recycling rate (
$k_w$
constant based on historical data (see Table A7 in the Appendix) — by compiling data by waste category, hazardousness, and waste management operation from Eurostat. It enables us to calculate the recycling rate ( $\rho$
) in France, which remains stable and is assumed to stay constant in the baseline. The volume of recycled waste (
$\rho$
) in France, which remains stable and is assumed to stay constant in the baseline. The volume of recycled waste ( $W_\rho$
) refers to the amount of "Materials recovery," excluding backfilling. Namely,
$W_\rho$
) refers to the amount of "Materials recovery," excluding backfilling. Namely,
 \begin{equation} \rho = \frac {W_\rho }{W^\ast }. \end{equation}
Acknowledging that the categorisation of waste generation and treatment differs from that of raw materials, we estimated the portion of $W_\rho$
attributable to the four raw material types
$W_\rho$
attributable to the four raw material types $j$
. This was done by applying the CMU or
$j$
. This was done by applying the CMU or $\phi$
, with
$\phi$
, with $0 \leq \phi \leq 1$
, which is available only at the EU level.Footnote
4
This estimation of the Domestic recovered materials (
$0 \leq \phi \leq 1$
, which is available only at the EU level.Footnote
4
This estimation of the Domestic recovered materials ( $R$
) is based on the Circular Material Use (
$R$
) is based on the Circular Material Use ( $1phi$
) general formula, omitting the specification per material category
$1phi$
) general formula, omitting the specification per material category $j$
for simplicity, as
$j$
for simplicity, as
 \begin{align} \phi & = \frac {R - W_i + W_e}{DMC + R - W_i + W_e},\,\, then \end{align}
 \begin{align} R & = \frac {(1 - \phi )(W_i - W_e) - \phi \cdot DMC}{(1 - \phi )}. \end{align}
Note that EUROSTAT provides data by material category at an aggregated scale for the domestic production, exports, and imports of waste, $W_e$
and
$W_e$
and $W_i$
respectively. Hence, we recover the recovered materials, by raw material category (
$W_i$
respectively. Hence, we recover the recovered materials, by raw material category ( $R_j$
), indirectly, and we use it to calculate the shares of recycled waste to be imputed to each raw material category asFootnote
5
$R_j$
), indirectly, and we use it to calculate the shares of recycled waste to be imputed to each raw material category asFootnote
5
 \begin{align} \rho _j &= \frac {R_j}{W_\rho }, \end{align}
 \begin{align} \sum _j \rho _j &= 1. \end{align}
This step is essential for calculating the quantity of secondary materials that, within a CCE framework, ought to replace primary raw materials, subsequently affecting resource extraction.
2.4 Closing Supply Chains (CSC)
Closing Supply Chain (CSC) is often described as a key mechanism of the CE framework, as it aims to maximise the reuse of waste in the form of new inputs in the production process. Replacing new inputs with secondary materials can limit raw material extraction and reduce the environmental pressures inherently tied to economic activities (Beylot et al. Reference Beylot, Vaxelaire and Villeneuve2016; Merciai and Schmidt, Reference Merciai and Schmidt2018; Wiebe et al. Reference Wiebe, Harsdorff, Montt, Simas and Wood2019), including GHG emissions, loss of biodiversity, and changes in land-use(Nakamura, Reference Nakamura2023; Donati et al. Reference Donati, Aguilar-Hernandez, Sigüenza-Sánchez, de Koning, Rodrigues and Tukker2020; Aguilar-Hernandez et al. Reference Aguilar-Hernandez, Sigüenza-Sanchez, Donati, Rodrigues and Tukker2018).
The Circular Material Use (CMU) rate is an indicator representing the quantity of recycled materials ( $R$
) used relative to the total material use in the economy(
$R$
) used relative to the total material use in the economy( $\overline {M} = DMC + R$
). We can derive from it the amount of newly extracted raw materials and secondary materials processed in the economy. To represent the substitution effect between primary and secondary recycled materials, we have adjusted the technical coefficients of extractive sectors accordingly (Wiebe et al. Reference Wiebe, Harsdorff, Montt, Simas and Wood2019). Considering that the technical coefficient (
$\overline {M} = DMC + R$
). We can derive from it the amount of newly extracted raw materials and secondary materials processed in the economy. To represent the substitution effect between primary and secondary recycled materials, we have adjusted the technical coefficients of extractive sectors accordingly (Wiebe et al. Reference Wiebe, Harsdorff, Montt, Simas and Wood2019). Considering that the technical coefficient ( $a_{n,s}$
) represents the proportion of intermediate goods, expressed in monetary terms (
$a_{n,s}$
) represents the proportion of intermediate goods, expressed in monetary terms ( $Z_{n,s}$
), that a given sector
$Z_{n,s}$
), that a given sector $s$
is buying from another sector
$s$
is buying from another sector $n$
to produce its own output — i.e.
$n$
to produce its own output — i.e. $a_{n,s} = Z_{n,s} / x_s$
— then if the proportion of secondary raw materials increases, each sector will demand less primary materials from the extracting sectors. To endogenise this mechanism, we assume that the technical coefficients of the extractive sectors are updated annually based on the proportion of primary raw materials to total material use (
$a_{n,s} = Z_{n,s} / x_s$
— then if the proportion of secondary raw materials increases, each sector will demand less primary materials from the extracting sectors. To endogenise this mechanism, we assume that the technical coefficients of the extractive sectors are updated annually based on the proportion of primary raw materials to total material use ( $\psi = 1 - \phi$
) relative to the initial period (
$\psi = 1 - \phi$
) relative to the initial period ( $\psi _0 = DMC_0/M_0$
). Namely
$\psi _0 = DMC_0/M_0$
). Namely
 \begin{equation} a_{n,s}^j(t+1) = a_{n,s}^j(t) \frac {\psi ^j(t)}{\psi _0^j}. \end{equation}
At the beginning of the period, the economy requires a given quantity of primary raw materials ( $\psi _0$
) to satisfy its production needs, from which a corresponding flow of waste is generated. A fraction of this waste stream is subjected to treatment and recycling processes, yielding secondary (recycled) materials. In the subsequent period, the extraction of primary raw materials declines, as part of the material demand is now met by these recycled inputs. In the following period, the total quantity of waste generated diminishes, and consequently, the volume of recyclable material also decreases. Under a steady-state economic regime, this dynamic of material substitution between primary and secondary resources is expected to give rise to an oscillatory pattern over time. By contrast, in a context of sustained economic growth, the overall demand for raw materials may increase even in the presence of rising recycling rates. It is noteworthy that alterations in technical coefficients, as represented by the A matrix within the Leontief framework, vary according to material type
$\psi _0$
) to satisfy its production needs, from which a corresponding flow of waste is generated. A fraction of this waste stream is subjected to treatment and recycling processes, yielding secondary (recycled) materials. In the subsequent period, the extraction of primary raw materials declines, as part of the material demand is now met by these recycled inputs. In the following period, the total quantity of waste generated diminishes, and consequently, the volume of recyclable material also decreases. Under a steady-state economic regime, this dynamic of material substitution between primary and secondary resources is expected to give rise to an oscillatory pattern over time. By contrast, in a context of sustained economic growth, the overall demand for raw materials may increase even in the presence of rising recycling rates. It is noteworthy that alterations in technical coefficients, as represented by the A matrix within the Leontief framework, vary according to material type $j$
. For simplicity, we assume that changes in the technical coefficients affect only one sector for each type of raw material. This assumption is strongly supported by data presented in Table A5 in Appendix A.
$j$
. For simplicity, we assume that changes in the technical coefficients affect only one sector for each type of raw material. This assumption is strongly supported by data presented in Table A5 in Appendix A.
On the other hand, an increase in the volume of recycled materials ( $R$
) over time necessitates more activities within the corresponding NACE sector, specifically "Water supply, sewerage, waste management and remediation activities" (
$R$
) over time necessitates more activities within the corresponding NACE sector, specifically "Water supply, sewerage, waste management and remediation activities" ( $s_\omega$
).Footnote
6
Demand for this sector increases along with changes in waste generation. Consequently,
$s_\omega$
).Footnote
6
Demand for this sector increases along with changes in waste generation. Consequently, $s_\omega$
experiences a rise in both demand and output to accommodate and process the greater volume of waste materials. To effectively capture the consequences of fluctuations in recycling, a recycling evolution coefficient is employed (
$s_\omega$
experiences a rise in both demand and output to accommodate and process the greater volume of waste materials. To effectively capture the consequences of fluctuations in recycling, a recycling evolution coefficient is employed ( $\zeta = \frac {R(t)}{R_0}$
). This coefficient dynamically connects recycling levels with the technical coefficients of the public sector (which includes waste treatment activities in EUROGREEN). It thereby influences the structure of the output and the final demand level within an Input—Output analytical context. Namely,
$\zeta = \frac {R(t)}{R_0}$
). This coefficient dynamically connects recycling levels with the technical coefficients of the public sector (which includes waste treatment activities in EUROGREEN). It thereby influences the structure of the output and the final demand level within an Input—Output analytical context. Namely,
 \begin{equation} a_{s_\omega , n}(t+1) = a_{s_\omega , n}(t) \cdot \zeta . \end{equation}
Closing supply chain scheme. This figure presents a simple depiction of the principal variables and linkages incorporated into the EUROGREEN model to encompass residual waste management and closing supply chains. For simplicity, the division by raw material categories is not depicted. The circular material use rate ( $\phi = 1 - \psi$
) influences the technical coefficients (A matrix), which in turn impact total production, subsequently affecting international trade and the physical trade balance. Additionally,
$\phi = 1 - \psi$
) influences the technical coefficients (A matrix), which in turn impact total production, subsequently affecting international trade and the physical trade balance. Additionally, $\gamma$
,
$\gamma$
, $\omega$
, and
$\omega$
, and $\rho$
influence extraction, waste treatment, and recycling, generating delayed feedback effects (arrow with double vertical lines) on the economy.
$\rho$
influence extraction, waste treatment, and recycling, generating delayed feedback effects (arrow with double vertical lines) on the economy.
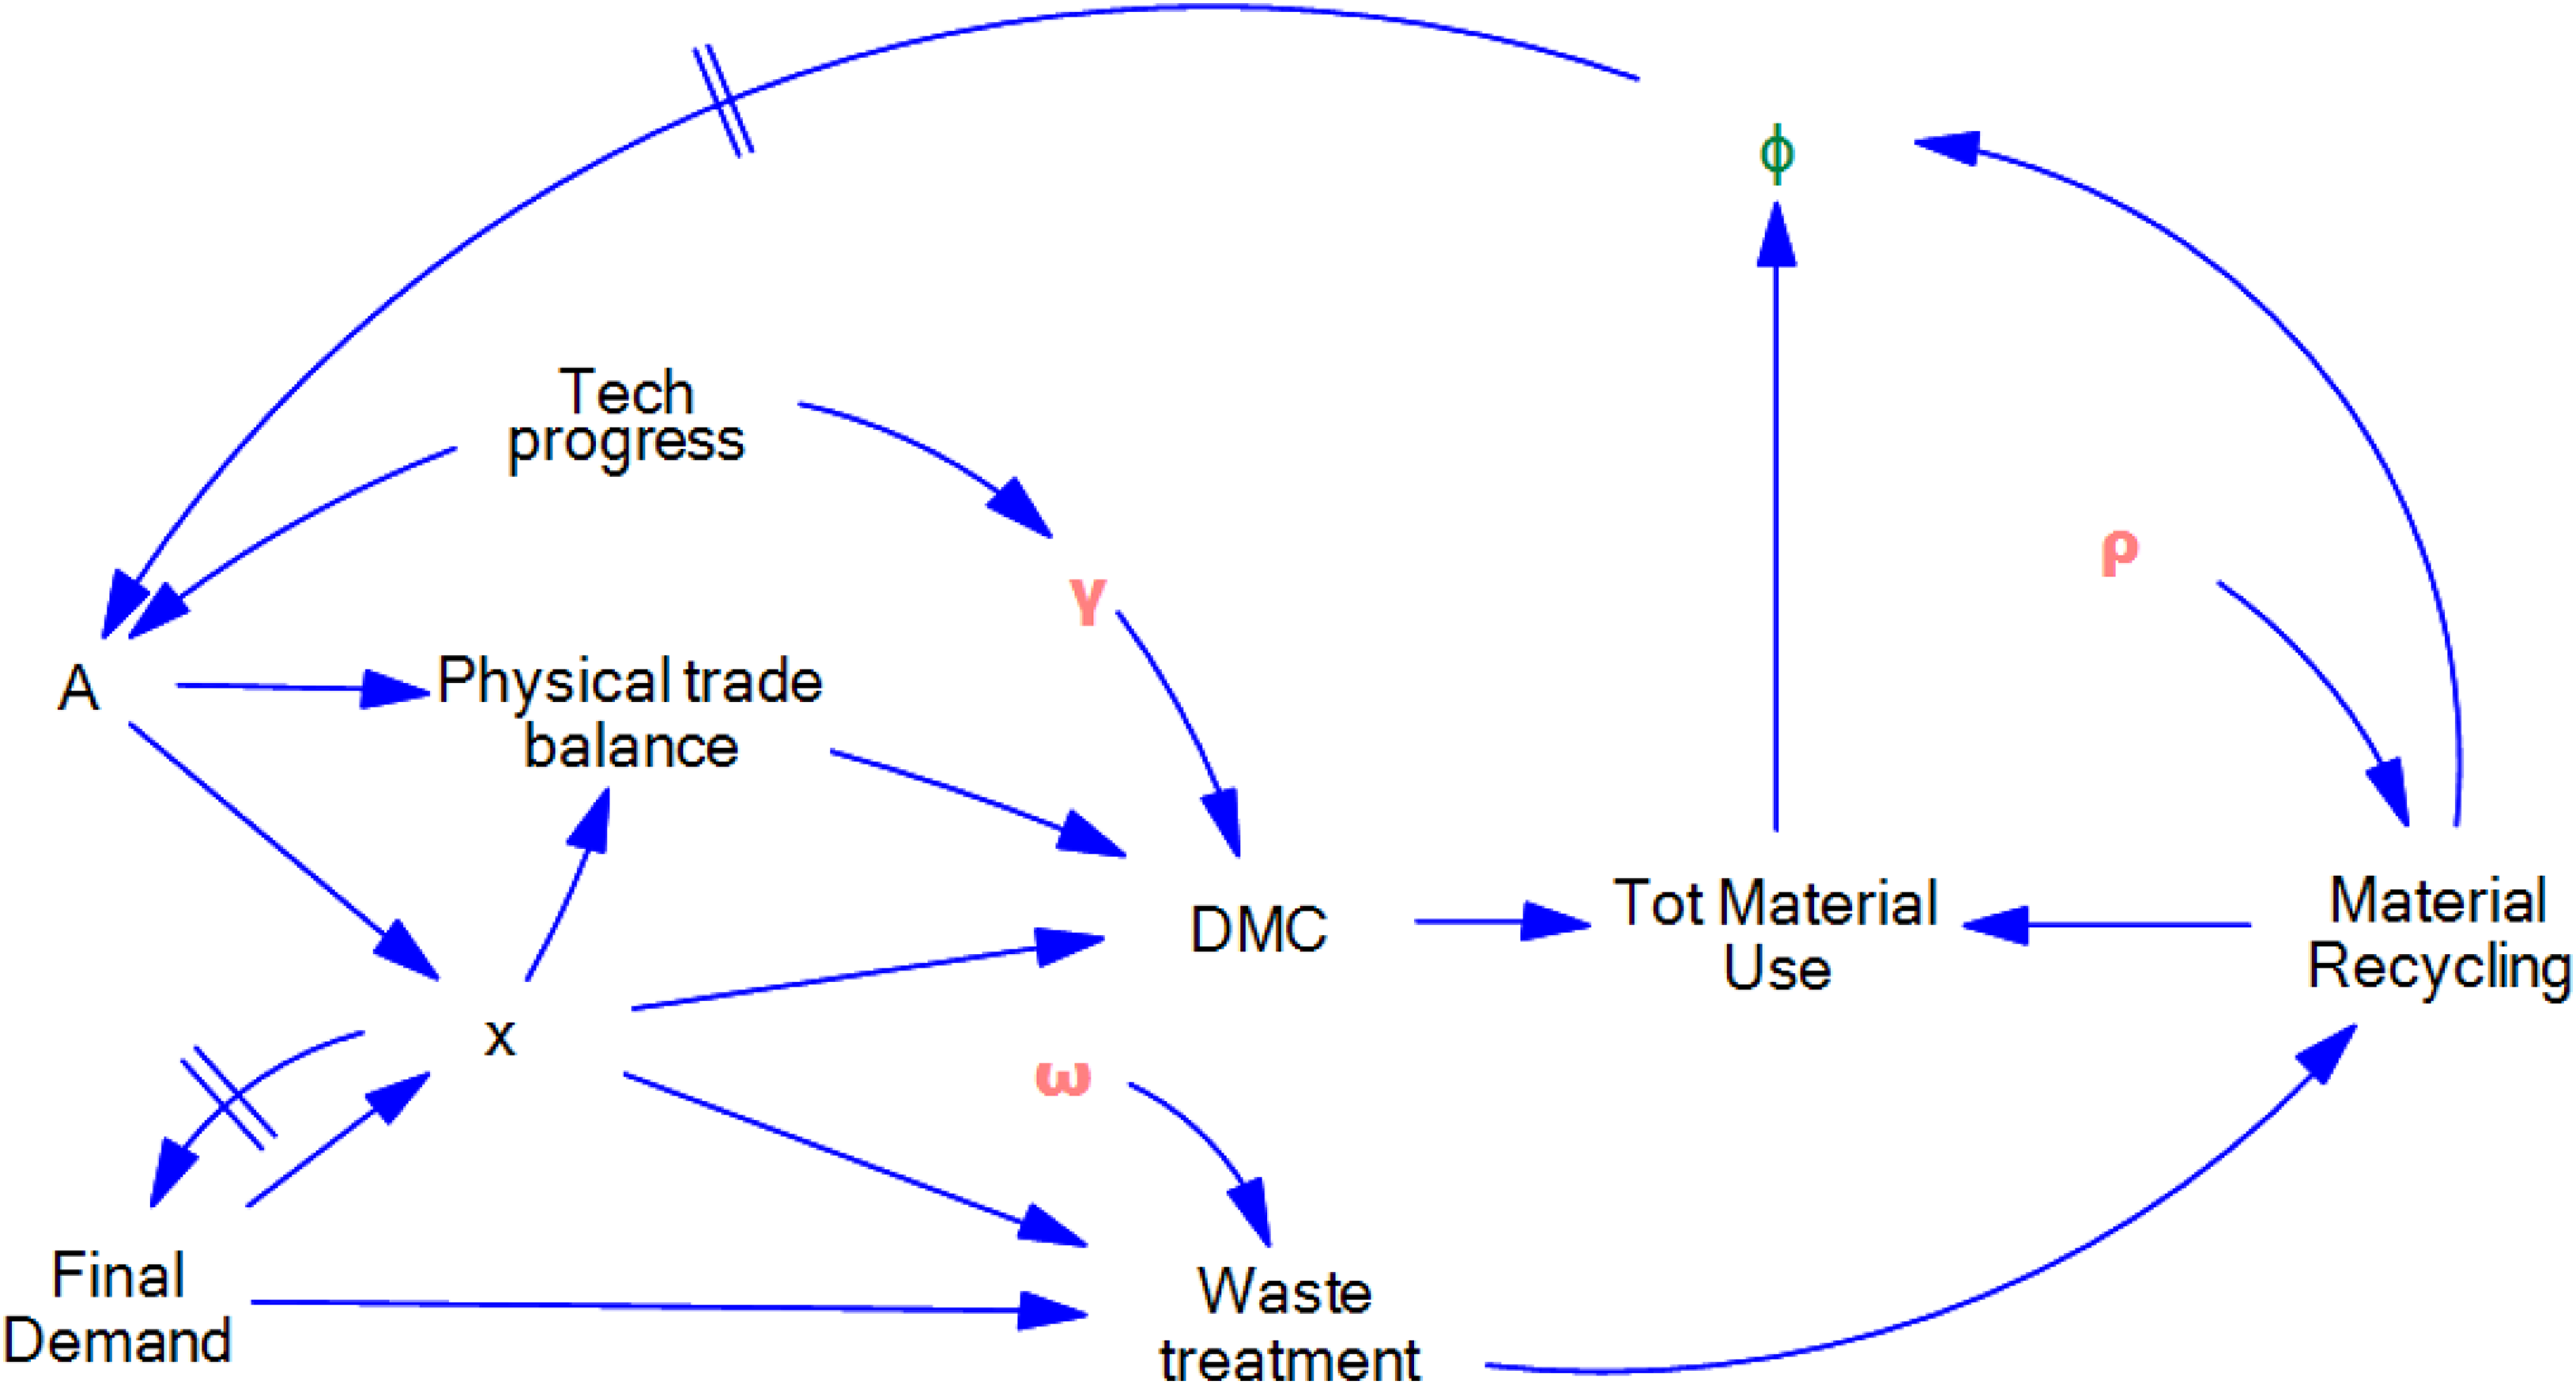
Figure 2 depicts the main variables, parameters, and relations described in the current Section. The structure of the economy is shaped by the A matrix and the final demand, which together determine the level of output of each sector. Lagged feedback effects on the demand through the labour market are included in the model. Raw material intensity coefficients ( $\gamma$
) (net of the impact of international trade) determine the volume of French Domestic Material Consumption. Waste intensity coefficients (
$\gamma$
) (net of the impact of international trade) determine the volume of French Domestic Material Consumption. Waste intensity coefficients ( $\omega$
) and the recycling rate (
$\omega$
) and the recycling rate ( $\rho$
) determine the volume of materials recycling. The Circular Material Use rate (
$\rho$
) determine the volume of materials recycling. The Circular Material Use rate ( $\phi$
) and its complementary variable, the rate of raw material use (
$\phi$
) and its complementary variable, the rate of raw material use ( $\psi$
), alter the demand for inputs (A). These, in turn, feed back into economic activities through adjustments in the technical coefficients that determine output levels in the following periods, ultimately spurring changes in raw material extraction. In summary, we represented the feedback loops that connect raw material use with economic activities.
$\psi$
), alter the demand for inputs (A). These, in turn, feed back into economic activities through adjustments in the technical coefficients that determine output levels in the following periods, ultimately spurring changes in raw material extraction. In summary, we represented the feedback loops that connect raw material use with economic activities.
Summary of the main assumptions for every scenario
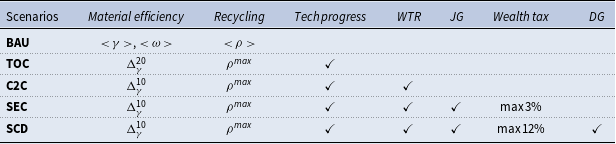
Note: $\gamma$
and
$\gamma$
and $\omega$
denote the efficiency of resource utilisation and waste minimisation, respectively.
$\omega$
denote the efficiency of resource utilisation and waste minimisation, respectively. $\Delta ^{10}_\gamma$
and
$\Delta ^{10}_\gamma$
and $\Delta ^{10}_\omega$
represent an external enhancement in material efficiency by 10% and 20% by the year 2050, while
$\Delta ^{10}_\omega$
represent an external enhancement in material efficiency by 10% and 20% by the year 2050, while $\lt \rho ^{max}\gt$
indicates the projected elevation of recycling rates to 95% by 2050. Technological advancement corresponds to improvements in energy efficiency and labour productivity, as detailed in the foundational work EUROGREEN. WTR, JG, and DG signify the reduction in working hours, the assurance of employment, and post-growth, respectively. The term Wealth tax refers to a Piketty-type tax imposed on financial wealth. The values of all the parameters, by sector, are reported in Appendix A5, A6 and A7.
$\lt \rho ^{max}\gt$
indicates the projected elevation of recycling rates to 95% by 2050. Technological advancement corresponds to improvements in energy efficiency and labour productivity, as detailed in the foundational work EUROGREEN. WTR, JG, and DG signify the reduction in working hours, the assurance of employment, and post-growth, respectively. The term Wealth tax refers to a Piketty-type tax imposed on financial wealth. The values of all the parameters, by sector, are reported in Appendix A5, A6 and A7.
3. Scenarios
A primary objective of this study is to compare, following the current literature, techno-optimistic solutions with alternative Green and Post-Growth policies (Lamperti et al. Reference Lamperti, Napoletano and Roventini2020; Kallis et al. Reference Kallis, Hickel, O’Neill, Jackson, Victor, Raworth, Schor, Steinberger and Ürge-Vorsatz2025), with the aim to evaluate the trade-offs between social, environmental, and economic outcomes in a CE framework. To this end, a “sequential scenario” strategy (Nieto et al. Reference Nieto, Carpintero, Lobejón and Miguel2020) is employed in formulating the narratives. Specifically, each successive scenario is presumed to encompass all preceding hypotheses in addition to introducing novel conditions. Using this method facilitates the isolation of impacts attributable to each distinct hypothesis and appraising their cumulative effects. The sole distinction, as described below, pertains to the speed of efficiency gain, which is maintained at a higher level in the absence of social policies. We delineate five scenarios, summarised in Table 1. Namely,
-
1. Business as Usual (BAU): In the Baseline scenario, the French economy is projected to continue along its historical trajectory, following trends determined by the current socio-economic structure. In this case, the main CE parameters are kept constant to their historical averages, as described in the Table A6 in Appendix A.
-
2. Techno-optimistic Circularity (TOC): In this scenario, we assume that considerable technological advancements have long-ranging effects on the waste-material nexus, with $\rho ^{max}$
(=95%) to increase recycling rates,Footnote
7
$\Delta ^{20}_\gamma$
to reduce the extraction and waste intensity coefficients (
$\gamma$
and
$\omega$
, respectively). We also include an eco-design policy to include the prohibition of single-use plastics. This policy affects the technical coefficients of the manufacturing sector in the same way described by Eq. (13), although the impact is correlated to the volume of manufacturing activities associated with plastics production.
$\rho ^{max}$
(=95%) to increase recycling rates,Footnote
7
$\Delta ^{20}_\gamma$
to reduce the extraction and waste intensity coefficients (
$\gamma$
and
$\omega$
, respectively). We also include an eco-design policy to include the prohibition of single-use plastics. This policy affects the technical coefficients of the manufacturing sector in the same way described by Eq. (13), although the impact is correlated to the volume of manufacturing activities associated with plastics production. -
3. Cradle to Cradle (C2C): This scenario includes a lower technological speed rate, namely
$\Delta ^{10}_\gamma$
, compensated by the inclusion of a Working Time Reduction (WTR) programme, which entails a reduction by 5 hours in the weekly working schedule, thereby decreasing France’s legal working hours from 35 to 30 hours by 2030. This policy is modelled to be subsidised by the Government, which provides financial support to balance the discrepancy in hourly wages, thereby preserving the purchasing power of workers. -
4. Socially Equitable (SEC): Building on the previous scenario, it adds a Job Guarantee (JG) programme creating up to 300,000 full-time public sector jobs annually, primarily within the services and environment-related sectors. This strategy aligns with the vision of a French Green New Deal. As indicated in D’Alessandro et al., (Reference D’Alessandro, Cieplinski, Distefano and Dittmer2020), the implementation of a JG would exert a significant impact on public finances. Consequently, we incorporate a Piketty-style tax on financial wealth (Piketty, Reference Piketty2014; Piketty et al. Reference Piketty, Saez and Zucman2023), targeting higher-income employees and the wealthiest 1% of the population. We gradually increase the minimum rate from 0.1% in 2024 to 3% by 2050.
-
5. Social equity Circularity and post-growth (SCD): The SCD scenario incorporates a post-growth case which reduces the average propensity to consume by 1.5% annually. This assumption is supported by the fact that greener preferences are determined by education and pollution, which may increase environmental consciousness (Constant and Davin, Reference Constant and Davin2019). Lower consumption could also be the result of state-led policies, including the prohibition of advertising for polluting products or the strategic reorientation of marketing principles and practices toward sustainability (Lloveras et al. Reference Lloveras, Marshall, Vandeventer and Pansera2022). A decrease in consumption produces two contrasting effects: firstly, a reduction in production and tax revenue, accompanied by a substantial increase in public deficit; secondly, an increase in financial savings. This second finding aligns with Piketty’s theory that reduced economic growth, let alone post-growth, makes the weight of capital and associated revenues rise in the economy, hence potentially increasing inequalities if appropriate corrective policies are not adopted. Consequently, we assume that the French government imposes a Piketty tax on these “extra” monetary savings, reaching a maximum of 12% by 2050.


3.1 Calibration
The present section describes how the EUROGREEN model was calibrated. It should be mentioned before further analysis that, as earlier versions of EUROGREEN recognised, “all models are wrong” (Cieplinski et al. Reference Cieplinski, D’Alessandro, Distefano and Guarnieri2021; Distefano and D’Alessandro, Reference Distefano and D’Alessandro2023; Sterman, Reference Sterman2002; Saltelli and Funtowicz, Reference Saltelli and Funtowicz2014). They can only provide a partial representation of reality. Some assumptions regarding exogenous trends, grounded on historical data, or external shocks must be made, including international trade, as the model only includes the rest of the world without considering bilateral trade; labour force, aligned with a skill-specific external trend informed by data reflecting shifts in educational attainment; employment contracts, based on the assumption that all labour is employed under full-time contracts; and COVID-19 shocks which have influenced the economy in 2020, causing a downturn in demand and investments as well as a sudden increase in public spending and associated levels of deficits.Footnote 8 Drawing upon publicly accessible data, this study models the French economic structure over the period from 2014 to 2021 to ensure coherence given the limited availability of data for some key macroeconomic variables. Employing the system dynamics software Vensim SDD,Footnote 9 we have calibrated the parameters of our model to approximate the most accurate representation of our socioeconomic system (details and figures about calibration and sensitivity analyses are reported in the Appendix and B.1). Nevertheless, the inherent complexity of reality precludes the possibility of an entirely endogenous and perfectly accurate model of the French economy. While there remains room for enhancement, the parameters employed are aligned as closely as possible with the typical functioning of French economic, social, and environmental systems.
Empirical data are showcased through a dotted line in each graph of the Results section. CE interventions for each of the counterfactual scenarios previously described in the Scenarios section are activated starting from 2024. We run all scenarios from 2014 to 2050. We plot the median and the 95% confidence interval out of 500 simulations to avoid arbitrary outcomes and to clean out stochastic effects associated with numerical simulations.Footnote 10
4. Results
For clarity, we present scenario outcomes in three separate subsections. We show separately the consequences of CE strategies with regard to their environmental (4.1), economic (4.2), and social (4.3) effects. The Business-As-Usual(BAU) scenario (outlined as a black line) is compared to past observable trends (represented as a dotted line), and counterfactual scenarios (plotted as coloured lines), as described in the Calibration section (3.1).
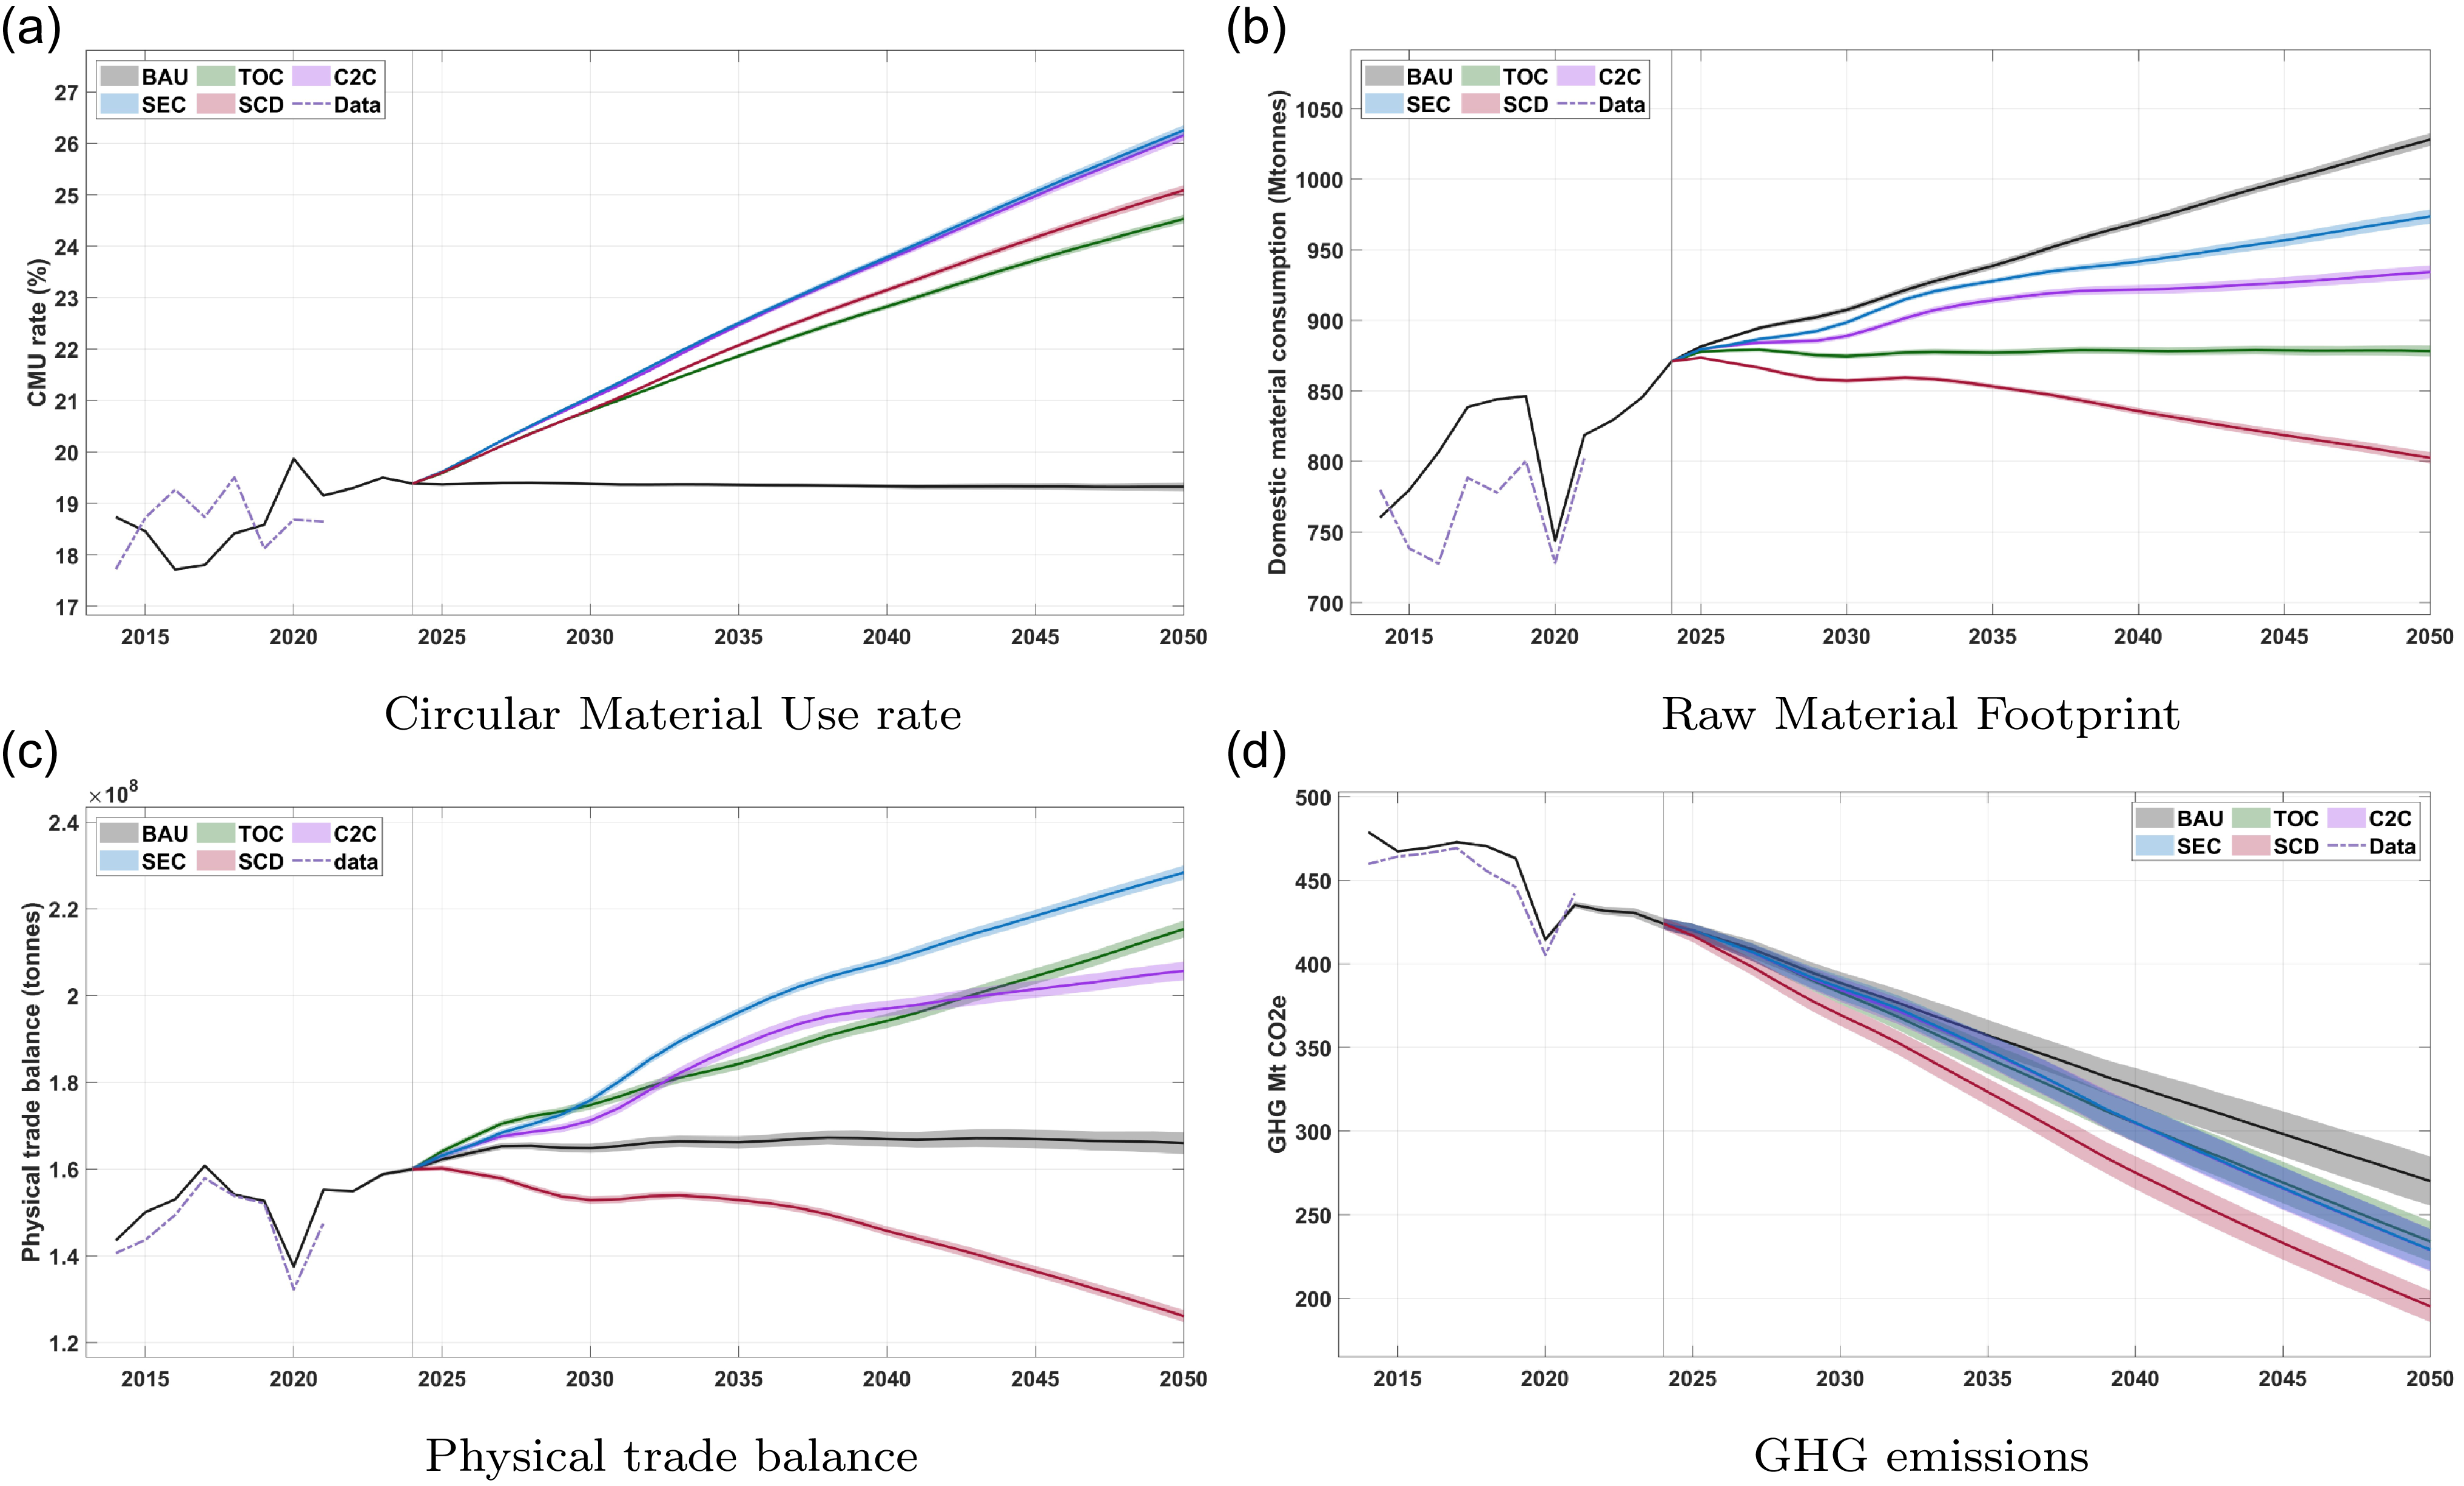
Scenario analysis of environmental indicators. Comparison of real data (violet) with the numerical outcomes — from 2014 to 2050 — under the baseline (black) and counterfactual scenarios: $TOC$
(green),
$TOC$
(green), $C2C$
(purple),
$C2C$
(purple), $SEC$
(blue), and
$SEC$
(blue), and $SCD$
(red). The vertical dotted line indicates the year 2024 when the policies are introduced. The solid lines and shaded areas around them indicate the medians and 95% confidence intervals, respectively, out of 500 independent simulations.
$SCD$
(red). The vertical dotted line indicates the year 2024 when the policies are introduced. The solid lines and shaded areas around them indicate the medians and 95% confidence intervals, respectively, out of 500 independent simulations.
4.1 Environmental impacts
Figure 3 illustrates the trends of key environmental and CCE indicators across scenarios. Panel 3a plots the evolutions in Circular Material Use (CMU) across scenarios. Defined as the share of recycled materials in the yearly supply of raw materials, the CMU rate is a key indicator of the performance of the CE framework. In all CE scenarios, the CMU rate increases by 2050 relative to 2024. The scenarios that include social policies in a Green New Deal paradigm (C2C and SEC) achieve relatively higher circularity rates than the post-growth and techno-optimistic scenarios (SCD and TOC). This is mainly caused by lower waste generation due to material efficiency measures and reduced output in the policy mixes. The CMU rate is shaped by both recycling ( $R$
) and total material use (
$R$
) and total material use ( $\overline {M}$
). Reduced CMU rate may, therefore, reflect lower material consumption rather than a decline in recycling rates. Differences become evident upon examining the trends in Circular Material Use across various material categories (refer to Figure B.1 in Appendix B). Notably, the SCD scenario is the sole scenario demonstrating efficacy in enhancing circularity for all four material types, including metal ore usage, which shows no improvement under alternative scenarios. Given the significance of this material in the EU policy agenda, a focus on absolute values provides a more robust framework for comprehending wider environmental impacts.
$\overline {M}$
). Reduced CMU rate may, therefore, reflect lower material consumption rather than a decline in recycling rates. Differences become evident upon examining the trends in Circular Material Use across various material categories (refer to Figure B.1 in Appendix B). Notably, the SCD scenario is the sole scenario demonstrating efficacy in enhancing circularity for all four material types, including metal ore usage, which shows no improvement under alternative scenarios. Given the significance of this material in the EU policy agenda, a focus on absolute values provides a more robust framework for comprehending wider environmental impacts.
Panel 3b depicts the trends in Domestic Material Consumption (DMC), where the BAU scenario generates an increase of approximately 20% relative to the year 2024. Conversely, the Techno-Optimistic (TOC) case maintains France’s raw material intake at existing levels by the year 2050. The post-growth (SCD) scenario appears to be the most effective in reducing France’s absolute material consumption. It achieves a reduction of 23% in France’s material footprint compared to the BAU scenario in 2050. It is also a unique case which sees an absolute decrease in the DMC compared to the 2024 levels. This dynamic is partially attributed to a reduction in import dependency within this scenario, as evidenced by the decrease in net material imports illustrated in Panel 3c.
Panel 3d illustrates GHG emissions associated with simulated scenarios. Enhanced recycling reduces the demand for extractive industries, leading to lower output and greenhouse gas (GHG) emissions in these sectors. Among the scenarios, the SCD scenario achieves the most substantial GHG emission reductions in France. This is because the overall decline in consumption outweighs the rebound effect triggered by social policies, which tend to increase private spending and, consequently, raw material use.
Overall, the environmental indicators show that a high rate of technological efficiency significantly contributes to stabilising the material footprint, reducing GHG emissions, and increasing capacity utilisation (CMU). However, only the post-growth scenario—characterised by reduced consumption and production — is able to achieve absolute reductions in both material use and GHG emissions, despite lower CMU levels and half of the efficiency gains assumed in TOC. This indicates that consumption reduction is essential to offset the rebound effects generated by socially oriented policies that stimulate private spending and resource use.
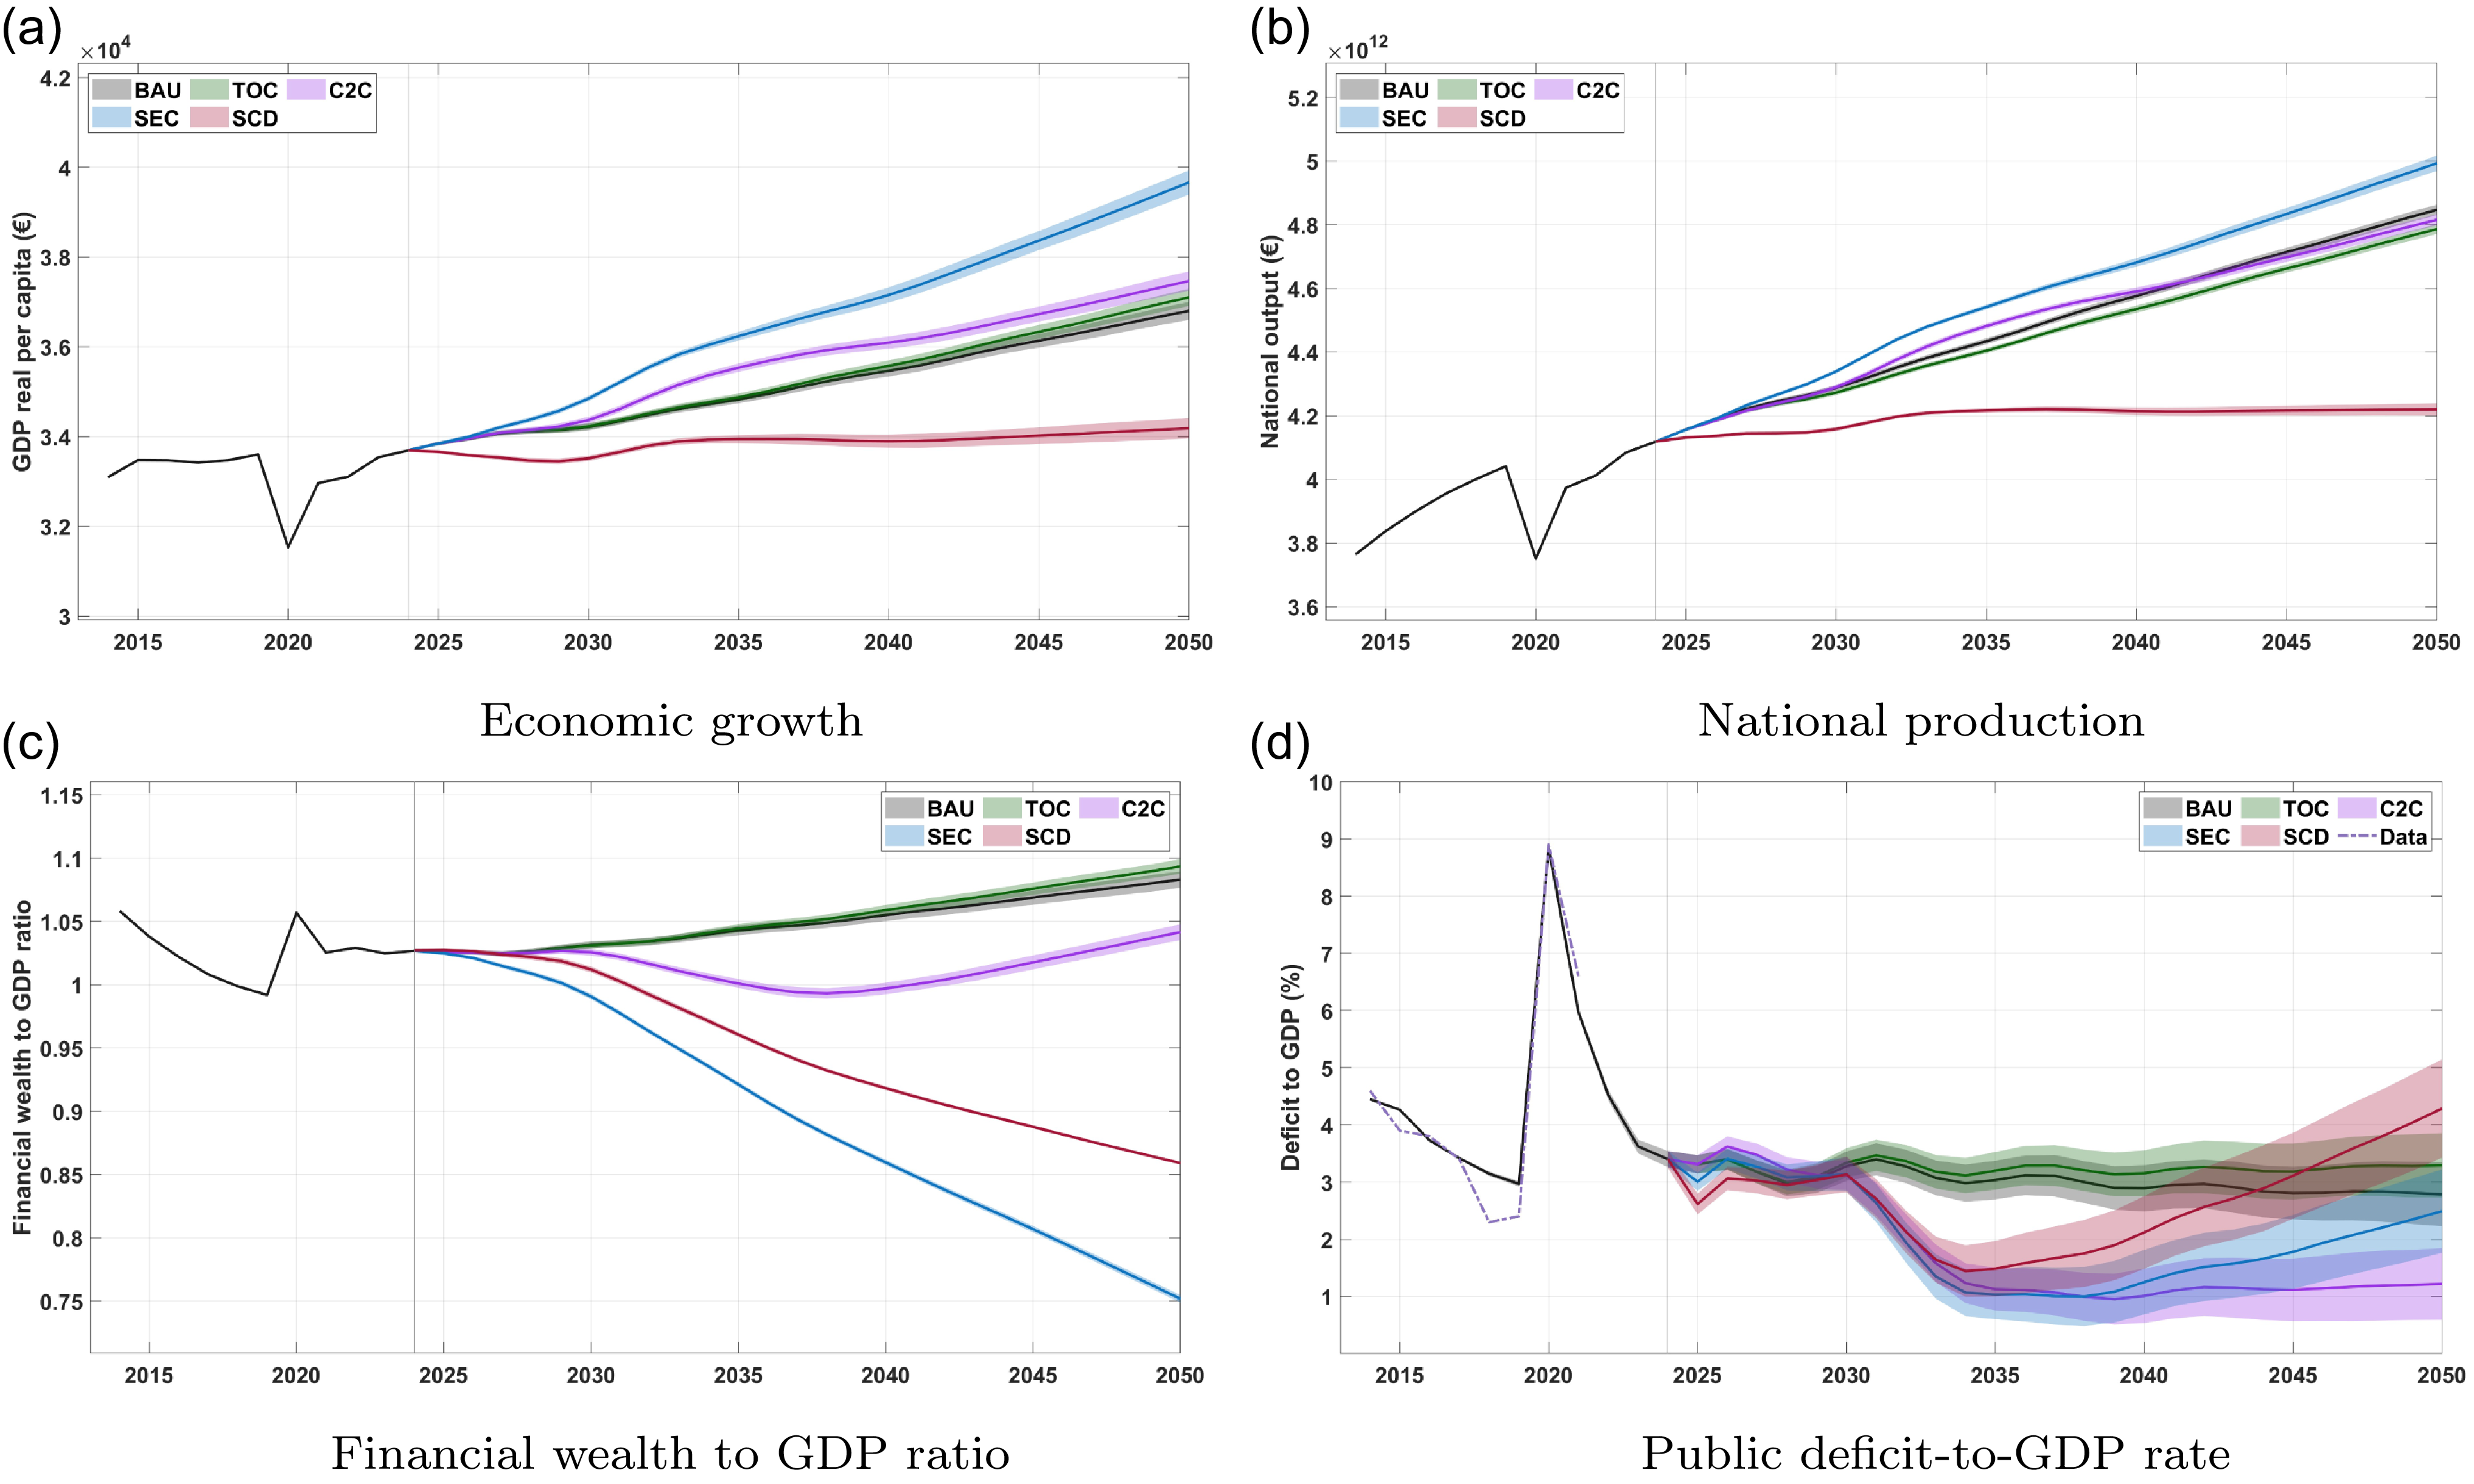
Scenario analysis of economic and fiscal indicators. Comparison of real data (violet) with the numerical outcomes — from 2014 to 2050 — under the baseline (black) and the other scenarios: $TOC$
(green),
$TOC$
(green), $C2C$
(purple),
$C2C$
(purple), $SEC$
(blue), and
$SEC$
(blue), and $SCD$
(red). The vertical dotted line indicates the year 2024 when the policies are introduced. The solid lines and shaded areas around them indicate the medians and 95% confidence intervals, respectively, out of 500 independent simulations.
$SCD$
(red). The vertical dotted line indicates the year 2024 when the policies are introduced. The solid lines and shaded areas around them indicate the medians and 95% confidence intervals, respectively, out of 500 independent simulations.
4.2 Economic performance
Figure 4 plots the evolution of the main macroeconomic aggregates. Under the TOC and C2C scenarios, the real GDP per capita (Panel 4a) closely follows the BAU, with an average increase of 0.5% per year (see Figure B.3 in Appendix B). In the C2C policy mix, the implementation of wage-compensated working-time reduction (WTR) creates mild economic growth, increasing income per capitaFootnote
11
by approximately 1,000 $\unicode{x20AC}$
in 2050. In the Socially Equitable Circularity (SEC) scenario, a JG programme boosts aggregate demand and output, leading to an estimated 15% increase in French GDP per capita compared to 2024. Under the post-growth (SCD) scenario, the French real GDP per capita stabilises around current levels. The effects of financial wealth taxation and consumption reduction seem to balance the increase in aggregate consumption linked with social equity measures, resulting in balanced outcomes in terms of GDP.
$\unicode{x20AC}$
in 2050. In the Socially Equitable Circularity (SEC) scenario, a JG programme boosts aggregate demand and output, leading to an estimated 15% increase in French GDP per capita compared to 2024. Under the post-growth (SCD) scenario, the French real GDP per capita stabilises around current levels. The effects of financial wealth taxation and consumption reduction seem to balance the increase in aggregate consumption linked with social equity measures, resulting in balanced outcomes in terms of GDP.
Panel 4b reports the evolution of the national output. This indicator does not equate to GDP, as it may be associated with varying added values. Notably, while SEC and SCD scenarios keep exhibiting the highest and lowest rates of national production, absolute differences differ.
Panel 4c plots the evolution in financial wealth stocks, measured by a financial wealth-to-GDP ratio. Under the baseline and TOC scenarios, financial wealth continues to accumulate, yet at a slow pace. The joint implementation of a JG and a wealth tax in the SEC scenarios leads to a reduction (by 25%) in financial wealth stocks in 2050. The post-growth scenario results in intermediate financial wealth levels. Higher financial wealth stocks than in the SEC scenario are attributable to reduced consumption habits in the post-growth scenario, which increase the average propensity to save. Additionally, as GDP decreases, the wealth-to-GDP ratio tends to rise, as shown by Piketty (Reference Piketty2014).
Finally, we consider the evolution in public deficits in the different scenarios (Panel 4d). As the BAU and TOC scenarios do not include changes in fiscal and social policy, they do not spark sizeable changes in public deficits by 2050. In the C2C scenario, WTR increases job participation, reduces welfare spending and whittles down public deficits, which are set to stabilise at 1% by 2050. The JG scheme included in the SEC policy mix drives up social disbursements, resulting in higher public deficits. In the post-growth scenario, reduced demand, production and tax revenue mechanically lead to higher deficits. State-funded social policies and reduced tax revenues from consumption also contribute to this outcome. Higher taxation on the wealthy partially offsets this spending, providing a promising pathway to funding a social and circular post-growth transition.
4.3 Social effects
Figure 5 shows the dynamics of key socioeconomic indicators, including (un-)employment, GINI coefficient, and labour share of added value distribution. Panel 5a illustrates the evolution of unemployment in France from 2014 to 2050. The Techno-Optimistic (TOC) scenario showcases the highest unemployment rate in our simulations, reaching 14% by 2050. In the C2C scenario, the implementation of WTR contributes to a decrease in unemployment through the redistribution of workload. Nevertheless, ongoing labour productivity improvements lead to an increase in unemployment in the long run, surpassing 11% by 2050. The introduction of a JG in the SEC scenario effectively mitigates the adverse effects of CE policies on employment, reducing the unemployment rate to 5% by 2050. The SCD scenario represents an intermediate outcome, with an unemployment rate of 7% by 2050, due to a contraction in economic activities that diminishes overall output and, subsequently, labour demand. These unemployment levels are attributed to a reduction in output and employment within the extractive industries, as a result of policies aimed at enhancing material efficiency. Furthermore, as demonstrated in the seminal EUROGREEN paper, job polarisation disproportionately affects middle-class workers more than other categories.
Scenario analysis of social indicators. Comparison of real data (violet) with the numerical outcomes — from 2014 to 2050 — under the baseline (black) and the other scenarios: $TOC$
(green),
$TOC$
(green), $C2C$
(purple),
$C2C$
(purple), $SEC$
(blue), and
$SEC$
(blue), and $SCD$
(red). The vertical dotted line indicates the year 2024 when the policies are introduced. The solid lines and shaded areas around them indicate the medians and 95% confidence intervals, respectively, out of 500 independent simulations.
$SCD$
(red). The vertical dotted line indicates the year 2024 when the policies are introduced. The solid lines and shaded areas around them indicate the medians and 95% confidence intervals, respectively, out of 500 independent simulations.
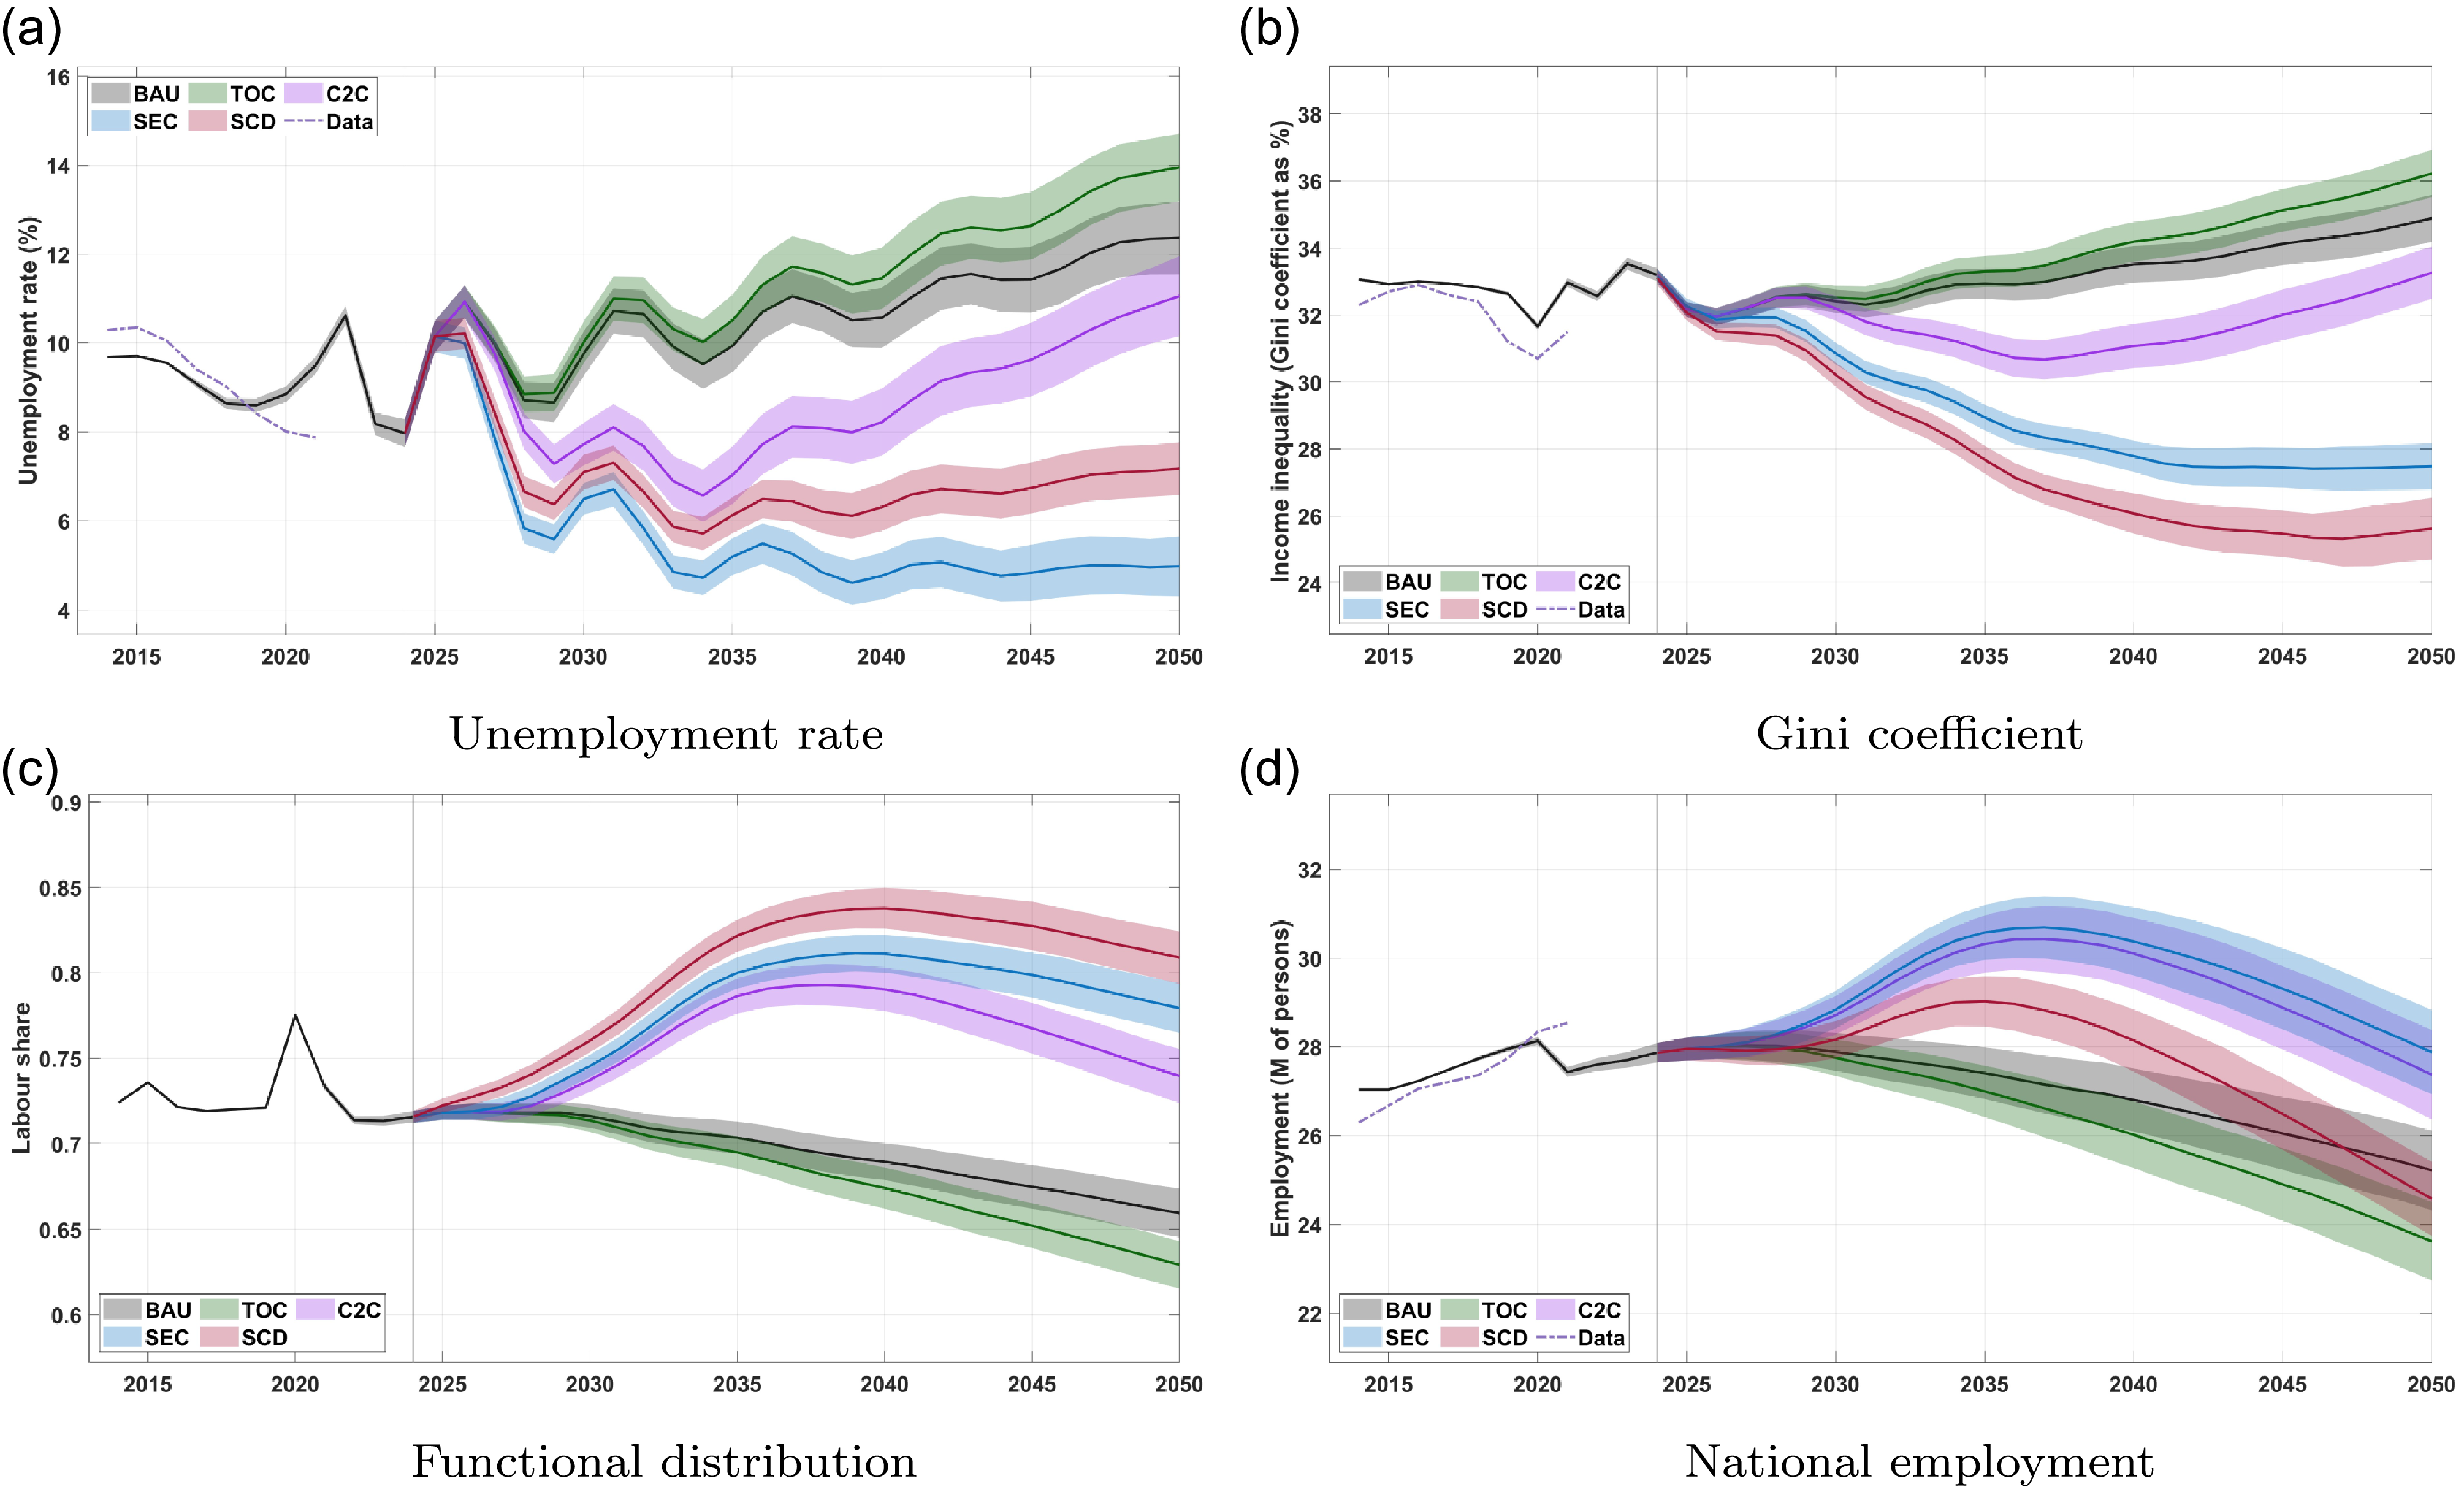
The distributional effects of the different policy scenarios on income inequality (Gini index) and value-added repartition between labour and capital are plotted in Panels 5b and 5c. Policy scenarios assessed in this study have sizeable effects on pre-redistribution value-added allocation. The TOC scenario does not alter the prevailing paradigm of value-added distribution. It actually results in a decrease in the proportion of value-added directed to workers. With the labour share down by 9 percentage points in 2050 compared to current levels, the TOC scenario favours profit accumulation. Conversely, the post-growth (SCD) scenario, followed by the SEC scenario, leads to the most important increases in the portion of value-added allocated to workers by 2050. This trend is predominantly attributable to redistributive policies, such as the imposition of a wealth tax and the amplification of social expenditure. Moreover, wage-compensated WTR facilitates a distribution of value that favours labour.
The evolution of the Gini coefficient closely aligns with the distribution of value-added. While the baseline (BAU) and Techno-Optimistic (TOC) scenarios tend to intensify income disparities, the Social and Circular post-growth (SCD) and Socially Equitable Circularity (SEC) scenarios are more successful in promoting equitable outcomes. The C2C scenario presents mixed implications: although it benefits labour through the allocation of value added, it concurrently exacerbates income inequalities compared to current levels.
5. Discussion
This study extended the EUROGREEN model by incorporating raw material use and waste-generation dynamics, enabling the simulation of complex interactions between CE policies, social equity objectives, and macroeconomic performance. To interpret the outcomes of our scenario analysis, we drew on a conceptual framework inspired by the sustainability trilemma, which highlights potential tensions among three core policy goals: economic growth, social equity, and ecological sustainability (Martine and Alves, Reference Martine and Alves2015; Sconfienza, Reference Sconfienza2019; Wu et al. Reference Wu, Rocha, Berry, Chaigneau, Hamann, Lindkvist, Qiu, Schill, Shepon, Crépin and Folke2024).
Firstly, simulation outcomes showed that a fully CE is unattainable, even under highly techno-optimistic assumptions. Secondary materials cannot replace primary raw materials entirely, nor can waste be fully eliminated (Giampietro, Reference Giampietro2019). This reflects a structural constraint: circular systems depend on continuous waste flows to supply recyclable materials. As recycling increases, primary extraction declines, and production slows. Waste generation falls, leading to a shortage in recycled materials which needs to be compensated for by renewed primary extraction to sustain the aggregate demand. Furthermore, model outcomes indicated that CE policies do not automatically generate environmentally sustainable outcomes. In the TOC scenario, high Circular Material Use (CMU) rates entailed a relative decoupling between Domestic Material Consumption (DMC) and GDP growth, stabilising the national material footprint by 2050. While such stabilisation may seem encouraging, it remains well above the thresholds compatible with planetary boundaries (Hickel et al. Reference Hickel, Dorninger, Wieland and Suwandi2022). The limited environmental improvements attained under the TOC scenario are accompanied by increasing unemployment and deepening social inequalities, thereby raising concerns regarding its political feasibility. Despite its high level of technological ambition, the TOC scenario has not delineated a credible trajectory toward green economic growth, let alone toward genuinely sustainable development, understood as the simultaneous achievement of long-term economic growth, social equity, and a swift and absolute reduction in environmental pressures (Brundtland, Reference Brundtland1987).
To counteract the rise in social inequality observed in the TOC pathway, we tested a package of social policies: a Working Time Reduction (WTR) plan, a JG programme, and a Piketty-style financial wealth tax. Although the Cradle-to-Cradle (C2C) and Socially Equitable Circularity (SEC) scenarios achieved high CMU rates, they generated a higher overall material footprint. This outcome is largely driven by a demand-driven rebound effect. Increased consumption amplifies the demand for imported raw materials and deteriorates the trade balance (Luzzati et al. Reference Luzzati, Distefano, Ialenti and Andreoni2022). In other words, advancing social equity without simultaneously reducing the overall material throughput risks exacerbating ecological overshoot, thereby contributing to the transgression of planetary boundaries. These rebound dynamics, frequently underestimated in CE policy assessments, highlight the difficulty of reconciling social and environmental outcomes within a “green growth” paradigm.
Instead, the Social Equity Circularity and post-growth (SCD) scenario seemed to achieve a high CMU rate together with relatively low material consumption. This result stems not only from improved circularity but also from environmentally conscious consumption patterns and strong redistributive public policies, including a tough financial wealth tax. These measures enhance social equity while keeping the public deficit within the range observed in the early simulation period. Still, it is higher than in other scenarios.
Circularity trilemma each vertex of the triangle corresponds to one of the key desiderata within the circular economy framework, namely: economic growth, social well-being, and minimal environmental harm. We provide a qualitative positioning of each scenario, as described in Section 3, within this triangular space in order to indicate which desiderata they most closely approximate.
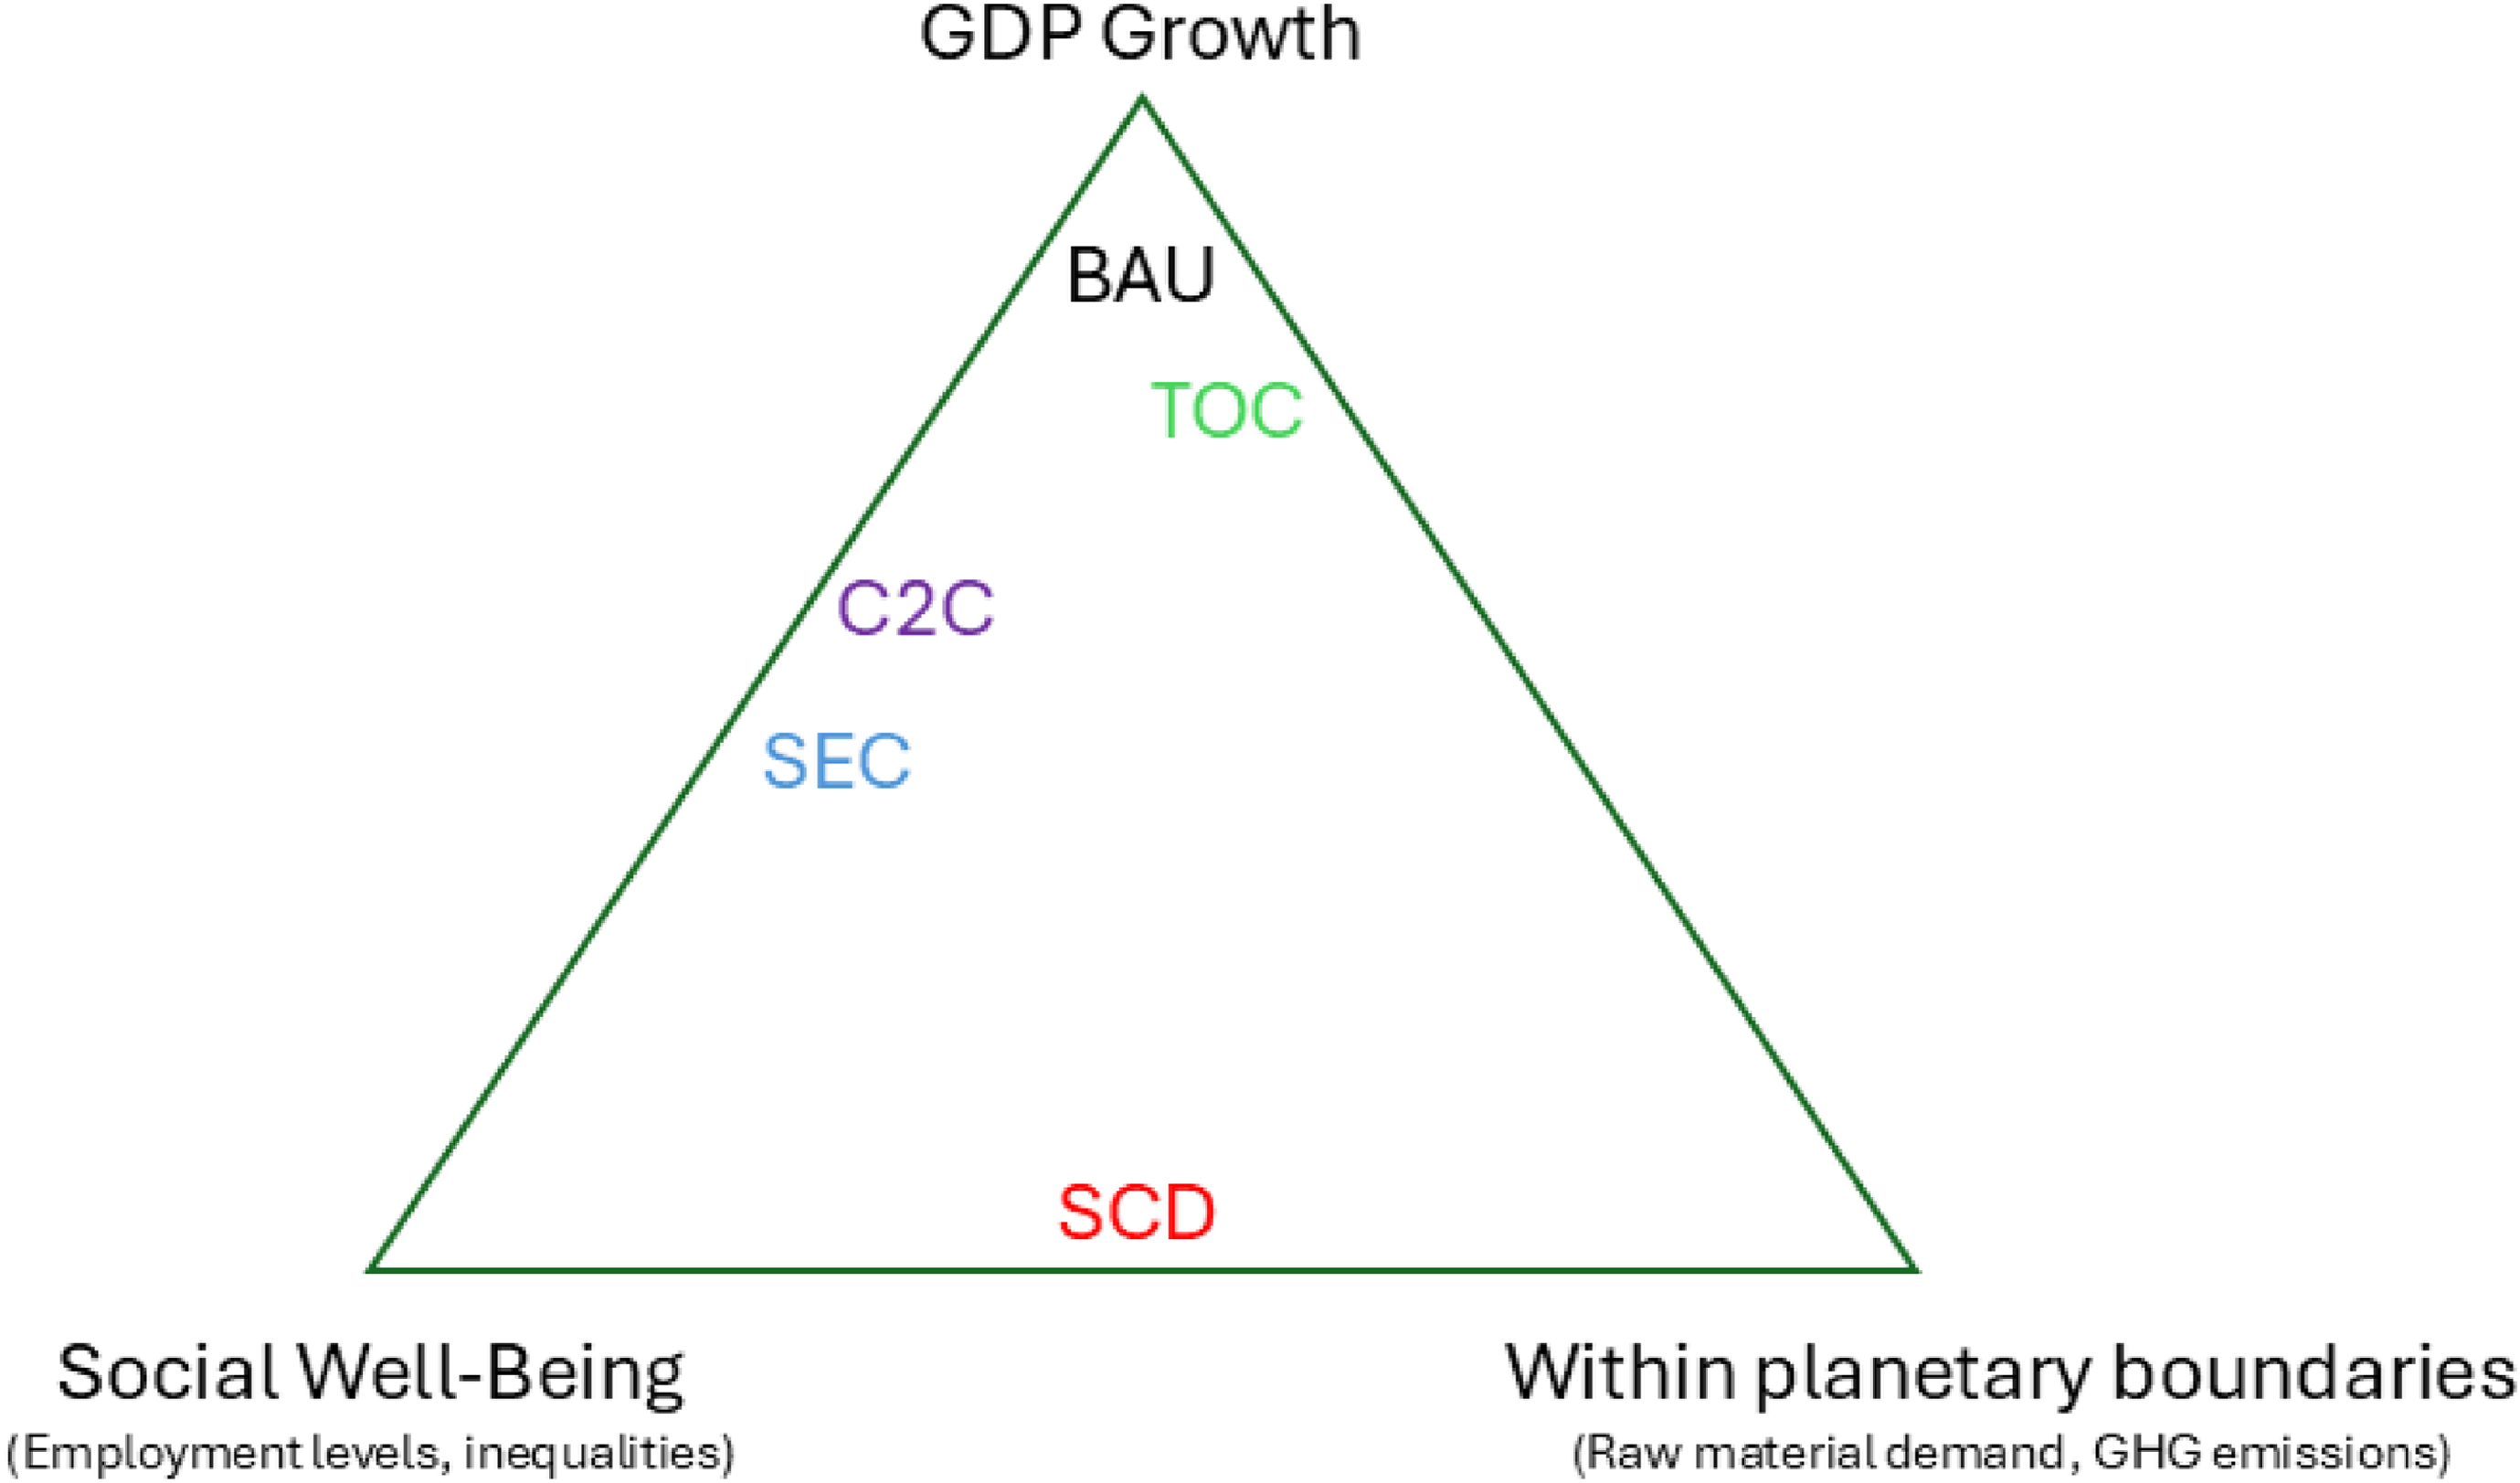
These findings therefore, highlight the existence of a circularity trilemma, wherein sustained economic growth, social equity, and ecological sustainability seem to be mutually incompatible and cannot be simultaneously achieved. Figure 6 provides a useful framework for analysing the trade-offs and synergies emerging from alternative CE strategies. CE strategies can meaningfully contribute to reducing material pressures only when combined with profound social reforms, including progressive taxation of financial wealth and policies that deliberately curb aggregate consumption. Such an integrated approach offers the most coherent pathway for aligning social equity with ecological sustainability, whereas growth-oriented CE pathways fall short on both fronts.
Special attention is also needed to ensure that CE strategies do not reinforce the structural imbalances inherent in the global political economy. Any CE framework designed for high-income EU countries, such as France, must therefore be critically assessed in light of its reliance on imported raw materials and externalised waste flows. This dependence reflects long-standing patterns of ecologically unequal exchange (Roberts and Parks, Reference Roberts and Parks2009), through which countries of the Global North disproportionately appropriate biophysical resources from the Global South while externalising socio-environmental costs associated with extraction, production, and disposal (Hornborg and Martinez-Alier, Reference Hornborg and Martinez-Alier2016; Warlenius et al. Reference Warlenius, Pierce and Ramasar2015). These dynamics extend beyond waste: the Global North’s need for critical raw materials structurally hinges on extractive industries in the Global South, reinforcing ecological degradation, dependency relations, and a hierarchical international division of labour (Arsel and Pellegrini, Reference Arsel and Pellegrini2022; Hickel et al. Reference Hickel, Dorninger, Wieland and Suwandi2022). In this light, CE strategies implemented in the Global North cannot be meaningfully separated from the global political economy they depend on. Without explicitly addressing international material and waste flows, CE policies risk reproducing global environmental injustices rather than reducing them.
5.1 Limitations
The current section outlines the main limitations of this study, thereby indicating avenues for future research.
Firstly, we rely on exogenous assumptions to represent future gains in material efficiency. However, it is important to note that historical data do not display statistically significant trends in material efficiency. Additionally, the allocation of waste into secondary raw materials was inferred indirectly using observed data on the Circular Material Use (CMU) rate, because the EUROSTAT categories for primary raw materials and waste generation are not fully aligned. Moreover, the level of sectoral aggregation in the model may lead to an overestimation of the potential substitution of secondary raw materials for primary ones.
Changes in the demand for waste management services were not considered, even though higher recycling rates could require additional chemicals or more advanced technologies to process larger volumes of recycled materials. The absence of data on stocks of primary and secondary materials may also lead to an overestimation of domestic extraction capacities while underestimating potential health risks and social conflicts, such as the well-documented NIMBYFootnote 12 responses associated with waste allocation. Furthermore, the model does not incorporate the potential effects of extended product life cycles, which could reduce waste generation but also modify the structure of final demand. Finally, France’s material footprint of imports is based on static coefficients and does not reflect endogenous changes in the economic systems of its trading partners.
While these limitations point to areas where future research can refine and extend the model, the validity of the present results is supported by comparisons with historical trends and by sensitivity analyses, both of which indicate that the core conclusions remain robust. It should also be stressed that this study alone does not provide definitive evidence that the Social and Circular post-growth (SCD) strategy would be sufficient to place the French economy fully within planetary boundaries. Future research could apply or extend the methodology developed by O’Neill et al. (Reference O’Neill, Fanning, Lamb and Steinberger2018) to evaluate whether the SCD policy package is capable of moving the French economy into a “safe and just space,” (Raworth, Reference Raworth2012) where fundamental human needs and social well-being are satisfied without transgressing biophysical limits. Such an assessment lies beyond the scope of this study but represents a crucial avenue for continued investigation.
5.2 Concluding remarks
This study extended the French EUROGREEN model (D’Alessandro et al. Reference D’Alessandro, Cieplinski, Distefano and Dittmer2020) by incorporating raw material use, waste generation, and recycling dynamics in order to examine the systemic effects of CE strategies within a macroeconomic, distributional, and biophysical framework. By combining post-Keynesian ecological macro-modelling with explicit material-flow extensions, we have shown that the interactions between circularity measures, social equity policies, and environmental performance are far more complex than suggested by mainstream narratives of “win—win” green growth.
Scenario outcomes demonstrated that neither technological improvements nor increases in recycling rates are sufficient to achieve deep reductions in France’s material footprint while simultaneously ensuring employment stability and reducing inequality. Even optimistic circularity pathways faced rebound effects, persistent reliance on primary extraction of raw materials, and insufficient mitigation of socio-economic inequalities. The tensions manifested across the various scenarios are synthesised in the circularity trilemma, which elucidates the structural constraints inherent to implementing a CE within a growth-oriented socioeconomic system. As CE scenarios that do not question the growth-centred paradigm result in the continuation of structural inequalities and overconsumption dynamics, they eventually undermine social fairness and ecological sustainability at the heart of ”sustainable development.” To reconcile CE with enhanced social and environmental outcomes, it is therefore key to rethink CE interventions outside the box.
Among the alternative strategies investigated, the Social and Circular post-growth (SCD) scenario offered the most coherent pathway for aligning social well-being with ecological constraints. This post-growth perspective radically challenges the assumption that CE policies can deliver green and inclusive GDP growth. Instead, this scenario relies not only on circularity strategies but also on a broader policy mix involving progressive taxation, reduced aggregate consumption, and innovative social policies. The integrated post-growth CE strategy successfully reconciles social well-being with lower material consumption levels. As it may congruently deliver on social and environmental outcomes, the post-growth scenario provides a promising avenue towards an economy that fulfils human needs within planetary boundaries. Before drawing firm policy conclusions, post-growth circularity scenarios would benefit from more in-depth examination, especially regarding the expected consumption reduction necessary to operate within planetary boundaries.
This scenario also suggests that CE policies in high-income countries may reduce material needs in high-income economies. While the consequences of this shift are still to be further explored in the literature, a genuinely transformative post-growth CE must also confront and seek to correct entrenched asymmetries in global resource use (Corsi et al. Reference Corsi, Guarino, Muñoz-Ulecia, Sapio and Franzese2024). A post-growth circular transition in the Global North aiming to advance fair and sustainable outcomes for all must consider its potential impacts in export-dependent economies. Addressing ecologically unequal exchange and global environmental inequalities must be at the centre of post-growth transitions in high-income economies.
Eventually, the present study underlines the need for future Ecological Macroeconomic modelling work to improve the integration of biophysical constraints, behavioural responses, and institutional dynamics. Improving data availability on material stocks, refining sectoral detail, and embedding global supply-chain adjustments are essential steps for capturing the full complexity of circular transitions. Beyond model refinements, the findings call for renewed reflection on the political and institutional conditions under which socially fair and ecologically sound transitions can be realistically pursued. Future research should explore more granular post-growth pathways, particularly the interactions between product lifetime extension, GDP trajectories, and socio-environmental outcomes. It will also be crucial to adopt a multi-scalar perspective, spanning regional, national, and global levels, to capture the spatial heterogeneity of material flows and policy impacts.
Highlights
-
• Techno-policy macroeconomic simulations with multiple socio-economic and environmental indicators
-
• System Dynamic EEIO with economic feedback for raw material efficiency and waste management
-
• Technological CE solutions often entail regressive social outcomes
-
• Social CE policies improve social equity at the cost of a rebound effect on the domestic material footprint
-
• Post-Growth CE can advance both fairer and more sustainable outcomes
Credit author statement
Both authors contributed equally.
Data availability
The seminal EUROGREEN model, developed in Vensim DSS, is published in the Zenodo open-access repository: https://zenodo.org/records/7322875. The new version will be available upon request.
Appendix A. Tables
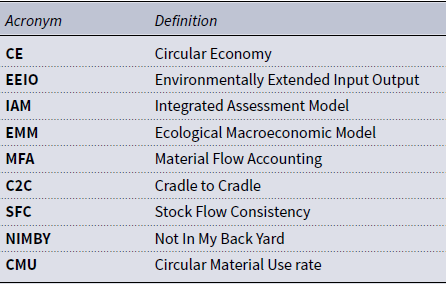
List of abbreviations
EUROGREEN model in a nutshell. List of all the modules together with a recap of the main assumptions and feedback effects. The full documentation is available at doi.org/10.1038/s41893-020-0484-y
Main methodological novelties. List of the new modules and dimensions added to the seminal EUROGREEN module, including the rationale and the specific contribution. Mathematical details are provided in the following subsections
NACE (Rev.2) classification in the $EUROGREEN$
model
$EUROGREEN$
model

Definition and aggregation criteria of the ten productive sectors in $EUROGREEN$
model, in accordance with the NACE classification. Column one shows the name of the macro-sectors used in the
$EUROGREEN$
model, in accordance with the NACE classification. Column one shows the name of the macro-sectors used in the $EUROGREEN$
model.
$EUROGREEN$
model.
Sectoral distribution of raw material extraction (domestic use) by category (in Mega-tonnes), including the monetary output (in Trillion of euros), in France (2014). Source: EUROSTAT - Material flow accounts
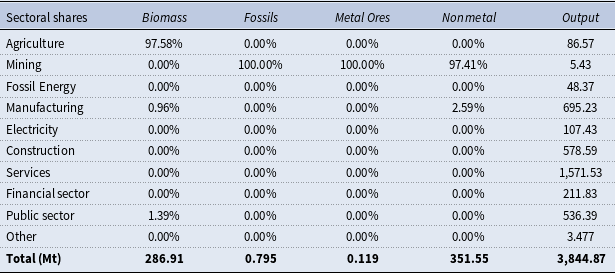
It is important to note that the shares are obtained from the GLORIA database - Release 057, while the intensity coefficients are estimated by the Authors to prevent data inconsistencies with Eurostat, considering the total monetary output for the year 2014.
Average intensity coefficients (tonnes per euro) regarding national output ( $\gamma$
), exports (
$\gamma$
), exports ( $\gamma ^e$
), and imports (
$\gamma ^e$
), and imports ( $\gamma ^m$
), along with relative standard deviations (std), were calculated from actual data over the period 2014-2021 for each raw material category at the national level
$\gamma ^m$
), along with relative standard deviations (std), were calculated from actual data over the period 2014-2021 for each raw material category at the national level
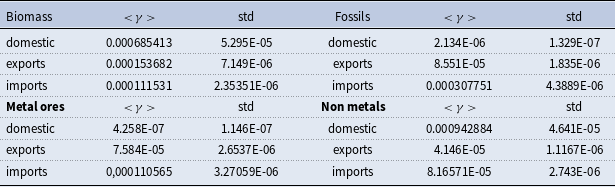
Authors’ elabouration from EUROSTAT Material flow accounts.
Waste generation across sectors and households in France. Intensity coefficient (in tonnes per euro) relative to total sectoral output and final demand, in 2014
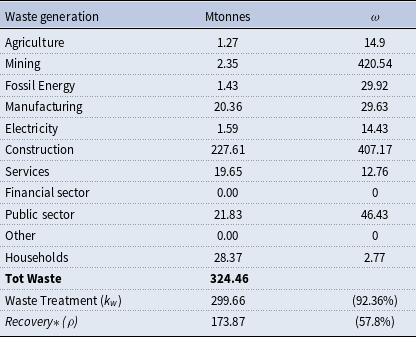
Authors’ elabouration from the EUROSTAT’s Waste management databases. *Recovery: energy, recycling without backfilling (R1-R12), note that $\rho$
is set at its historical maximum (62%) from 2024 onwards.
$\rho$
is set at its historical maximum (62%) from 2024 onwards.
Exogenous shocks from the Covid-19 pandemic from 2019 to 2020
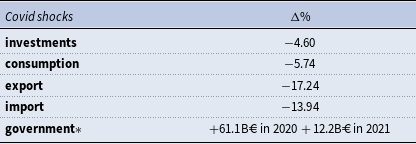
Authors’ own elabouration. Data are provided by the EUROSTAT GDP and main components while the changes in the government* expenditures included the main “aid and umbrella”schemes approved by the EU Commission for France in 2020 and 2021.
Main parameters for calibration and sensitivity analysis
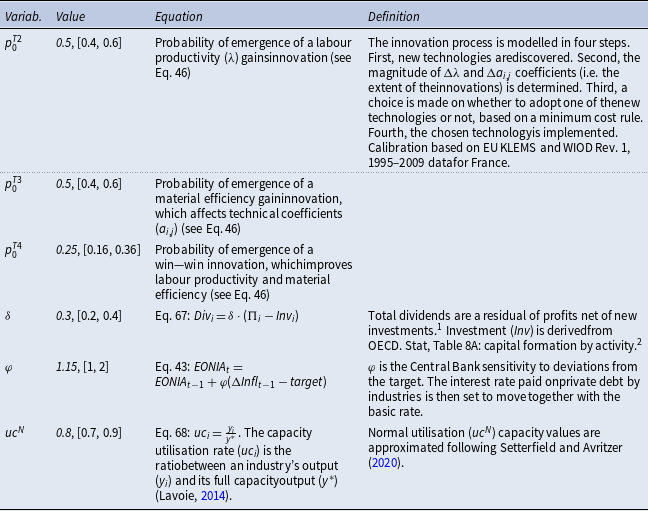
Note: Calibration refers to the value associated with each parameter, while in brackets is the range of variation applied for the sensitivity analysis. The variables and the equations make reference to the Supplementary Information of the seminal EUROGREEN paper, which can be consulted here: https://people.unipi.it/simone_dalessandro/wp-content/uploads/sites/78/2020/02/SI_Feasible_Alternatives.pdf. 1Data is available https://pages.stern.nyu.edu/~damodar/pc/datasets/divfundEurope.xls (05/01/2021 update). 2Available at: https://stats.oecd.org/Index.aspx?DataSetCode=SNA_TABLE8A.
Appendix B. Other results
B.1. Robustness check under the BAU
The empirical calibration of parameters and initial values for the French economy is based on official data. To estimate the unknown parameters, we used official data from 2014 to 2020 (if available) and applied the optimisation function provided by Vensim SDD. We employed the multi-objective parameter optimisation mode available in Vensim SDD, which automates the calibration process through repeated simulations. Technical details are available at: https://vensim.com/optimization/#model-calibration. The calibration process aimed to align the model outputs with observed data for key variables, as described in Table A9.
CMU by material category. Comparison of real data (violet) with the numerical outcomes — from 2014 to 2050 — under the baseline (black) and the other scenarios: $TOC$
(green),
$TOC$
(green), $C2C$
(purple),
$C2C$
(purple), $SEC$
(blue), and
$SEC$
(blue), and $SCD$
(red). The vertical dotted line indicates the year 2024 when the policies are introduced. The solid lines and shaded areas around them indicate the medians and 95% confidence intervals, respectively, out of 500 independent simulations.
$SCD$
(red). The vertical dotted line indicates the year 2024 when the policies are introduced. The solid lines and shaded areas around them indicate the medians and 95% confidence intervals, respectively, out of 500 independent simulations.
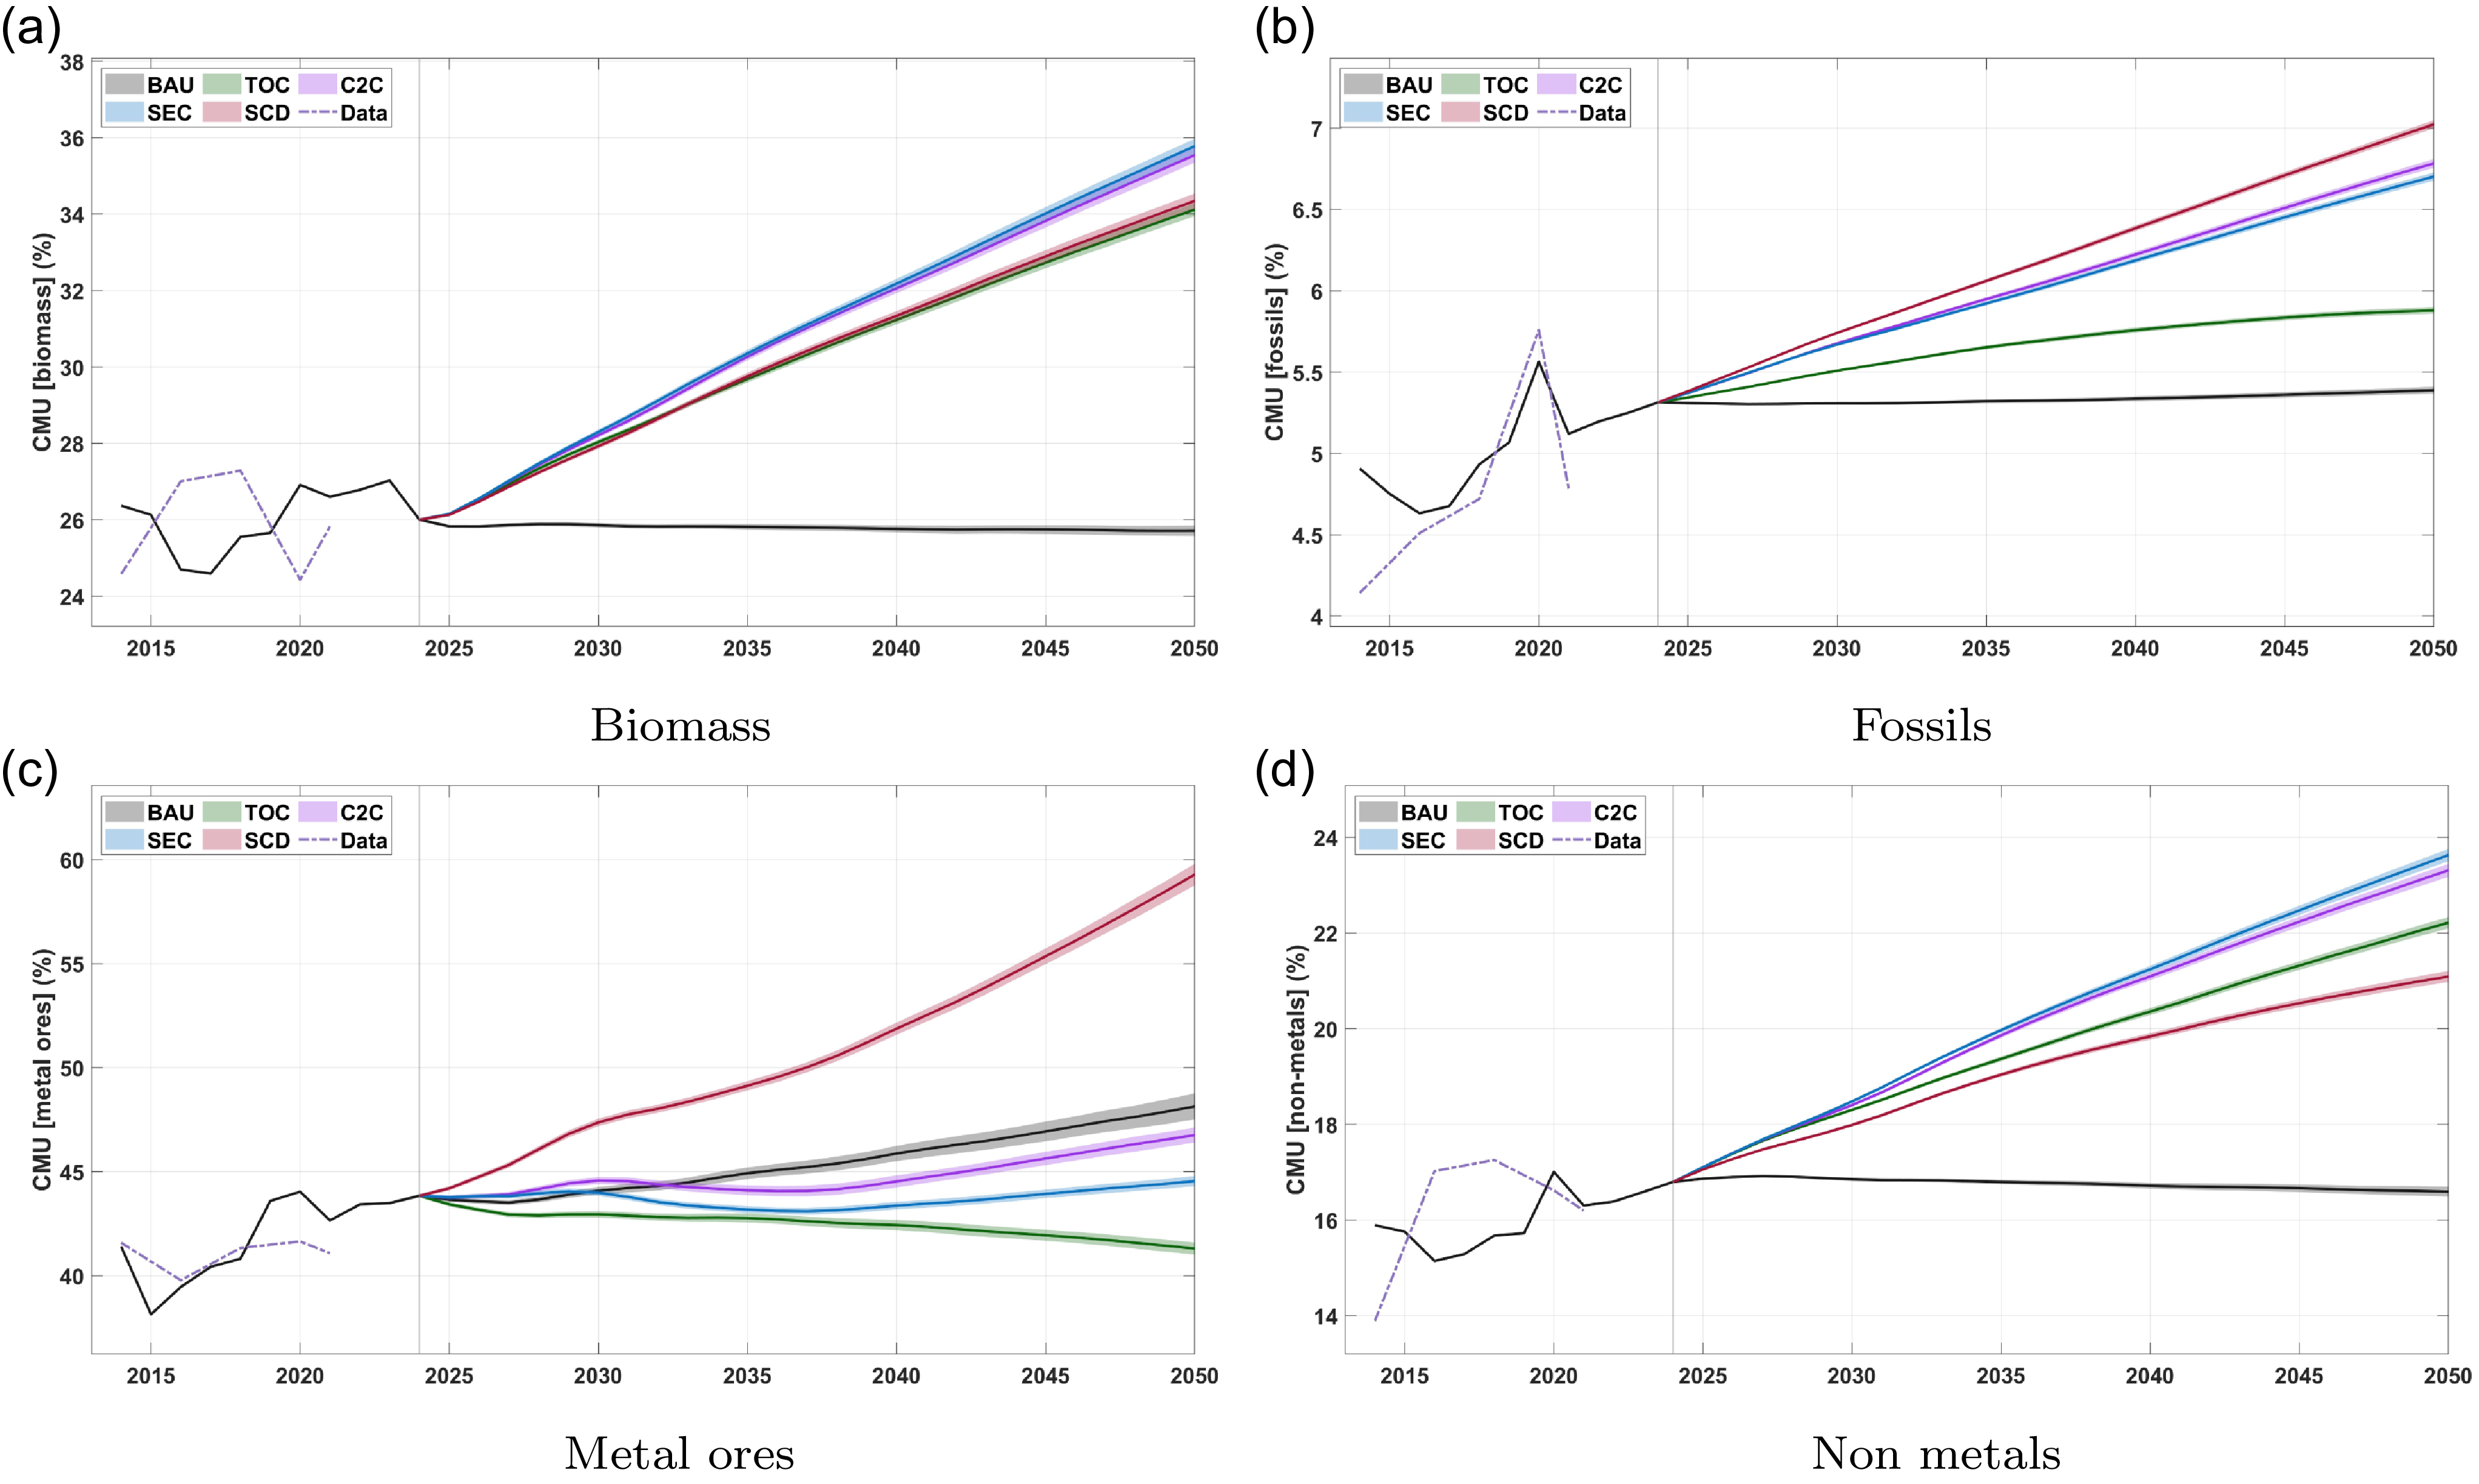
Real output of key sectors. Output in real values (trillion of euros) — from 2014 to 2050 — under the baseline (black) and the other scenarios: $TOC$
(green),
$TOC$
(green), $C2C$
(purple),
$C2C$
(purple), $SEC$
(blue), and
$SEC$
(blue), and $SCD$
(red). The vertical dotted line indicates the year 2024 when the policies are introduced. The solid lines and shaded areas around them indicate the medians and 95% confidence intervals, respectively, out of 500 independent simulations.
$SCD$
(red). The vertical dotted line indicates the year 2024 when the policies are introduced. The solid lines and shaded areas around them indicate the medians and 95% confidence intervals, respectively, out of 500 independent simulations.
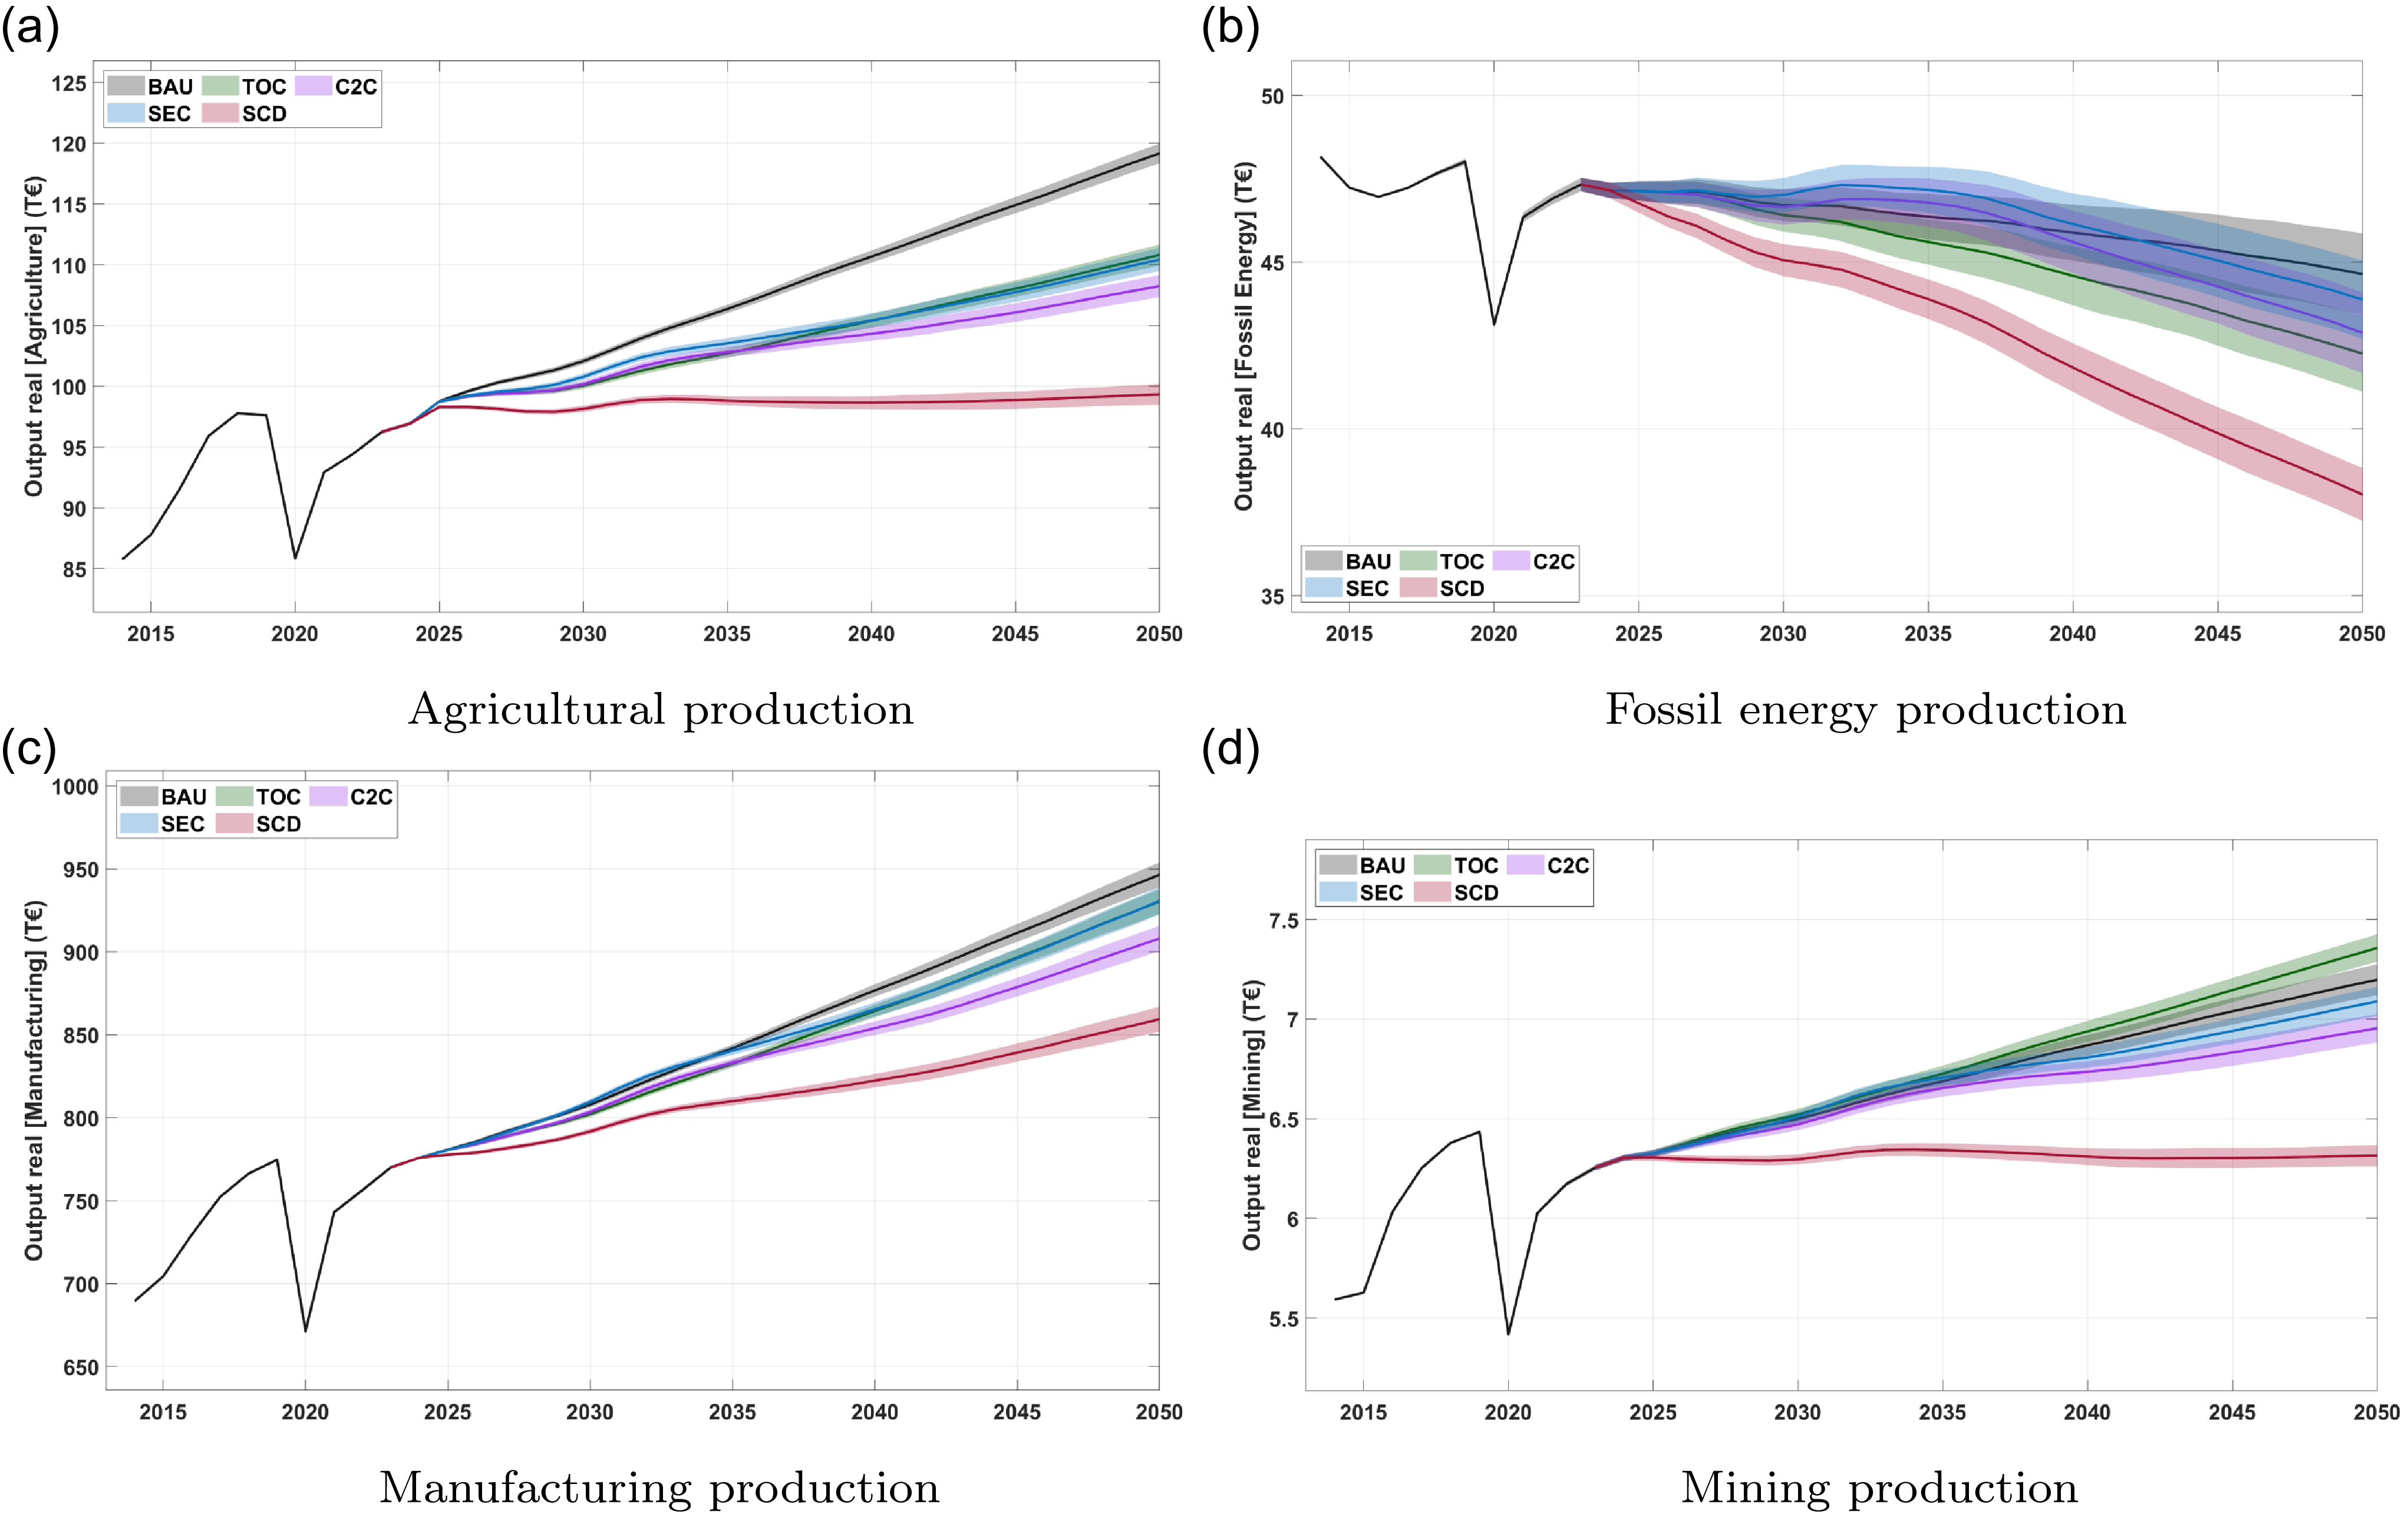
Additional indicators. Comparison of real data (violet) with the numerical outcomes — from 2014 to 2050 — under the baseline (black) and the other scenarios: $TOC$
(green),
$TOC$
(green), $C2C$
(purple),
$C2C$
(purple), $SEC$
(blue), and
$SEC$
(blue), and $SCD$
(red). The vertical dotted line indicates the year 2024 when the policies are introduced. The solid lines and shaded areas around them indicate the medians and 95% confidence intervals, respectively, out of 500 independent simulations.
$SCD$
(red). The vertical dotted line indicates the year 2024 when the policies are introduced. The solid lines and shaded areas around them indicate the medians and 95% confidence intervals, respectively, out of 500 independent simulations.
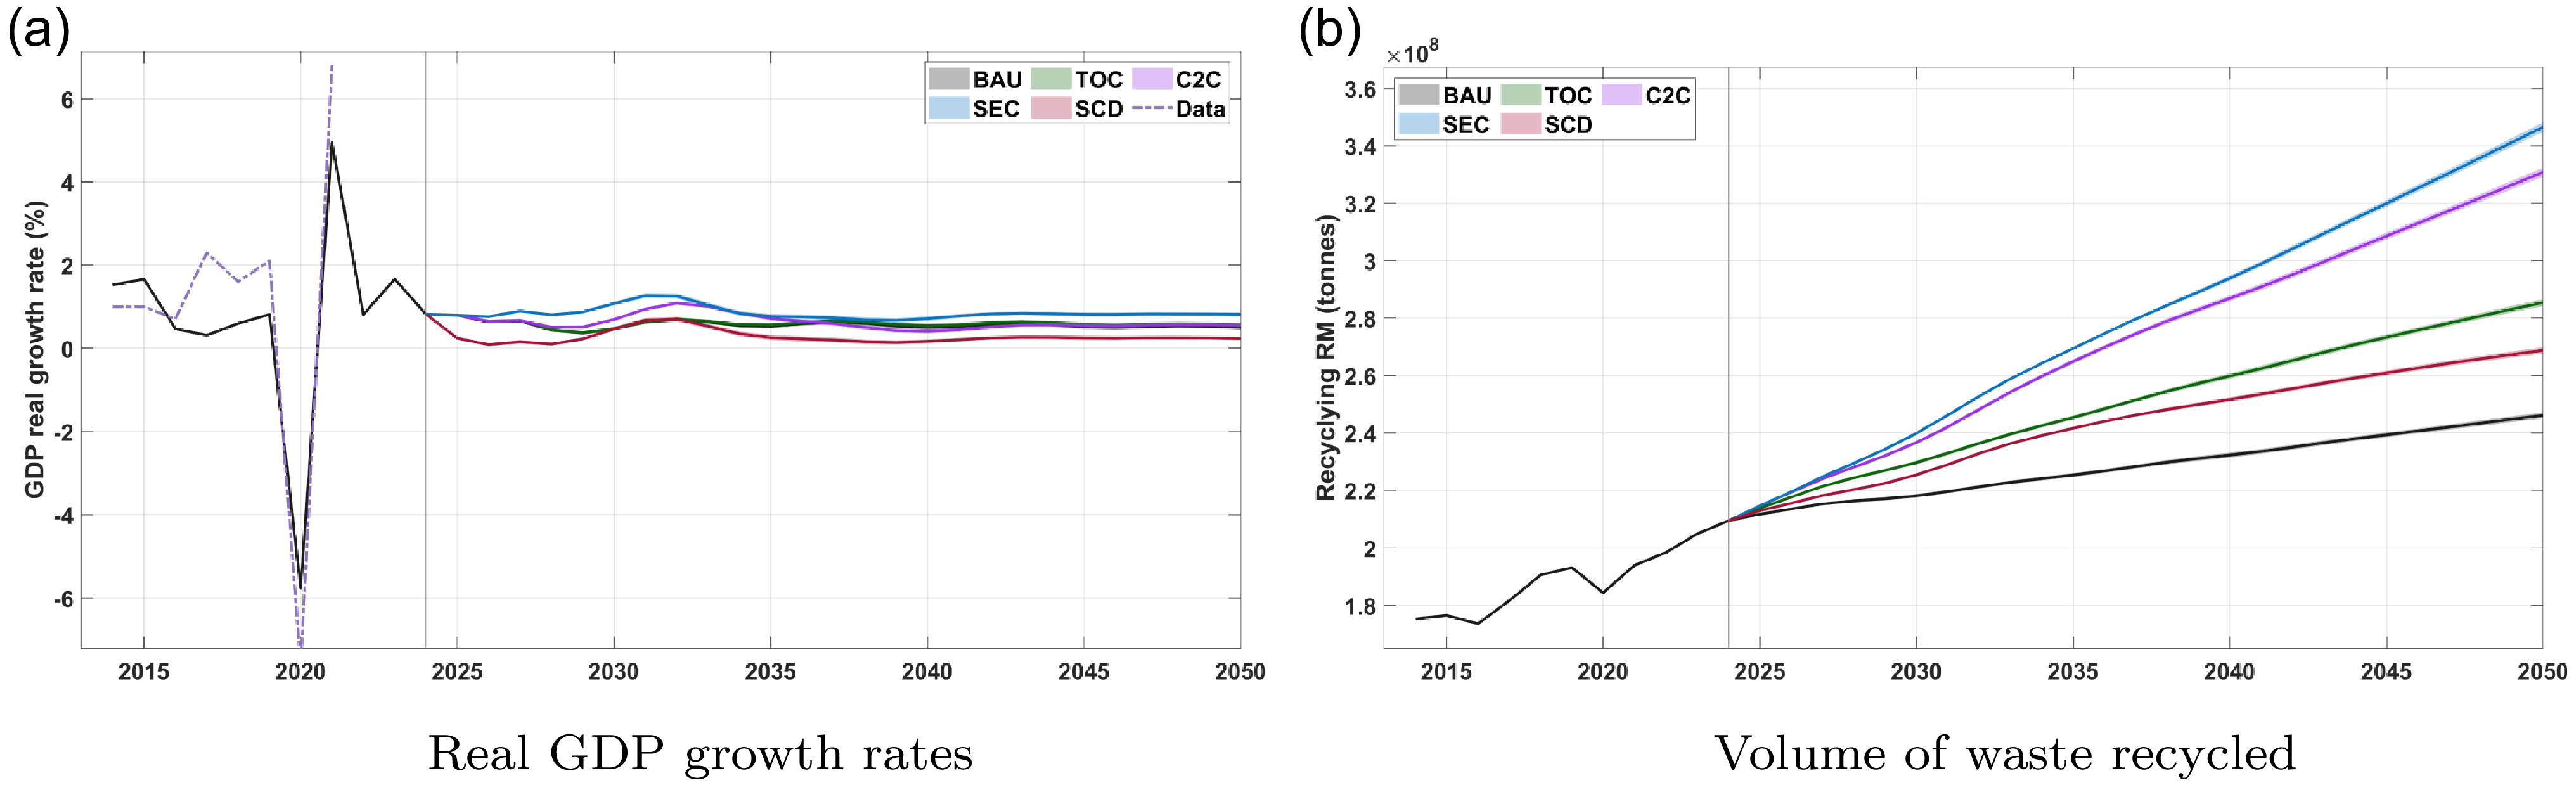
Sensitivity analysis. Main macroeconomic indicators under alternative parameter configurations (see Table A9) in the baseline scenario, based on 1,000 simulations to assess model backbone robustness.


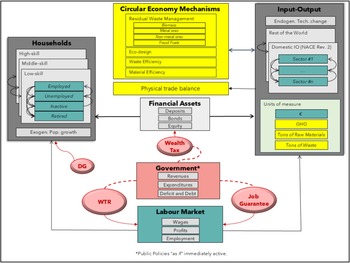


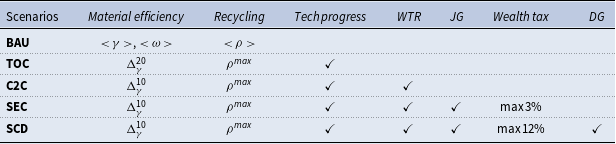
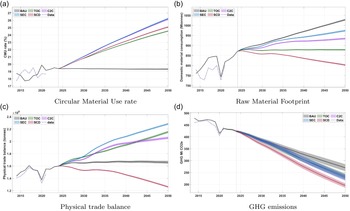


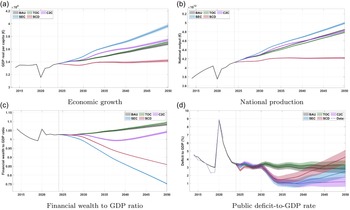


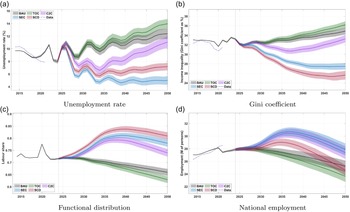


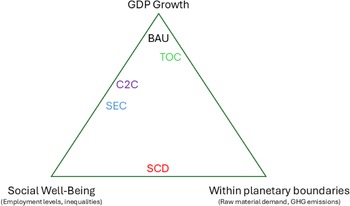
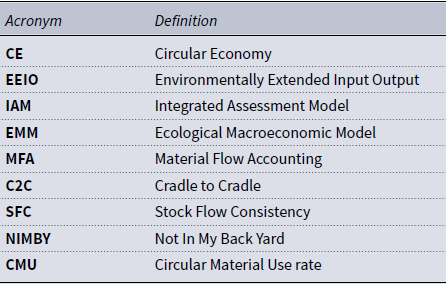
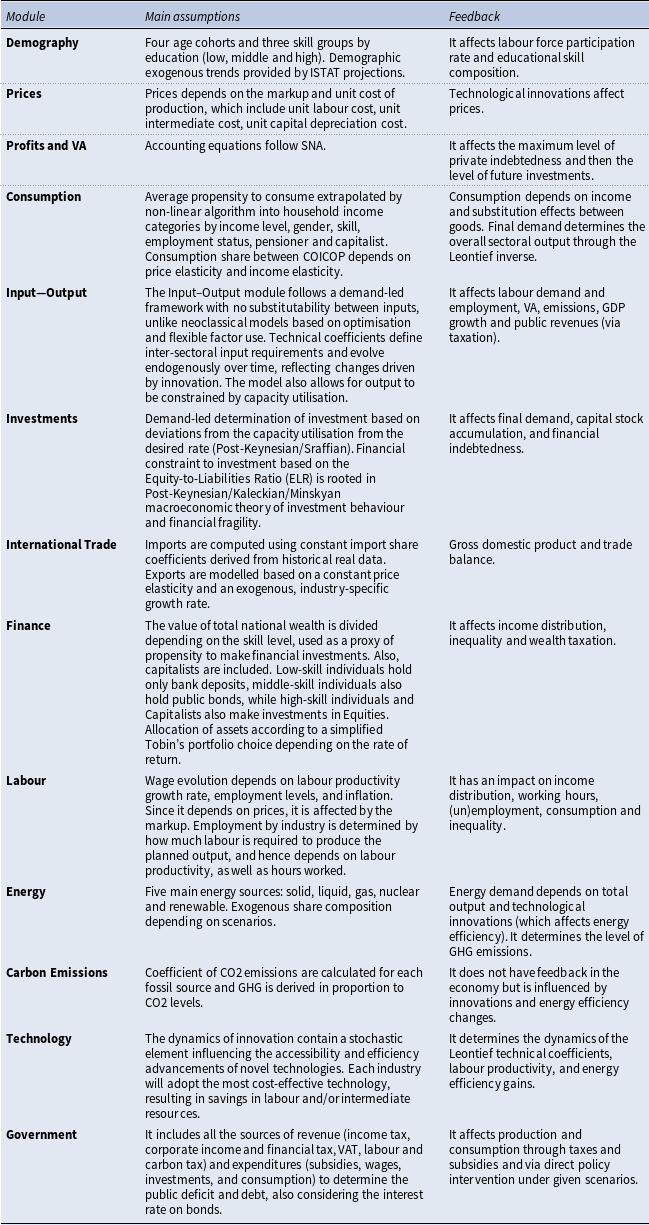
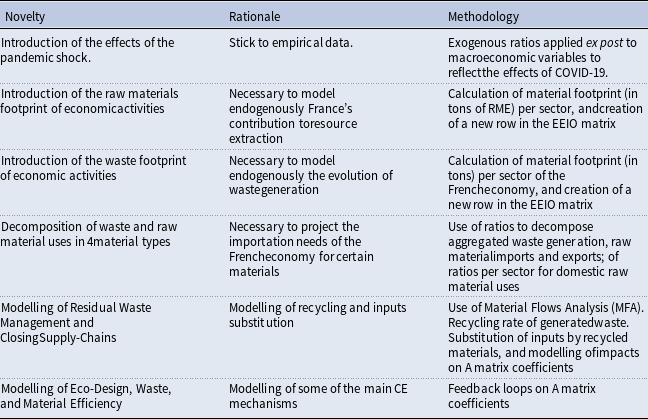
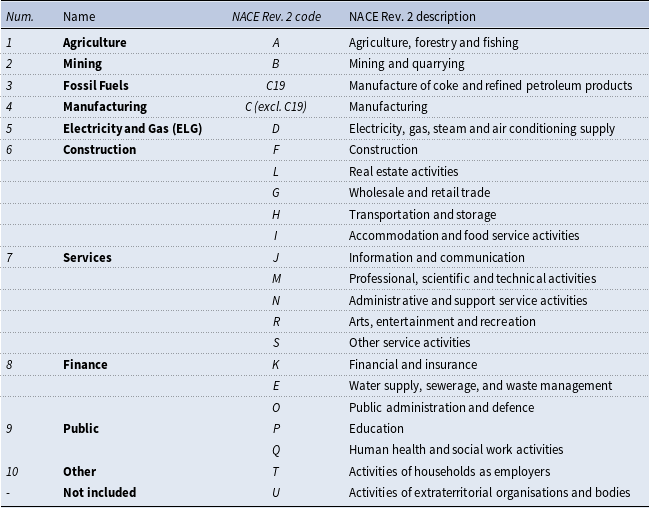

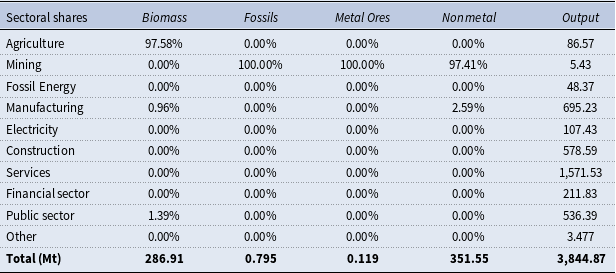
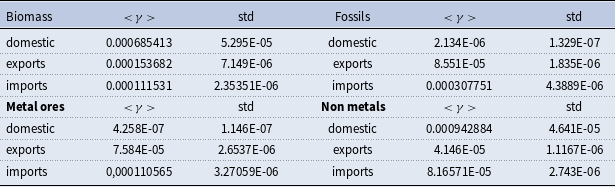


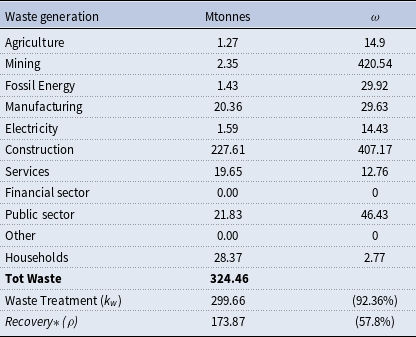
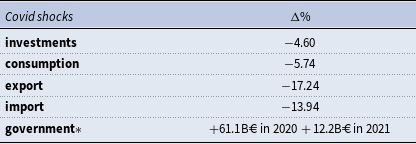
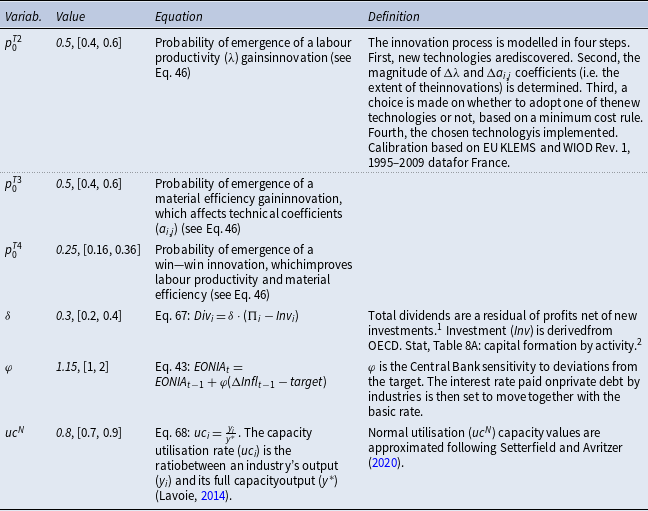
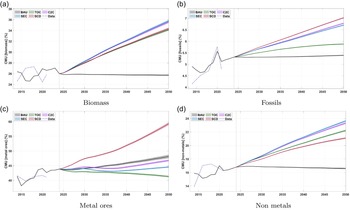


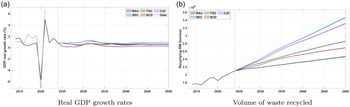


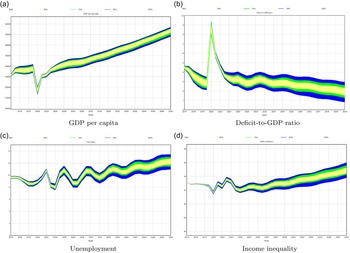

 Open access

