


Introduction
Radiocarbon (14C) concentrations in the marine environment are of broad interest because of their utility for both radiometric dating of marine organisms and as a geochemical tracer of water mass ventilation and circulation pathways. Natural radiocarbon is generated in the atmosphere from interactions between cosmic ray-generated thermal neutrons and nitrogen (N2) (Korff Reference Korff1954; Ruben and Kamen Reference Ruben and Kamen1941). Variations in atmospheric 14C can be caused by changes in production or by carbon exchange between the atmosphere, the biosphere, and the ocean’s dissolved inorganic carbon reservoir (e.g., Hughen et al. Reference Hughen, Lehman, Southon, Overpeck, Marchal, Herring and Turnbull2004 and references therein). Additionally, atmospheric nuclear weapons testing during the 1950s and early 1960s led to a doubling of atmospheric 14C that reached a peak in the Northern Hemisphere in 1963 (Nydal and Lövseth Reference Nydal and Lövseth1983). This pulse of “bomb” 14CO2 has diminished as atmospheric 14CO2 has been diluted by bi-directional carbon exchange with the ocean and terrestrial biosphere reservoirs and the unidirectional input of radiocarbon-free CO2 from fossil fuel burning, known as the “Suess effect” (Graven et al. Reference Graven, Keeling and Xu2022; Keeling Reference Keeling1979). Oceanic uptake of the bomb-14C pulse provides a valuable tracer of the air-sea 14CO2 exchange for the 20th century by the transfer of carbon between the atmosphere and ocean surface waters as 14CO2. The exchange of 14CO2 between the atmosphere, surface ocean, and interior ocean waters is important because it reflects fundamental oceanic processes, providing insight into the fate of CO2 produced by burning fossil fuels and the movement of anthropogenic-induced heat in the ocean (Graven et al. Reference Graven, Gruber, Key, Khatiwala and Giraud2012; Zanna et al. Reference Zanna, Khatiwala, Gregory, Ison and Heimbach2019). The extent to which 14C can be employed as an oceanographic tracer depends upon our understanding of the Δ14C of surface and, ultimately, interior waters and how these values have varied through time.
Ocean Δ14C observations are, in general, sparse in both space and time (e.g., Nydal Reference Nydal2000). Still, several basin-scale snapshots (i.e., discrete instantaneous samples) were collected during the GEOSECS, TTO/SAVE, WOCE/CLIVAR, and now GO-SHIP programs (see McNichol et al. Reference McNichol, Key and Guilderson2022 for a review). From these observations, it was shown that bomb radiocarbon in surface ocean as dissolved inorganic carbon (DIC) contains high spatial variability because of the sizable ocean-atmosphere gradient in Δ14C and the gradient between bomb carbon-laden water and interior lower 14C waters. Thorough mixing of the bomb 14C signal in the upper ocean takes many decades since gas exchange occurs with dissolved CO2 only, which makes up less than 1% of the DIC. Consequently, the isotopic equilibration time was estimated to be seven to ten years (Broecker and Peng Reference Broecker and Peng1982; Sweeney et al. Reference Sweeney, Gloor, Jacobson, Key, McKinley, Sarmiento and Wanninkhof2007) convolved with the mixing time of the upper ocean.
Although continuous time series of direct ocean Δ14C measurements do not exist, proxy records, such as the 14C content of coral skeletal material, can be used to estimate how the Δ14C of the ocean has changed with time. Coral Δ14C is an ideal water mass tracer because corals utilize seawater-dissolved inorganic carbon to construct their carbonate skeletons and directly record the Δ14C of the water in their environment (Druffel and Linick Reference Druffel and Linick1978; Knutson and Buddemeier Reference Knutson and Buddemeier1973). Coral-based Δ14C reconstructions with high chronological fidelity (±1–2 years for 50–100 yearlong records) can have annual sample resolution (i.e., annual average) and in some cases subannual (i.e., monthly average). Such temporal averaging minimizes the representation uncertainties or bias in discrete instantaneous sampling of an incompletely homogenous mixed layer, at least with respect to Δ14C, which can plague surface water samples (Druffel and Griffin Reference Druffel and Griffin2008; McDuffee and Druffel Reference McDuffee and Druffel2007). Here, we investigate surface ocean Δ14C in the tropical-subtropical Atlantic Ocean for the last several centuries by presenting new coral Δ14C records from the Caribbean Sea and the Gulf of Mexico and compiling existing coral Δ14C for the tropical and subtropical Atlantic Ocean for an updated assessment of radiocarbon as a tracer for air-sea gas exchange and reassessment of regional marine Δ14C values for marine reservoir corrections.
Study area
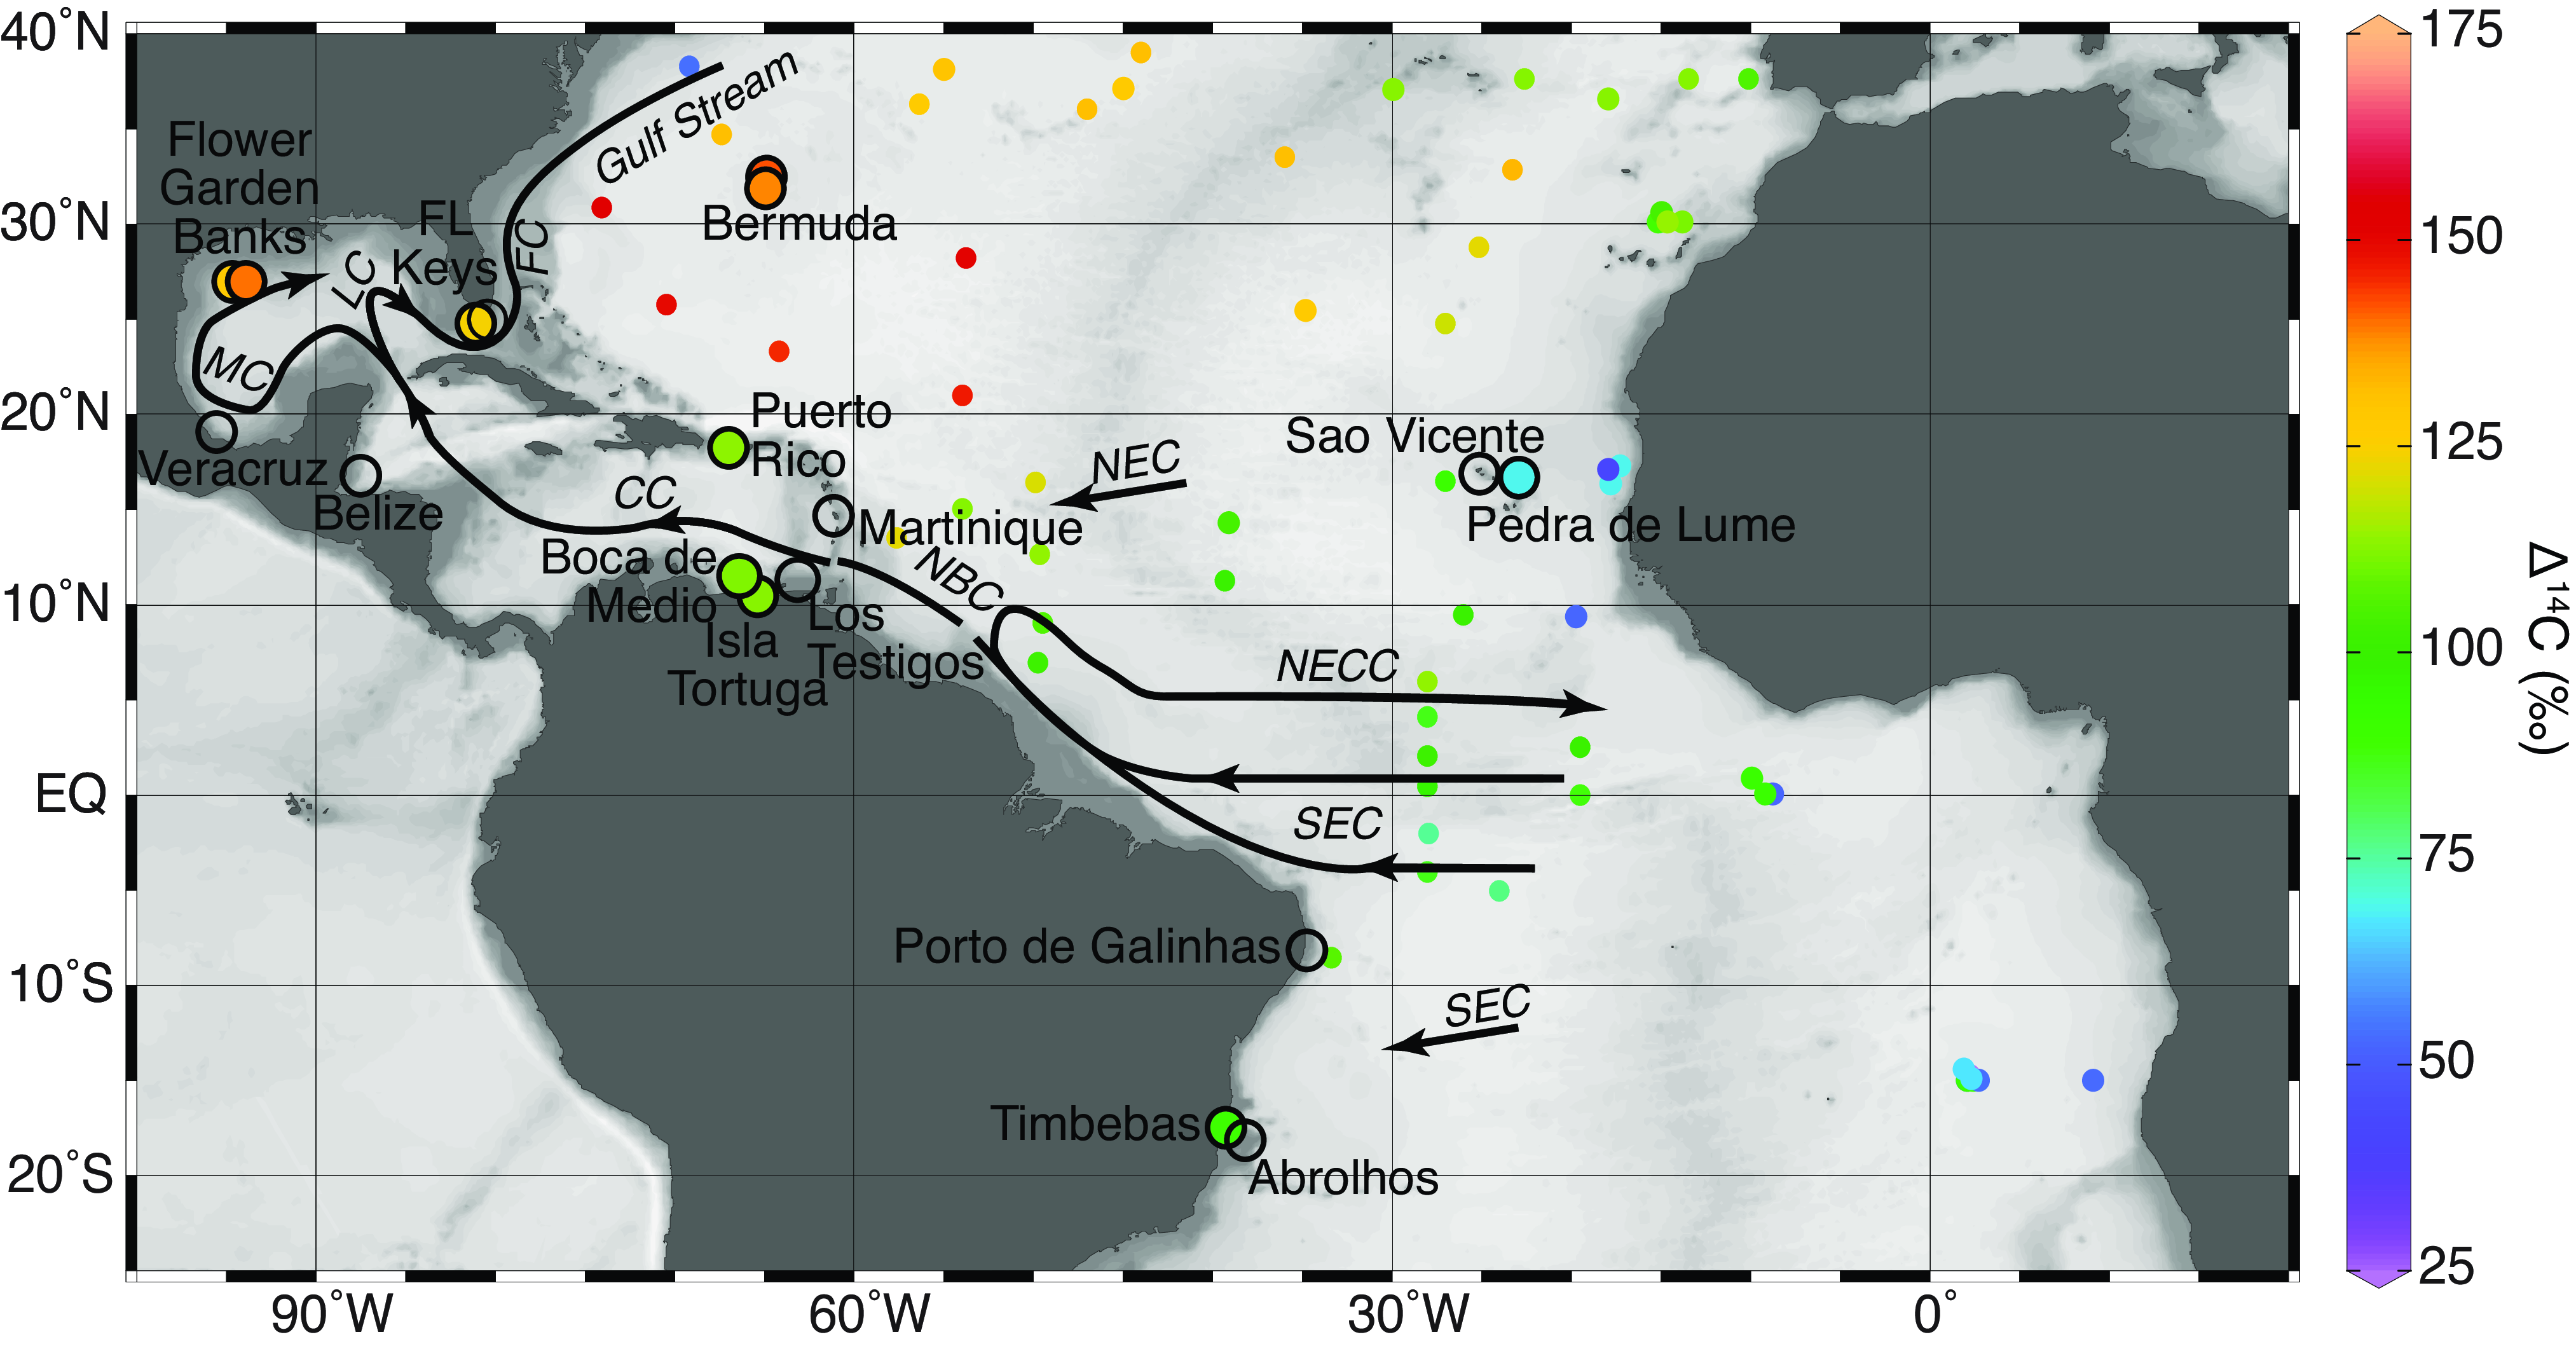
We present three new records from the Gulf of Mexico (two from Flower Garden Banks and one from Veracruz, Mexico) and two new records (Boca de Medio and Isla Tortuga) near the Cariaco Basin in the southern Caribbean (Figure 1). We compile these records with published coral Δ14C records (Table 1) including Bermuda, the Florida Keys, Puerto Rico, Belize, Mexico, Martinique, Cape Verde Islands, Venezuela, and Brazil. These sites are connected via the surface ocean currents of the tropical and subtropical Atlantic Ocean.
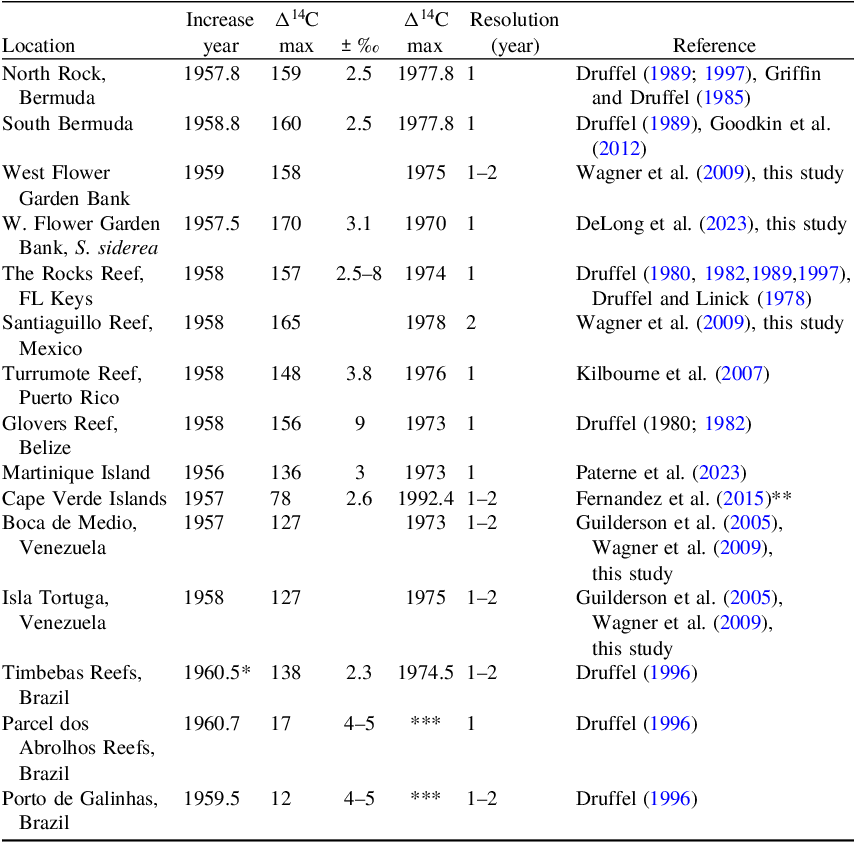
Summary of Atlantic Ocean radiocarbon studies from corals
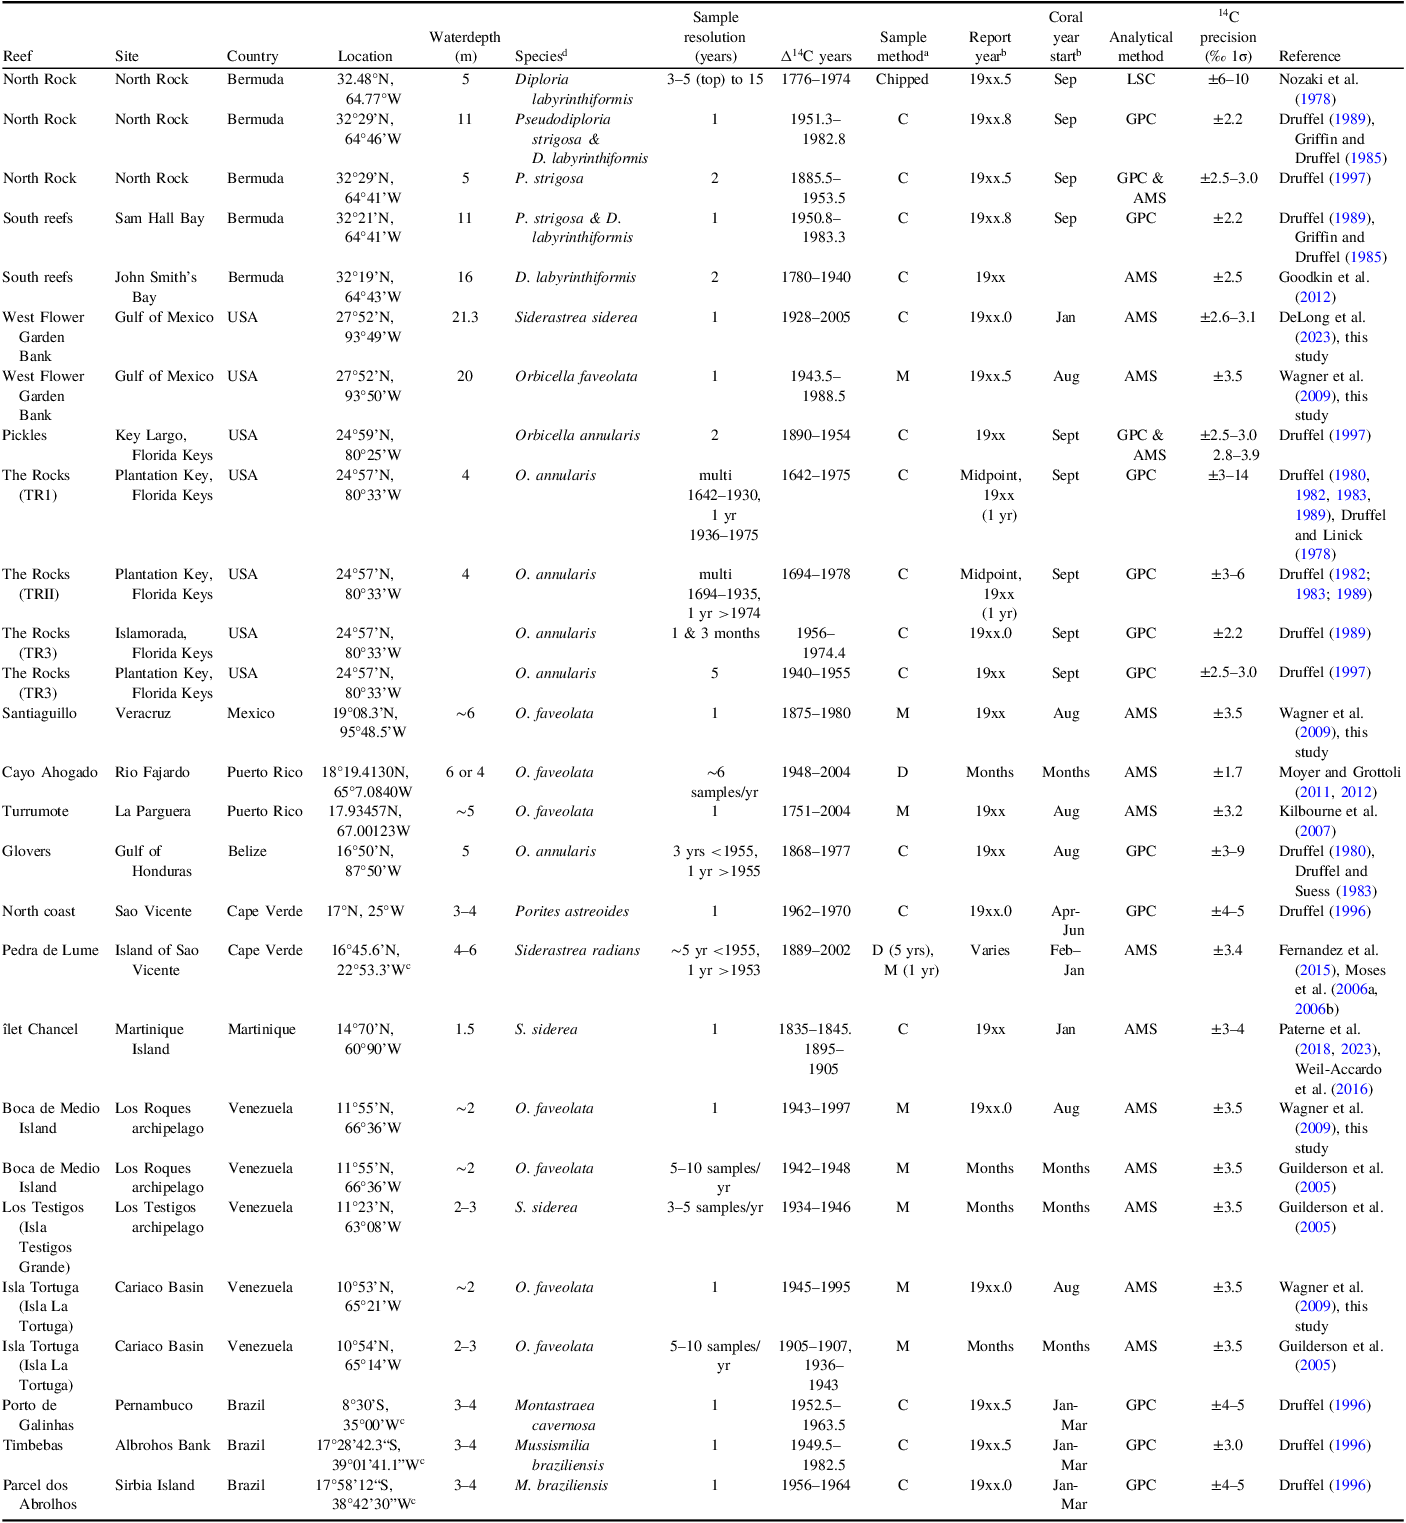
a Sample extraction method C = cut 1-year (yr) band from coral, M = micromill along thecal wall for 1-yr, and D = hand-held drill to remove powder.
b The “Report year” is how the authors originally reported their year data. The “Coral year start” is the coral year assumed by authors or the generally accepted coral year for that species. Some authors shifted their reported year to the mid-point of the sample, and others used the first month or calendar year of the sample.
c Several of the latitude and longitude given for the study sites in the original reference (Druffel Reference Druffel1996) are incorrect. Porto de Galinhas was given as 8°30’S, 35°00’E, but this location is in the interior of Africa. Changing E to W is correct for Porto de Galinhas, Brazil. Sirbia Island in Parcel dos Abrolhos Reefs is near 17°58’12”S, 38°42’30”W, and the coordinates given in the original paper (17°49’S, 30°44’W) occur in deeper South Atlantic Ocean waters. The coordinates given for Timbabas Reef (17°30’S, 39°20’W) are on land in Brazil, and “Timbabas” is also spelled as “Timbebas.” Other studies cite (17°28’42.3”S, 39°01’41.1”W) (Bruce et al. Reference Bruce, Meirelles, Garcia, Paranhos, Rezende, de Moura, Filho, Coni, Vasconcelos and Amado Filho2012) as the location of Timbebas Reef in the northern part of Albrohos Bank near the coast. Note that Druffel (Reference Druffel1996) refers to Timbebas as CABO Abrolhos, Brazil in their data table and we used the reef name for this table. Pedra de Lume in the Cape Verde Islands was given as 16°45.6’N, 22°53.3’E in the original reference, but this location is located in the interior of Africa; the correct coordinates are 16°45.6’N, 22°53.3’W.
d Liquid Scintillation Counting is LSC, Gas Proportional Counting is GPC, and Accelerator Mass Spectrometry is AMS.
Note: The genus name for Montastraea annularis and M. faveolata was changed to Orbicella, and Diploria strigosa was renamed Pseudodiploria strigosa (Budd et al. Reference Budd, Fukami, Smith and Knowlton2012) after many of these studies were published. We refer to the currently accepted names for these corals. Additionally, M. annularis and M. faveolata are sometimes interchanged in the literature such that early studies used M. annularis when the coral was M. faveolata. Currently, a coral with a round boulder shape is O. faveolata, and a coral with a more columnar structure is O. annularis.
Coral radiocarbon sites in the Atlantic Ocean. Radiocarbon values of seawater DIC (0–25 m water depth) collected between 1981 and 1983 from GLODAP v2.2022 (Key et al. Reference Key, Olsen, van Heuven, Lauvset, Velo, Lin, Schirnick, Kozyr, Tanhua and Hoppema2015; Olsen et al. Reference Olsen, Key, van Heuven, Lauvset, Velo, Lin, Schirnick, Kozyr, Tanhua and Hoppema2016) and coral radiocarbon values for the same time interval are outlined in black for sites in Table 1. Coral sites with no color fill do not have data for this time interval. Major surface currents are schematically represented by the black lines with arrows and labeled in italics (CC = Caribbean Current, FC = Florida Current, LC = Loop Current, MC = Mexican Current, NBC = North Brazil Current, NEC = North Equatorial Current, NECC North Equatorial Counter Current, and SEC = South Equatorial Current) (Fratantoni Reference Fratantoni2001). The map showing bathymetry was generated using Ocean Data Viewer (Schlitzer and Reiner Reference Schlitzer2024).
Three of the new coral Δ14C records are from the Gulf of Mexico (Table 1; Figure 1), a semi-enclosed basin in the western Atlantic Ocean northwest of the Caribbean Sea. Waters in the Gulf of Mexico are warm saline waters with a mixture of waters from the Caribbean Sea (Alvera-Azcrate et al. Reference Alvera-Azcrate, Barth and Weisberg2009) with small contributions of riverine waters (∼1–2%), particularly waters that enter the northern gulf from the Mississippi River. The northern extent of the Loop Current varies seasonally and sheds eddies that migrate and persist for many weeks (Alvera-Azcrate et al. Reference Alvera-Azcrate, Barth and Weisberg2009; Molinari et al. Reference Molinari, Baig, Behringer, Maul and Legeckis1977; Sturges and Evans Reference Sturges and Evans1983). Surface waters are estimated to reside in the gulf for approximately a decade (Mariano et al. Reference Mariano, Ryan, Huntley, Laurindo, Coelho, Griffa, Özgökmen, Berta, Bogucki and Chen2016; Miron et al. Reference Miron, Beron-Vera, Olascoaga, Sheinbaum, Pérez-Brunius and Froyland2017). In general, waters in the east and south of the gulf, dominated by the fast-flowing Loop Current, exit through the Straits of Florida on a shorter timescale than waters in the west and north of the gulf, which are more influenced by the overlying winds and reside for longer.
Two new coral Δ14C records are from Flower Gardens Banks National Marine Sanctuary (FGBNMS), located in the northwestern Gulf of Mexico at the edge of the wide continental shelf (Table 1; Figure 1). The sanctuary contains two banks, East and West, with robust coral reefs growing on top of rising salt domes where the reef starts in ∼20 m of water depth. The third new record is from Santiaguillo Reef in the Veracruz Reef System National Park (VRSNP), located in the Bay of Campeche near Veracruz, Mexico, in the southwestern Gulf of Mexico (Table 1; Figure 1). The VRSNP has northern and southern coral reefs, with the northern reefs closer to Veracruz, and the southern reefs, including Santiaguillo Reef, are further (∼32 km) from the coastline and the urban center. Flower Garden Banks is located far from the coastline (>100 km) and coastal upwelling sites (Cochrane and Kelly Reference Cochrane and Kelly1986), whereas Santiaguillo can have shallow summer upwelling occurring offshore along the edge of the continental shelf (Zavala-Hidalgo et al. Reference Zavala-Hidalgo, Gallegos-García, Martínez-López, Morey and O’Brien2006). Northerly winds in the winter induce downwelling along the shelf near Veracruz, which is more intense than the south easterlies in summer, which induce shallow upwelling (Zavala-Hidalgo et al. Reference Zavala-Hidalgo, Romero-Centeno, Mateos-Jasso, Morey and Martínez-López2014).
The two new post-bomb coral Δ14C records for the southern Caribbean are from Isla Tortuga and Boca de Medio (Table 1; Figure 1) located near the Cariaco Basin off the northern coast of Venezuela. Boca de Medio is in the Los Roques archipelago outside the basin and represents a well-mixed, non-upwelling site. Isla Tortuga is located at the northern margin of the Cariaco Basin. Trade winds blowing along the northern coast of Venezuela result in Ekman drift-induced shallow upwelling (Astor et al. Reference Astor, Muller-Karger and Scranton2003; Muller-Karger and Castro Reference Muller-Karger and Castro1994; Richards Reference Richards1975).
Methods
The new coral cores were extracted from live coral colonies using an underwater hydraulic drilling system. Divers cored vertically down from the top center of the coral colony. Coral core WFG1 was recovered in May 1990 from West Flower Garden Bank in the FGBNMS, and core 91VC-7 was recovered in 1991 from Santiaguillo Reef offshore from Veracruz, Mexico (Figure 1). Cores WFG1 and 91VC-7 were recovered from large, boulder-shaped O. faveolata coral colonies (previously known as Montastraea faveolata or Montastraea annularis (Budd et al. Reference Budd, Fukami, Smith and Knowlton2012; Knowlton and Budd Reference Knowlton, Budd, Cheetham, Jackson, Lidgard and McKinney2001)). Core 05WFGB3-1 was extracted from a large boulder-shaped Siderastrea siderea coral colony in the FGBNMS in May 2005 under permit FGBNMS-2005-002. Two O. faveolata corals were cored offshore of Venezuela near Boca de Medio Island (core BM98/1) in 1998 and Isla Tortuga (core TOR96-1) in 1996 by Julia Cole (Guilderson et al. Reference Guilderson, Cole and Southon2005; Reuer et al. Reference Reuer, Boyle and Cole2003; Wagner et al. Reference Wagner, Guilderson, Slowey and Cole2009). Three of the coral radiocarbon records (91VC-7, WFG1, TOR96-1) were part of a dissertation (Wagner Reference Wagner2009) and were not formally published as a whole except for some of the pre-bomb data (Wagner et al. Reference Wagner, Guilderson, Slowey and Cole2009). The FGBNMS S. siderea radiocarbon data was presented in a paper for a candidate site for the Anthropocene Global Boundary Stratotype Section and Points (GSSP) (DeLong et al. Reference DeLong, Palmer, Wagner, Weerabaddana, Slowey, Herrmann, Duprey, Martínez-García, Jung and Hajdas2023).
The coral cores were cut into slabs (∼8–10 mm thick) with a lapidary saw. The slabs were sonicated using deionized water and allowed to air dry. Core slabs were X-rayed to image density banding couplets that are counted to determine the year from the core top where the year is known from date of collection. For O. faveolata, the high-density bands were assumed to have formed during the boreal summer season (Fairbanks and Dodge Reference Fairbanks and Dodge1979; Hudson et al. Reference Hudson, Shinn, Halley and Lidz1976) during the warmest months (July, August, and September). For S. siderea, the high-density bands form in the winter months (January and February). The X-radiographs (Appendices Figure 1 in the Supplementary Materials) were referenced when removing annual samples for radiocarbon analysis (Table 1). The age models for the cores are assumed to be accurate within one year, except for the Isla Tortuga core TOR96-1, where there was more uncertainty due to breaks in the core and slabs.
Samples representing ∼one year were removed from the respective slabs for radiocarbon analysis. For the O. faveolata corals (WFG1, 91VC-7, BM98/1, and TOR96-1), samples were micromilled along the vertical axis along thecal walls at approximately monthly resolution and then equal masses were combined for each year for samples representing one year. Every other year after 1955 was measured for these O. faveolata corals (Appendices Tables 1, 3–5 in the Supplementary Materials). Additionally, pre-bomb radiocarbon was measured every fifth year between 1876 and 1941 for coral 91VC-7, with each sample representing one year. For the S. siderea coral 05WFGB3-1, annual coral pieces were cut using a handheld Dremel 200 tool with a 0.635-mm thick wheel blade (Appendices Table 2 in the Supplementary Materials). For consecutive annual sample years from 1950–1967, each year was cut as precisely as possible following the X-radiograph. The sample loss from the 0.635-mm blade is estimated as ∼1–2 months per cut or ∼2–4 months for consecutive samples. For sample years that were not consecutive (e.g., 1990, 1945), samples were cut a little larger (∼1 to 1.2 years) to account for loss due to cutting. After cutting, coral pieces were sonicated in deionized water to remove cuttings and dried.
For O. faveolata corals (WFG1, 91VC-7, BM98/1, and TOR96-1), radiocarbon measurements were made at the Center for Accelerator Mass Spectrometry at the Lawrence Livermore National Laboratory. For coral 05WFGB3-1, coral samples were analyzed at ETH Zurich Laboratory of Ion Beam Physics. Sample methods followed established protocols. Radiocarbon results are reported as F14C (fraction modern) (Reimer et al. Reference Reimer, Baillie, Bard, Bayliss, Beck, Bertrand, Blackwell, Buck, Burr and Cutler2004) and age-corrected Δ14C (‰) as defined by Stuiver and Polach (Reference Stuiver and Polach1977) and include background and δ13C corrections. The reproducibility of the CAMS measurements is better than ±3.5‰ (1σ) based on an in-house coral process standard and the ETH measurements are ±2.6–3.1‰ (1σ).
Previously published Atlantic Ocean coral Δ14C results and metadata were compiled from the NOAA Paleoclimatology website and published papers (Table 1). For sites with more than one record from the same coral or location, the coral Δ14C was compiled into a single record for this study. For example, the four records from The Rocks Reef (Table 1) (Druffel Reference Druffel1980, Reference Druffel1982, Reference Druffel1983, Reference Druffel1989, Reference Druffel1997; Druffel and Linick Reference Druffel and Linick1978) were averaged into a compiled annual average record. Data were transformed into annual averages for subannually resolved records. Some radiocarbon data for coral samples were reported for the mid-point of the sample year. In contrast, others were reported for the beginning of the sample year, or no information was provided. For this study, all coral records were truncated to a calendar year for analyses, which is within the age model uncertainties of all records. Means are reported with one standard deviation (±1σ), and decadal averages were determined with standard error of the mean; if only one determination occurred in the decade, analytical precision is used. Change-point analysis (ischange.m in MATLAB) was used to detect changes in linear slope, variance, or means for a specified number of changes (Killick et al. Reference Killick, Fearnhead and Eckley2012). We tested one to three change points and found two change points for linear slope picked the sudden increase in Δ14C from thermonuclear bomb testing consistently. This method is sensitive to the direction of the time series; therefore, results vary by one year when the direction of the time series is reversed; we used the earliest year or “past to present” direction.
Results
New coral Δ14C records
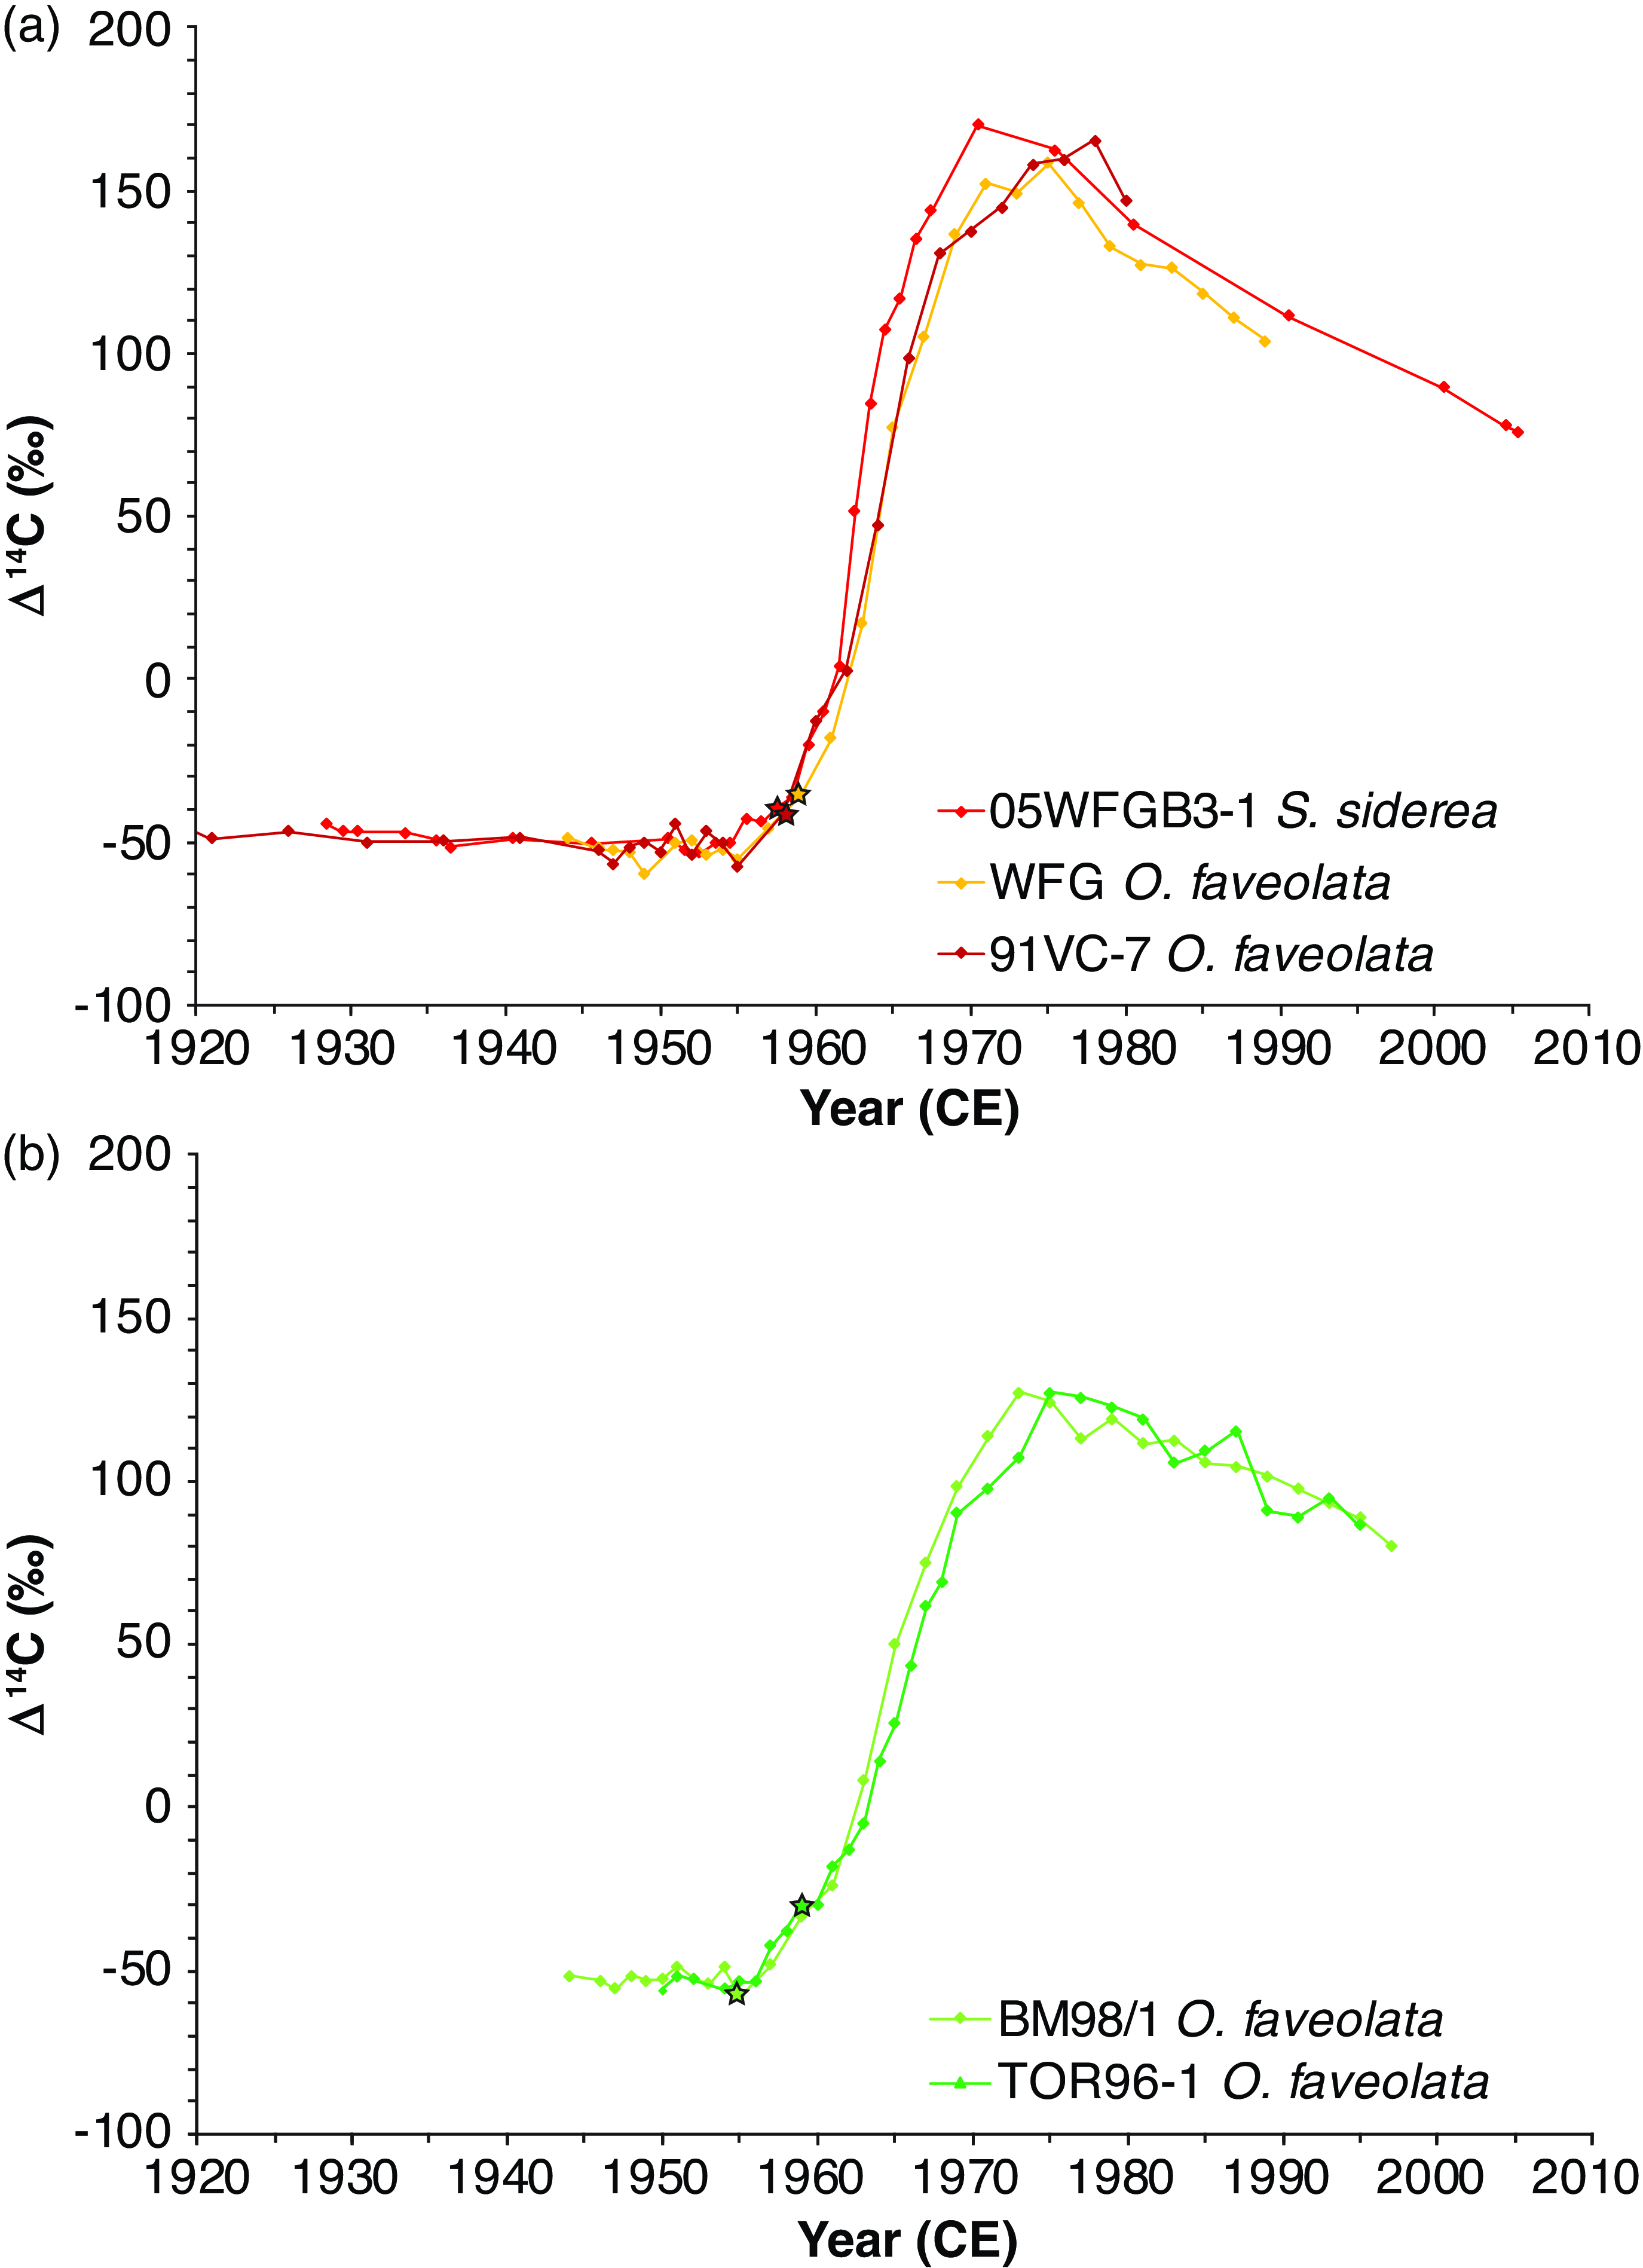
The three new Gulf of Mexico coral Δ14C records (05WFGB3-1, WFG1, and 91VC-7) from two coral species, S. siderea and O. faveolata, exhibit similar Δ14C annual variability (Figure 2A; Appendices Tables 1–3 in the Supplementary Materials) despite differences in coral species, laboratory analysis methods, sampling methods (cutting versus micromilling), and sampling intervals (calendar year versus summer-to-summer). The post-bomb coral Δ14C records from Venezuela (BM98/1 and TOR96-1) are presented here in formal publication for the first time (Figure 2B; Appendices Tables 4 and 5 in the Supplementary Materials). Both Venezuela records are from O. faveolata, and they exhibit similar Δ14C variability within the temporal resolution and dating uncertainties of each coral record. These two coral records were each combined into an annual average Δ14C with the pre-bomb records from Guilderson et al. (Reference Guilderson, Cole and Southon2005) for the remaining analyses presented here because they are from the same corals (Figure 3B).
The new coral Δ14C records for (a) the Gulf of Mexico and (b) Venezuela (Table 1). Each sample represents ∼one year of coral growth. The change-point analysis determined the years of increasing Δ14C (★) due to atmospheric nuclear weapons testing (Table 2). Dating uncertainties are estimated to be ≤ 1 year, and Δ14C uncertainties (2‰–3‰) are about the size of the diamond symbols.
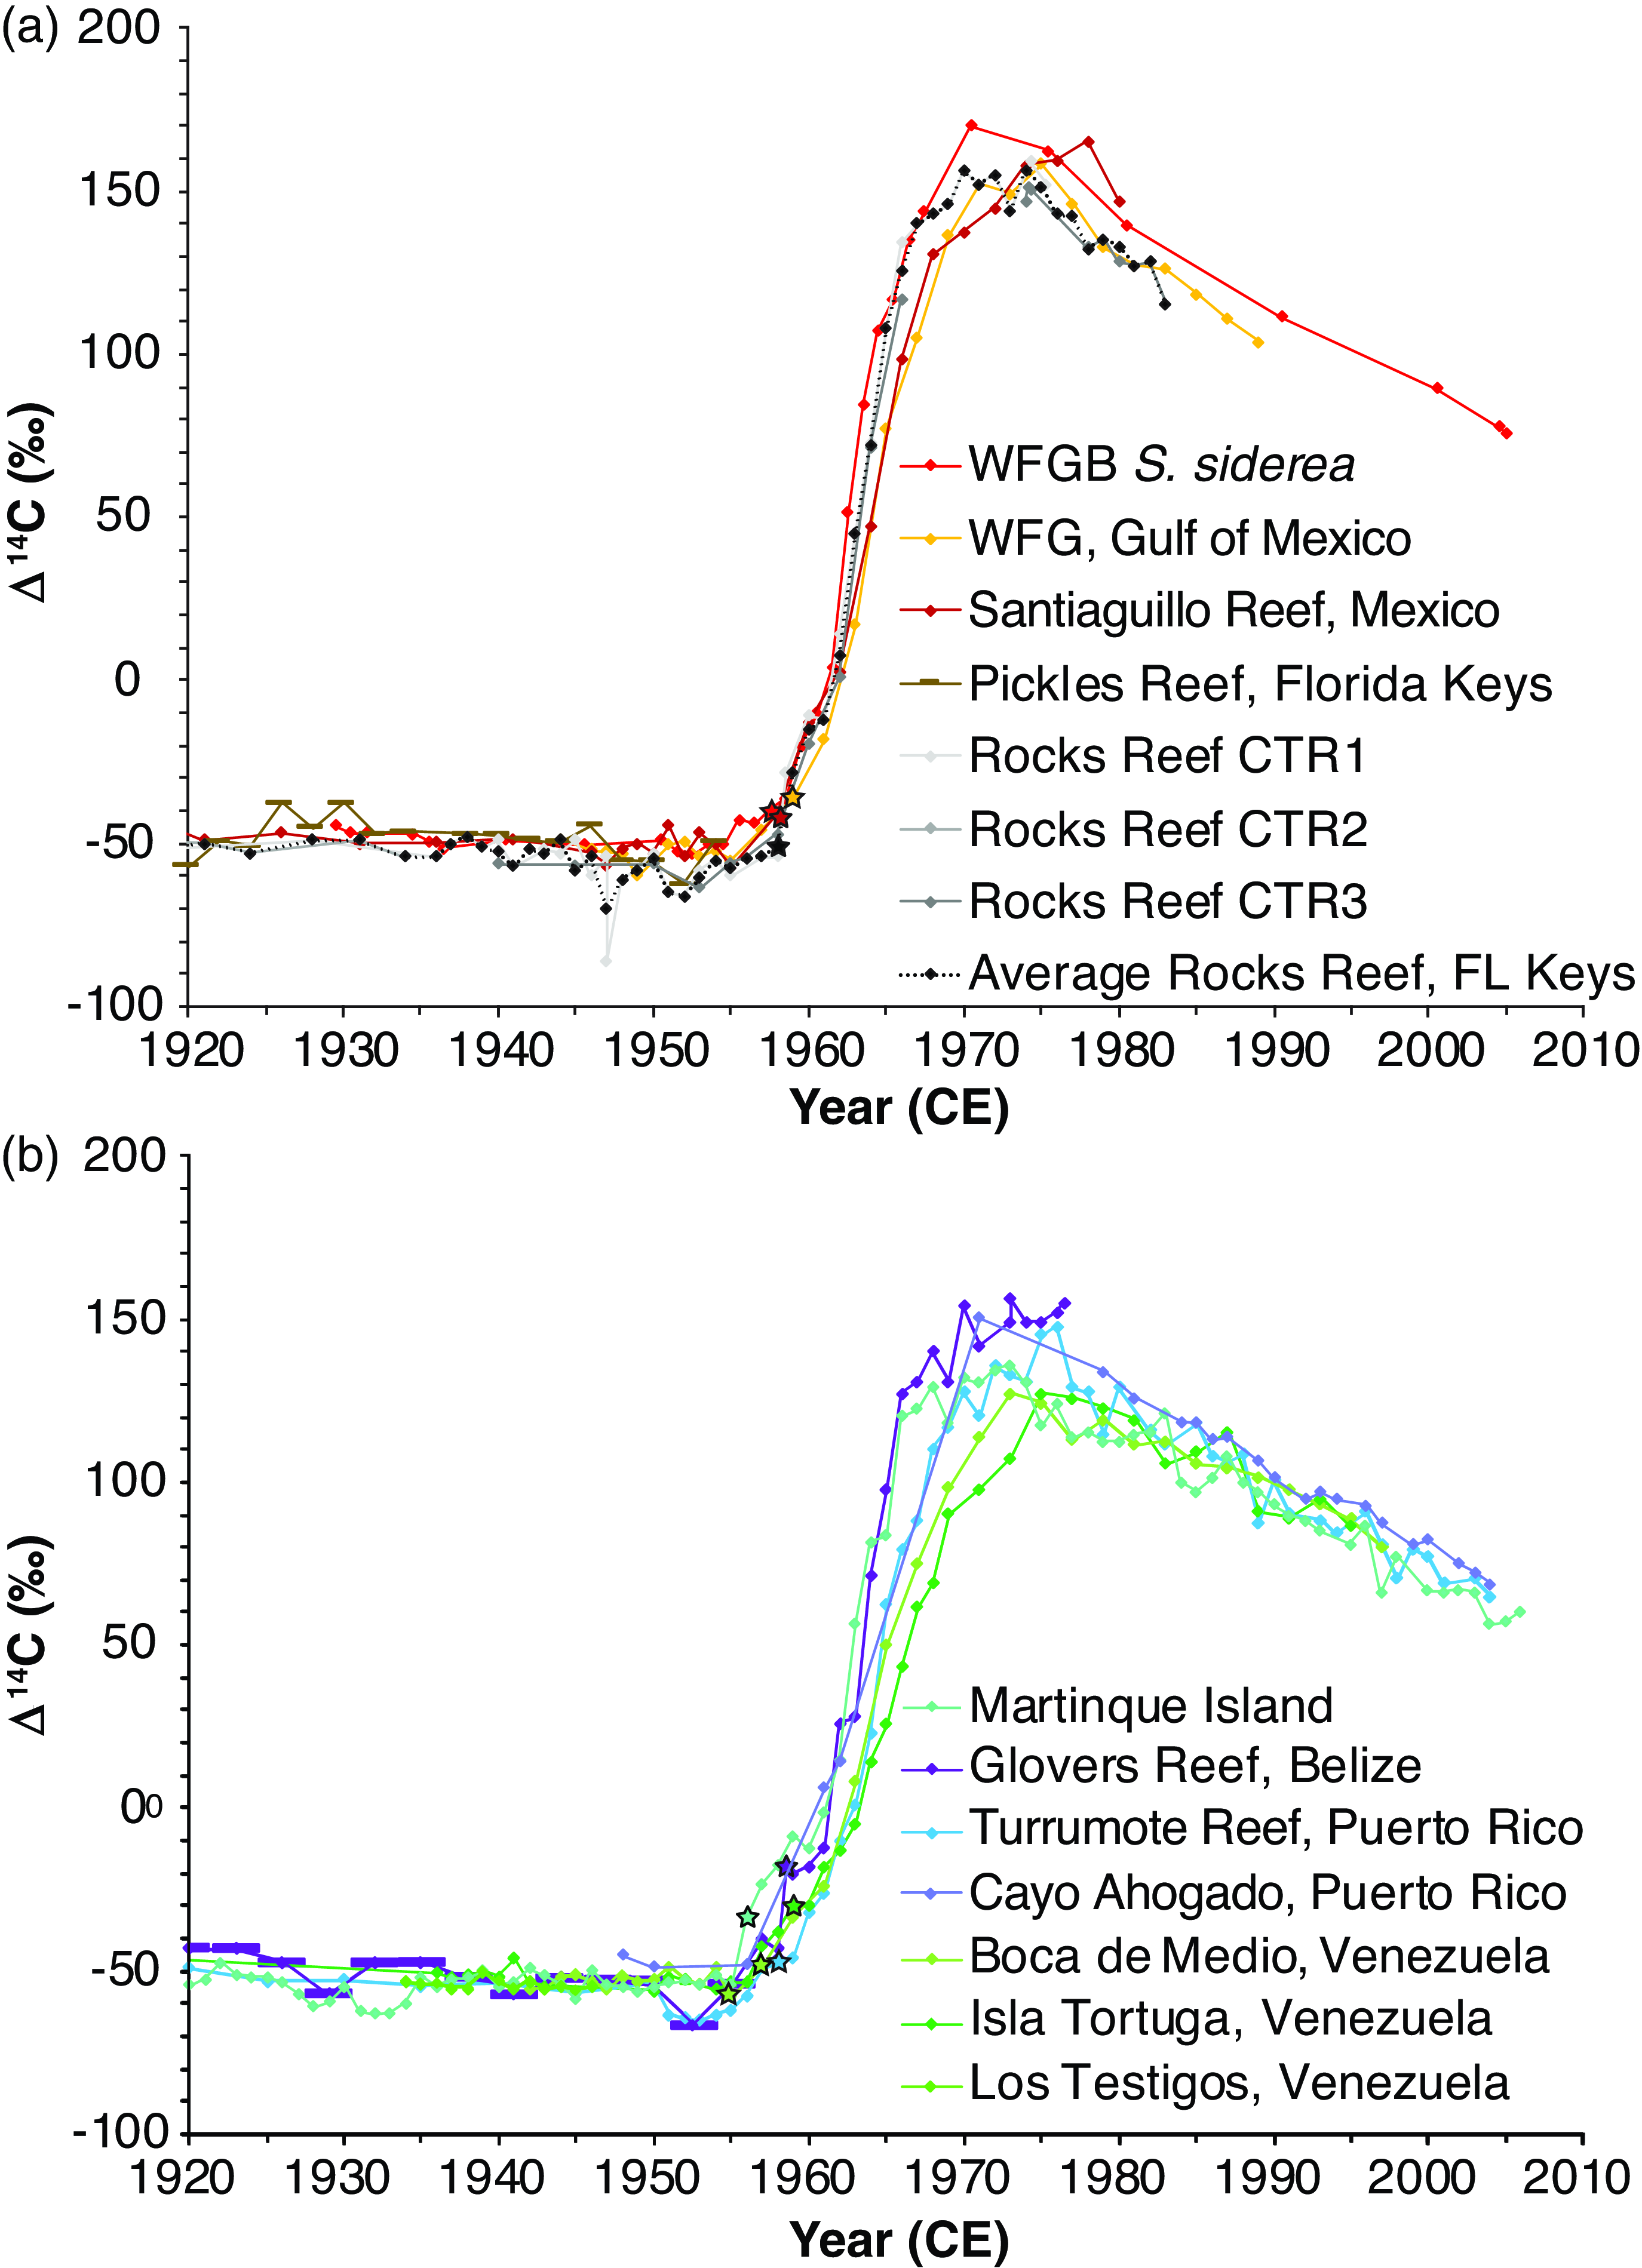
(a) The Gulf of Mexico and the Florida Keys, and (b) the Caribbean Sea coral Δ14C records. Site details and study references are given in Table 1. Results are plotted as in Figure 2 unless otherwise noted. Each sample represents one year of coral growth (◆) except for Pickles Reef where each sample represents an average of two years and for Glovers Reef (1872–1952.5) where samples are an average of three years (given by the width of the symbols). Δ14C uncertainties for studies using Accelerator Mass Spectrometry (AMS) (2‰–4‰) are about the size of the diamond symbols, and studies using other analysis methods have Δ14C uncertainties that vary between 2.1 and 14‰ (Table 1).
For coral cores with no evidence of missing years due to core breaks, the years were determined by counting annual density bands visible in X-radiographs (Appendices Figure 1 in Supplementary material), which are assumed to be accurate (DeLong et al. Reference DeLong, Maupin, Flannery, Quinn and Shen2016; Lough Reference Lough2010). Samples collected after core breaks can have band counting uncertainties when the fit between core sections is not tight (e.g., after 1931 in core 05WFGB3-1). The band counting chronology uncertainty accumulates for the older sections of a core with each core break (Comboul et al. Reference Comboul, Emile-Geay, Evans, Mirnateghi, Cobb and Thompson2014; DeLong et al. Reference DeLong, Quinn, Taylor, Lin and Shen2013). Core 91VC-7 has an excellent fit between all core sections with a clear alignment of density bands between core sections (Appendices Figure 1 in the Supplementary Materials); therefore, we assume no time is missing in core breaks. These coral chronologies were verified for core 05WFGB3-1 with monthly coral Sr/Ca and δ18O variations that co-vary with monthly temperature records (DeLong et al. Reference DeLong, Palmer, Wagner, Weerabaddana, Slowey, Herrmann, Duprey, Martínez-García, Jung and Hajdas2023; Weerabaddana et al. Reference Weerabaddana, DeLong, Wagner, Loke, Kilbourne, Slowey and Hu2021) and an unpublished monthly coral Sr/Ca record for 91VC-7. We found a five-month gap in 1931 between the top two core sections of 05WFGB3-1 due to slight rotation of core sections when slabbing based on the coral Sr/Ca variations and comparing with the temperature record for this site (ERSST version 5 for the grid box containing the coral site (Huang et al. Reference Huang, Thorne, Banzon, Boyer, Chepurin, Lawrimore, Menne, Smith, Vose and Zhang2017)). High precision uranium-thorium (230Th-234U) dating (better than ±1 years for corals <100 years old) (Shen et al. Reference Shen, Cheng, Edwards, Moran, Edmonds, Hoff and Thomas2003; Shen et al. Reference Shen, Li, Sieh, Natawidjaja, Cheng, Wang, Edwards, Lam, Hsieh and Fan2008) was used to validate the band-counted chronology for core 05WFGB3-1 (DeLong et al. Reference DeLong, Palmer, Wagner, Weerabaddana, Slowey, Herrmann, Duprey, Martínez-García, Jung and Hajdas2023). For corals 05WFGB3-1 and 91VC-7, the core sections sampled for radiocarbon analysis are continuous with little coral missing in the breaks (Appendices Figure 1 in the Supplementary Materials); therefore, we estimate accuracy to ±1 year. Core breaks in the Isla Tortugas coral (TOR96-1) necessitated adjusting the density band chronology using the radiocarbon peak compared with the timing of the peak for the nearby Boca de Medio coral core (BM98/1), which had clear annual bands and no chronological difficulties (Guilderson et al. Reference Guilderson, Cole and Southon2005; Wagner Reference Wagner2009).
Radiocarbon bomb spike onset
Interest in establishing a global time marker of anthropogenic influence has led to detailed comparisons of the onset of thermonuclear bomb fallout signals in different archives (Waters et al. Reference Waters, Syvitski, Gałuszka, Hancock, Zalasiewicz, Cearreta, Grinevald, Jeandel, McNeill and Summerhayes2015). The Gulf of Mexico corals (05WFGB3-1, WFG1, and 91VC-7) exhibit similar Δ14C values of ∼–50‰ before 1955, followed by an increase starting in 1957.5 (±0.5 year) for 05WFGB3-1, 1958 (±1 year) for 91VC-7, and 1959 (±1 year) for WFG1, as determined by change-point analysis for linear regime (Killick et al. Reference Killick, Fearnhead and Eckley2012) (Figure 2A; Table 2). The initiation of the bomb spike in the three Gulf of Mexico corals is within the dating uncertainty and sampling interval (every two years for WFG1 and 91VC-7) regardless of species. Similarly, the change-point analysis identified 1957 and 1958 as the initial Δ14C increase in the Venezuelan Boca de Medio and Isla Tortugas coral Δ14C records, respectively (Figure 2B; Table 2).
Change-point analysis results for bomb spike
* Change-point analysis was influenced by the time span of this record (1949.5–1982.5). The first increase from –50‰ occurs in 1959.5 (Figure 2B). This record is referred to as CABO Abrolhos, Brazil in Druffel (Reference Druffel1996).
** The high- and low-resolution records were combined for this analysis.
*** These records end in the early 1960s and thus do not capture maximum Δ14C.
The change-point analysis conducted on the new records was also applied to published studies from the wider Atlantic Ocean if the records spanned the bomb spike interval with sufficient resolution (Table 2). The Δ14C rise due to atmospheric weapons testing was in the late 1950s with most records indicating 1957–1959 (Appendices Figure 2 in the Supplementary Materials). The earliest bomb-spike onset was in 1956, determined from a newly published microatoll record from Martinique (Paterne et al. Reference Paterne, Druffel, Guilderson, Blamart, Moreau, Weil-Accardo and Feuillet2023). The latest change-point determination was in 1960.5 for Timbebas Reef, Brazil (Druffel Reference Druffel1996). This is a curious changepoint analysis result because the Δ14C record increases from –52‰ in 1958 to –35‰ in 1959, consistent with the results in most other coral Δ14C records.
Invasion of bomb radiocarbon
Atmospheric Δ14C equilibration with the ocean depends on not only air-sea isotopic exchange but ocean dynamical processes (e.g., upwelling, advection, lateral and vertical entrainment, and other mixing processes), which result in DIC Δ14C values (Mahadevan Reference Mahadevan2001). The balance of these processes results in different Δ14C trajectories of the invasion of bomb radiocarbon by water mass or geography (e.g., more positive Δ14C in gyres and lower Δ14C in upwelling regions). Thus, we group the coral-based surface water Δ14C reconstructions into spatial groups: the Gulf of Mexico (Figure 2A), Gulf of Mexico and the Florida Keys (Figure 3A), the Caribbean Sea (Figure 3B), western boundary current regions in the Atlantic (Figure 4), equatorial and South Atlantic (Figure 5A), and all Atlantic coral sites (Figure 5B). When discussing coral Δ14C results further, to emphasize location instead of core names, core 05WFGB3-1 will be referred to as “WFGB S. siderea,” core WFG1 will be referred to as “WFG, Gulf of Mexico,” and core 91VC-7 will be referred to as “Santiaguillo Reef, Mexico.”

(a) The Equatorial and South Atlantic coral Δ14C records and (b) all Atlantic coral Δ14C records. Site details and study references are given in Table 1 and plotted as in Figures 2–4 unless otherwise noted here. The Cape Verde Siderastrea radians samples are annual averages post-1955 and have a 5-year sample resolution pre-1955 represented by symbol width.

The timing and maximum of Δ14C from the bomb-14C invasion differ among and within these groupings, giving insight into which processes dominate. The Gulf of Mexico and the Florida Keys corals have peak Δ14C values between 1970 and 1978 ranging from 170‰ ±3‰ to 157‰ ±8‰ (Figure 3A; Table 2). The Caribbean Sea coral Δ14C records (Figure 3B; Table 2) have a smaller range in peak timing between 1973 and 1976 and maxima that span from similar to the Gulf of Mexico and the Florida Keys records (156‰ ±9‰ Glovers Reef, Belize), to much lower (127‰ ±3.5‰ for the Venezuelan coral records) with Martinique Island in between these extremes (136‰ ±3‰). The similarity between the Glovers Reef record and the Gulf of Mexico records led us to plot together all of the sites potentially influenced by the Atlantic Western Boundary Currents, including the Caribbean Current, Loop Current, Mexico Current, Florida Current, and Gulf Stream (Figure 4). Among these Western Boundary Current records, the Bermuda and Santiaguillo, Mexico records group together with later peaks around 1978, whereas Belize, northern Gulf of Mexico, and Florida records group together with earlier peaks between 1970 and 1975 (Table 2). The North Rock, Bermuda record by Nozaki (1978) is anomalous relative to other North Rock, Bermuda records (Druffel Reference Druffel1989, Reference Druffel1997) and is excluded from further discussion.
Expanding the perspective of bomb radiocarbon invasion, the Caribbean, Gulf of Mexico, and subtropical North Atlantic records are compared with those from the Equatorial and South Atlantic to generate a picture of Atlantic coral Δ14C records (Figure 5; Table 2). Coral Δ14C from South America, on the north (Venezuela) and south (Brazil) sides of the equator, share similar bomb carbon trajectories with maxima ranging from 138‰ to 127‰ between 1973 and 1975 (Figure 5A). Two of the Brazilian records end in the early 1960s, so they do not capture the regional peak Δ14C. The Cape Verde coral Δ14C from the eastern Tropical North Atlantic, where upwelling has a larger contribution (Fernandez et al. Reference Fernandez, Lapen, Andreasen, Swart, White and Rosenheim2015), has a different trajectory. The Cape Verde coral Δ14C rose steeply in the early 1960s, like other Atlantic coral Δ14C records, but slowly increased after 1965 until reaching a maximum of only 78‰ ±2.6‰ in the early 1990s (Table 2). Examining all the Atlantic Δ14C records as a whole (Figure 5B), there is a positive Δ14C gradient away from the equator, with increasing Δ14C values with increasing latitude.
Pre-bomb Δ14C
Characterizing natural Δ14C variability can be used to improve calendar calibrations of radiocarbon ages in marine samples for archaeologic and paleoceanographic applications and to elucidate changes in ocean circulation. The natural Δ14C gradients are small relative to the maximal post-bomb gradients depicted in Figures 1 and 5B and too small to uniquely tease apart subtle, with respect to Δ14C, water mass mixing in the low latitude western Atlantic. This observation was exploited by Wagner et al. (Reference Wagner, Guilderson, Slowey and Cole2009) in their coral-based pre-bomb reservoir age comparison of the Caribbean and Gulf of Mexico. To elucidate the spatiotemporal patterns of pre-bomb variability, we constructed decadal mean averages for each site: Flower Gardens, Belize, Santiaguillo, Puerto Rico, Martinique, Venezuela, and the Florida Keys. These sites sample the northern surface flow of the Atlantic Meridional Overturning Circulation (AMOC) and downstream of the upwelling of subantarctic waters in the eastern Atlantic (Toggweiler et al. Reference Toggweiler, Druffel, Key and Galbraith2019a). Interrogation of the data indicates that at the decadal level and using a 2σ criterion, these sites are statistically similar to each other (Appendices Figure 3 in the Supplementary Materials).
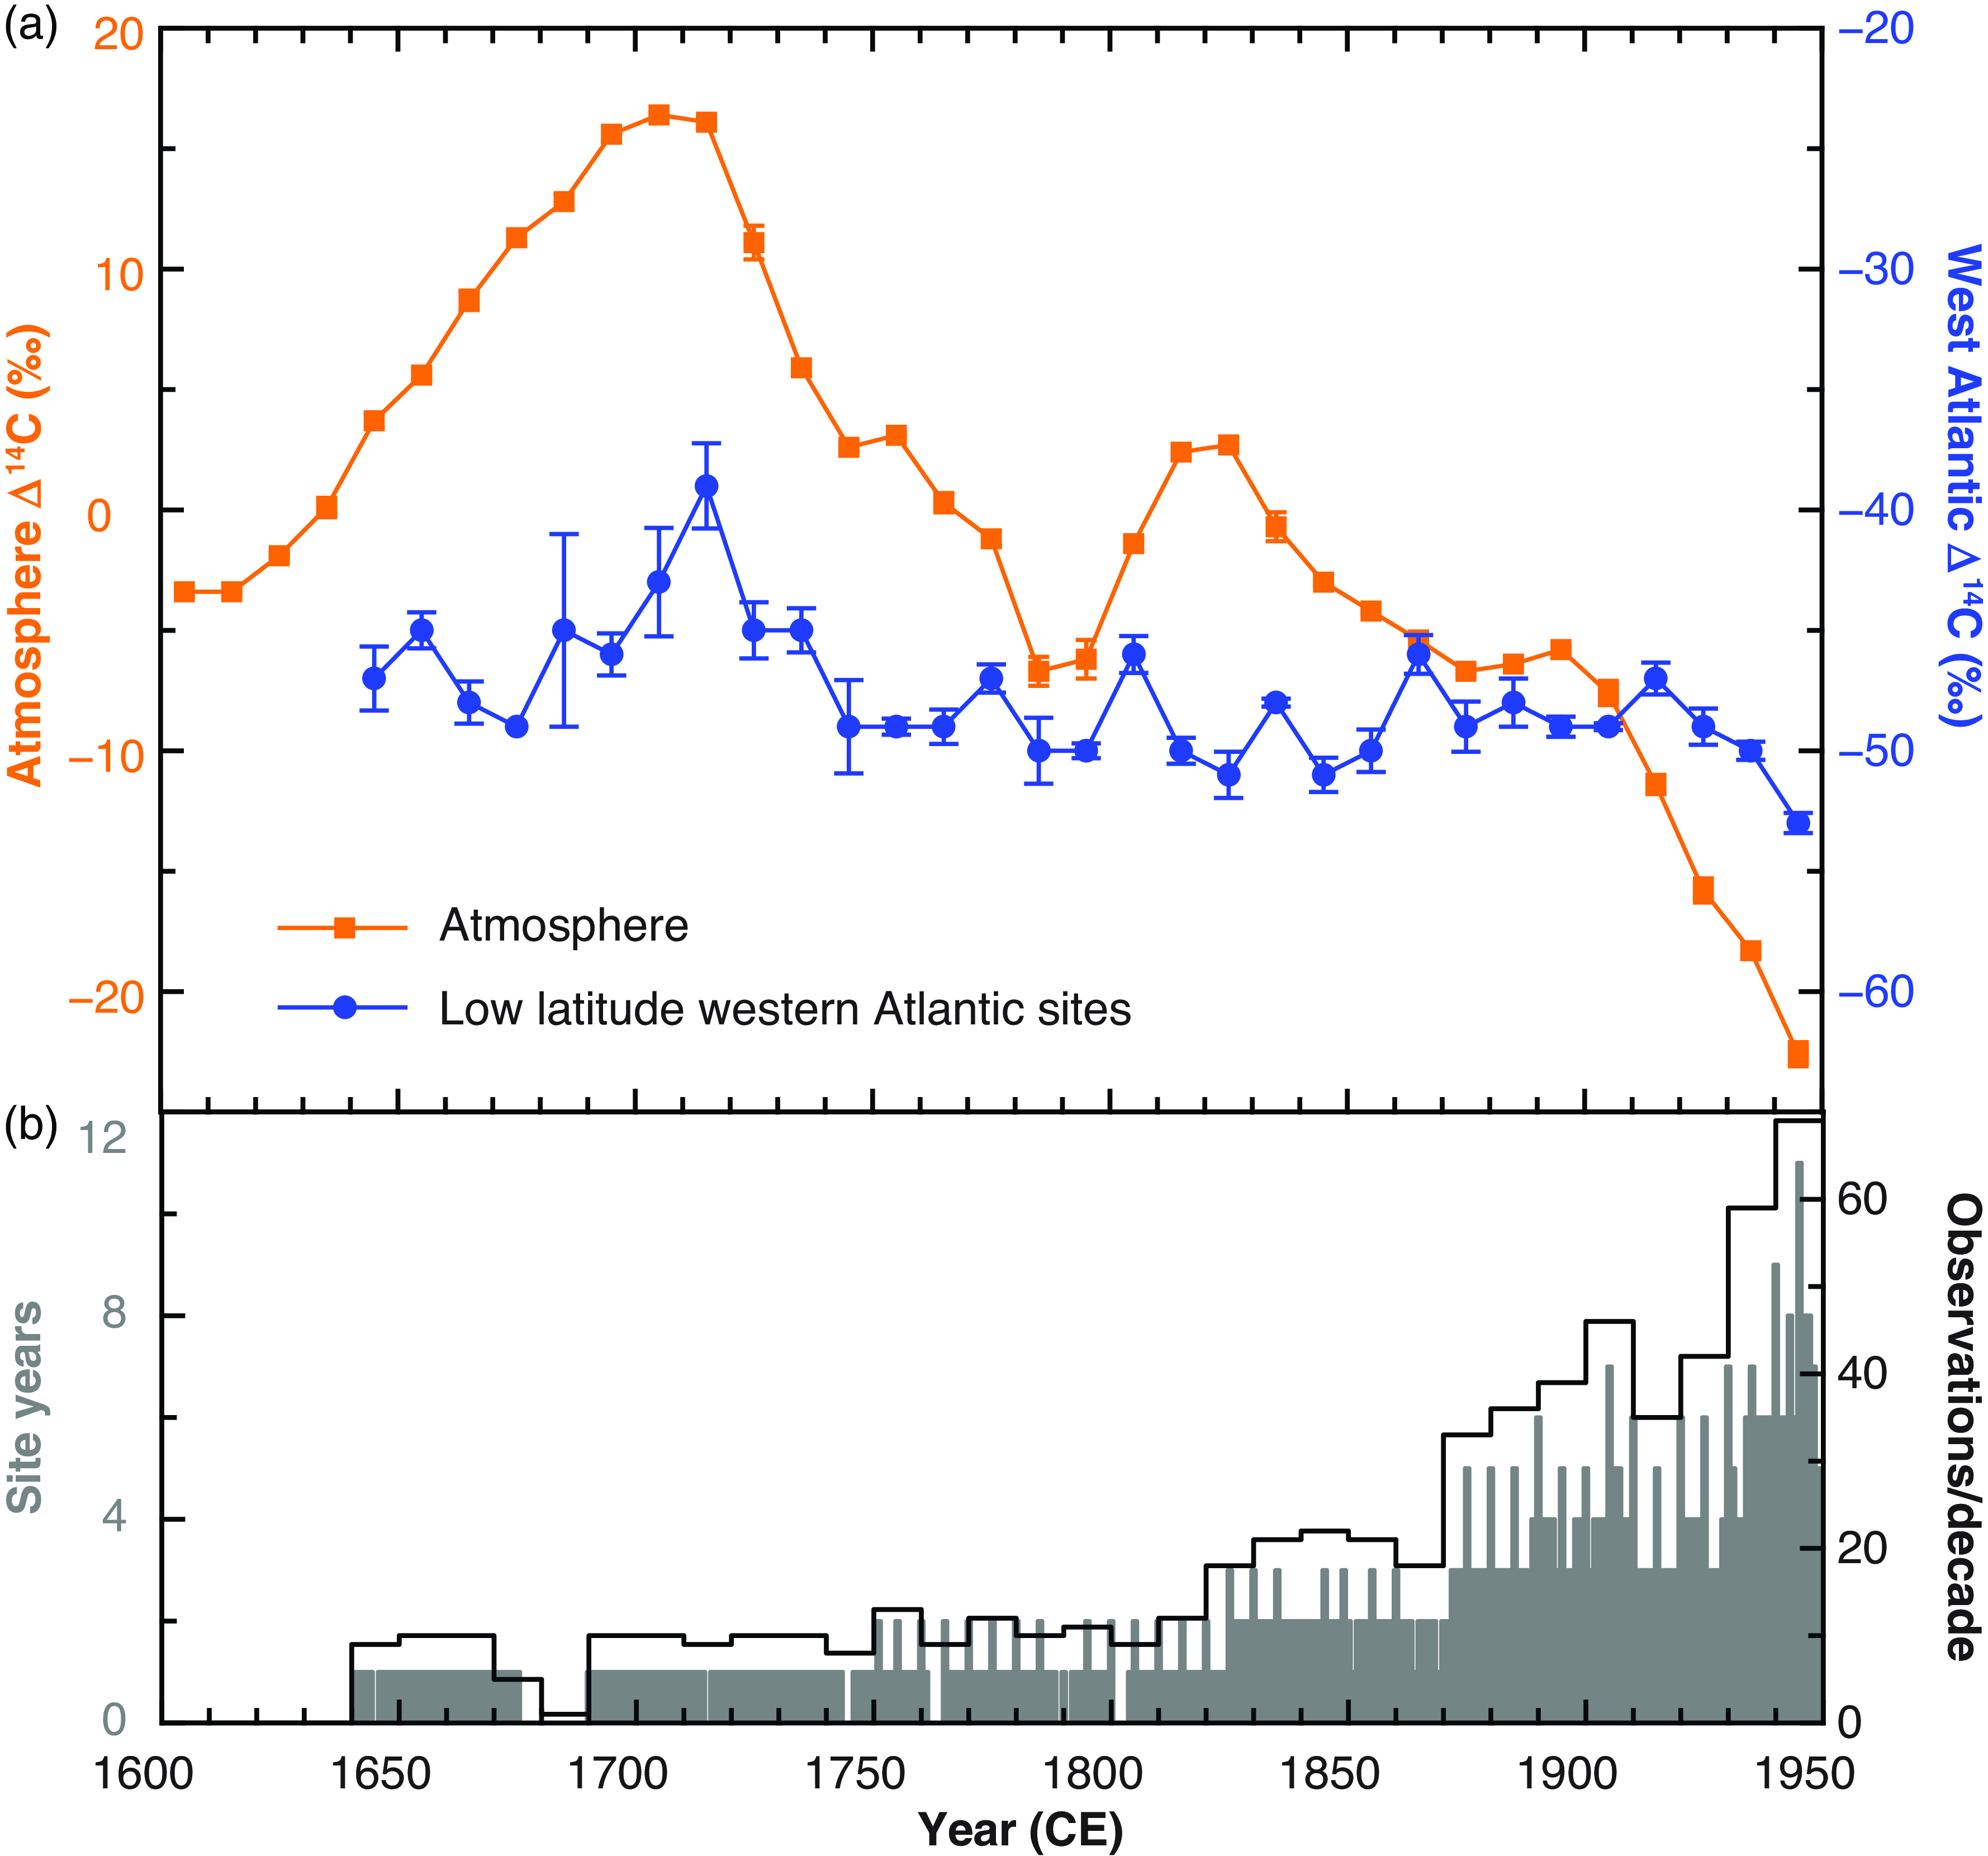
The similarity of the coral Δ14C from these sites, reflecting low latitude western Atlantic waters in the pre-bomb era, allows us to assume each observation comes from the same large-scale water mass and the annual values are samples of the same “pool.” Data density is highest in the 20th century, and there is less data density before the middle of the 19th century, albeit for many decades, there are still more than two samples per year. Using the analytical uncertainty as the weighting function, we constructed annual weighted means for these data and then combined them into weighted decadal averages back to the decade centered on 1645 (Figure 6). Before the 20th century, the compilation contains Martinique, Puerto Rico, Belize, Santiaguillo Reef, and the Florida Keys records and prior to the 19th century, the compilation includes the Puerto Rico and the Florida Keys records (Table 1). The low latitude western Atlantic’s decadal reservoir age value waxes and wanes, ranging from 255 to 501 years with an arithmetic average of 392 ±65 (1σ). With respect to Marine20 (Heaton et al. Reference Heaton, Köhler, Butzin, Bard, Reimer, Austin, Bronk Ramsey, Grootes, Hughen and Kromer2020), which has a ±60- to 70-year uncertainty across this time range, ΔR averages –158 ±19 years, ranging from –197 to –130 years.
(a) Surface water Δ14C for the low latitude western Atlantic Ocean versus Northern Hemisphere atmosphere Δ14C. Uncertainty is the standard error of the mean using the number of years sampled per decade. For the IntCal20 product (Reimer et al. Reference Reimer, Austin, Bard, Bayliss, Blackwell, Bronk Ramsey, Butzin, Cheng, Edwards and Friedrich2020), because it is modeling the original dendro-data, the standard error of the mean is smaller than the symbol size. Vertical axes span the same range (45‰). (b) Observations per decade are the skyline black line, and the number of site years is given as the grey histogram. For example, a site year of two indicates values for that year from two sites.
Discussion
Interpreting seawater Δ14C from coral radiocarbon
The vast majority of skeletal carbon, as calcium carbonate, in reef-building hermatypic corals is directly derived from DIC (Druffel and Linick Reference Druffel and Linick1978; Knutson and Buddemeier Reference Knutson and Buddemeier1973). The carbon isotope composition of the skeleton reflects the balance of direct and indirect sources of DIC, as well as factors that influence the isotopic composition of the photosynthate products and prey items. Indirect sources of carbon originally derived from the DIC pool include photosynthate products transferred from the coral’s symbiotic zooxanthellae and heterotrophy, usually of microscopic zooplankton (Grottoli Reference Grottoli2000). Modifications or complications arise due to rate-based or kinetic factors and putative “growth rate” effects (McConnaughey Reference McConnaughey1989). All of these metabolic and kinetic isotope effects impact 13C and 14C in proportion to their masses. Therefore, Δ14C includes a sample-specific or representative δ13C correction for mass-dependent fractionation processes (Stuiver and Polach Reference Stuiver and Polach1977), leaving only the DIC signal.
Age model considerations
Generating geochemical time series from aragonite samples taken at specific distances along a coral core requires the conversion of sample depth to time. The independent chronology or framework upon which the coral skeleton’s 14C measurements are placed has evolved to include sclerochronology, seasonal variations in stable isotope and minor element concentrations, and 230Th-234U dating (e.g., Broecker et al. Reference Broecker, Thurber, Goddard, Ku, Matthews and Mesolella1968; Edwards et al. Reference Edwards, Chen and Wasserburg1987). Frequently, two or more of the methods are used together. Sclerochronology relies upon annual high- and low-density skeletal band pairs (Hudson et al. Reference Hudson, Shinn, Halley and Lidz1976; Knutson et al. Reference Knutson, Buddemeier and Smith1972), a seasonal convolution of extension rate and mass accretion (Dodge and Brass Reference Dodge and Brass1984). Often visible to the naked eye, the most common method for visualizing the coral’s density bands is, after slabbing the coral core, to take X-radiographs or computerized tomography scans of the whole core (Bosscher Reference Bosscher1993; Helmle et al. Reference Helmle, Dodge, Ketcham, Moosa, Soemodihardjo, Soegiarto, Romimohtarto, Nontji and Suharsono2000). The seasonal geochemical variations, such as coral δ18O and Sr/Ca atomic ratios, are related to sea surface temperature (Epstein et al. Reference Epstein, Buchsbaum, Lowenstam and Urey1951; Smith et al. Reference Smith, Buddemeier, Redalje and Houck1979; Weber and Woodhead Reference Weber and Woodhead1970) and thus can also be used for time assignment. Uranium-thorium dating is particularly powerful in providing a dating framework when dealing with cores with bioerosion and multiple core breaks (e.g., Kilbourne et al. Reference Kilbourne, Quinn, Webb, Guilderson, Nyberg and Winter2010) or in verifying the veracity of the sclerochronology and geochemical-based age models (Black et al. Reference Black, Andersson, Butler, Carroll, DeLong, Reynolds, Schöne, Scourse, van der Sleen and Wanamaker2019; DeLong et al. Reference DeLong, Quinn, Taylor, Lin and Shen2013).
In the case of sclerochronology-based age models, reef-building corals can have stress bands, which could be interpreted as years (i.e., false years) (Hudson et al. Reference Hudson, Shinn, Halley and Lidz1976). Stress bands are common in Orbicella spp. and Diploria spp. corals and, to a lesser extent, in S. siderea, resulting in additive chronology uncertainty (Comboul et al. Reference Comboul, Emile-Geay, Evans, Mirnateghi, Cobb and Thompson2014). Most sclerochronology is performed on X-radiographs, which are helpful but can be misleading when the core is slabbed with corallites not transected longitudinally or if the slabs are too thick (Lough et al. Reference Lough, Barnes, Taylor, Jones, Bradley and Jouzel1996; Yudelman and Slowey Reference Yudelman and Slowey2022). These afflictions result in blurry bands and false bands (Barnes and Lough Reference Barnes and Lough1989, Reference Barnes and Lough1990, Reference Barnes and Lough1993; DeLong et al. Reference DeLong, Quinn, Taylor, Lin and Shen2013, Reference DeLong, Maupin, Flannery, Quinn and Shen2016), which make demarcating a year difficult and, in the case of false bands, adds to the age-model uncertainty. X-radiographs of Siderastrea spp. do not have the thin distinct high-density lines seen in Orbicella spp., Pseudodiploria spp., and Diploria spp. corals, even when slabbed properly (cf. species in Appendices Figure 1 in the Supplementary Materials). S. siderea has a denser skeleton with less distinct demarcation of high-density bands, and when not slabbed properly, the density bands are wavey and less clear (e.g., Figure 1 in DeLong et al. Reference DeLong, Maupin, Flannery, Quinn and Shen2016). Additionally, the newer higher-resolution digital X-ray systems are more capable of resolving the density bands in S. siderea compared with older analog film X-radiographs (cf. X-radiographs in DeLong et al. [Reference DeLong, Flannery, Maupin, Poore and Quinn2011] and Maupin et al. [Reference Maupin, Quinn and Halley2008]). Additionally, Orbicella spp. deposits its high-density band in summer (Hudson et al. Reference Hudson, Shinn, Halley and Lidz1976), whereas S. siderea tends to deposit its high-density band in winter (i.e., January). Among the compiled coral radiocarbon studies (Table 1), studies vary in how they report assign years to annual samples (if reported) as either the start of the calendar year (19xx.0), the mid-point of the year (19xx.5), or for the midpoint of summer-to-summer samples (19xx.0) resulting in an additional half-year uncertainty. In summary, the coral’s dating uncertainty depends on the coral species, the quality of the cores, the orientation of the corallite’s growth axis relative to the slab’s plane, the thickness of the slabs and quality of X-radiographs, how years are reported, and the skill of the person developing the chronology to discern stress and false bands from annual density bands.
Stable isotope ratios and element-to-calcium ratios (e.g., δ18O and Sr/Ca) are frequently used to establish subannual chronologies in conjunction with surface water radiocarbon reconstructions (e.g., DeLong et al. Reference DeLong, Palmer, Wagner, Weerabaddana, Slowey, Herrmann, Duprey, Martínez-García, Jung and Hajdas2023; Guilderson and Schrag Reference Guilderson and Schrag1998; Kilbourne et al. Reference Kilbourne, Quinn, Guilderson, Webb and Taylor2007). Comparing the variability in coral δ18O and/or Sr/Ca with a local or gridded SST products can provide confidence in the age model as well as cross-dating coral records from the same coral and reef (Black et al. Reference Black, Andersson, Butler, Carroll, DeLong, Reynolds, Schöne, Scourse, van der Sleen and Wanamaker2019; DeLong et al. Reference DeLong, Quinn, Taylor, Lin and Shen2012, Reference DeLong, Flannery, Poore, Quinn, Maupin, Lin and Shen2014). We note that breaks in the core can be problematic with time missing due to grinding and abrasion during coring or physical breakage and loss. Depending on the nature and physical effects of the core break, one or more years can be lost (DeLong et al. Reference DeLong, Quinn, Taylor, Lin and Shen2013). However, subannually resolved geochemical time series can be useful for assessing missing time when sampling paths overlap temporally above and below a core break, and in some cases, minimal loss is present (< 1 year), as is the case in core 05WFG3-1 between 1930 and 1931 where five months are missing in the coral Sr/Ca record.
Typically, age-model uncertainties become larger with the length of the coral core sequence and the time recorded. Most radiocarbon studies, although not always describing how coral chronology uncertainty was estimated, indicate an age uncertainty of ±1 year for post-bomb records, i.e., back to 1950 (Table 1). Previous studies report chronology uncertainties of 0 to 5 years/century for multi-centennial coral records (DeLong et al. Reference DeLong, Quinn, Taylor, Lin and Shen2013, Reference DeLong, Maupin, Flannery, Quinn and Shen2016; Dunbar and Cole Reference Dunbar and Cole1999; Felis et al. Reference Felis, Pätzold, Loya, Fine, Nawar and Wefer2000; Shen et al. Reference Shen, Li, Sieh, Natawidjaja, Cheng, Wang, Edwards, Lam, Hsieh and Fan2008; Swart et al. Reference Swart, Dodge and Hudson1996). Longer, older, and articulated records can take advantage of the accuracy and precision of 230Th-234U dating to provide an absolute framework to check for gaps and verify the coral’s chronology (DeLong et al. Reference DeLong, Quinn, Taylor, Lin and Shen2013; Kilbourne et al. Reference Kilbourne, Quinn, Webb, Guilderson, Nyberg and Winter2010).
Species and sampling differences
The coral-based Δ14C records compiled in this report used three sampling methods: (1) cutting chunks of coral using annual density bands as a guide, (2) using a hand-held drill to remove powder from a coral slab’s surface, with or without using annual bands as a guide, or (3) a computer-aided micromill to remove powder from a coral slab’s surface (Table 1). In the case of cutting chunks (annual or multiple years), the combination of the coral’s linear extension per year and the thickness of the cutting blade used to section the coral may introduce “lost time.” For example, cutting a chunk of coral from a slow-growing coral, such as S. siderea or Mussismilia braziliensis, with a linear extension between 4–6 mm/year with a wheel blade ∼0.6 mm thick would result in ∼1–2 months per cut not included in an annual sample. Faster-growing corals, such as Orbicella, Montastraea, Diploria, and Pseudodiploria corals, with a linear extension between 8–10 mm/year, would have less time lost in cutting samples (∼1 month). Drilling or milling, whether by hand or computer-aided, can produce subannual records with fidelity and no missing time, which can be, if needed, recombined into “annual” samples for analysis.
To assess if species differences and sampling methods influence the coral Δ14C results, we compared S. siderea (05WFGB3-1) to two O. faveolata coral records, WFG1, which is close to 05WFGB3-1 and 91VC-7 from Veracruz, Mexico in the southern Gulf of Mexico (Figures 1 and 2), all sampled with annual resolution but with different sampling methods: bulk cutting one year from coral versus micromilling only the thecal wall of the coral (Table 1). The Veracruz coral Δ14C closely tracks the WFG1 coral Δ14C of the same species and sampled with the same method. In all three of these Gulf of Mexico coral Δ14C records, the rapid increase in 14C associated with atmospheric testing occurs in the same year within sampling intervals and dating uncertainties (±1 year; Figure 2). Although there are visual differences in the post-bomb reconstructions, in general, individual values pass the 2σ criterion test. Part of this is undoubtedly the difference in skeletal biomineralization in putative annual samples. S. siderea is thought to have a slight warm season bias, i.e., more coral mass is laid down during the summer (Kuffner et al. Reference Kuffner, Hickey and Morrison2013), whereas Orbicella spp. can have a cold season bias (Dodge and Brass Reference Dodge and Brass1984; Fairbanks and Dodge Reference Fairbanks and Dodge1979). However, these seasonal biases could be site-specific and/or a sampling bias due to the deeper calix of Orbicella spp. and the mixing of skeletal material deposited at different times (Leder et al. Reference Leder, Swart, Szmant and Dodge1996; Swart et al. Reference Swart, Elderfield and Greaves2002). In ascertaining a single year of the post-bomb peak value, caution is needed because none of these three records are completely continuous, with the S. siderea record switching to analysis every five years post-1970 and the O. faveolata records were analyzed every other year after 1955.
Radiocarbon studies in the Pacific and Indian Oceans generally use Porites spp. corals thus differences among genera were not accessed (Grottoli and Eakin Reference Grottoli and Eakin2007; Lindauer et al. Reference Lindauer, Hadden, Macario and Guilderson2022), whereas the Atlantic corals studies use a wider range of coral genera (Table 1). We note that there are no differences in pre-bomb values between the two genera from Flower Garden Banks or when expanding to include Orbicella sp. from Veracruz. Similar comparisons can be made with other coral locations. From Bermuda, two species of brain corals (P. strigosa and D. labyrinthiformis) have been used with no differences within chronological and analytical uncertainties (Figure 4; Appendices Figure 3 in the Supplementary Materials). The Cape Verde corals (Siderastrea radians and Porites astreoides) are different genera and overlap for seven years and they generally agree with each other. The same is true for the corals from Brazil (Montastraea cavernosa and M. braziliensis). For the Venezuela corals (S. siderea and O. faveolata), the Los Testigos S. siderea was sampled for the pre-bomb interval and agrees with the nearby O. faveolata corals within uncertainties. The observations indicate that these hermatypic reef-building corals are reliable recorders of surface water Δ14C with no genus or species bias whereas mollusk shells do show differences among species likely due to varied habitats and diets (Lindauer et al. Reference Lindauer, Hadden, Macario and Guilderson2022).
Radiocarbon bomb spike onset
The Anthropocene Working Group evaluated many natural archives to serve as the GSSP marking the lower boundary of the Anthropocene, including corals (Waters et al. Reference Waters, Turner, Zalasiewicz and Head2023). Corals have exceptional dating accuracies, on par with cross-dated tree-ring chronologies (Black et al. Reference Black, Andersson, Butler, Carroll, DeLong, Reynolds, Schöne, Scourse, van der Sleen and Wanamaker2019). The synthesis provided here, including new results from the Gulf of Mexico and Venezuela, documents a consistent increase in Δ14C for the Northern Hemisphere Atlantic Ocean at 1958 ±1 year. Similar to the hemispheric delay in atmospheric Δ14C, the Southern Hemisphere corals increase in 1959 ±1 (Waters et al. Reference Waters, Turner, Zalasiewicz and Head2023; Zinke et al. Reference Zinke, Cantin, DeLong, Palmer, Boom, Hajdas, Duprey, Martínez-García, Rose and Roberts2023). This nearly contemporaneous rapid uptick in coral Δ14C, coupled with the excellent chronologies provided by corals, provides a potential global GSSP marker almost to the year, a property most GSSPs do not have (Waters et al. Reference Waters, Syvitski, Gałuszka, Hancock, Zalasiewicz, Cearreta, Grinevald, Jeandel, McNeill and Summerhayes2015).
Spatial patterns of bomb 14C invasion
Two primary processes affecting the Δ14C of the surface ocean are (1) the rate at which the surface water equilibrates with the atmosphere, which is related to gas exchange rates, a function of wind speed and thickness of the mixed layer, and the residence time of the water at the surface where gas exchange occurs, and (2) the hydrographic regime of the area determines the net horizontal and vertical mixing of the source water. The coral-based seawater radiocarbon records from the low-latitude Atlantic (Figures 2–5) demonstrate the balance between mixing different source waters and air-sea equilibration. Such a balance can provide a basis to categorize the Δ14C records into three main groups.
The first group of Δ14C records contains the highest peak radiocarbon values and represents areas of the ocean with longer surface water residence times and greater air-sea gas exchange, thus facilitating isotopic equilibration between the ocean and the atmosphere. The classic examples of this group are the Δ14C records from Bermuda (Table 1; Figure 4). Additionally, in this group are the Gulf of Mexico records from Flower Garden Banks and Santiaguillo, Mexico, as well as the Florida Keys and Belize records (Table 1). Although not in the major North Atlantic gyre such as Bermuda, these other records lie in more local circulation gyres, such as in the Gulf of Honduras (Belize) and the Bay of Campeche (Santiaguillo, Mexico) (Pérez-Brunius et al. Reference Pérez-Brunius, García-Carrillo, Dubranna, Sheinbaum and Candela2013). The Flower Garden Banks and the Florida Keys sites are bathed in waters coming off the western boundary current (Loop Current and Florida Current, respectively) (Mildner et al. Reference Mildner, Eden and Czeschel2013), but both sit slightly outside the main path. In the case of Flower Garden Banks, the Loop Current sheds eddies that propagate westward, bringing water from the Caribbean into the western Gulf of Mexico (Chang and Oey Reference Chang and Oey2012; Sturges and Evans Reference Sturges and Evans1983; Vukovich Reference Vukovich1995). Similarly, in the Florida Keys, the Florida Current impinges on the shelf regularly, bringing with it Caribbean water, but the coastal circulation near the sampling sites is dominated by eddies that develop between the swift-moving boundary current and the coastline (Kourafalou and Kang Reference Kourafalou and Kang2012; Lee et al. Reference Lee, Leaman, Williams, Berger and Atkinson1995). This highlights the importance of site selection and local oceanographic features to influence some of the details of the ocean radiocarbon, especially in the post-bomb era.
At the other end of the spectrum are the Cape Verde Island Δ14C records (Table 1; Figure 5), dominated by upwelling, vertical mixing, and entrainment of surface waters. This site lies close to a major global upwelling region (Barton et al. Reference Barton, Arístegui, Tett, Cantón, García-Braun, Hernández-León, Nykjaer, Almeida, Almunia and Ballesteros1998; Mittelstaedt Reference Mittelstaedt1991) and is bathed in a combination of low-14C upwelled subthermocline waters and higher 14C subtropical gyre waters (Fernandez et al. Reference Fernandez, Lapen, Andreasen, Swart, White and Rosenheim2015; Schott et al. Reference Schott, Mccreary, Johnson, Wang, Xie and Carton2004). Radiocarbon records from seawater and corals at this site have been interpreted as indicative of the oceanic subtropical cell and as evidence of the upwelling of Antarctic Intermediate and South Atlantic Central water (Fernandez et al. Reference Fernandez, Lapen, Andreasen, Swart, White and Rosenheim2015; Toggweiler et al. Reference Toggweiler, Druffel, Key and Galbraith2019a, Reference Toggweiler, Druffel, Key and Galbraith2019b). The global deep-water circulation must move within the wind-driven circulation at the surface, including the subtropical cells, so that both interpretations can be correct.
The Cape Verde Δ14C time series demonstrates the strong impact of vertical mixing of lower Δ14C values subsurface water masses with more positive Δ14C surface water. The first decade post-bomb is consistent with a surface water response to a rapidly rising atmosphere 14CO2, which dominates the response (c.f., Graven et al. Reference Graven, Gruber, Key, Khatiwala and Giraud2012; Mahadevan Reference Mahadevan2001). After 1964, the rate of change levels off. Forward and inverse box modeling work (Fernandez et al. Reference Fernandez, Lapen, Andreasen, Swart, White and Rosenheim2015) implies that interannual changes in the amount of upwelling could be responsible for the sudden slope change and high variance between 1964 and 1980, when the isotopic gradients were at their peak, whereas the extended period of increasing Δ14C after 1980 is likely a signal of bomb carbon reaching the site in the lower limb of the subtropical cell (Fernandez et al. Reference Fernandez, Lapen, Andreasen, Swart, White and Rosenheim2015).
It can be difficult to determine the physical mechanisms that resulted in the observed time series for surface pre- and post-bomb Δ14C reconstruction in upwelling systems due to the transient nature of bomb-radiocarbon. Relevant observational data from the atmosphere or ocean can better allow us to place the Δ14C in a dynamical framework (e.g., Guilderson and Schrag Reference Guilderson and Schrag1998; Kilbourne et al. Reference Kilbourne, Quinn, Guilderson, Webb and Taylor2007). This was done by Guilderson and Schrag (Reference Guilderson and Schrag1998) to elucidate a change in the waters tapped for upwelling in the eastern equatorial Pacific associated with an increase in Δ14C in 1976 and to distinguish against a simple “delay” due to the transient tracer nature of the bomb pulse and the ventilation timescale of the thermocline. Subsequent modeling studies have validated this approach and confirmed changes in the rate of formation of subantarctic mode water, in response to the overlying winds (e.g., Rodgers et al. Reference Rodgers, Aumont, Madec, Menkes, Blanke, Monfray, Orr and Schrag2004; Waugh and Hall Reference Waugh and Hall2005), which impacts the structure of the tropical Pacific thermocline. It is tantalizing to hypothesize that the Cape Verde record’s Δ14C change in slope, which occurred concurrently with that of the Eastern Equatorial Pacific, is related to the same Southern Hemisphere atmospheric forcing. This could be the topic of future data-model comparisons.
In between these two end members lie the coral Δ14C records representing mixtures of the low Δ14C upwelling-influenced waters and the high Δ14C more atmosphere-influenced waters. This group includes the Caribbean coral records from Puerto Rico, Martinique, and Venezuela, as well as the South Atlantic corals from the east coast of Brazil (Table 1; Figures 3B and 5). Westward equatorial currents diverge north and south as they impinge upon South America, moving poleward and mixing with subtropical waters of the central gyres in both hemispheres. This happens in the Caribbean (Johns et al. Reference Johns, Townsend, Fratantoni and Wilson2002) and also in the South Atlantic (Lumpkin and Garzoli Reference Lumpkin and Garzoli2005). Within the Caribbean, the post-bomb 14C records indicate a gradient exists (Figure 3B). The southern Caribbean sites have lower Δ14C in the post-bomb era, indicating lower Δ14C upwelling-influenced waters in the area, reflecting the equatorially sourced inflow to the Caribbean. Sites further north, such as Puerto Rico and Martinique, seem to be a mixture of equatorially sourced water and gyre water (Kilbourne et al. Reference Kilbourne, Quinn, Guilderson, Webb and Taylor2007; Paterne et al. Reference Paterne, Druffel, Guilderson, Blamart, Moreau, Weil-Accardo and Feuillet2023), the proportions of which may change through time and space.
The Martinique coral Δ14C record (Paterne et al. Reference Paterne, Druffel, Guilderson, Blamart, Moreau, Weil-Accardo and Feuillet2023) has a period in the mid-1950s to mid-1960s when its Δ14C was higher than other records in the region (Figures 3, 5A), which has been interpreted as indicative of a regional increase in upwelling. However, the age model uncertainties typical of boulder-shape corals of ±1–2 years can have an impact on the relative Δ14C during this time of rapid air-sea isotopic change. Age models and their uncertainties for surface-dwelling and horizontally extending microatolls, also impacted by tectonic uplift from earthquakes, may be difficult to constrain and thus have greater than typical coral uncertainties. The coral sampled for the Martinique Δ14C record is an S. siderea microatoll living in 1.5 m of water depth in a shallow lagoon, which experienced multiple exposures to the atmosphere from earthquakes that were enough to kill the top portion of the colony (Weil-Accardo et al. Reference Weil-Accardo, Feuillet, Jacques, Deschamps, Beauducel, Cabioch, Tapponnie, Saurel and Galetzka2016). Furthermore, the annually resolved coral δ18O and δ13C records (Paterne et al. Reference Paterne, Druffel, Guilderson, Blamart, Moreau, Weil-Accardo and Feuillet2023) are not as useful to determine the age model by comparing seasonal isotope ratio variability with annual density bands.
Pre-bomb surface water radiocarbon history in the low-latitude western North Atlantic
In addition to facilitating exploration of large-scale circulation, the compiled Δ14C data provide for the possibility of better calendar calibration of marine paleoceanography and coastal archaeology records during the centuries before the end of the Little Ice Age and the modern industrialized era, despite the fact that not all the individual records are 14C calibration quality data (cf. Reimer Reference Reimer2004). Western equatorial Atlantic surface water radiocarbon follows the atmosphere in the 17th century (Figure 6), much like one would predict in a 1-D box model where the disequilibrium flux results in a slight delay and a muted amplitude compared to the atmospheric forcing (e.g., Mahadevan Reference Mahadevan2001; Stuiver et al. Reference Stuiver, Pearson and Braziunas1986). During the Maunder Minimum (early 1700s), when atmospheric Δ14C increased, so did surface ocean Δ14C. Data density was admittedly low before the mid-1800s, but the pattern is suggestive that atmospheric 14C variations were a primary driver of surface ocean 14C. The pattern of the surface ocean being tied to the atmosphere broke down during the Dalton Minimum (early 1800s) and into the middle of the 19th century. Surface waters do not follow the atmosphere into the mid-1920s before the putative Suess Effect is visible and the surface ocean becomes older (lower 14C). A potential reason that low latitude Western Atlantic surface radiocarbon does not follow atmospheric forcing is the decadal-scale upwelling variability of low 14C water derived from the Southern Ocean in the eastern Atlantic (Toggweiler et al. Reference Toggweiler, Druffel, Key and Galbraith2019a; Toggweiler et al. Reference Toggweiler, Druffel, Key and Galbraith2019b). The estimated volumes of upwelled water exceed that predicted by local and regional winds and appear to be a direct consequence of the production of deep water in the North Atlantic, i.e., the formation of deep water causes the tropical thermocline to shoal, allowing low-14C subantarctic water to outcrop along the eastern margin (Toggweiler et al. Reference Toggweiler, Druffel, Key and Galbraith2019a). The study of Paterne et al. (Reference Paterne, Druffel, Guilderson, Blamart, Moreau, Weil-Accardo and Feuillet2023) leveraged their Martinique coral Δ14C record to explore subdecadal-scale variability. Atlantic Multidecadal Variability and related or independent changes in AMOC strength could result in variations in the intensity of this upwelling on longer timescales recorded in these downstream sites. It is worth noting that 1-D box models, such as those used by Stuiver et al. (Reference Stuiver, Pearson and Braziunas1986) and others when tuned to “pre-bomb” values, have a problem reproducing the northern mid-latitude gyre’s pre- and post-bomb transient (Guilderson et al. Reference Guilderson, Schrag, Druffel and Reimer2021; Reimer et al. Reference Reimer, Bard, Bayliss, Beck, Blackwell, Ramsey, Buck, Cheng, Edwards and Friedrich2013). We posit that part of this may be related to previously unrecognized multidecadal to centennial-scale changes in low-latitude upwelling intensity tied to AMOC. Ekman transport then sweeps the upwelled 14C waters into the mid-latitude gyres.
Conclusions
This study presents three new coral radiocarbon records from the Gulf of Mexico, including two different coral species from the same reef. The records of surface water Δ14C from the corals’ skeletons are similar. We compiled these records with previously available Δ14C records from the Atlantic Ocean. The compilation spans the transition from counting to accelerator mass spectrometry-based analyses and changes in sampling strategies afforded by accelerator-based analyses. Analysis of the timing of the onset of the bomb increase among all the individual records is consistent within dating and sampling uncertainties. For the sites north of the equator, the onset occurs in 1958 ±1 years, and for the (fewer) sites south of the equator, the onset occurs one year later in 1959 ±1–2 years.
For the post-bomb era, the Atlantic coral Δ14C records have an approximate north-to-equator decrease in maximum Δ14C values. This gradient reflects the balance between air-sea gas exchange, which is more important in the gyres, and regional differences controlled by the balance of air-sea gas exchange, vertical mixing, and horizontal advection. The records in Cape Verde Islands have the lowest Δ14C maximum values from the upwelling of interior waters sourced from subantarctic waters. The coral Δ14C records from the western boundary sites with recirculation gyres have similar Δ14C profiles, suggesting well-mixed waters and air-ocean exchange dominate the Δ14C signal.
The compiled Δ14C pre-bomb records from the western low latitude Atlantic are indistinguishable from each other at the decadal scale, acknowledging that not every site has all ten years per decade. This allowed for the construction of a decadal-resolved regional marine Δ14C value that can be used for reservoir corrections. For the time interval spanning 1650 to 1950, reservoir ages relative to IntCal20 ranged from 255 to 501 years with an arithmetic average of 392 ±65 (1σ). With respect to Marine20, ΔR ranged from –197 to –130 years and averaged –158 ±19. Surface ocean Δ14C responded in an expected fashion to the Maunder Minimum atmospheric Δ14C increase but did not respond to the subsequent Dalton Minimum Δ14C increase. A possible explanation for surface ocean Δ14C decreasing during and after the Dalton Minimum is a corresponding increase in the intensity of upwelling in the eastern Atlantic and a relatively larger influence of low-14C water of subantarctic origin. Future work in reconstructing past surface water Δ14C variations may provide insight not only into eastern Atlantic upwelling but also its connection with AMOC. For future coral-based 14C reconstructions, we recommend that X-radiographs and all ancillary data from which the age model was derived (e.g., δ18O, δ 13C, Sr/Ca, 230Th-234U dates) be included in the publication.
Supplementary material
To view supplementary material for this article, please visit https://doi.org/10.1017/RDC.2025.5
Acknowledgments
We would like to acknowledge the Haus der Kulturen der Welt (HKW, Berlin) for collaborating with the Anthropocene Working Group in the assessment of the candidate GSSP sites. The collaboration was realized in the framework of HKW’s long-term initiative Anthropocene Curriculum, an international project for experimental forms of Anthropocene research and education developed by HKW and the Max Planck Institute for the History of Science (MPIWG, Berlin) since 2013. We especially thank Jens Zinke, Simon Turner, and Colin Waters for their assistance and guidance on the Anthropocene GSSP research. Analysis of the West Flower Garden Bank core was facilitated by the collaborative research project between KLD and the Anthropocene Working Group to ratify the stratigraphic Anthropocene. We are deeply grateful to the Flower Garden Banks National Marine Sanctuary for their assistance and access to coral and data resources. Corals were recovered under permit FGBNMS-2005-002. Many thanks go to the U.S. Geological Survey for assistance and coring corals in Veracruz and Flower Garden Banks. We thank Julia Cole for sharing the Venezuelan coral cores. We thank Ginesse Listi of the LSU FACES Laboratory for their assistance with the coral X-radiographs. Fred Taylor and Jud Partin at the University of Texas Institute for Geophysics for assisting with core slabbing. We thank LSU PAST laboratory students Nina Susich and Gabrielle Mitchell, as well as Laboratory Coordinator Sarah Crabtree, for their efforts during this project. This is the University of Maryland Center for Environmental Science contribution number 6408. New 14C data associated with this article are archived at the NCEI/NOAA Paleoclimatology program (https://www.ncei.noaa.gov/access/paleo-search/study/39759) and at the Marine Calibration database (calib.org). The authors are not aware of any affiliations, memberships, funding, or financial holdings that might be perceived as affecting the objectivity of this research.
Funding
We thank our funding source, the Haus der Kulturen der Welt, for supporting the Anthropocene Working Group and this project. Additional support for this research from the Department of the Interior South Central Climate Adaptation Science Center Cooperative Agreement G19AC00086 and the National Science Foundation award NSF-2102931 to K.L.D.


 Open access