


Significant Outcomes
-
A trained machine learning model predicted ECT initiation with an AUROC of 0.94, obtained 47% sensitivity at a specificity of 99% with a positive predictive value of 24%, and negative predictive value of 99%.
-
The top 10 predictors driving the model fall into two categories, namely (i) acute severity of mental illness and (ii) treatment resistance, which is suggestive of face validity.
-
These findings suggest that it may be feasible for a machine learning prediction model to support clinical decision making and improve outcomes of ECT by allowing for more timely treatment initiation.
Limitations
-
It would have been ideal to develop a prediction model to identify patients that would benefit from ECT, rather than predicting initiation of ECT (the proxy for need of ECT used here). We do, however, not have data on the outcome of ECT, precluding such analysis.
-
While XGBoost typically performs very well with tabular data, it cannot be excluded that other models, e.g., neural networks, may be superior. This should be subjected to empirical testing.
-
The findings from this study may not generalise to other healthcare systems with different patient populations, different use of ECT (ECT is relatively commonly used in Denmark), and different registration practices.
Introduction
Electroconvulsive therapy (ECT) is a life-saving treatment of severe manifestations of mental illness (Kellner et al., Reference Kellner, Fink, Knapp, Petrides, Husain, Rummans, Mueller, Bernstein, Rasmussen, O’Connor, Smith, Rush, Biggs, McClintock, Bailine and Malur2005; Kellner et al., Reference Kellner, Obbels and Sienaert2020; Salagre et al., Reference Salagre, Rohde and Østergaard2022). ECT is usually reserved for situations where patients have either not responded to other treatments, or when they are at imminent risk of death due to suicidality, malignant catatonia, or inanition or dehydration due to either refusal or inability to eat or drink (Zisselman & Jaffe, Reference Zisselman and Jaffe2010; Liang et al., Reference Liang, Chung, Ho, Tsai and Chien2018; Salagre et al., Reference Salagre, Rohde, Ishtiak-Ahmed, Gasse and Østergaard2021; Kellner et al., Reference Kellner, Obbels and Sienaert2020; Krarup et al., Reference Krarup, Kellner and Østergaard2024).
Initiation of ECT may be delayed for logistic, legal or clinical reasons (e.g., awaiting response to pharmacological treatment) (Parry, Reference Parry1981; Thakrar et al., Reference Thakrar, Bauza, Maaz and Akinyemi2018; Krarup et al., Reference Krarup, Kellner and Østergaard2024). This not only prolongs the burden of illness, but also seems to reduce the likelihood of response to ECT once initiated, and may even have fatal consequences (Parry, Reference Parry1981; Kindler et al., Reference Kindler, Shapira, Hadjez, Abramowitz, Brom and Lerer1991; van Waarde et al., Reference van Waarde, Tuerlings, Verwey and van der Mast2010; Narayanaswamy et al., Reference Narayanaswamy, Tibrewal, Zutshi, Srinivasaraju and Math2012; Haq et al., Reference Haq, Sitzmann, Goldman, Maixner and Mickey2015; Livingston et al., Reference Livingston, Wu, Mu and Coffey2018; Thakrar et al., Reference Thakrar, Bauza, Maaz and Akinyemi2018). Therefore, if the need for ECT could be predicted at the level of the individual patient, there is reason to believe that it could improve outcomes via more timely treatment initiation.
There is a growing body of literature suggesting that information from electronic health records (EHRs) from psychiatric services can be harnessed for clinical prediction via machine learning techniques. Indeed, we have previously demonstrated that mechanical restraint (Danielsen et al., Reference Danielsen, Fenger, Østergaard, Nielbo and Mors2019), involuntary admission (Perfalk et al., Reference Perfalk, Damgaard, Bernstorff, Hansen, Danielsen and Østergaard2024), diagnostic progression to bipolar disorder or schizophrenia (Hansen et al., Reference Hansen, Bernstorff, Enevoldsen, Kolding, Damgaard, Perfalk, Nielbo, Danielsen and Østergaard2025), and development of type 2 diabetes (Bernstorff et al., Reference Bernstorff, Hansen, Enevoldsen, Damgaard, Hæstrup, Perfalk, Danielsen and Østergaard2025a), or cardiovascular disease (Bernstorff et al., Reference Bernstorff, Hansen, Olesen, Danielsen and Østergaard2025b) can be predicted by machine learning models trained on EHR data, some of these outcomes with a level of prediction that bodes well for clinical implementation. Based on these experiences, the present study aimed at training and validating a machine learning model predicting the need for ECT among patients admitted to psychiatric hospitals, using only EHR data that are available from routine clinical practice for prediction.
Method
Reporting generally follows the Transparent Reporting of multivariable prediction models for Individual Prognosis Or Diagnosis with Artificial Intelligence (TRIPOD + AI) (Collins et al., Reference Collins, Moons, Dhiman, Riley, Beam, Van Calster, Ghassemi, Liu, Reitsma, van Smeden, Boulesteix, Camaradou, Celi, Denaxas, Denniston, Glocker, Golub, Harvey, Heinze, Hoffman, Kengne, Lam, Lee, Loder, Maier-Hein, Mateen, McCradden, Oakden-Rayner, Ordish, Parnell, Rose, Singh, Wynants and Logullo2024). Figure 1 illustrates the methods used in this study, which are analogue to those used in related prediction studies based on the same data source (Danielsen et al., Reference Danielsen, Fenger, Østergaard, Nielbo and Mors2019; Perfalk et al., Reference Perfalk, Damgaard, Bernstorff, Hansen, Danielsen and Østergaard2024; Hansen et al., Reference Hansen, Bernstorff, Enevoldsen, Kolding, Damgaard, Perfalk, Nielbo, Danielsen and Østergaard2025; Bernstorff et al., Reference Bernstorff, Hansen, Enevoldsen, Damgaard, Hæstrup, Perfalk, Danielsen and Østergaard2025a; Bernstorff et al., Reference Bernstorff, Hansen, Olesen, Danielsen and Østergaard2025b).
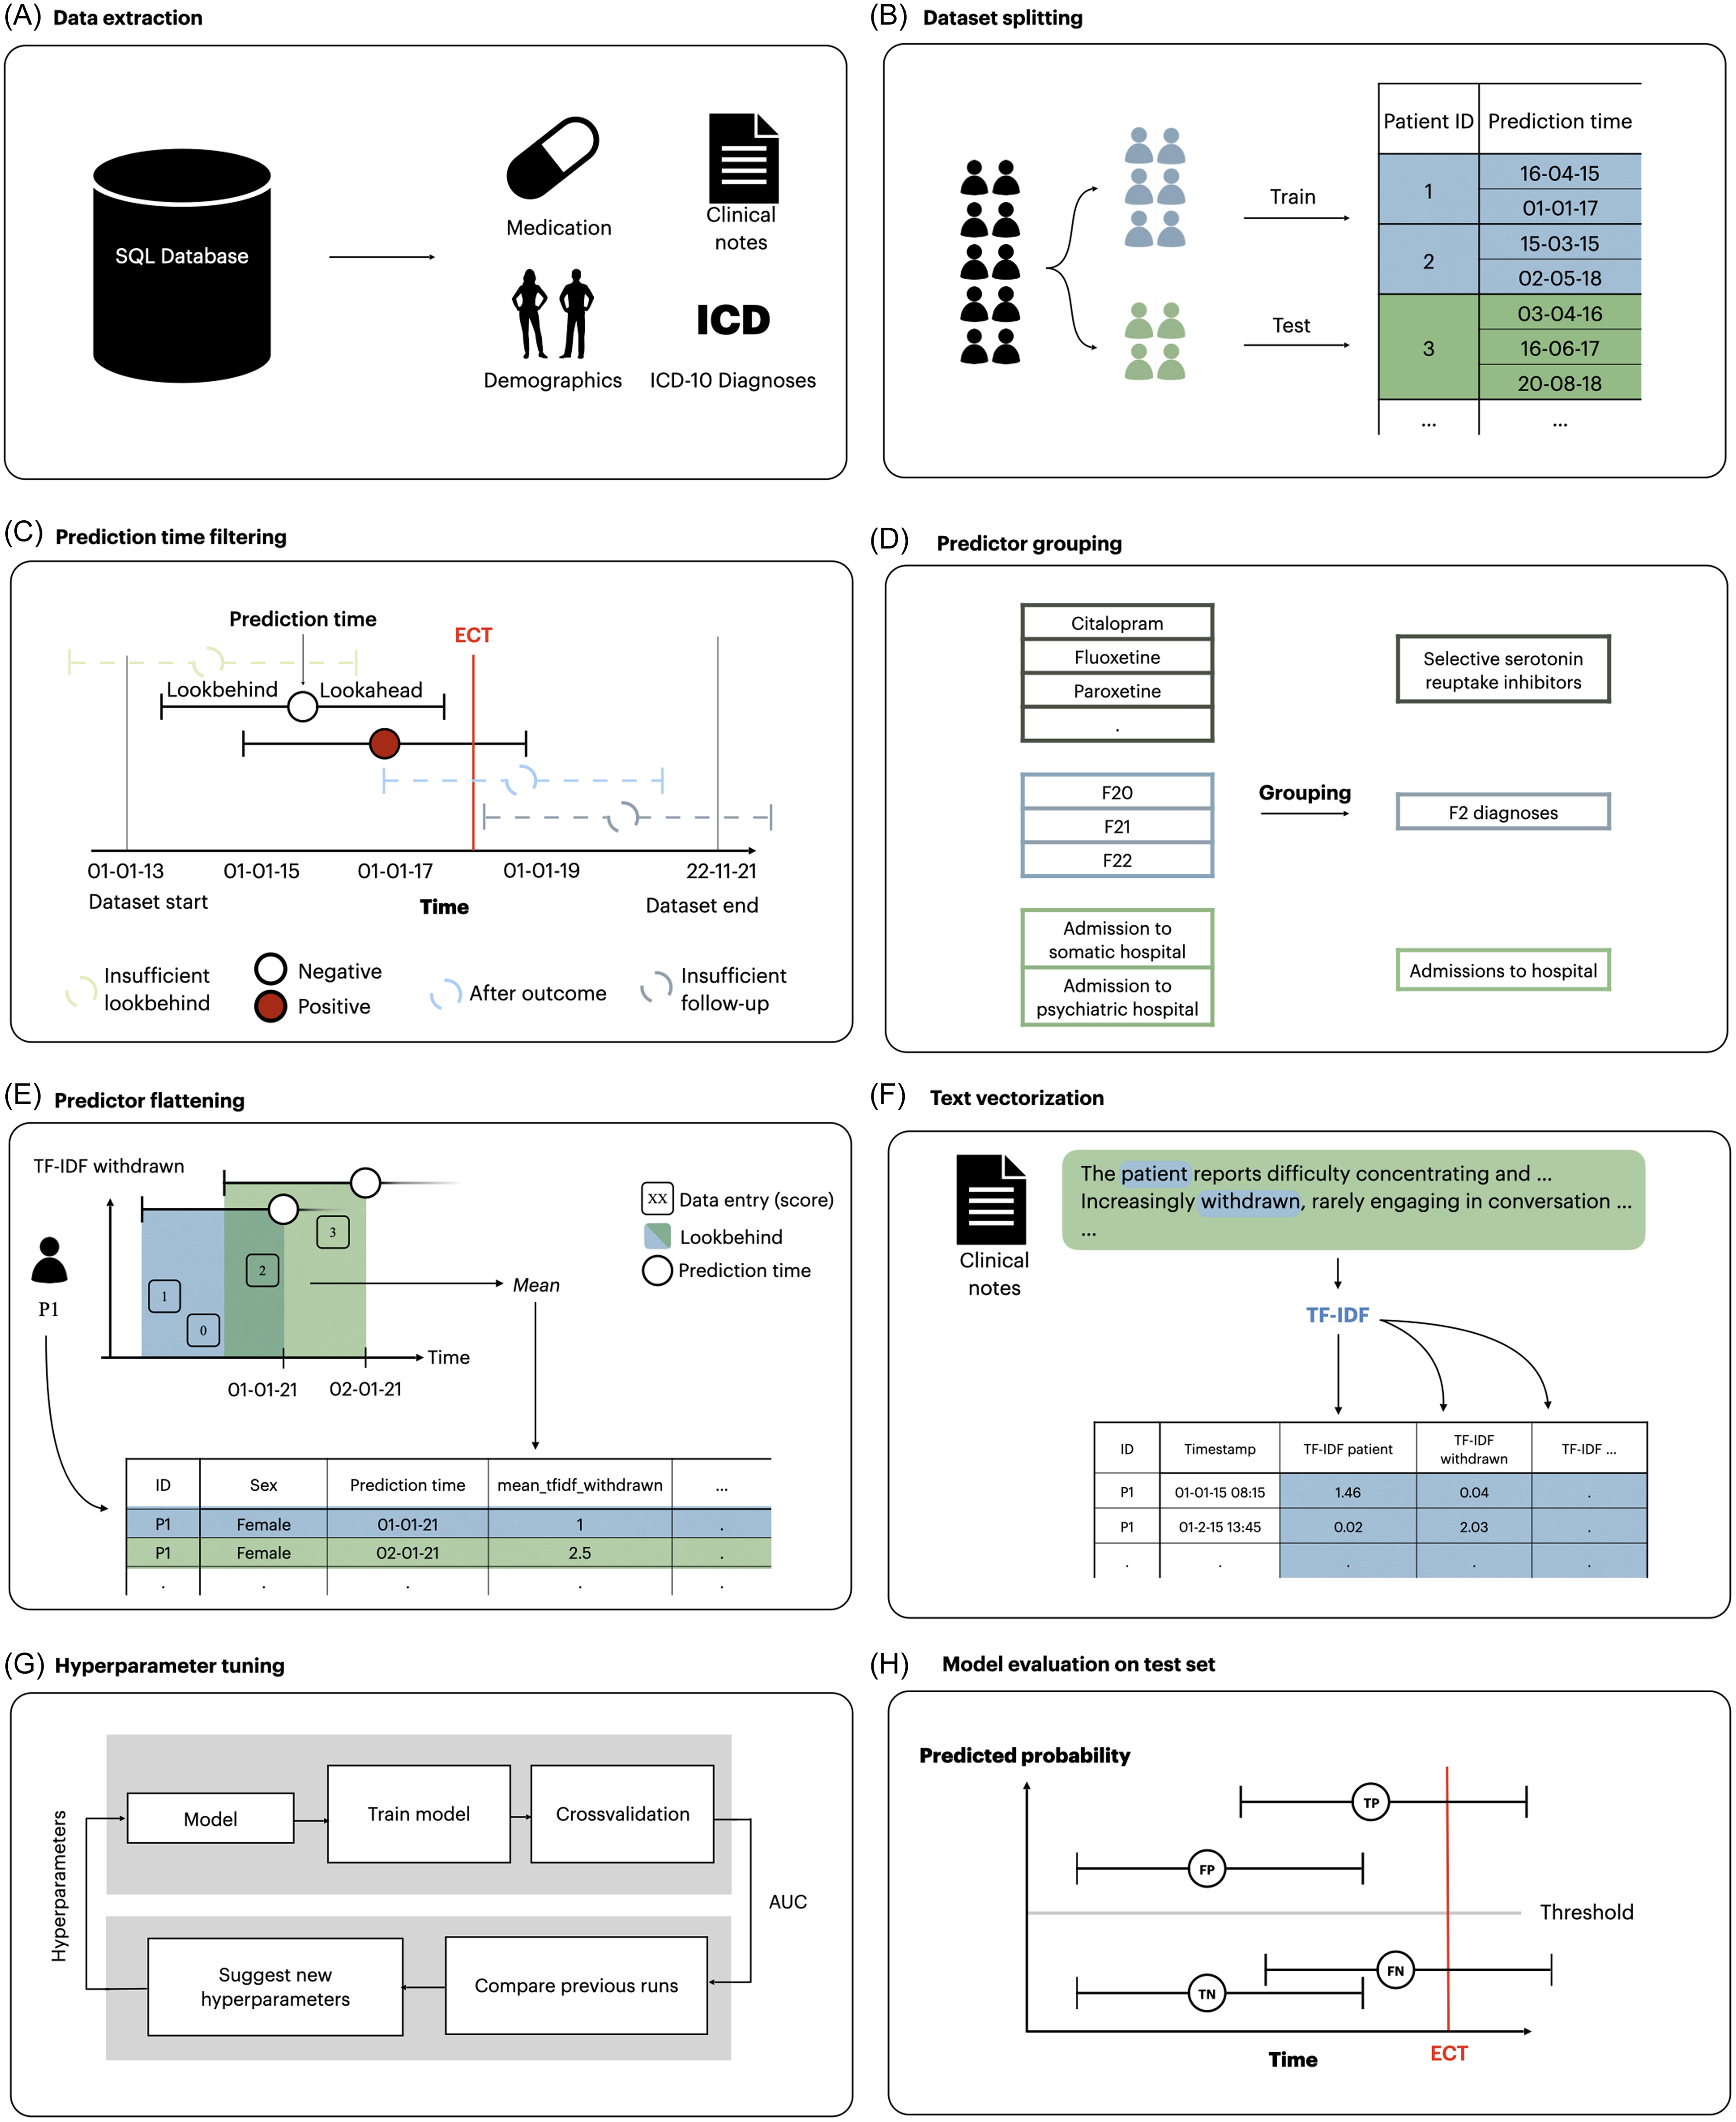
Overview of the process for extraction and transformation of dataset and the training and testing of models. (A) data were extracted from the EHRs. (B) data were split into a training and a test set. (C) prediction times occurring after September 22, 2021 and before January 1, 2015 were removed due to lack of follow-up/lookbehind in addition to prediction times preceded by diagnoses of psychotic or personality disorders. (D) linked predictors such as medication class and diagnostic groups were grouped together. (E) predictors for each prediction time were extracted by aggregating the variables within the lookbehind with an aggregation function. As a result, each row in the dataset represents a specific prediction time with a column for each predictor. (F) clinical notes were turned into vectors using TF-IDF models. (G) models were trained and optimised on the training set using 5-fold cross-validation. Hyperparameters were tuned to optimise AUROC. H) The best candidate models were evaluated on the test set. Modified version of the figure from Bernstorff et al., Reference Bernstorff, Hansen, Enevoldsen, Damgaard, Hæstrup, Perfalk, Danielsen and Østergaard2025a.

Data and cohort definition
The study was based on data from an updated version of the PSYchiatric Clinical Outcome Prediction (PSYCOP) cohort, encompassing routine EHR data from all individuals with at least one contact with the Psychiatric Services of the Central Denmark Region from January 1, 2011, to November 22, 2021 (Figure 1A) (Hansen et al., Reference Hansen, Enevoldsen, Bernstorff, Nielbo, Danielsen and Østergaard2021). The Central Denmark Region has a catchment population of approximately 1.4 million. For the present study, the cohort was restricted to contacts occurring after January 1, 2013, due to inconsistencies in the data before 2013, resulting from the gradual implementation of a new EHR system in 2011 (Bernstorff et al., Reference Bernstorff, Hansen, Perfalk, Danielsen and Østergaard2022; Hansen et al., Reference Hansen, Enevoldsen, Bernstorff, Perfalk, Danielsen, Nielbo and Østergaard2023). Only patients aged above 18 years were included. Although often admitted for inpatient treatment, patients with a diagnosis within the schizophrenia, schizotypal and delusional disorders category (F2 in the International Statistical Classification of Diseases, Tenth Revision (ICD-10)) or the disorders of adult personality and behaviour category (F6 in the ICD-10) (World Health Organization, 1993) were excluded, as ECT is primarily used for severe mood disorders in Denmark and most Western countries (Leiknes et al., Reference Leiknes, Jarosh-von Schweder and Høie2012; Bjørnshauge et al., Reference Bjørnshauge, Hjerrild and Videbech2019). Due to the combination of frequent admissions and rare use of ECT, including patients with prior F2 or F6 diagnoses would result in a large number of ‘0’ values for the outcome variable, which would likely translate to poor PPV of the developed models, and have limited clinical relevance. Power analyses were not conducted and sample size was determined by the available data.
Data split
The data was randomly split into an 85% training set and a 15% test set, stratified by unique anonymised patient ID to ensure that no patient appeared in both splits (Figure 1B). Assignment to the the splits was determined by an a priori stratification key made from multiple outcome datasets defined by the author group. This stratification key enables the use of consistent data splits across multiple related prediction model studies, which in turn allows for consistent cross-study comparisons and the fitting of language models that can be used across all studies. The training set was further split into five folds for outcome- and patient-stratified cross-validation during training and hyperparameter tuning. The test set was completely held out until the final phase of model evaluation.
Outcome definition
Treatment initiation with ECT (procedure codes used to identify ECT in the EHR data are available in Supplementary Table 1) after a minimum of seven days of inpatient stay (to not include patients admitted for planned ECT) at a psychiatric hospital in the Central Denmark Region was used as a proxy for the need for ECT. Models were trained to predict the initiation of ECT within 60 days of the prediction time (60-day lookahead window as described below and in Figure 1C). We chose the 60-day lookahead window to reflect a period of time in which ECT may be considered in clinical practice.
Prediction time definition and filtering
Prediction times were defined as the seventh day of each inpatient stay. Prediction times occurring after September 22, 2021, were removed because they did not have the re-quired 60 days of follow-up. Predictions times occurring before January 1, 2015, were removed because they did not have sufficient data in the dataset to construct predictors using data from the 730 days prior to the prediction (Figure 1C). Furthermore, no predictions were made for patients who had received ECT within the last three years to avoid making predictions for patients already undergoing an ECT treatment course or who had a high probably of receiving a new treatment series based on relatively recent successful response to ECT.
Predictor construction
Only routine clinical data from the EHRs were considered for predictors, i.e., no additional data collection was performed for the purpose of this study. Predictors (some of which were grouped – see Figure 1D) from structured data were constructed by looking back a specified period (the lookbehind window) from each prediction time and extracting a single value for each predictor. When multiple values were present in the lookbehind window, an appropriate aggregation function, such as the mean or count, was applied. If no values were present in the lookbehind window, a fallback value (e.g. 0 or ‘not a Number’ (NaN)) was used. Predictors were created using lookbehind windows of 90 days, 365 days and 730 days to incorporate different temporal contexts, tapping into acute as well as more chronic manifestations of illness.
Predictor construction was conducted using timeseriesflattener v2.2.6 (Bernstorff et al., Reference Bernstorff, Enevoldsen, Damgaard, Danielsen and Hansen2023) (Figure 1E), and included demographics (age, sex); hospital contacts (psychiatric and non-psychiatric hospital admissions, outpatient contacts with psychiatric services, psychiatric and non-psychiatric emergency visits); diagnoses; medications administered during inpatient stays; rating scales: the 17-item Hamilton Depression Rating Scale (Hamilton, Reference Hamilton1960), the Brøset violence checklist (a 6-item clinician rated checklist estimating acute risk of violent behaviour) (Woods & Almvik, Reference Woods and Almvik2002), and suicide risk assessment (a rating system used in the Psychiatric Services of the Central Denmark Region with the following risk levels: 1 - no increased risk, 2 - increased risk, and 3 - acutely increased risk); information related to temporary leaves during inpatient stays; and coercive measures (for the full list, see Supplementary Table 2).
Free-form text from clinical notes from the EHRs (the note types are specified in Supplementary Table 3 were embedded as numerical vectors using term frequency-inverse document frequency (TF-IDF) (Figure 1F). Specifically, in TF-IDF, each clinical note is represented as a list of numerical values, where each value represents a unique term (words). The value assigned to each term reflects both the frequency of the word within the specific note (term frequency) and how rare the word is across all notes (inverse document frequency). This results in a list of numerical values which emphasises (i.e., high values) words that are distinctive of the note in question. TF-IDF is widely used due to its interpretability/explainability and high performance both in terms of speed of computation and quality of results. Accordingly, our prior use of TF-IDF has yielded results with high face validity (Perfalk et al., Reference Perfalk, Damgaard, Bernstorff, Hansen, Danielsen and Østergaard2024; Hansen et al., Reference Hansen, Bernstorff, Enevoldsen, Kolding, Damgaard, Perfalk, Nielbo, Danielsen and Østergaard2025). Models were trained on all clinical notes specified in eTable 3 using scikit-learn v1.2.1 with a dimensionality of 1,000 predictors. The text embeddings were processed similarly to the structured predictors, but only a single lookbehind (730 days) and the mean aggregation function was used.
Model training
Separate models were trained and optimised for each of the following three predictors sets: (1) structured predictors only, (2) text predictors only, and (3) both structured and text predictors. A frequently used, state-of-the-art machine learning model, Extreme Gradient Boosting (XGBoost), was trained and hyperparameter tuned individually for each predictor set using Optuna v3.4.0 (Figure 1G) (Chen & Guestrin, Reference Chen and Guestrin2016; Akiba et al., Reference Akiba, Sano, Yanase, Ohta and Koyama2019). XGBoost is a tree-based ensemble classification model. It is robust to missing data, capable of capturing non-linear relationships, and highly efficient for large data sets, making it well suited for training models on our predictor sets. In prior studies based on the same dataset, we have included elastic net regularised logistic regression as a benchmark model. However, XGBoost has consistently outperformed elastic net regularised logistic regression in these studies (Perfalk et al., Reference Perfalk, Damgaard, Bernstorff, Hansen, Danielsen and Østergaard2024; Hansen et al., Reference Hansen, Bernstorff, Enevoldsen, Kolding, Damgaard, Perfalk, Nielbo, Danielsen and Østergaard2025; Bernstorff et al., Reference Bernstorff, Hansen, Enevoldsen, Damgaard, Hæstrup, Perfalk, Danielsen and Østergaard2025a, Reference Bernstorff, Hansen, Olesen, Danielsen and Østergaard2025b). Therefore, we chose to only train XGBoost in this study.
Model evaluation
Based on the area under the receiver operating characteristic curve (AUROC) after hyperparameter tuning, the best-performing model for each predictor set (structured predictors only, text predictors only, and both structured and text predictors) was retrained on the entire training set and applied to the test set (Figure 1H). All evaluation metrics are based on the test set unless otherwise is specifically stated. The AUROC was calculated for global performance. Bootstrap-based 95% confidence intervals (CIs) were computed using 1,000 resamples. Additionally, we report sensitivity, specificity, PPV, NPV, and the median time from the first positive prediction to the outcome at multiple classification thresholds. Predictor importance was estimated via information gain. For XGBoost models, this metric estimates the contribution of the individual predictors to overall model performance. Information gain is not directed, meaning estimates are unable to convey whether increasing a predictor’s value pushes the model toward a positive or negative prediction.
Robustness analyses
Subgroup analyses of the stability of model predictions across time since prediction, sex and age were conducted on the test set. Additionally, we assessed the generalisability of the models across both geography and time (calendar year). For geographic generalisation, the model was retrained on cases from hospitals in the eastern and western parts of the region and evaluated on cases from hospitals in the central part. For temporal generalisation, we retrained a series of models using data up to year n, incrementally including one additional year at a time, and evaluated each model on data from the following years.
Python version 3.11.8 was used for all analyses. The code for the analyses is available via GitHub (Aarhus Psychiatry Research, 2025).
Ethics
The use of EHRs from the CDR for this study was approved by the Legal Office of the CDR in accordance with the Danish Health Care Act §46, Section 2. According to the Danish Committee Act, ethical review board approval is not required for studies based solely on data from EHRs (waiver: 1-10-72-1-22).
Results
The cohort consisted of 41,610 unique patients (54.9% females) with a total of 164,961 admissions eligible for prediction. Table 1 shows an overview of the number of patients and admissions in each split, along with demographic and diagnostic characteristics. The largest predictor set contained 1,179 predictors, 179 structured predictors (listed in Table S3) and 1,000 derived from clinical notes (TF-IDF).
Descriptive statistics for prediction times (A) and individual patients (B) that were eligible for prediction

* These ICD-10 diagnoses (subchapters) cover the two years prior to the prediction time.
Model training
The performance of models on the training set (based on out-of-fold data from cross-validation) indicated that those trained using either of the three predictor sets – structured, text, and the combination of the two – obtained fairly comparable results. Specifically, the model trained exclusively on structured predictors achieved an AUROC of 0.92 (95% CI: 0.92–0.93), while the model using only text predictors attained an AUROC of 0.90 (95% CI: 0.89–0.91). The model that integrated both structured and text predictors demonstrated marginally superior performance, with an AUROC of 0.94 (95% CI: 0.93–0.94).
Model testing
When applied to the test set, the models retained their performance levels observed during training (Figure 2A). Consistent with the training results, the model trained exclusively on structured predictors achieved an AUROC of 0.94 (95% CI: 0.93–0.96), the model using only text predictors achieved an AUROC of 0.92 (95% CI: 0.90–0.93), while the model that incorporated both structured and text predictors achieved an AUROC of 0.94 (95% CI: 0.93–0.96). The model using only structured predictors had a substantially higher median time from the first positive prediction to ECT initiation (15.0 days (Q1–Q3: 3.0–71.0)) compared with the text predictor only model (9.5 days (Q1–Q3: 2.0–81.75)) and slightly higher time compared with the model using both structured and text predictors (13.0 (Q1–Q3: 2.5–74.5)) days. Therefore, we show the results obtained for the model based on structured predictors in the main text, while analogous results for the two other models (text only and structured+text combined) are available in the supplementary material.
Test set results for the model based only on structured predictors. A: receiver operating characteristics curve for each predictor set. The model using the predictor set with only structured data was used for figures B–D with a PPR of 2%. B: confusion matrix. PPV: positive predictive value. NPV: negative predictive value. C: time (days) from the first positive prediction to the patient initiating ECT at a 2% PPR. The dashed line represents the median time. The plot is truncated at 100 days from first positive prediction to event as few events are predicted later than this. D: sensitivity by days from prediction time to event, stratified by desired PPR. E: temporal stability of the model performance.

Figure 2B shows the confusion matrix using a classification threshold based on a 2% predicted positive rate (PPR). The PPV is 23.7%, indicating that for around every 4 positive predictions, one prediction time was followed by the initiation of ECT within 60 days. The sensitivity at the level of prediction times was 47.2% (the model correctly identifies nearly half of the actual positive outcomes), and 30.0% of all patients who received treatment with ECT were predicted positive at least once (Table S4). The median time from the first positive prediction to the outcome was 15.0 days (Q1–Q3: 3.0–71.0) (see Figure 2C). Notably, as evident from Figure 2C, in some cases, the model outputs a positive prediction for an admission where ECT is initiated after the first 60 days of the admission (i.e., after the end of the lookahead window). With the approach used in the present study, these cases are marked as false positives, even though the predictions do, in fact, correctly predict ECT initiation and, thus, do hold some clinical value. As evident from Figure 2D, the sensitivity of the model decreased slightly the longer into the future from the prediction time the initiation of ECT occurred. Finally, Figure 2E shows that the temporal stability of the model based only on structured predictors is relatively high.
Table 2 lists the 10 most important predictors according to information gain for the model based on structured predictors, where the suicide risk assessment score (number 1 and 4) and Brøset violence checklist score (2, 5 and 7) are particularly prominent.
Top 10 most important predictors (and aggregation method) for the model based only on structured predictors

*Most recent refers to the prior event closest to the prediction time.
**ICD-10 code: F0.
***ICD-10 code: F1.
****Sectioning during an inpatient stay after being admitted voluntarily.
![]()
Robustness analyses
Figure 3 shows that the performance of the model based on structured predictors is stable across sexes and age groups, with slight performance reduction in older patients. Performance is relatively stable across levels of time from the first visit to the Psychiatric Services, with some instability after 25–30 months, likely partially owing to variation due to few outcomes. Lastly, no noticeable trends were observed in the performance across calendar time.
Robustness across stratifications of the model based only on structured predictors model performance stratified by sex (A), age in years (results for 18-20 years not reported due to too few observations) (B), time since first visit to the psychiatric services in the Central Denmark Region (C), and month of year (D). The black line is the area under the receiver operating characteristics curve (AUROC). Grey bars represent the proportion of prediction times that are present in each group. Error bars are 95%-CIs from 100-fold bootstrap.

When evaluated on unseen hospital sites, model performance was highly similar to that obtained on unseen patients (the model using only structured predictors achieved an AUROC of 0.92 (95% CI: 0.91–0.94)). For this configuration, the median time from the first positive prediction to ECT initiation was 9.5 days (Q1–Q3: 3.0–59.75), which is a substantially shorter warning time than that obtained on unseen patients (15.0 days (Q1–Q3: 3.0–71.0)).
Results for models based on text predictors only and on structured + text predictors
Results analogue to those reported for the model based only on structured data in Figure 2, Supplementary Table 4, Table 2 and Figure 3 are reported for the model based only on text predictors (Supplementary Figure 1, Supplementary Table 5, Supplementary Table 6, and Supplementary Figure 2) and the model based on both structured and text predictors (Supplementary Figure 3, Supplementary Table 7, Supplementary Table 8, and Supplementary Figure 4) in the appendix. When evaluated on unseen hospital sites, model performance was highly similar to that obtained on unseen patients (the model based only on text predictors achieved an AUROC of 0.91 (95% CI: 0.89–0.93), and the model based on both structured and text predictors achieved an AUROC of 0.94 (95% CI: 0.93–0.95)). These results are generally compatible with those obtained for the model based only on structured data. The median time from the first positive prediction to ECT initiation were, however, even lower for both these models (5.0 days (Q1–Q3: 2.0–25.0) and 6.5 days (Q1–Q3: 2.0–36.75) respectively).
Discussion
The objective of this study was to investigate whether a machine learning model trained on EHR data could predict the need for ECT (proxied by initiation of ECT) among inpatients at psychiatric hospitals. Based on EHR data from 41,610 adult patients with a total of 164,961 admissions eligible for prediction, a trained machine learning model predicted ECT initiation with an AUROC of 0.94, obtained 47% sensitivity at a specificity of 99% with a PPV of 24%, and NPV of 99%. These findings suggest that it may be feasible for a machine learning prediction model to support clinical decision making and improve outcomes of ECT by allowing for more timely treatment initiation.
We are not aware of other studies having aimed at predicting the need for ECT. Therefore, there is not a literature to benchmark against. Prior machine learning studies have predominantly aimed at predicting good response to ECT, finding that clinical characteristics such as shorter duration of depressive episodes, depression with psychotic features, and a family history of depression may be predictive of a positive outcome of ECT (Lundin et al., Reference Lundin, Falcao and Kannangara2024). The present study addressed a different, but, we would argue, equally important, clinical problem.
Notably, the top 10 predictors driving the model seem to fall into two categories, namely (i) acute severity of mental illness and (ii) treatment resistance (see colour coding in Table 2). With regard to the former, the fact that two predictors based on the suicide risk assessment score (the maximum score in the past 90 days and the most recent score in the past 90 days) were number 1, and 4 on the top 10 is in strong agreement with acute suicide risk being a prime indication for ECT (Kellner et al., Reference Kellner, Fink, Knapp, Petrides, Husain, Rummans, Mueller, Bernstein, Rasmussen, O’Connor, Smith, Rush, Biggs, McClintock, Bailine and Malur2005; Kellner et al., Reference Kellner, Obbels and Sienaert2020; Salagre et al., Reference Salagre, Rohde and Østergaard2022). Similarly, three predictors based on the Brøset violence checklist (the mean score in the past 90 days, the most recent score in the past 90 days and the most recent score in the past 365 days) appeared as number 2, 5 and 7 on the top 10. Interestingly, the most recent score in the past 365 days on the 17-item Hamilton Depression Rating Scale appeared as the 11th most important predictor (not in the table). A high score on these scales is also indicative of acute severity of mental illness. Involuntary admission/detention and use of restraint (manual, mechanical or chemical) are, per definition, also markers of acute severity of mental illness, as this level of severity is a legal requirement for these coercive measures to be used in psychiatric services in Denmark (Danish Laws, 2025). Finally, organic mental disorder, delirium in particular, is also strongly suggestive of acutely severe–potentially life-threatening–mental illness (Salagre et al., Reference Salagre, Rohde, Ishtiak-Ahmed, Gasse and Østergaard2021). Regarding treatment resistance, the number of temporary leaves (from inpatient treatment) over the past 90 days, likely reflect illness difficult to treat as this is suggestive of long inpatient stays with an illness severity that makes leaves possible (i.e., the patient is unlikely to be suicidal or psychotic). Finally, having received a diagnosis of substance use disorder in the past 2 years also seems compatible with protracted/treatment-resistant illness (Brenner et al., Reference Brenner, Brandt, Li, DiBernardo, Bodén and Reutfors2019; Lundberg et al., Reference Lundberg, Cars, Lööv, Söderling, Sundström, Tiihonen, Leval, Gannedahl, Björkholm, Själin and Hellner2023).
While the accuracy of the prediction model based on structured data is far from perfect, meaning that the model can of course not stand alone, it may be sufficiently good to support clinical practice. If implemented, a positive prediction should ideally be used like a paraclinical test. I.e., a positive/negative prediction should, in itself, not lead to action – or lack thereof, but be integrated with the healthcare staff’s clinical impression of the patient, thereby contributing to an overall consideration of whether ECT may be a good treatment option in the specific case.
There are a number of limitations to consider in relation to this study. First, the word ‘ECT’ was among the top 10 predictors in both models that included text predictors. This is likely due to these models picking up on either ECT being considered as a treatment option, being proposed to a patient, or a referral for ECT being made. This may be the prime reason why these two models had a substantially lower median time from the positive prediction to ECT initiation compared with the model based only on structured predictors, making the latter the more attractive option. Second, the models were trained exclusively to predict the need for ECT among inpatients and is unlikely to perform equally well among outpatients. In Denmark, ECT is, however, typically initiated during inpatient stays and may be continued (maintenance ECT) after discharge as part of outpatient treatment. Third, the findings from this study may not generalise to other healthcare systems with different patient populations, different use of ECT (ECT is relatively commonly used in Denmark) (Leiknes et al., Reference Leiknes, Jarosh-von Schweder and Høie2012; Bjørnshauge et al., Reference Bjørnshauge, Hjerrild and Videbech2019), and different registration practices. Fourth, we used initiation of ECT as proxy for ECT, which is not ideal as patients in need of-, but declining ECT are not covered by this proxy. Fifth, as referral to ECT is, per definition, closer in time to the need for ECT than ECT initiation, it would have been more optimal to use referrals for ECT as outcome. Unfortunately, referral data were not stable over the study period and could, therefore, not be used. Sixth, it can, rightfully, be argued that it would be better to develop a prediction model to identify patients that would benefit from ECT rather than predicting initiation of ECT (the proxy for need of ECT used here). We do, however, not have data on the outcome of ECT, precluding such analysis. However, both research and clinical practice shows that the majority of patients receiving ECT benefit from this treatment (Kellner et al., Reference Kellner, Fink, Knapp, Petrides, Husain, Rummans, Mueller, Bernstein, Rasmussen, O’Connor, Smith, Rush, Biggs, McClintock, Bailine and Malur2005; Kellner, et al., Reference Kellner, Obbels and Sienaert2020; Salagre et al., Reference Salagre, Rohde and Østergaard2022). Seventh, while XGBoost typically performs very well with tabular data, it cannot be excluded that other models, e.g., neural networks, may be superior. This should be subjected to empirical testing.
In conclusion, this study is the first to demonstrate that EHR data from routine clinical practice can be used to predict the need for ECT. These findings suggest that it may be feasible for a machine learning prediction model to support clinical decision making and improve outcomes of ECT by allowing for more timely treatment initiation.
Supplementary material
The supplementary material for this article can be found at https://doi.org/10.1017/neu.2026.10063.
Data availability statement
Due to the personally sensitive nature of the data used for this study, it cannot be shared according to Danish law. The analytic code is available at: https://github.com/Aarhus-Psychiatry-Research
Acknowledgements
None.
Author contributors
Concept and design: Hansen, Danielsen, Østergaard. Acquisition, analysis, or interpretation of data: All authors. Drafting of the manuscript: Hansen, Lundin, Østergaard. Critical review of the manuscript for important intellectual content: Damgaard, Danielsen. Statistical analysis: Hansen, Damgaard. Obtained funding: Østergaard. Supervision: Danielsen, Østergaard.
Funding statement
The study is supported by grants from the Lundbeck Foundation (grant No. R344-2020-1,073 to Dr Østergaard), the Danish Cancer Society (grant No. R283-A16461 to Dr Østergaard), the Central Denmark Region Fund for Strengthening of Health Science (grant No. 1-36-72-4-20 to Dr Østergaard), the Danish Agency for Digitisation Investment Fund for New Technologies (grant No. 2020-06,720 to Dr Østergaard), and Independent Research Fund Denmark (grant No. 4,309-00028B). The funders had no role in the study design; in the collection, analysis, and interpretation of data; in the writing of the report; and in the decision to submit the paper for publication.
Competing interests
Dr Danielsen reported receiving personal fees from Otsuka Pharma Scandinavia AB outside the submitted work. Dr Østergaard reported receiving grants from The Novo Nordisk Foundation (grant No. NNF20SA0062874), The Lundbeck Foundation (grant No. R358-2020-2,341), and Independent Research Fund Denmark (grant No. 2,096-00055B); receiving the 2020 Lundbeck Foundation Young Investigator Prize; owning or having owned units of mutual funds with stock tickers DKIGI, IAIMWC, SPIC25 KL and WEKAFKI; and owning or having owned units of exchange traded funds with stock tickers BATE, TRET, QDV5, QDVH, QDVE, SADM, IQQH, USPY, EXH2, 2B76, IS4S, OM3X, EUNL and SXRV outside the submitted work. No other disclosures were reported.


 Open access