


A core task of politicians in representative democracies is to tackle societal problems such as declining educational attainment, rising unemployment, climate change, and terrorism. Successful political problem-solving requires constantly updated information about societal problems. Numerous actors express their perspectives on problems daily, and politicians are regularly exposed to new information about important societal challenges – far more than any politician can consider (Jones and Baumgartner Reference Jones and Baumgartner2005). The oversupply of new information about problems and the scarcity of politicians' attention initiated an important debate about power and representation that has preoccupied the discipline of political science for a long time (Bachrach and Baratz Reference Bachrach and Baratz1962; Baumgartner and Jones Reference Baumgartner and Jones1993; Green-Pedersen and Walgrave Reference Green-Pedersen and Walgrave2014; Schattneider Reference Schattneider1960; Vliegenthart et al. Reference Vliegenthart2016; Walgrave and Dejaeghere Reference Walgrave and Dejaeghere2017).
Our study addresses a fundamental question at the heart of the debate: What type of new information about societal problems do politicians pay attention to? Answering this question is important because politicians' use of information has immediate and tangible downstream effects. Problem information shapes how politicians view a problem, which will likely affect whether and how the problem is addressed and solved (Jones Reference Jones2001).
Previous research identifies four central types of information considered by politicians: public concern about a problem (Jennings and John Reference Jennings and John2009), problem attention by rival parties (De Vries and Hobolt Reference de Vries and Hobolt2020), news stories about problems (Van Aelst and Walgrave Reference Van Aelst and Walgrave2011), and statistical problem indicators (Traber, Schoonvelde, and Schumacher Reference Traber, Schoonvelde and Schumacher2020). Despite this impressive body of research on problem information, important unresolved issues remain. First, previous studies rarely looked at the types of problem information. We know little about the relative importance of the four information types (public opinion, rival parties, media reporting, and statistical indicators). It is unknown which one is decisive for drawing politicians’ attention to the problems they face. Second, it is unclear whether the effects on politicians' use of problem information reported in previous studies are causal. The interaction between politicians and new problem information is complex. Politicians' exposure to new information does not occur randomly, which introduces many possible confounders. To the best of our knowledge, previous studies relied on research designs that could not identify causal relationships and possibly reported biased results. We address these shortcomings by examining politicians' responses to the four types of information through an innovative combination of a randomized field experiment and semi-structured elite interviews.
We theorize which type of new information matters to politicians. While all types of problem information will likely interest politicians, politicians running for office will most likely attend to new information that features rival parties' perspectives on a problem. Politicians from rival parties are direct competitors who are interested in getting votes and winning office. Thus, their ability to create a problem is important. Compared to public opinion, media reporting, and statistical indicators, the new information about rival parties' standpoints has the greatest value. It sends a strong signal that the problem is immediately relevant because the rival has decided that it is worth addressing if s/he is to end the electoral competition victorious.
To test our expectation about politicians' attention to problem information, we report from a large-scale pre-registered field experiment conducted on a sample of more than 6,000 party candidates for municipal councils in Denmark six weeks prior to the election in 2021. A major advantage of our well-powered field experiment is that it allows us to causally identify the impact of the type of information on politicians' attention to problem information. In our capacity as researchers, we sent an email to party candidates about four weeks ahead of the election, in which we invited them to access a new and specially tailored report about one of two societal problems (climate change and public schools), randomly highlighting one of four content aspects representing the different types of problem information. We capture candidates' attention to problem information in real life by tracking whether they clicked on the link in the email. Our email with the offer to access problem information mimics an everyday situation in which politicians must decide whether they pay attention. The high external validity of the field experiment is a major asset. In addition, we avoid any social desirability bias because no interviewer is present to observe the politicians. Furthermore, we avoid identity deception and misinformation, two major concerns about experimental studies with political elites (Grose Reference Grose, Druckman and Green2021; Phillips Reference Phillips2021). Our study participants know our identity and individually benefit from access to useful information about two societal problems. Thus, we present a good example showing how researchers and elite participants can benefit from a field experiment (Loewen and Rubenson Reference Loewen and Rubenson2022).
We estimate effects with an intention-to-treat analysis and provide two important findings. First, politicians are eager to access new information about problems. Within fourteen days of sending the email, about 25 per cent of our sample accessed the report. Considering that candidates had a busy schedule in the weeks before the election and possibly received many similar inquiries during the campaign period, this is a noteworthy high level of interest and reaffirms the portrayal of politicians presented in previous studies (Green and Jennings Reference Green and Jennings2017).
Second, we show that politicians are similarly likely to engage with reports about statistical indicators and public opinion (that is, 26.9 per cent and 26.5 per cent of candidates in the two conditions). The level of interest for the remaining conditions featuring rival party positions and media reporting is −2.5 (95 per cent CI −5.6 to 0.6) and −3.7 (95 per cent CI −6.7 to −0.6) percentage points lower compared to the statistical indicator condition. Even though the differences in magnitude are relatively small, this finding is noteworthy because it contradicts our initial expectations and challenges existing research, often underscoring the importance of rival parties and the media for politicians. Our results suggest that politicians are also keen to access information to learn about statistical problem indicators and public concern about the problem.
We ascertain the underlying reasoning behind the problem attention via eighteen interviews with candidates and elected politicians. In line with the results from the field experiment, most interviewees pointed out that problem indicators and public opinion built the basis for their political actions. The interviews show that politicians become aware of societal problems through citizens and turn to statistical indicators to learn about the core of the problem. They give less weight to information about rival parties and the media because they feel this information does not reflect real problems.
Our results provide new and important evidence about the types of information politicians consider when addressing societal problems. Our findings are reassuring for representative democracy because they indicate that politicians are not detached from the real world. Rather, from our study, we find that politicians want to learn about important societal problems, which is a necessary first step to identify and later resolve these problems.
Theoretical Perspectives on Politicians' Attention to Problem Information
Politicians' allocation of attention to problem information is a prominent topic in political science research. Since Nobel laureate Herbert Simon introduced the idea of bounded rationality (Simon Reference Simon1947), the study of politicians' problem attention has become a growth industry (Bachrach and Baratz Reference Bachrach and Baratz1962; Baumgartner, Jones, and Wilkerson Reference Baumgartner, Jones and Wilkerson2011). Subsequent research on political agenda-setting, pioneered by Kingdon (Reference Kingdon1995) and Baumgartner and Jones (Reference Baumgartner and Jones1993) eloquently describes the limits to politicians' attention and the inescapable need for political prioritization (Baumgartner et al. Reference Baumgartner2009; Jones, Larsen-Price, and Wilkerson Reference Jones, Larsen-Price and Wilkerson2009).
Prioritization is necessary because politicians are constantly exposed to information about societal problems. This has motivated subsequent research to understand the types of information that make politicians attend to them.Footnote 1 Judged by rich scholarly evidence, this literature points out four central types of information that determine the allocation of problem attention (Green-Pedersen Reference Green-Pedersen2019; Jennings et al. Reference Jennings2011). These include public opinion (Jennings and John Reference Jennings and John2009; Jones, Larsen-Price, and Wilkerson Reference Jones, Larsen-Price and Wilkerson2009; Loewen, Rubenson, and McAndrews Reference Loewen, Rubenson and McAndrews2022), rival party behaviour (Green-Pedersen Reference Green-Pedersen2019; Meguid Reference Meguid2008; Spoon, Hobolt, and de Vries Reference Spoon, Hobolt and de Vries2014), media reporting (Van Aelst and Walgrave Reference Van Aelst and Walgrave2011; Walgrave and Van Aelst Reference Walgrave and Van Aelst2006), and problem developments indicated by statistical indicators (Mortensen et al. Reference Mortensen2011; Tavits and Potter Reference Tavits and Potter2015; Traber, Schoonvelde, and Schumacher Reference Traber, Schoonvelde and Schumacher2020).
However, these studies rarely pit the four types of information against each other, leaving limited insights into their relative importance. More recently, a few studies have begun to look into the question of how politicians actually process problem information. These studies provide intriguing evidence on heuristics, biases, and the framing effects involved in this phase of decision-making (Baekgaard et al. Reference Baekgaard2019; Sheffer et al. Reference Sheffer2018; Walgrave and Dejaeghere Reference Walgrave and Dejaeghere2017; Walgrave et al. Reference Walgrave2018) but, again, do not address which type of problem information is most important. This is a significant gap in our understanding of political elites because problem information will likely influence subsequent decisions about addressing and eventually solving a societal problem.
To theorize what makes politicians attend to problems, we depart from the position that politicians running for office are in a convoluted dilemma. They must foresee which problems motivate voters on election day (Seeberg Reference Seeberg2022; Sulkin Reference Sulkin2009). Some problems are imminent and have entered the political arena already. They could be solved and disappear, but they might also remain relevant. Other problems lurk beneath the surface and might pop up before election day (Baumgartner and Jones Reference Baumgartner and Jones1993; Kingdon Reference Kingdon1995). Politicians might try to attend to existing problems and screen possible new problems simultaneously. However, politicians' attention is limited by time and resources, so they cannot devote high levels of attention to every problem that may affect future election outcomes. Politicians must prioritize, but deciding which problems to focus on entails high uncertainty.
We assume that politicians will respond to a signal that helps them reach their re-election goal and argue that the strongest signal comes from rival parties' problem attention. Information about the problem attention of rival parties indicates to what extent and how the rivals address the problem. This information signals that rival party politicians have invested in learning about the problem, deeming it relevant to the political competition. Rival parties are professional and self-interested re-election oriented actors. Therefore, a politician can use such information to understand better how their rivals will employ the problem to challenge competitors and influence the public – especially during the election campaign. In other words, information that rival political parties attend to signals that this will likely feature prominently in the election. As a result, politicians have a strong incentive to learn about their rival party's problem attention in order to make sure they attend to the problem the rival has already addressed, not least to defend against potential attacks from their competitors (Grossman and Guinaudeau Reference Grossman and Guinaudeau2021; Seeberg Reference Seeberg2023; Sulkin Reference Sulkin2009; Thesen Reference Thesen2013).
By contrast, statistical problem indicators represent relatively raw and undigested information. Politicians must invest in interpreting the numbers and proactively decide whether the problem is sufficiently relevant to be addressed. However, the possible problem might never fully develop or it develops but never becomes political (Baumgartner and Jones Reference Baumgartner and Jones1993). Hence, whether attention to statistical indicators, which suggest a change in the problem development, is helpful for re-election is unknown. This is why information about statistical problem indicators contain a weaker signal than information about rival parties. Although studies are increasingly interested in the role of problems such as the economy and immigration (Green-Pedersen Reference Green-Pedersen2019; Pardos-Prado and Sagarzazu Reference Pardos-Prado and Sagarzazu2019), our evaluation of problem indicators resonates with the predominant perception in the literature. Most studies ascribe little theoretical importance to problem indicators but treat them as control variables that may influence the outcome (Spoon, Hobolt, and de Vries Reference Spoon, Hobolt and de Vries2014; van de Wardt, de Vries, and Hobolt Reference van de Wardt, de Vries and Hobolt2014).
Information about public opinion and media reporting on problems lie between the two extremes. Information that the media report about a societal problem signals that a professional actor has evaluated it and decided it is important and newsworthy enough to address. The media is centrally located between voters and politicians, and its power in politics is broadly accepted in the literature (Soroka and Wlezien Reference Soroka and Wlezien2022; Van Aelst and Walgrave Reference Van Aelst and Walgrave2011; Walgrave and Van Aelst Reference Walgrave and Van Aelst2006). However, problems reported in the media do not automatically enter the political arena (Green-Pedersen and Stubager Reference Green-Pedersen and Stubager2010; Van Aelst and Walgrave Reference Van Aelst and Walgrave2011). As long as rival parties and voters do not pick up on the problem, it is uncertain if the problem is relevant to politicians’ efforts to become re-elected.
Given that voters decide politicians' destiny on election day, politicians could simply ‘ride the wave’ and closely follow public concerns about problems (Ansolabehere and Iyengar Reference Ansolabehere and Iyengar1994). However, public opinion is fraught with uncertainty and mixed signals (Jennings and Wlezien Reference Jennings and Wlezien2011; Jennings and Wlezien Reference Jennings and Wlezien2016). Public opinion about problems is often reactive, with the public often following elite opinion (Slothuus and de Vreese Reference Slothuus and de Vreese2010). Taken together, we rank information about the media and public opinion above problem indicators but below rival parties.
Because of the high levels of uncertainty related to the decision, the problem information that needs to be prioritized boils down to political risk aversion. We suggest that most politicians running for office use the most expressive information from rival party politicians. We thus expect that politicians' attention to problem information will be highest if it indicates their rival parties' stance, followed by public opinion and media reporting towards the problem, and, finally, the statistical problem indicators.
It is important to note that our discussion primarily focuses on the advantages of new information more than the costs of acquiring information. This does not mean we disregard the latter aspect; instead, it reflects the complexity of accurately estimating these costs. For instance, politicians may have convenient access to the media, but creating a systematic overview of media coverage demands significant time and effort. Similarly, while politicians frequently engage in debates, obtaining a comprehensive understanding of rival parties can be labour intensive. Finally, although web resources offer easy access to the latest statistics and opinion polls, identifying relevant figures can be challenging.
Case Selection and Context
The Danish local elections in November 2021 are the context of our study. The ninety-eight municipalities where the elections occurred are important political units well suited for our inquiry into politicians' behaviour. Danish municipalities have an average population of 57,000 inhabitants (sd. 65,000), and all feature the same basic political institutions. A council with an odd number of nine to thirty-one members (twenty-six on average) governs each municipality, and a mayor appointed by a coalition comprising the majority of council seats heads the council.Footnote 2 Local politicians are directly elected to the council on a fixed schedule every fourth year through proportional representation using a d'Hondt allocation method with open or semi-closed lists in multi-member districts with no formal minimum vote thresholds (Kjaer and Elklit Reference Kjaer and Elklit2014). Local elections are highly competitive (Bækgaard and Jensen Reference Bækgaard and Jensen2012); voter turnout is generally high – averaging 72 per cent; and councils regularly include representatives of seven or more national parties. Local politicians normally maintain their private employment and spend about eighteen hours per week working in local politics for an average annual remuneration of 26,000 Euro (Pedersen et al. Reference Pedersen2013). In office, they have wide autonomy to allocate approximately half of total public spending on multiple services. This is an important task given the comprehensive social welfare system in Denmark.
About 9,500 candidates compete for the nearly 2,400 seats in local councils. The overwhelming majority of candidates run for the major national parties. As a result, party competition is a dominant feature of Danish municipal elections. Candidates include those seeking re-election alongside new candidates without prior experience in political office. The former surely have more hands-on experience, and perhaps intuition, about which problem information matters. Yet, at the same time, we find that including new candidates in our study is relevant, if not imperative. Many new candidates are soon-to-be-elected local representatives who were nominated because they took part in the local party organization and earned its endorsement to run. Nevertheless, we note that our sample of party candidates includes incumbents who match our theoretically relevant population (that is, politicians representing political parties) precisely because of their role and experience, but also new candidates who are a relatively close match to the theoretically relevant population because of their involvement in party politics and ambition to become politicians (Kertzer and Renshon Reference Kertzer and Renshon2022).
Candidates are offered problem information about climate change and public schools (for further details, see Section D in the Supplementary Information). Most voters and politicians have had first-hand encounters with public schools, and the effects of climate change in Denmark are becoming more visible but still relatively rare and abstract. Apart from that, the two topics were major problem areas that were salient in the 2021 elections. Moreover, local governments have policy-making authority on both matters. Schools are the sole responsibility of local governments in Denmark, whereas municipalities adopt and implement numerous measures related to climate mitigation. With this problem selection, we cannot rule out that pre-treatment influences our results. The candidates in our sample hold prior information about the topics, and we study what additional information politicians are interested in. Candidates might be less inclined to seek new information about problems featuring media reporting and rival parties because they feel they already hold this information. That being said, we assume similar levels of perceived prior knowledge about public concerns and problem indicators. Recent evidence shows that politicians confidently report general public opinion estimations (that is, they give very few ‘don't know’ answers), although they tend to be quite inaccurate (Walgrave et al. Reference Walgrave2023). Statistical problem indicators are perhaps the most accessible type of problem information through online databases and, in the case of incumbents, through the municipal administration. It is unlikely that a lack of information drives candidates’ interest in accessing statistical problem indicators. In any case, circumventing the risk of pre-treatment through problem selection is tricky. It would require employing an obscure, peripheral problem with no prior personal encounter by the politician. Yet, this would easily bring other challenges, such as whether politicians find our inquiry reliable.
Research Design and Data
We conducted a pre-registered large-scale randomized field experiment and completed eighteen elite interviews. The mixed-method approach and data triangulation enabled us to arrive at a comprehensive answer to our research question. Most importantly, the interviews allow us to follow up on the findings of our experiment and address the complexity involved in politicians' attention to information. In the field experiment, we sent emails to candidates in the 2021 Danish local election in our capacity as researchers. In the email, we invited them to learn about a new research report on public schools or climate change, highlighting one of four types of problem information. Thus, we studied politicians' marginal interest in new information where all types of information were equally easy to access, and there was little cost involved in the information search. The assignment of the problem and type of information was randomized, leading to a 4 × 2 factorial design.
Experimental manipulation
New research report on political problems in your region
—
Dear Candidate Name,
We are writing to you because you are running in the 2021 local election.
We are researchers at Aarhus University and would like to draw your attention to new findings from research regarding [climate change/public schools].
Specifically, we have examined [the attitudes of citizens/the opinions of political parties/the media's focus/numbers and statistics] on the subject in your region.
If you are interested in what [citizens think/parties think/the media writes/the numbers say] about [climate change/public schools], you can follow this link to our research report: Click here to access the report
Kind regards,
Henrik B. Seeberg, PhD
Department of Political Science
Aarhus University
The text box above is a copy of the email sent to the candidates. The emails were written in Danish and contained the official email signature of our department and university (the Danish version is shown in Section B in the Supplementary Information). The randomized content is written in brackets. We aimed for concise text, with a focus on ensuring that politicians unambiguously noticed being provided with information about public opinion, rival parties, the media, and statistics – representing the four types of problem information. Our email mentioned that the information concerned the candidate's region, making it particularly interesting for them. The email did not provide details about the content and quality of the information we provided in the report. We accept that this minimalist approach gave us less control over what politicians think they can access but more certainty that the emails only differed regarding our theoretical concepts.
Unlike Members of Parliament, who usually have staff to handle emails, local candidates do not have such resources. As a result, we feel certain that the candidates themselves read our email and consequently clicked on the link. One concern with this setup is that politicians received the email from researchers, whom many consider an authority of independence and evidence, and politicians might be particularly keen to access statistical indicators from researchers. We cannot entirely rule out that the researcher's identity affects politicians' attention, but we accept this because of the ethical advantages of this setup (see the discussion below). That said, a future study could disentangle the importance of various senders by randomizing whether a researcher or other actors send the problem information.
Email Distribution, Sample and Randomization
We began by collecting data about candidates from the major political parties running in the election, which included the candidates’ names, party affiliations, email addresses, municipalities, and regions. We defined major political parties as those represented in the national parliament, leading to ten political parties spanning the entire political spectrum from left to right. To collect our data, we applied web scraping in combination with manual coding. We continuously checked party candidate announcements on parties' websites and social media accounts and fed the relevant information into our database. In addition, we used the official candidate lists from all ninety-eight Danish municipalities, published seven weeks prior to the election. We matched our candidate database against the official candidate lists and added names and contact information as far as possible. In total, we were able to collect data for 6,281 candidates. Table 1 shows that the distribution of candidates across parties in our sample closely matches the distribution of candidates across parties in the election.Footnote 3
Party candidates
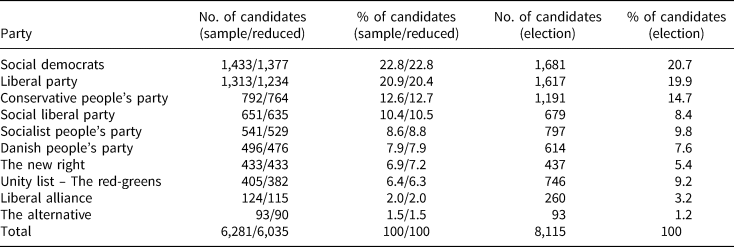
Note: The reduced sample excludes 40 individuals who notified us that they were not running for election, seven candidates who requested that their data be deleted, and 199 individuals who did not receive our email because it failed or bounced back. Note: we only consider candidates running for the major political parties. Candidates representing local lists of citizens are omitted.
Next, we randomly assigned party candidates to the treatment conditions. We applied block randomization to reduce sampling variability and improve precision (Moore Reference Moore2012). We wanted to achieve treatment groups of similar size within parties and geographical areas and used the variables ‘party’ and ‘region’ for block randomization.Footnote 4 These are relevant blocking variables because they likely correlate with attention to problem information. First, candidates from extreme parties might be less likely to engage with information being sent from researchers. Second, candidates on the right might be less likely to engage with climate change and statistics.Footnote 5 Third, party candidates from regions further away from Aarhus University (in Jutland) might be less likely to engage with our email. Treatment assignment probabilities are constant across blocks. We use the R package randomizr to apply block randomization on our final sample of 6,281 candidates, resulting in 781 to 788 party candidates across the eight treatment conditions (Coppock Reference Coppock2019). Pre-registered power analyses show that the sample size is adequate to detect small differences in proportions between treatment groups.
On Friday, 15 October 2021, we emailed all candidates in our database. The proximity to election day (Tuesday, 16 November 2021) was about one month and was chosen for several reasons. First, the candidate lists were finalized at this point in time, which means that we knew who was officially running for office. This allows us to recheck that our database consists of a large and diverse sample of actual candidates. Second, the election campaign had already begun, which makes it plausible that candidates receive requests from voters, organizations, and institutions. Our email to the candidates was, therefore, not unusual. Third, even though we were close to election day, most candidates were less busy than in the final days before the election. This reduced the burden for candidates and increased the likelihood that the candidates read the email.
The distribution of emails was scheduled within a very small time window of 25 min (6:55 AM to 7:20 AM), which was done to reduce the possible impact of exogenous events between the distribution of emails. In addition, we wanted to increase the chances that the candidates read our email in private (that is, when they were not with other candidates). This would be more likely in the morning than in the afternoon or evening when they meet in panel discussions and the like. Each candidate received an email with a personal link distributed via Qualtrics. Candidates clicking on the link were redirected to a Qualtrics webpage where they could read and download the linked material. This setup allowed us to register whether candidates clicked the link and downloaded the report.
The Material to Access Through the Link
Candidates who decided to follow the link received access to a specially tailored report representing the problem information advertised in the email. Individual reports were customized to represent the treatment condition (problem and type of problem information) and the candidates' region. After clicking the link, candidates stated the region in which they were running to see the report for their region. In sum, we drafted forty (2 problems × 4 types of information × 5 regions) different reports to present real and useful information to the candidates. We relied on a rich set of publicly available data. The report about public opinion used data about attitudes toward public schools and climate change from the Danish National Election Study and Google Trends, among other sources. The report about rival parties used data from a research project that provided information about the party's political agenda in Danish municipal councils, which included public schools and climate change (Mortensen, Loftis, and Seeberg Reference Mortensen, Loftis and Seeberg2022). In addition, we collected and added recent statements about two problems from party candidates to our reports.
The report about media attention showed the number of articles about public schools and climate change in major regional newspapers throughout the last six months. In addition, we collected and added recent newspaper headlines about these two problems. Finally, the report showing statistical indicators builds on data from the Ministry of Education and the National Statistical Bureau of Denmark, providing regional-level statistics about expenses for public schools, pupil well-being, the number of heatwaves, and the projected temperature rise. All reports were written in Danish, followed the same structure, and were 1.5 pages long, including figures. Figure 1 presents the layout of our reports.Footnote 6
Report layout.

Outcome Measures
The main outcome is a binary response indicating whether the party candidate clicks on the link provided in the email (measure takes the value of 1) or not (measure takes the value of 0) . Thus, we measured actual, real-time behaviour indicating politicians' attention to problem information, which was a key asset of the field experiment. Our measurement approach represents a realistic setup in the digital era, where most information searches, news consumption, and personal communication occur online. Much information and communication go through politicians' email inboxes – for example, when they receive an early-morning news update, requests from citizens, or new statistics from interest organizations. Hence, our email with the offer to access problem information mimics an everyday situation in which politicians must decide whether they should pay attention. We collected outcome measures over two weeks, from when we sent the invitation until our debriefing email. If candidates replied to us via email, that was not considered an outcome measure.Footnote 7
Two additional outcomes were measured. Following the link, each candidate was asked whether they wanted to download a pdf version of the report. The outcome measure is a binary response indicating whether the candidate wishes to download the report (measure takes the value of 1) or not (measure takes the value of 0). For candidates who do not click on the link, the measure takes the value of 0. Finally, we measure how much time (that is, seconds) the candidate uses to engage with the linked material after clicking on the link. For candidates who do not click on the link, the measure takes the value of 0. The outcome variables we examine are measured downstream of either opening the email or accessing the report. We assign more importance to link clicking because we have greater confidence that the only distinction in exposure between treatment groups lies in the information type, given our manipulation in the email. Therefore, it provides a more direct assessment of politicians' reactions to different types of information. The rank order of the outcome measures was specified in our pre-analysis plan.
Ethical Considerations
Field experiments are popular in political science, and there has been a particular interest in their use to study political elites (Butler, de Vries, and Solaz Reference Butler, de Vries and Solaz2019; Butler and Nickerson Reference Butler and Nickerson2011; Gerber Reference Gerber, Druckman, Greene, Kuklinski and Lupia2011). Recently, however, there has been a critique of field experiments with elites because of the frequent use of deception (Grose Reference Grose, Druckman and Green2021; Loewen and Rubenson Reference Loewen and Rubenson2022). The emails we sent to candidates were brief, clear, and polite. After a salutation, we clearly identified ourselves as researchers and drew attention to our report. We thus avoided identity deception. We gave our respondents access to the reports advertised in the email. The reports build on real data about relevant societal problems, which means we avoid misinformation and add value to the participants' role as representatives (Loewen and Rubenson Reference Loewen and Rubenson2022). If a candidate follows the link and reads about the information representing the randomized cue in the email, they have the opportunity to access the remaining reports afterwards. In other words, we offered the same information to all candidates in our sample. As mentioned, we sent the candidate a follow-up debrief email two weeks after our first email. In this email, we informed the candidates that they had taken part in a study and offered them the opportunity to withdraw their outcome responses. We note that only seven candidates requested that their data be deleted. In addition, we provided them the opportunity to see the results of our study as soon as they became available.
Results
In our main analysis, the number of observations is 6,035, and the presentation of our results focuses on the main outcome variable (that is, click on the link) measured immediately after the randomized experimental manipulation.Footnote 8 Our first finding was that the candidates in our sample were keen to access problem information, even though they were probably busy on the campaign trail. In total, 1,527 candidates clicked on the link, corresponding to 25.3 per cent of all candidates. The observed click rate exceeds click rates in similar field experiments that examine local politicians in Europe and US state legislators where the email was sent by a researcher (Butler, de Vries, and Solaz Reference Butler, de Vries and Solaz2019; Purtle et al. Reference Purtle2022) and is on par with a recent study on more than 7,000 US state legislators using a very similar experimental research design (Schiff and Schiff Reference Schiff and Schiff2023). The only comparable study reporting a higher click rate is that by Pereira (Reference Pereira2022), who examined nearly 19,000 local elected officials across US communities and found a click rate of 38.3 per cent. Figure 2 shows that the majority of candidates who clicked on the link did so immediately after receiving the email. The data displayed in the histogram are grouped into bins of 120 minutes. The grey rectangles in the background represent the fourteen days when the data was collected. This result minimizes the risk that the respondents influenced other respondents’ decisions to click on the link.
Time until the link click.

We report the main results from our intention-to-treat (ITT) analysis in Fig. 3.Footnote 9 Panel A in Fig. 3 shows click rates across the four types of problem information. The highest click rate was observed for candidates offered access to a report about statistical problem indicators: 26.9 per cent of candidates assigned to the condition clicked on the link. The click rate of the respondents who were provided with problem information featuring public opinion is similarly high at 26.5 per cent.
Click rates by treatment conditions (a) and effects on link clicking (b).
Note: Based on results in Tables SI 2 and Table SI 4 in the Supplementary Information.

The rates for the two remaining conditions are 24.4 per cent (party positions) and 23.2 per cent (media reporting). As shown in panel b of Fig. 3, we estimate a statistically significant −3.7 (95 per cent CI −6.7 to −0.6) percentage point ITT effect on clicking for the media reporting condition compared to the statistical indicator condition. Thus, politicians are 14.7 per cent less likely to click the link to access statistical indicator information than media information. The estimated ITT effect on clicking for the party position condition is −2.5 (95 per cent CI −5.6 to 0.6) percentage points lower compared to the statistical indicator condition. The results suggest that many politicians are keen to access problem information, especially statistical indicators and public opinion, and do not support the expectation that politicians are most likely to attend to problem information about rival party positions. Although our findings show that statistical indicators and public opinion can lead to increased click rates compared to rival parties and the media, the magnitude of these differences is relatively small. At first glance, this suggests that the type of information may not strongly influence politicians’ interests. However, our finding is noteworthy as it contradicts our initial expectations and challenges existing research, often underscoring the importance of rival parties and the media for politicians. Additionally, we note that the click rate variation corresponds to that reported in similar field experiments with politicians (Purtle et al. Reference Purtle2022; Schiff and Schiff Reference Schiff and Schiff2023), including one with a strong partisan motivation to follow the link in the email (Pereira Reference Pereira2022).
Figure SI 9 in Section D in the Supplementary Information shows click rates for the two problem conditions. The click rates in the case of reports about public schools and climate change are 27.2 per cent and 23.4 per cent, respectively. We report detailed results for our additional outcome measures in the Supplementary Information (Sections J and K). We observe the highest download rates for problem information that features public opinion (9.4 per cent) and statistical problem indicators (8.4 per cent). However, estimated ITT effects do not statistically differ between the four experimental cue conditions. Respondents are more likely to download reports on public schools (9.1 per cent) than climate change (7.9 per cent). Across various model specifications, we observed that candidates spent most of their time engaging with public opinion reports. Reports on statistical indicators received an equivalent level of attention compared to the remaining treatment groups.
We explored possible differences between incumbents and non-incumbents, showing that incumbents were particularly interested in accessing statistical problem indicators: 28.9 per cent of incumbents assigned to the condition clicked on the link. The click rate for incumbents who were offered information about public opinion was 26.0 per cent. The rates for the two remaining conditions were 21.0 per cent (rival parties) and 18.9 per cent (media reporting) and differed from the click rates of non-incumbents in substance and statistical significance. We show detailed results for incumbent candidates (that is, candidates who won a seat in the most recent election), including an approach in which we account for background variables and elected candidates (that is, candidates who won a seat in the current election) in Section F and Section G in the Supplementary Information. The key takeaway from the analysis of our experimental data is that the politicians in our sample attended to problem information, and they were more interested in information regarding statistical problem indicators and public concern than rival party positions and media reporting.
Evidence from Interviews with Politicians
Our interviews allow us to better understand politicians’ attention to problem information and add new insights. Most importantly, we can address the complexity of politicians' attention to problem information and learn more about the dynamic interactions between different kinds of problem information. Another strength of the interviews vis-a-vis the experiment is that we can ask the politicians follow-up questions, particularly about their underlying reasoning. This way, the interviews allow us to follow up on the experimental findings (Creswell and Clark Reference Creswell and Clark2018). We sent ninety recruitment emails to candidatest included in the field experiment, balancing the share of incumbents (vs. non-incumbents) and clickers (vs. non-clickers). We conducted eighteen semi-structured phone and video interviews between 10 December 2021 and 28 January 2022 (an interview rate of 20 per cent). The interviewees represented seven parties and fourteen municipalities. We interviewed eleven men and seven women. Seven interviewees were incumbents before the election in November 2021; twelve interviewees were elected in the election. Twelve interviewees clicked on the link, but six did not. We avoided prompting specific answers and minimized the risk of social desirability bias by asking open questions about politicians' approaches to addressing problems. We describe further details and the interview guidelines in Section M in the Supplementary Information.
Echoing a key finding from the experiment, most politicians expressed a clear interest in statistical problem indicators and public opinion. In particular, we found additional support for the idea that politicians considered statistical indicators an important aspect of problem-solving. One interviewee explained it this way: ‘Problem indicators are indispensable for my political work and important to understand the core of the problem.’ Hence, regarding understanding the reasons behind the behaviour we observe in the experiment, almost all interviewees acknowledged that numbers and statistics matter greatly because they build the foundation for political decision-making. From the answers in our interviews, we take it that politicians need to have information to engage with problems, enter debates about the issues, and find joint solutions. In sum, our interviewees expressed a clear interest in evidence-based reports presenting statistics about issues similar to the ones we distributed.
Our interviews also shed light on the role of problem indicators in the decision-making process. Most politicians pointed out two ways of learning about societal problems. These answers mostly emanate from open-ended questions in the interviews in which we asked politicians to describe a typical process to ascertain the importance of a problem. First, they rely on their personal and professional experience through their education and jobs. ‘As a former teacher and school principal, I know exactly what the most pressing problems are’, one politician stated. Second, most politicians learn about problems from citizens through official requests, casual conversations, or social media. However, to find out whether there is ‘a real problem’, as several interviewees put it, citizens' requests need to be checked against problem indicators. One politician explained that citizens' concerns often set a more detailed investigation of problem indicators in motion. Another politician pointed to the importance of having access to problem indicators to solve problems: ‘You simply need to know the facts to change something.’ This helps to explain our unexpected finding in the experiment, namely high alertness to statistical indicators.
The interviewees used different sources to access problem indicators. Most incumbent politicians highlighted the role of the municipal administration that provided them with relevant and up-to-date data and analyses. Several respondents indicated that they tried to find data and reports online. A few politicians admitted that sometimes, it ‘can be difficult to access high quality problem indicators’. This might explain the popularity of our offer to access this information directly. A few interviewees confessed they were critical towards problem indicators that did not support their position and values. This aligns with recent research that suggests biased elite information processing (Baekgaard et al. Reference Baekgaard2019). One interviewee said that they sometimes strategically use problem indicators. If the numbers support their position, they use them actively in debates with other politicians to convince them. In essence, our interviews provide rich evidence that politicians are keen to access and use problem indicators because (together with public opinion) they form the basis of their political decisions. Moreover, and reassuring for our interpretation of the results in the field experiment, no interviewee stressed researchers as the source of information crucial to following the link in the email.
Responses were more mixed when it came to rival parties and the media. Some interviewees were open to the idea of paying attention to rival parties' problem focus because politicians of rival parties might have good proposals for the benefit of society. Others said they would like to ignore ‘populist parties that focus on problems that are difficult or impossible to solve’. However, these parties might influence voters, which is why politicians need to pay attention to their problem focus, at least to some extent. Several interviewees remarked that they track and discuss rival parties' behaviour but often decide not to address the same problems and focus on their own core issues instead. Official meetings, public debates, and professional networks are frequently used to learn about the problem of attention of politicians from rival parties.
A frequent comment referred to scepticism towards the media's problem focus. Respondents remarked that the media had changed dramatically: ‘In the old days, it was about enlightening people and allowing them to form an opinion. Today, it's about producing attention-getting headlines.’ Several politicians said that the media's problem focus does not reflect actual problems, but they need to follow the media closely because of its potential impact on voters. This interview testimony hints at why information about rival parties and the media was less attractive to politicians. If we compare the answers in our interviews from incumbents and non-incumbents, a key finding is that they have much in common regarding filtering and processing problem information. However, incumbents appear more experienced and more aware of the discrepancies between the four types of problem information that we analyse. Most strikingly, these interviews support the finding in the experiment that incumbents put information about statistical problem indicators and public opinion before information about rival parties and media reporting.
Conclusion and Discussion
Despite a busy schedule, scarce attention, and multiple demands, the results from our field experiment and elite interviews with local politicians in Denmark in 2021 reveal that politicians close to an election show great interest in accessing new problem information – of any flavour. According to our findings, they are notably interested in statistics and public opinion while placing somewhat less emphasis on – what they perceive as flawed or biased – perspectives from rival parties and the media.
Extant research finds that politicians are exposed to far more information about problems than they can possibly attend to. It identifies four central types of information that make politicians react to problems. However, based on previous results, it was difficult to understand which kind of new information was most important and whether problem information had a causal impact on politicians' attention. Our field experiment and elite interviews with local Danish politicians confirm that new information about the media and rival parties is indeed relevant, but statistical problem indicators and public opinion are equally, if not more, important. Our finding is surprising because previous research documents the strong impact of information about party competition and the media on politicians' problem attention.
To interpret the results accurately, it is important to emphasize that our study focuses on a particular type of information. First, our experiment concerns the next piece of information politicians wish to seek after collecting information throughout their tenure and campaign. Second, in our experiment, all information types are equally easy to access, which might not be the case in real-life situations. Nonetheless, our findings suggest that scholars may be ill-advised to focus too exclusively on rival parties and the media in research concerning politicians' problem attention. Rather, we should place greater emphasis on politicians' interests in statistical indicators and public opinion to comprehensively understand their decision-making process when addressing and resolving societal problems.
This begs important new questions that need to be explored in future work. For instance, what is the sequence in politicians' use of new problem information? Our elite interviews hint that politicians begin with the voters and then fact-check their concerns with statistical indicators. This suggests a sequence in the use of problem information that raises an important question about the degree to which problem information is used early in the process, such as whether public concerns about politicians' responsiveness to problem information conditions politicians’ responsiveness to problem information later in the process. We encourage future research to illuminate the connections between different types of problem information.
Our finding is reassuring for representative democracy because it indicates that politicians do not live in a bubble detached from the real world. They are not preoccupied with inside-the-bubble elite competition and media news value. Instead, we take from our findings that politicians actually want to learn about real-world problems, which can be seen as a requirement for problem-solving and advancing the well-being of citizens. In fact, politicians' ability to respond to new problem information is a central requirement for problem-solving. Recent experimental inquiries into elite behaviour show that motivated reasoning and ideological priors affect how decision-makers respond to information (Baekgaard et al. Reference Baekgaard2019; Sheffer et al. Reference Sheffer2018). This stands in contrast to recent research on citizens, suggesting that biases in information processing are less prevalent than commonly assumed (see Coppock Reference Coppock2022; Guess and Coppock Reference Guess and Coppock2020; Porter and Wood Reference Porter and Wood2019). While these findings are important for our understanding of how individuals process information, our results cast light on how elites select information in the first place. Selection comes prior to processing, and a comprehensive evaluation of politicians' use of problem information should consider both. We suggest that our findings contrast the information-processing biases identified by previous studies on elites because they show that politicians are actively engaged in learning about problem indicators, which is an understudied but necessary first step to identify and later solve problems. Incumbents who match our theoretically relevant population are keen to access statistical indicators about societal problems compared to information about how the media and rival parties address the problem. This finding suggests a sincere interest in statistical problem indicators because incumbents enjoy comprehensive access to evidence through their municipal administration.
We studied politicians' problem attention in a field experiment in the Danish local election in 2021, raising the question of whether the findings travel beyond this context. We argue that our results travel to local politicians in other advanced democracies outside Denmark in so far as these politicians are re-election oriented and operate in a competitive party political environment. If politicians spend far less time in the local assembly; reside in a smaller and, therefore, less professional political organization without a local media presence; or navigate a highly hostile and polarized political environment, the incentives of the politicians might differ. We expect our findings to apply to national politicians. Many national politicians have a history in local politics and resemble the incumbents in our study.
We focus on two problems that differ with regard to their level of obtrusiveness and expect our findings to apply broadly across similar problems (Soroka Reference Soroka2002). However, it is possible that unobtrusive and non-salient problems may receive lower levels of attention than the unobtrusive but salient campaign issue, climate change. In other words, problem characteristics other than obtrusiveness might impact politicians' problem attention. Finally, we implemented our field experiment ahead of an election. Information about problem attention from politicians of rival parties should be particularly pertinent at elections and less relevant at a distance from the next election. As a result, we might expect to find differences between problem information on statistical indicators and rival parties that are even larger than in our field experiment. Of course, these questions will be best addressed in future empirical tests, in different contexts, with national politicians, in-between elections, and on different problems.
Supplementary material
The supplementary material for this article can be found at https://doi.org/10.1017/S000712342400005X.
Data availability statement
Replication data for this article can be found in Harvard Dataverse at: https://doi.org/10.7910/DVN/XQDMIN.
Acknowledgements
We thank Sofie Berg-Sørensen and Mads Færge Grønne for excellent research assistance. We are grateful to Daniel Bischof, Martin Bisgaard, Jens Blom-Hansen, Troels Bøggild, Martin Bækgaard, Peter Munk Christiansen, Mia Costa, Florian Foos, Christoffer Green-Pedersen, Christian Grose, Jesper Asring Hansen, Kristina Jessen Hansen, Frederik Hjorth, Carsten Jensen, Devin Judge-Lord, Martin Vinæs Larsen, Jack Lucas, Peter Bjerre Mortensen, Asmus Leth Olsen, Mathias Osmundsen, Helene Helboe Pedersen, Miguel Maria Pereira, Jesper Wiborg Schneider, Kaylyn Jackson Schiff, Daniel Schiff, Dominik Schraff, Kristina Bakkær Simonsen, Rune Slothuus, Mathias Tromborg, Resul Umit, Mathias Bukh Vestergaard, Elisa Volpi, Stefaan Walgrave, David Weisstanner, Adam Zelizer, members of the M2P group at the University of Antwerp, and members of the ‘Comparative Politics’ section at Aarhus University for helpful comments on our pre-analysis plan and manuscript. Previous versions were presented at the Elite & Experiments Conference 2021, Aarhus University, Aalborg University, and the University of Antwerp.
Financial support
This research was supported by a grant from the Aarhus University Research Foundation (Grant no. 33693).
Competing interests
None.
Ethical standards
The research was conducted in accordance with the protocols approved by the Institutional Review Board at Aarhus University (2021-58).


 Open access