

Introduction
Attention deficit hyperactivity disorder (ADHD) is one of the most commonly diagnosed childhood disorders, defined by age-inappropriate problems with inattention, impulsivity and hyperactivity (APA, 2013). Autism spectrum disorder (ASD) is characterized by abnormalities in social interaction, communication and stereotyped/repetitive behaviours. Both disorders are highly heritable and share high comorbidity (Simonoff et al. Reference Simonoff, Pickles, Charman, Chandler, Loucas and Baird2008; Rommelse et al. Reference Rommelse, Franke, Geurts, Hartman and Buitelaar2010). About 20–50% of ADHD children meet criteria for ASD and 30–80% of ASD children meet criteria for ADHD (Rommelse et al. Reference Rommelse, Franke, Geurts, Hartman and Buitelaar2010). Apart from comorbidities, ASD patients show some ADHD-typical behaviours such as attention deficits, impulsivity or hyperactivity (Schatz et al. Reference Schatz, Weimer and Trauner2002) whereas ADHD patients also show some social interaction and communication difficulties, albeit to a smaller degree than ASD patients (Geurts et al. Reference Geurts, Verte, Oosterlaan, Roeyers and Sergeant2004).
Despite the reported genetic and behavioural overlap between the two disorders, a diagnosis of ADHD according to DSM-IV (APA, 2000) and ICD-10 (WHO, 1994) was precluded if the symptoms were better accounted for by autism. It has been debated whether the phenotypically similar ADHD-related deficits in ASD are secondary to ASD or a phenocopy, which had prevented the co-diagnosis in DSM-IV and ICD-10 (APA, 2000), or whether they reflect true comorbidity, as suggested in the allowance for co-diagnosis in the current DSM-5 criteria (APA, 2013). The identification of both overlapping and disorder-specific objective neurobiological biomarkers should help to determine to what extent the two disorders differ in their underlying neurobiology.
ADHD is a multi-systemic neurodevelopmental disorder that has consistently been associated with abnormalities in structure, function and inter-regional connectivity of fronto-striato-parieto-temporal and fronto-cerebellar networks (Valera et al. Reference Valera, Faraone, Murray and Seidman2007; Nakao et al. Reference Nakao, Radua, Rubia and Mataix-Cols2011; Rubia, Reference Rubia2011; Cubillo et al. Reference Cubillo, Halari, Smith, Taylor and Rubia2012a ; Rubia et al. Reference Rubia, Alegria and Brinson2014). Structural magnetic resonance imaging (sMRI) studies using region of interest (ROI) analyses have reported reduced grey matter (GM) volume and cortical thickness, most prominently in the cerebellar hemispheres (Castellanos et al. Reference Castellanos, Lee, Sharp, Jeffries, Greenstein, Clasen, Blumenthal, James, Ebens, Walter, Zijdenbos, Evans, Giedd and Rapoport2002; Durston et al. Reference Durston, Hulshoff Pol, Schnack, Buitelaar, Steenhuis, Minderaa, Kahn and van Engeland2004; Mackie et al. Reference Mackie, Shaw, Lenroot, Pierson, Greenstein, Nugent, Sharp, Giedd and Rapoport2007; Valera et al. Reference Valera, Faraone, Murray and Seidman2007) and cerebellar vermis (Mackie et al. Reference Mackie, Shaw, Lenroot, Pierson, Greenstein, Nugent, Sharp, Giedd and Rapoport2007; Valera et al. Reference Valera, Faraone, Murray and Seidman2007), but also in the basal ganglia and frontal regions (Shaw et al. Reference Shaw, Eckstrand, Sharp, Blumenthal, Lerch, Greenstein, Clasen, Evans, Giedd and Rapoport2007). Whole-brain sMRI studies, however, found that the most consistent GM reductions were in the basal ganglia (Nakao et al. Reference Nakao, Radua, Rubia and Mataix-Cols2011; Frodl & Skokauskas, Reference Frodl and Skokauskas2012).
sMRI studies have reported abnormal GM volumes and cortical thickness in ASD patients relative to controls in several brain regions involved in social, language and executive functions, including prefrontal, temporo-parietal, striatal, limbic and cerebellar regions (Amaral et al. Reference Amaral, Schumann and Nordahl2008; Nickl-Jockschat et al. Reference Nickl-Jockschat, Habel, Michel, Manning, Laird, Fox, Schneider and Eickhoff2012). However, findings have been inconsistent with respect to the direction of GM differences; some studies found increases in GM volumes or cortical thickness (Bonilha et al. Reference Bonilha, Cendes, Rorden, Eckert, Dalgalarrondo, Li and Steiner2008; Hyde et al. Reference Hyde, Samson, Evans and Mottron2010) whereas others found decreases (Brun et al. Reference Brun, Nicolson, Lepore, Chou, Vidal, DeVito, Drost, Williamson, Rajakumar, Toga and Thompson2009; Webb et al. Reference Webb, Sparks, Friedman, Shaw, Giedd, Dawson and Dager2009; Toal et al. Reference Toal, Daly, Page, Deeley, Hallahan, Bloemen, Cutter, Brammer, Curran, Robertson, Murphy, Murphy and Murphy2010) or no differences (Hazlett et al. Reference Hazlett, Poe, Gerig, Smith, Provenzale, Ross, Gilmore and Piven2005; Scott et al. Reference Scott, Schumann, Goodlin-Jones and Amaral2009). Studies on the developmental course of brain abnormalities in autism indicate a putative period of abnormal precocious brain growth that is time delimited to the first 2–4 years of life but then plateaus by adolescence and adulthood (Amaral et al. Reference Amaral, Schumann and Nordahl2008; Courchesne et al. Reference Courchesne, Campbell and Solso2011), with some studies finding arrested growth after adolescence (Amaral et al. Reference Amaral, Schumann and Nordahl2008).
Despite evidence for high comorbidity rates and abnormalities in similar brain systems, in particular in frontal and cerebellar regions, few studies have compared the two disorders to elucidate shared and disorder-specific underlying neurobiological biomarkers. The only sMRI study to date that compared relatively small numbers of 15 ADHD and 15 ASD children found shared reductions in the GM of temporo-parietal regions and also increased GM of the supramarginal gyrus in ASD relative to controls, but not ADHD (Brieber et al. Reference Brieber, Neufang, Bruning, Kamp-Becker, Remschmidt, Herpertz-Dahlmann, Fink and Konrad2007). However, the findings did not survive correction for multiple testing. In addition, most ADHD patients were on chronic stimulant medication and two ASD patients took neuroleptic medication that could have confounded the findings, given that long-term psychotropic medication is associated with more normal brain structure (Shaw et al. Reference Shaw, Sharp, Morrison, Eckstrand, Greenstein, Clasen, Evans and Rapoport2009; Murphy, Reference Murphy2010; Nakao et al. Reference Nakao, Radua, Rubia and Mataix-Cols2011; Rubia et al. Reference Rubia, Alzamora, Cubillo, Smith, Brammer and Radua2013a ). The very few published functional MRI (fMRI) comparisons between the disorders found task-dependent shared and disorder-specific deficits: shared dorsolateral prefrontal deficits during working memory (Chantiluke et al. in press a); shared dorsolateral prefronto-striato-parietal underactivation and reduced deactivation of posterior cingulate/precuneus default mode regions, but ASD-specific cerebellar overactivation during sustained attention (Christakou et al. Reference Christakou, Murphy, Chantiluke, Cubillo, Smith, Giampietro, Daly, Ecker, Robertson, Murphy and Rubia2013); ASD-specific underactivation in the ventromedial prefrontal cortex during reversal learning (Chantiluke et al. Reference Chantiluke, Barrett, Giampietro, Brammer, Simmons, Murphy and Rubia2014a ) and ADHD-specific orbitofrontal–striatal underactivation and ASD-specific left frontal overactivation during motor inhibition (Chantiluke et al. in press b). During temporal discounting, comorbid ADHD and ASD patients had unique brain–behaviour correlation abnormalities relative to controls in ventromedial and lateral frontolimbic regions, followed by the ASD group who had disorder-specific brain–behaviour correlation abnormalities in inferior frontotemporal regions (Chantiluke et al. Reference Chantiluke, Christakou, Murphy, Giampietro, Daly, Ecker, Brammer, Murphy and Rubia2014b ). Finally, a recent resting-state fMRI study reported shared network centrality abnormalities in the precuneus, ADHD-specific increases in network centrality in the right striatum/pallidum and ASD-specific increases in network centrality in predominantly left temporolimbic areas (Di Martino et al. Reference Di Martino, Zuo, Kelly, Grzadzinski, Mennes, Schvarcz, Rodman, Lord, Castellanos and Milham2013).
Given the importance of establishing disorder-specific biomarkers in these two related disorders and evidence of the impact of long-term neurotropic medication on brain structure (Shaw et al. Reference Shaw, Sharp, Morrison, Eckstrand, Greenstein, Clasen, Evans and Rapoport2009; Murphy, Reference Murphy2010; Nakao et al. Reference Nakao, Radua, Rubia and Mataix-Cols2011; Rubia et al. Reference Rubia, Alzamora, Cubillo, Smith, Brammer and Radua2013a ), we investigated shared and disorder-specific GM and white matter (WM) abnormalities in 44 predominantly medication-naïve ADHD boys, 19 medication-naive ASD boys and 33 healthy boys.
Method
Participants
Forty-four mostly medication-naïve right-handed male adolescents with a clinical diagnosis of inattentive/hyperactive-impulsive combined type ADHD, but not ASD, were recruited from out-patient clinics at the South London and Maudsley National Health Service (NHS) Foundation Trust. Diagnosis was assessed by a child psychiatrist using the standardized Maudsley Diagnostic Interview (MDI; Goldberg & Murray, Reference Goldberg and Murray2002), which assesses ADHD according to DSM-IV-TR criteria (APA, 2000). All patients scored above the clinical cut-off for hyperactive-impulsive/inattentive symptoms on the parental Strengths and Difficulties Questionnaire (SDQ; Goodman, Reference Goodman1997) and the Conners’ Parent Rating Scale (CPRS; Conners et al. Reference Conners, Sitarenios, Parker and Epstein1998). ADHD patients were excluded if they scored above the clinical cut-off on the Social Communication Questionnaire (SCQ; Rutter et al. Reference Rutter, Bailey and Lord2003). Most ADHD patients (81.8%) were medication naïve, except for six patients (13.6%) who received methylphenidate but had a wash-out of 48 h before scanning and two patients who had been treated with methylphenidate in the past. Nineteen right-handed medication-naïve male adolescents with a diagnosis of ASD, but not ADHD, were recruited through out-patient clinics. The ASD diagnosis was made using ICD-10 research diagnostic criteria (WHO, 1994), confirmed by the Autism Diagnostic Interview – Revised (ADI-R; Lord et al. Reference Lord, Rutter and Le Couteur1994) and the Autism Diagnostic Observation Schedule (ADOS; Lord et al. Reference Lord, Rutter, Goode, Heemsbergen, Jordan, Mawhood and Schopler1989). ASD patients were excluded if they scored above 7 on the Hyperactivity/Inattention ratings on the SDQ. Five boys had high functioning autism (HFA) and 14 boys had Asperger's disorder. ADOS modules were selected based on verbal ability and age (Lord et al. Reference Lord, Risi, Lambrecht, Cook, Leventhal, DiLavore, Pickles and Rutter2000). Because of the high (verbal) functioning of the ASD boys, ADOS module 4 was used. Thirteen ASD boys reached the SCQ score cut-off. However, the algorithm used to obtain this score is not entirely indicative of clinical impairment and algorithms incorporating restricted and repetitive behaviours are more sensitive, as evidenced by the use of an algorithm that includes stereotyped behaviours in the new ADOS-2 (Lord et al. Reference Lord, Rutter, DiLavore, Risi, Gotham and Bishop2012). The ADI-R and ADOS are used in conjunction to obtain a holistic view and reliable diagnosis of an individual (Papanikolaou et al. Reference Papanikolaou, Paliokosta, Houliaras, Vgenopoulou, Giouroukou, Pehlivanidis, Tomaras and Tsiantis2009). All ASD participants scored above the clinical cut-off on the social, communication and restrictive and repetitive behaviour domains of the ADI-R and this, alongside the ADOS scores, was used to ensure that each adolescent met the criteria for ASD.
Thirty-three, age-matched, right-handed healthy boys were recruited through advertisement and scored below clinical thresholds on the SDQ and SCQ (Table 1). Participants were excluded if they had comorbid psychiatric disorders as assessed by the MDI, including learning disabilities, reading, speech or language disorder, neurological abnormalities, epilepsy, substance abuse and an IQ < 70 on the Wechsler Abbreviated Scale of Intelligence (WASI; Wechsler, Reference Wechsler1999). Participants were reimbursed £50 for taking part in the study and written informed consent was obtained. The study was approved by the Camberwell St Giles Research Ethics Committee.
Sample characteristics of participants

IQ, Intelligence quotient as assessed with the Wechsler Abbreviated Scale of Intelligence (WASI); ADHD, attention deficit hyperactivity disorder; ASD, autism spectrum disorder; CON, controls; CPRS-R, revised Conners’ Parent Rating Scale; SDQ, Strengths and Difficulties Questionnaire; SCQ, Social Communication Questionnaire; ADI-R, Autism Diagnostic Interview – Revised; ADOS, Autism Diagnostic Observation Schedule; n.s., not significant.
Values given as mean (standard deviation).
a Bonferroni correction.
MRI image acquisition
Images were acquired using a 3-T GE Signa HDx system (General Electric, USA) at the Centre for Neuroimaging Sciences, Institute of Psychiatry, King's College London, UK. The body coil was used for radio frequency (RF) transmission and an eight-channel head coil for RF reception. High-resolution structural three-dimensional (3D) T1-weighted magnetization-prepared rapid gradient-echo (MPRAGE) images were acquired. Full brain and skull coverage was required for each subject and detailed quality control was carried out on all MR images according to previously published quality control criteria (Simmons et al. Reference Simmons, Westman, Muehlboeck, Mecocci, Vellas, Tsolaki, Kloszewska, Wahlund, Soininen, Lovestone, Evans and Spenger2011).
VBM-DARTEL image preprocessing
The images were first visually inspected for artefacts and structural abnormalities. Next, a VBM analysis (Ashburner & Friston, Reference Ashburner and Friston2000) was conducted to investigate group differences in GM volumes using SPM8 software (Statistical Parametric Mapping, Wellcome Department of Imaging Neuroscience, London, UK). The T1-weighted volumetric images were preprocessed using the VBM protocol with modulation (Ashburner, Reference Ashburner2007), where the images were first segmented into GM, WM and cerebrospinal fluid (CSF). The DARTEL algorithm was applied to the segmented brain tissues to generate a study-specific template and to achieve an accurate inter-subject registration with improved realignment of smaller inner structures (Yassa & Stark, Reference Yassa and Stark2009). The normalized modulated segmented GM/WM images were next affine transformed into Montreal Neurological Institute (MNI) space and smoothed with an isotropic Gaussian kernel of 8 mm at full-width half-maximum, providing a balance between predicted subcortical and cortical effects, and to accommodate the assumptions of Gaussian random field theory and the matched filter theorem.
VBM analysis
Group differences were evaluated for GM/WM volumes obtained in the tissue segmentation step of the VBM-DARTEL preprocessing. The total brain volume (TBV) was calculated as the sum of GM and WM volumes. The normalized modulated and smoothed GM/WM images in each group were entered into voxel-wise ANOVAs using SPM8. We used a cluster-defining voxelwise threshold of p < 0.01 (uncorrected) and a stringent cluster threshold of p < 0.05 family-wise error (FWE) rate corrected for all the analyses. Cluster sizes were adjusted for smoothness non-uniformity by means of the VBM5.1 toolbox (Hayasaka et al. Reference Hayasaka, Phan, Liberzon, Worsley and Nichols2004). To test for correlations between structural abnormalities in GM and clinical symptoms, simple regression analyses were performed within each group.
Results
Participant characteristics
Groups did not differ significantly in age but there were significant differences in IQ (F 2,93 = 27.3, p < 0.001) (Table 1). Post-hoc analyses showed that this was because the ADHD boys had lower IQs than healthy and ASD boys (p < 0.01), which is typical of the ADHD population (Kuntsi et al. Reference Kuntsi, Eley, Taylor, Hughes, Asherson, Caspi and Moffitt2004). When a covariate differs between groups because it is associated with a particular condition, and groups have not been selected randomly, an ANCOVA covarying for IQ to adjust for this variable would be inappropriate, as it would violate the basic ANCOVA assumption that the covariate is independent of the selected groups (Miller & Chapman, Reference Miller and Chapman2001; Dennis et al. Reference Dennis, Francis, Cirino, Schachar, Barnes and Fletcher2009). However, in our study, to assess the potential effect of IQ on GM group differences, GM volumes were correlated with IQ within each group. As expected, based on the selection criteria, group differences were significant in CPRS, SDQ hyperactivity and SCQ scores (Table 1).
VBM-DARTEL analysis of GM/WM volume differences
There was a significant group difference in total GM volume and TBV (Table 2). Post-hoc analyses showed that ADHD boys had significantly smaller total GM volume and TBV compared to the other two groups. Hence, TBV was entered as a covariate in the subsequent analyses.
Group differences between adolescents with ADHD, ASD and healthy controls in global brain volume

ADHD, Attention deficit hyperactivity disorder; ASD, autism spectrum disorder; CON, controls; GM, grey matter; WM, white matter; TBV, total brain volume ( = GM volume + WM volumes).
Values given as mean (standard deviation).
a Bonferroni correction.
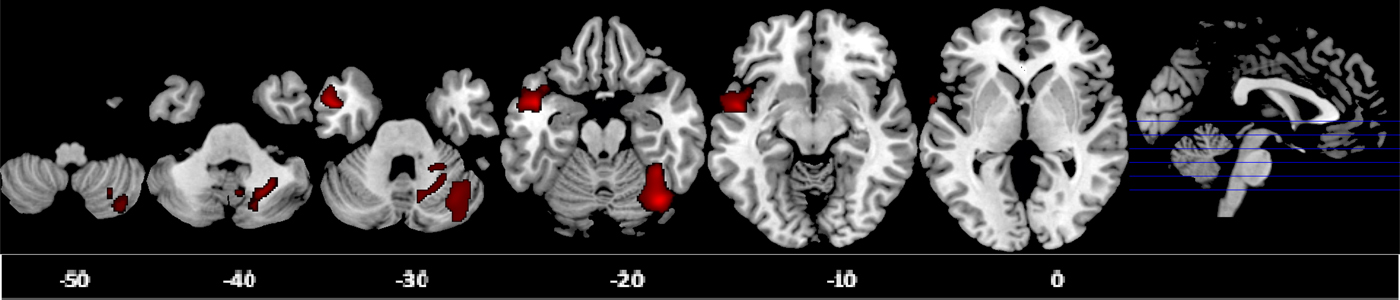
Voxel-wise ANCOVA (p < 0.05 FWE-corrected) showed a significant group effect in the GM volumes of the right posterior cerebellum [effect size (EF) = 0.40, R 2 = 0.29] and left middle/superior temporal gyrus (MTG/STG: EF = 0.17, R 2 = 0.14). Post-hoc analyses showed that ADHD boys had significantly smaller right posterior cerebellar GM compared to the other two groups, which did not differ from each other. ASD boys had significantly larger GM in the left MTG/STG compared with controls. At a more lenient cluster threshold of p < 0.05 uncorrected, this was also significant relative to ADHD boys; in addition, ASD boys had a larger left medial frontal GM volume compared to both groups (Table 3, Fig. 1).
Axial sections of grey matter (GM) reduction in the right posterior cerebellum in attention deficit hyperactivity disorder (ADHD) patients compared with controls and autism spectrum disorder (ASD) patients; and GM enlargement in the left middle/superior temporal gyrus in ASD patients relative to controls as revealed by the F test (p < 0.05), family-wise error (FWE) corrected at the cluster level. Axial slices are marked with the z coordinate as distance in millimetres from the anterior–posterior commissure. The right side of the image corresponds to the right side of the brain.
Group differences in GM volumes between adolescents with ADHD, ASD and healthy controls

GM, Grey matter; ADHD, attention deficit hyperactivity disorder; ASD, autism spectrum disorder; BA, Brodmann area; MNI, Montreal Neurological Institute; CON, controls; FWE, family-wise error.
a At a lenient significance threshold of cluster p < 0.05 uncorrected.
Given that one of the most significant sMRI findings in ADHD is that of reduced GM volumes in the basal ganglia (Nakao et al. Reference Nakao, Radua, Rubia and Mataix-Cols2011; Frodl & Skokauskas, Reference Frodl and Skokauskas2012), we conducted an additional ROI analysis extracting data for the bilateral basal ganglia using MARSBAR (Brett et al. Reference Brett, Johnsrude and Owen2002); no significant group differences were observed. The simple regression analyses between GM volumes and IQ and clinical ratings within each group revealed no significant correlation. No significant group differences were observed in WM volume.
Given that long-term stimulant medication is associated with more normal brain structure (Shaw et al. Reference Shaw, Sharp, Morrison, Eckstrand, Greenstein, Clasen, Evans and Rapoport2009; Murphy, Reference Murphy2010; Nakao et al. Reference Nakao, Radua, Rubia and Mataix-Cols2011; Rubia et al. Reference Rubia, Alzamora, Cubillo, Smith, Brammer and Radua2013a ), including the cerebellum (Bledsoe et al. Reference Bledsoe, Semrud-Clikeman and Pliszka2009), we tested whether the cerebellum differences survived when we only compared the 36 medication-naïve ADHD boys with the other two groups. The findings remained unchanged.
Discussion
To our knowledge, this is the second sMRI study comparing non-comorbid ADHD boys and non-comorbid ASD boys, in a relatively larger sample than the previous study (Brieber et al. Reference Brieber, Neufang, Bruning, Kamp-Becker, Remschmidt, Herpertz-Dahlmann, Fink and Konrad2007). Moreover, we included mostly medication-naïve participants and used a more stringent significance threshold corrected for multiple comparisons. The key finding is that non-comorbid, mostly medication-naïve, ADHD boys had a disorder-specific reduction in the right posterior cerebellar GM relative to non-comorbid medication-naïve ASD boys, suggesting that this may be a disorder-specific biomarker to differentiate between these two neurodevelopmental disorders. Furthermore, the finding survived when we only included the 36 medication-naïve ADHD boys in the analysis, thus excluding potential confounds of long-term stimulant medication treatment. ASD boys, by contrast, showed a GM enlargement in the left MTG/STG relative to controls, which was disorder specific relative to ADHD at a more lenient threshold.
The finding of an ADHD-specific GM deficit in the right posterior cerebellum extends prior literature on consistent deficits in ADHD in this region by showing for the first time that this is disorder specific relative to ASD. Reduction in cerebellar hemispheric volumes is one of the most consistent findings of sMRI studies in ADHD (Durston et al. Reference Durston, Hulshoff Pol, Schnack, Buitelaar, Steenhuis, Minderaa, Kahn and van Engeland2004; Biederman et al. Reference Biederman, Makris, Valera, Monuteaux, Goldstein, Buka, Boriel, Bandyopadhyay, Kennedy, Caviness, Bush, Aleardi, Hammerness, Faraone and Seidman2008; Montes et al. Reference Montes, Ricardo-Garcell, De la Torre, Alcantara, Garcia, Acosta and Bouzas2011; de Zeeuw et al. Reference de Zeeuw, Zwart, Schrama, van Engeland and Durston2012; Lim et al. Reference Lim, Marquand, Cubillo, Smith, Chantiluke, Simmons, Mehta and Rubia2013), with the largest effect size in a meta-analysis of ROI sMRI studies (Valera et al. Reference Valera, Faraone, Murray and Seidman2007). Reduced cerebellar volumes are also observed in longitudinal studies, where the deficit is sustained throughout adolescence (Castellanos et al. Reference Castellanos, Lee, Sharp, Jeffries, Greenstein, Clasen, Blumenthal, James, Ebens, Walter, Zijdenbos, Evans, Giedd and Rapoport2002; Mackie et al. Reference Mackie, Shaw, Lenroot, Pierson, Greenstein, Nugent, Sharp, Giedd and Rapoport2007) and adulthood (Proal et al. Reference Proal, Reiss, Klein, Mannuzza, Gotimer, Ramos-Olazagasti, Lerch, He, Zijdenbos, Kelly, Milham and Castellanos2011).
The cerebellum is one of the few brain regions that have been associated directly with ADHD diagnostic status and clinical outcome. Thus, ADHD patients with worse clinical outcome showed a progressively smaller total cerebellar volume with age, attributable mainly to the deviant trajectory of the inferior–posterior hemispheres, relative to healthy controls (Mackie et al. Reference Mackie, Shaw, Lenroot, Pierson, Greenstein, Nugent, Sharp, Giedd and Rapoport2007). Furthermore, reduced (right) cerebellar volumes have been shown to be specifically associated with diagnostic status, rather than to be an endophenotype of ADHD, as deficits were not observed in unaffected siblings (Durston et al. Reference Durston, Hulshoff Pol, Schnack, Buitelaar, Steenhuis, Minderaa, Kahn and van Engeland2004).
The cerebellum is one of the latest brain structures to fully develop. In particular, the cerebellar hemispheres reach their peak volume as late as around age 18 years, and the structural development of the different cerebellar regions parallels those prefrontal regions they are connected with to form the late-developing fronto-cerebellar networks that mediate higher-level motor, cognitive and affective functions (Mackie et al. Reference Mackie, Shaw, Lenroot, Pierson, Greenstein, Nugent, Sharp, Giedd and Rapoport2007; Tiemeier et al. Reference Tiemeier, Lenroot, Greenstein, Tran, Pierson and Giedd2010; Arnsten & Rubia, Reference Arnsten and Rubia2012). It is therefore plausible that our finding of a disorder-specific reduction in the right lateral cerebellar GM in ADHD boys relative to ASD boys, together with prior consistent evidence of smaller cerebellar hemisphere volumes in ADHD boys (Castellanos et al. Reference Castellanos, Lee, Sharp, Jeffries, Greenstein, Clasen, Blumenthal, James, Ebens, Walter, Zijdenbos, Evans, Giedd and Rapoport2002; Durston et al. Reference Durston, Hulshoff Pol, Schnack, Buitelaar, Steenhuis, Minderaa, Kahn and van Engeland2004; Mackie et al. Reference Mackie, Shaw, Lenroot, Pierson, Greenstein, Nugent, Sharp, Giedd and Rapoport2007; Valera et al. Reference Valera, Faraone, Murray and Seidman2007; Biederman et al. Reference Biederman, Makris, Valera, Monuteaux, Goldstein, Buka, Boriel, Bandyopadhyay, Kennedy, Caviness, Bush, Aleardi, Hammerness, Faraone and Seidman2008; Montes et al. Reference Montes, Ricardo-Garcell, De la Torre, Alcantara, Garcia, Acosta and Bouzas2011; Proal et al. Reference Proal, Reiss, Klein, Mannuzza, Gotimer, Ramos-Olazagasti, Lerch, He, Zijdenbos, Kelly, Milham and Castellanos2011; de Zeeuw et al. Reference de Zeeuw, Zwart, Schrama, van Engeland and Durston2012; Lim et al. Reference Lim, Marquand, Cubillo, Smith, Chantiluke, Simmons, Mehta and Rubia2013) could potentially reflect a maturational delay in ADHD. This would parallel the delay in GM thickness development of prefrontal and temporoparietal regions that co-develop with the cerebellum (Shaw et al. Reference Shaw, Eckstrand, Sharp, Blumenthal, Lerch, Greenstein, Clasen, Evans, Giedd and Rapoport2007, Reference Shaw, Malek, Watson, Sharp, Evans and Greenstein2012).
The cerebellum has traditionally been considered to be primarily involved in motor control. However, lesion and fMRI studies have consistently demonstrated its involvement in a wide range of cognitive and affective functions, in particular sustained and shifting attention (Schmahmann, Reference Schmahmann2004), working memory (Ravizza et al. Reference Ravizza, McCormick, Schlerf, Justus, Ivry and Fiez2006), inhibitory control (Rubia et al. Reference Rubia, Smith, Taylor and Brammer2007, Reference Rubia, Lim, Ecker, Halari, Giampietro, Simmons, Brammer and Smith2013b ), temporal information processing (Rubia & Smith, Reference Rubia and Smith2004; Rubia, Reference Rubia, Glicksohn and Myslobodsky2006; Wiener et al. Reference Wiener, Turkeltaub and Coslett2010; Noreika et al. Reference Noreika, Falter and Rubia2012) and emotion regulation (Allen et al. Reference Allen, Buxton, Wong and Courchesne1997). This is further underscored by the extensive connections of the lateral cerebellar hemispheres to the prefrontal cortex and the basal ganglia, forming fronto-striato-cerebellar networks (Arnsten & Rubia, Reference Arnsten and Rubia2012). Based on lesion studies (Exner et al. Reference Exner, Weniger and Irle2004) and meta-analyses (Stoodley & Schmahmann, Reference Stoodley and Schmahmann2009), the anterior part of the cerebellum is particularly involved in motor and sensory functions, the medial part in emotion processes and the lateral posterior region, found to be abnormal in ADHD in this study, in higher-level cognitive abilities such as attention (Kellermann et al. Reference Kellermann, Regenbogen, De Vos, Mossnang, Finkelmeyer and Habel2012; Li et al. Reference Li, Sroubek, Kelly, Lesser, Sussman, He, Branch and Foxe2012), inhibition (Rubia et al. Reference Rubia, Smith, Taylor and Brammer2007, Reference Rubia, Lim, Ecker, Halari, Giampietro, Simmons, Brammer and Smith2013b ), working memory (Stoodley & Schmahmann, Reference Stoodley and Schmahmann2010; Massat et al. Reference Massat, Slama, Kavec, Linotte, Mary, Baleriaux, Metens, Mendlewicz and Peigneux2012; Stoodley et al. Reference Stoodley, Valera and Schmahmann2012) and timing functions (O'Reilly et al. Reference O'Reilly, Mesulam and Nobre2008; Wiener et al. Reference Wiener, Turkeltaub and Coslett2010).
The right-hemispheric location of the cerebellar GM deficit finding in ADHD is also important, given that the right posterior cerebellar hemisphere has been found to be particularly relevant for attention and working memory (Kellermann et al. Reference Kellermann, Regenbogen, De Vos, Mossnang, Finkelmeyer and Habel2012; Li et al. Reference Li, Sroubek, Kelly, Lesser, Sussman, He, Branch and Foxe2012; Bernard & Seidler, Reference Bernard and Seidler2013). ADHD children have consistent deficits in these above-mentioned cognitive functions, especially working memory, sustained attention (Willcutt et al. Reference Willcutt, Doyle, Nigg, Faraone and Pennington2005; Rubia, Reference Rubia2011; Cubillo et al. Reference Cubillo, Halari, Smith, Taylor and Rubia2012a ), inhibition (Lijffijt et al. Reference Lijffijt, Kenemans, Verbaten and van Engeland2005) and timing functions (Rubia et al. Reference Rubia, Halari, Christakou and Taylor2009a ; Noreika et al. Reference Noreika, Falter and Rubia2012). In ASD, impairments in these functions are more controversial, with many negative findings with respect to selective and sustained attention (Johnson et al. Reference Johnson, Robertson, Kelly, Silk, Barry, Daibhis, Watchorn, Keavey, Fitzgerald, Gallagher, Gill and Bellgrove2007; Rommelse et al. Reference Rommelse, Geurts, Franke, Buitelaar and Hartman2011) and working memory (Rommelse et al. Reference Rommelse, Geurts, Franke, Buitelaar and Hartman2011), and less consistent evidence for inhibition (Rommelse et al. Reference Rommelse, Geurts, Franke, Buitelaar and Hartman2011) and timing impairment (Falter et al. Reference Falter, Noreika, Wearden and Bailey2012). Furthermore, when ADHD comorbidity is excluded and compared to ADHD, ASD patients are less impaired in these cognitive functions (Johnson et al. Reference Johnson, Robertson, Kelly, Silk, Barry, Daibhis, Watchorn, Keavey, Fitzgerald, Gallagher, Gill and Bellgrove2007; Rommelse et al. Reference Rommelse, Geurts, Franke, Buitelaar and Hartman2011).
Evidence for cerebellar GM abnormalities in ADHD are further supported by diffusion tensor imaging (DTI) studies that have reported reduced fractional anisotropy (FA) in the WM tracts of the right middle (Bechtel et al. Reference Bechtel, Kobel, Penner, Klarhofer, Scheffler, Opwis and Weber2009; Kobel et al. Reference Kobel, Bechtel, Specht, Klarhofer, Weber, Scheffler, Opwis and Penner2010; Chuang et al. Reference Chuang, Wu, Huang, Weng and Yang2013) and left inferior cerebellar peduncle (Nagel et al. Reference Nagel, Bathula, Herting, Schmitt, Kroenke, Fair and Nigg2011) in ADHD patients compared to controls, suggesting deficient structural connectivity between the cerebellum and prefrontal regions.
Cerebellar GM deficits in ADHD also echo evidence for abnormal function of this region based on fMRI studies that have found the lateral and medial cerebellum to be abnormal in their activation in ADHD patients together with frontostriatal deficits, most consistently during tasks of sustained and selective attention (Rubia et al. Reference Rubia, Halari, Cubillo, Mohammad and Taylor2009b ; Cubillo et al. Reference Cubillo, Halari, Smith, Taylor and Rubia2012a ), timing (Rubia et al. Reference Rubia, Halari, Christakou and Taylor2009a ; Valera et al. Reference Valera, Spencer, Zeffiro, Makris, Spencer, Faraone, Biederman and Seidman2010; Vloet et al. Reference Vloet, Gilsbach, Neufang, Fink, Herpertz-Dahlmann and Konrad2010; Hart et al. Reference Hart, Radua, Mataix-Cols and Rubia2012) and inhibition (Rubia et al. Reference Rubia, Halari, Mohammad, Taylor and Brammer2011, Reference Rubia, Alzamora, Cubillo, Smith, Brammer and Radua2013a ; Cubillo et al. Reference Cubillo, Smith, Barrett, Giampietro, Brammer, Simmons and Rubia2012b ; Hart et al. Reference Hart, Chantiluke, Cubillo, Smith, Simmons, Brammer, Marquand and Rubia2014).
Similarly, fMRI studies have detected abnormal functional connectivity between the cerebellum and prefrontal, striatal and parietal regions in ADHD patients during attention, timing (Rubia et al. Reference Rubia, Halari, Cubillo, Mohammad and Taylor2009b ; Vloet et al. Reference Vloet, Gilsbach, Neufang, Fink, Herpertz-Dahlmann and Konrad2010) and working memory (Massat et al. Reference Massat, Slama, Kavec, Linotte, Mary, Baleriaux, Metens, Mendlewicz and Peigneux2012) performance, suggesting that different task-relevant fronto-striato-cerebellar networks are dysfunctional in ADHD.
The disorder specificity of the right posterior cerebellar GM deficit relative to ASD is intriguing. Although cerebellar abnormalities are consistent findings in sMRI studies of ASD, there is debate regarding the nature and consistency of these cerebellar alterations. Some studies have found the cerebellum to be enlarged (Palmen et al. Reference Palmen, Hulshoff Pol, Kemner, Schnack, Durston, Lahuis, Kahn and Van Engeland2005; Bonilha et al. Reference Bonilha, Cendes, Rorden, Eckert, Dalgalarrondo, Li and Steiner2008), smaller (Webb et al. Reference Webb, Sparks, Friedman, Shaw, Giedd, Dawson and Dager2009; Toal et al. Reference Toal, Daly, Page, Deeley, Hallahan, Bloemen, Cutter, Brammer, Curran, Robertson, Murphy, Murphy and Murphy2010) or not to differ compared with controls (Hazlett et al. Reference Hazlett, Poe, Gerig, Smith, Provenzale, Ross, Gilmore and Piven2005; Scott et al. Reference Scott, Schumann, Goodlin-Jones and Amaral2009). The age of ASD patients is likely to play an important role given that, in early infancy and childhood, ASD is associated with significantly enlarged GM volumes relative to controls; later on, in adolescence and adulthood, there is evidence for arrested growth relative to controls (Amaral et al. Reference Amaral, Schumann and Nordahl2008). By adolescence, some studies found normal TBV (Hazlett et al. Reference Hazlett, Poe, Gerig, Smith, Provenzale, Ross, Gilmore and Piven2005; Scott et al. Reference Scott, Schumann, Goodlin-Jones and Amaral2009), suggesting that the precocious overgrowth from the first years of life may normalize with age by adolescence. However, most of this evidence is based on cross-sectional data, and longitudinal data are needed to elucidate developmental growth trajectories. Our findings, however, suggest that, by adolescence, the cerebellar hemispheres are disorder-specifically reduced in ADHD relative to ASD who have normal TBV and cerebellar GM at this age point.
Importantly, we found that the ADHD-specific GM deficit relative to the other two groups in the right posterior cerebellum survived when we only included medication-naïve patients. Medication naivety is crucial for neuroimaging studies, as we have shown in a meta-regression analysis that long-term stimulant medication is associated with more normal brain structure in the basal ganglia in ADHD (Nakao et al. Reference Nakao, Radua, Rubia and Mataix-Cols2011). Retrospective analyses have found that medication-naïve ADHD patients have more abnormal GM than long-term medicated ADHD patients in the cerebellum (Bledsoe et al. Reference Bledsoe, Semrud-Clikeman and Pliszka2009) and other ADHD-relevant areas (Shaw et al. Reference Shaw, Sharp, Morrison, Eckstrand, Greenstein, Clasen, Evans and Rapoport2009; Ivanov et al. Reference Ivanov, Bansal, Hao, Zhu, Kellendonk, Miller, Sanchez-Pena, Miller, Chakravarty, Klahr, Durkin, Greenhill and Peterson2010; Rubia et al. Reference Rubia, Alzamora, Cubillo, Smith, Brammer and Radua2013a ). Therefore, long-term stimulant medication is not a confound in our results.
ASD boys also had larger left MTG/STG GM volumes relative to controls, and at a more lenient threshold relative to ADHD boys. The STG is involved in auditory processing including language and has been implicated in social cognition (Pelphrey et al. Reference Pelphrey, Viola and McCarthy2004). Language deficits are a core feature of ASD and failure to develop normal language comprehension is an early warning sign of autism (Eyler et al. Reference Eyler, Pierce and Courchesne2012). Several studies have reported larger left temporal GM volume in ASD patients relative to healthy controls (Hazlett et al. Reference Hazlett, Poe, Gerig, Smith and Piven2006; Rojas et al. Reference Rojas, Peterson, Winterrowd, Reite, Rogers and Tregellas2006; Knaus et al. Reference Knaus, Silver, Dominick, Schuring, Shaffer, Lindgren, Joseph and Tager-Flusberg2009; Verhoeven et al. Reference Verhoeven, Cock, Lagae and Sunaert2010; Cauda et al. Reference Cauda, Geda, Sacco, D'Agata, Duca, Geminiani and Keller2011), which was also correlated with social and communication deficits (Rojas et al. Reference Rojas, Peterson, Winterrowd, Reite, Rogers and Tregellas2006; Verhoeven et al. Reference Verhoeven, Cock, Lagae and Sunaert2010). In addition, one study has shown that ASD patients, compared to healthy controls, did not show the normal age-related reductions in MTG/STG cortical volume and thickness during adolescence and adulthood, suggesting cortical dysmaturation in a brain region that is crucial to social cognition and language (Raznahan et al. Reference Raznahan, Toro, Daly, Robertson, Murphy, Deeley, Bolton, Paus and Murphy2010). Several fMRI studies have suggested that abnormal activation in the left MTG/STG [especially Brodmann area (BA) 21, as found in this study] may play a central role in the typical language impairment in ASD (Redcay & Courchesne, Reference Redcay and Courchesne2008; Eyler et al. Reference Eyler, Pierce and Courchesne2012). In particular, a failure of the left temporal cortex to specialize for language during early development may reflect a fundamental early neural developmental pathology in autism (Eyler et al. Reference Eyler, Pierce and Courchesne2012). Furthermore, a DTI study reported abnormalities in the microstructural organization of the WM tracts involving the STG and temporal stem in autistic patients compared to controls (Lee et al. Reference Lee, Foss-Feig, Henderson, Kenworthy, Gilotty, Gaillard and Vaidya2007). Our finding of a larger STG GM volume in ASD parallels the findings of Brieber et al. (Reference Brieber, Neufang, Bruning, Kamp-Becker, Remschmidt, Herpertz-Dahlmann, Fink and Konrad2007), who reported an increased GM volume in the adjacent right supramarginal gyrus in ASD relative to controls and ADHD, although their findings did not survive correction for multiple comparisons. In addition, our finding of abnormalities in the left temporal gyrus in ASD patients parallels the findings of Di Martino et al. Reference Di Martino, Zuo, Kelly, Grzadzinski, Mennes, Schvarcz, Rodman, Lord, Castellanos and Milham(2013), who found disorder-specific functional network abnormalities in ASD relative to ADHD and controls in limbic networks, including the left planum temporale and temporal cortex. The disorder specificity of this abnormality may only have been detected at a more lenient threshold because of the relatively smaller numbers in the ASD group; replications in larger samples are therefore needed to corroborate these findings. The relatively small numbers of participants may also have prevented us from finding a structural deficit in the basal ganglia in ADHD, which was observed in two meta-analyses of sMRI studies (Nakao et al. Reference Nakao, Radua, Rubia and Mataix-Cols2011; Frodl & Skokauskas, Reference Frodl and Skokauskas2012).
We found no WM differences between groups. sMRI findings have been inconclusive, with some studies finding WM abnormalities in ADHD (Castellanos et al. Reference Castellanos, Lee, Sharp, Jeffries, Greenstein, Clasen, Blumenthal, James, Ebens, Walter, Zijdenbos, Evans, Giedd and Rapoport2002; Durston et al. Reference Durston, Hulshoff Pol, Schnack, Buitelaar, Steenhuis, Minderaa, Kahn and van Engeland2004) and ASD (McAlonan et al. Reference McAlonan, Cheung, Cheung, Suckling, Lam, Tai, Yip, Murphy and Chua2005; Bonilha et al. Reference Bonilha, Cendes, Rorden, Eckert, Dalgalarrondo, Li and Steiner2008), but not others (Palmen et al. Reference Palmen, Hulshoff Pol, Kemner, Schnack, Durston, Lahuis, Kahn and Van Engeland2005; Brun et al. Reference Brun, Nicolson, Lepore, Chou, Vidal, DeVito, Drost, Williamson, Rajakumar, Toga and Thompson2009; Batty et al. Reference Batty, Liddle, Pitiot, Toro, Groom, Scerif, Liotti, Liddle, Paus and Hollis2010). The sample sizes, especially for the ASD group, may have been too small to detect any WM abnormalities. Moreover, changes in WM integrity may be assessed more accurately using DTI (Whitwell, Reference Whitwell2009).
A strength of this study is that all ASD and most ADHD patients were medication naïve. Furthermore, our findings survived a subanalysis in only medication-naïve ADHD patients. This is important because stimulant medication, the gold standard medication for ADHD, and selective serotonin reuptake inhibitors (SSRIs), which are sometimes used in ASD, have been associated with differences in brain structure including the cerebellum (Bledsoe et al. Reference Bledsoe, Semrud-Clikeman and Pliszka2009; Ivanov et al. Reference Ivanov, Bansal, Hao, Zhu, Kellendonk, Miller, Sanchez-Pena, Miller, Chakravarty, Klahr, Durkin, Greenhill and Peterson2010; Murphy, Reference Murphy2010; Nakao et al. Reference Nakao, Radua, Rubia and Mataix-Cols2011; Rubia et al. Reference Rubia, Alzamora, Cubillo, Smith, Brammer and Radua2013a ). Another strength is the careful diagnosis of ASD patients who were non-comorbid with ADHD, using the ICD-10, ADI and ADOS, and of ADHD patients who were non-comorbid with ASD, using the CPRS, SDQ and SCQ, both without other comorbid psychiatric diagnoses. Although the inclusion of only males enhances the homogeneity of the group and is based on the higher prevalence in boys for both disorders (Rommelse et al. Reference Rommelse, Franke, Geurts, Hartman and Buitelaar2010), it limits the generalizability to females with the disorders. Furthermore, we included only high-functioning adolescents with ASD and Asperger's disorder, and the combined subtype of ADHD, which limits the generalizability to other subtypes within ASD or ADHD. Additionally, although in this study we carefully excluded comorbidity between the two disorders, future studies should elucidate to what extent the comorbid conditions share the same deficits observed in non-comorbid ADHD and non-comorbid ASD or whether they are different in their neurobiological substrates. Another limitation is the relatively smaller sample size of the ASD group, although it was still somewhat larger than that of the only other study that compared brain structure between these two disorders (Brieber et al. Reference Brieber, Neufang, Bruning, Kamp-Becker, Remschmidt, Herpertz-Dahlmann, Fink and Konrad2007). Finally, in view of evidence for increased testosterone levels in ASD during puberty (Geier & Geier, Reference Geier and Geier2007), future studies should include measures of pubertal status and hormonal measures.
In summary, using a stringent threshold corrected for multiple comparisons and including mostly medication-naïve, carefully diagnosed non-comorbid groups of ADHD and ASD boys, we found that ADHD boys had a disorder-specific GM volume reduction in the right posterior cerebellum whereas ASD boys had a disorder-specific GM volume enlargement in the left MTG/STG, albeit at a more lenient significance level. The findings represent a first step towards the delineation of disorder-specific structural biomarkers for these two related disorders.
Acknowledgements
Data collection was supported by grants from the National Institute for Health Research (NIHR) Biomedical Research Centre (BRC) for Mental Health at South London and Maudsley NHS Foundation Trust (SLaM), the Institute of Psychiatry, King's College London, and Lilly Pharmaceuticals. L.L. was supported by the National Medical Research Council (Singapore); Kids Company London and the Rita Lila Weston Foundation. K.C., A.I.C., A.B.S. and A.S. and were supported by the NIHR BRC.
Declaration of Interest
K.R. has received speakers’ honoraria from Lilly and Shire. The other authors have no conflicts of interest to declare.


 Open access