INTRODUCTION
Zoonotic pathogens transmitted by the lone star tick (Amblyomma americanum) are rapidly emerging throughout its range in the USA [Reference Childs and Paddock1]. Foremost of these is Ehrlichia chaffeensis, causative agent of Ehrlichiosis chaffeensis infection in humans (formerly human monocytic ehrlichiosis and hereafter referred to as ‘ehrlichiosis’) [2]. In recent years, there have been significant increases in the number of cases reported from central regions of the country, with rates in Missouri among the highest of all states [Reference Dahlgren3]. Although advances in diagnostic techniques have facilitated the recognition of E. chaffeensis infection in humans, the rising incidence is thought to be partially attributable to anthropogenic influences on the increasing geographical range, abundance, and infection rates of A. americanum [Reference Paddock and Yabsley4].
Transmission of tick-borne, zoonotic pathogens in susceptible human populations requires the relative proximity of vertebrate reservoir hosts, tick vectors, and humans. Thus the mechanisms that drive tick-borne disease risk and incidence are intrinsically spatial [Reference Killilea5]. Further, the spatial distribution of entomological risk (often measured as the density of infected ticks for a given area) is dependent upon environmental factors occurring at multiple spatial scales [Reference Wimberly6]. For example, A. americanum is strongly influenced by local-scale factors that determine its survival (e.g. temperature and humidity patterns) [Reference Mount7]. At larger spatial scales, tick distributions and pathogen infection rates are a factor of the presence and abundance of vertebrate host species, which are in turn influenced by the spatial arrangement of important habitats required for forage and reproduction [Reference Paddock and Childs8]. As white-tailed deer (Odocoileus virginianus) are an important host for A. americanum and zoonotic reservoir for E. chaffeensis [Reference Paddock and Yabsley4, Reference Allan9], factors that influence the spatial distribution of white-tailed deer may also influence disease risk [Reference Allan10]. Finally, the presence/absence of pathogens, ticks, and hosts is determined at even larger spatial scales by phenomena associated with biogeography, including habitat characteristics and annual variation in temperature and precipitation [Reference Diuk-Wasser11].
Transmission of E. chaffeensis into human populations is probably further mediated by human socioeconomic and demographic patterns at multiple spatial scales. Factors that are associated with risk of exposure to E. chaffeensis include occupation (e.g. workers in resource extraction industries such as logging), age, sex and racial group (e.g. incidence is highest in white males aged >40 years), and even golf score [Reference Standaert12–Reference Demma14]. Further, patterns in individual behaviours that influence risk of exposure to tick-borne diseases (hereafter ‘behavioural risk’) may also vary across spatial gradients [Reference Bayles, Evans and Allan15]. However, these socioeconomic factors can only influence disease incidence when ecological parameters are suitable for transmission to occur.
An emerging discipline, termed ‘spatial epidemiology’, has been proposed as a means of elucidating these transmission dynamics by examining the spatial arrangement of social and ecological factors that contribute to patterns of disease risk and incidence [Reference Ostfeld, Glass and Keesing16]. Despite the importance of social-ecological factors in determining the entomological risk of exposure to E. chaffeensis or human incidence of ehrlichiosis [Reference Brown17, Reference Yabsley18], little is known about the relative role these factors may play in determining the spatial variation in the distribution of ehrlichiosis incidence. Using a spatial epidemiological framework, we sought to better understand the manifestations of E. chaffeensis exposure within a highly endemic state to better inform medical surveillance efforts and guide public health interventions. Specifically, our objectives were to: (1) describe the spatial distribution of ehrlichiosis incidence in Missouri, (2) identify areas of unusually high numbers of clustered cases, and (3) quantify the large-scale effects of epidemiologically meaningful socioeconomic, ecological, and biogeographical factors on the spatial variability of disease incidence.
MATERIALS AND METHODS
Epidemiological data
Human ehrlichiosis was first made a nationally notifiable infectious disease in 1998 [Reference McQuiston19], with subsequent case definition revisions made in 2000 and 2008 [20, 21]. We obtained a database of 1135 probable and confirmed cases of ehrlichiosis associated with E. chaffeensis in Missouri during 2000–2011 from the Missouri Department of Health and Senior Services (MDHSS). Probable and confirmed cases are each characterized by clinically compatible illness with evidence of elevated serological antibody titre, with case confirmation made with evidence of: a ⩾fourfold increase in antibody titre, polymerase chain reaction assay, or pathogen isolation in cellular culture [2]. Of the cases reported during the study period, 1062 (93·6%) contained patient address information at the zip-code level, with ∼50% of cases classified as confirmed (MDHSS IRB exemption no. 71612). To obtain robust estimates of disease distribution, probable and confirmed cases for each zip code were combined to calculate the standardized cumulative incidence/100 000 persons using 2000 U.S. decennial census population estimates [22].
Socioeconomic, environmental and biogeographical variables
To evaluate the potential associations between human population characteristics and the spatial distribution of ehrlichiosis, we created socioeconomic variables with data obtained from the 2000 U.S. census [22]. Variables were chosen to reflect either known risk factors for ehrlichiosis or potential determinants of disease transmission [Reference Paddock and Childs8, Reference Demma14]. These included: gender (proportion male), age (proportion aged >64 years), race (proportion white), occupation (proportion working in agricultural, forestry, mining, fishing, or hunting industries), education (proportion with high-school-level diploma), and poverty (proportion under federal poverty line). In addition, we included human population density/km2 and the proportion of vacant housing units to assess the contribution of land-use and housing characteristics to incidence in residentially developed regions.
We included several environmental variables that have been strongly associated with the presence of E. chaffeensis-infected A. americanum: forest cover and the density of white-tailed deer [Reference Paddock and Yabsley4, Reference Allan9, Reference Yabsley18]. To characterize the distribution of forest cover, we calculated the percentage of each zip code covered by deciduous forest using data obtained from the 30 × 30 m resolution 2006 National Land Cover Database [Reference Homer23]. White-tailed deer population estimates from 2000 to 2009 were obtained at the county level using population projections calculated by the Missouri Department of Conservation from hunter harvest success rates. To rescale the average number of deer to the zip-code level, we divided the number of deer in each county by the weighted area (km2) of each zip code that fell within a particular county.
To understand the importance of environmental factors that vary at biogeographical scales, we included level III ecoregions derived by the Environmental Protection Agency (EPA). These ecoregions reflect a unique set of ecological communities defined by particular climactic and geological characteristics [Reference Ricketts24], which include (1) location, (2) climate, (3) vegetation, (4) hydrology, (5) terrain, (6) wildlife, and (7) human land-use. Level III ecoregions are derived from data compiled from many different sources with the intention that these offer concise and ecologically meaningful depictions of landscape-scale variation in biological and environmental variables. In the state of Missouri there are five major ecoregions: Central Irregular Plains, Interior River Valleys and Hills, Ozark Highlands, Mississippi Alluvial Plain, and Western Corn Belt Plains (Fig. 1 a, Supplementary Table S1). We aggregated the analysis by ecoregion to identify how the effects of social-ecological factors on disease incidence may differ across large-scale environmental gradients and to control for the presumptive effects of local-scale environmental effects (e.g. microclimate) on disease distribution.
Spatial distribution of: (a) Missouri level III ecoregions, (b) cumulative incidence of probable and confirmed E. chaffeensis infection/100 000 persons, (c) empirical Bayesian smoothed (EBS) incidence, and (d) high incidence local indicators of spatial autocorrelation (LISA) clusters.

Statistical analysis
We implemented an empirical Bayesian smoothing (EBS) on the cumulative incidence data to adjust for the random variance associated with the distribution of small numbers of cases in relatively small populations at risk across zip codes. EBS allows for better visualization of disease gradients, which may not otherwise be apparent with raw case numbers [Reference Rushton and Lolonis25]. Using EBS incidence, we determined if the distribution of ehrlichiosis across the state exhibited spatial dependence by calculating Moran's I measure of spatial autocorrelation [Reference Moran26]. To better delineate the location of significantly high-incidence clusters of ehrlichiosis, we computed a locally derived measured of Moran's I statistic known as the local indicator of spatial autocorrelation (LISA) statistic [Reference Anselin27].
Comparisons were made between high-incidence LISA clusters and all other zip codes to determine which social-ecological factors were associated with elevated incidence. Values of each variable were compared using the Wilcoxon rank-sum test. To determine which factors predicted membership in a high-incidence LISA cluster, we used binary logistic regression with outcome of 1 for cluster vs. 0 for no cluster. A bivariate analysis was conducted first, with each variable included separately in the model. Significant variables were then entered into a multivariate logistic regression model with backward stepwise elimination used to fit a final set of parameters. To measure the importance of dividing the state into ecologically unique areas, we compared incidence, socioeconomic, and environmental variables across ecoregions using the Kruskal–Wallis one-way analysis of variance. Again, we adopted bivariate and multivariate binary logistic regression to model a dichotomized outcome variable based on the median incidence across all zip codes (1 for incidence ⩾2·31 × 10−4 vs. 0 for incidence <2·31 × 10−4) to model factors associated with elevated incidence within each ecoregion. We selected the median as a cut-off value to represent elevated vs. non-elevated incidence in place of an a priori justification for other values and to retain sufficient statistical power. Analyses were performed using SAS v. 9.3 (SAS Institute Inc., USA) and GeoDa [Reference Anselin, Syabri and Kho28].
Modelling spatial variation
When spatial structure exists in data, the use of global ordinary least squares (OLS) regression can suppress local variation in the relationships between model parameters [Reference Legendre29]. Therefore, we implemented geographically weighted regression (GWR) to explore the important influence of local spatial variation on the relationships between social-ecological factors with smoothed ehrlichiosis incidence. GWR has been developed as a means of accounting for the effects of spatial non-stationarity by generating local models and parameter estimates for every point in space [Reference Brunsdon, Fotheringham and Charlton30]. We used this technique to determine the extent of local-scale geographical variability in social-ecological variables and disease incidence for the centroid of each zip code, which may otherwise be obscured in an ecoregion-scale analysis.
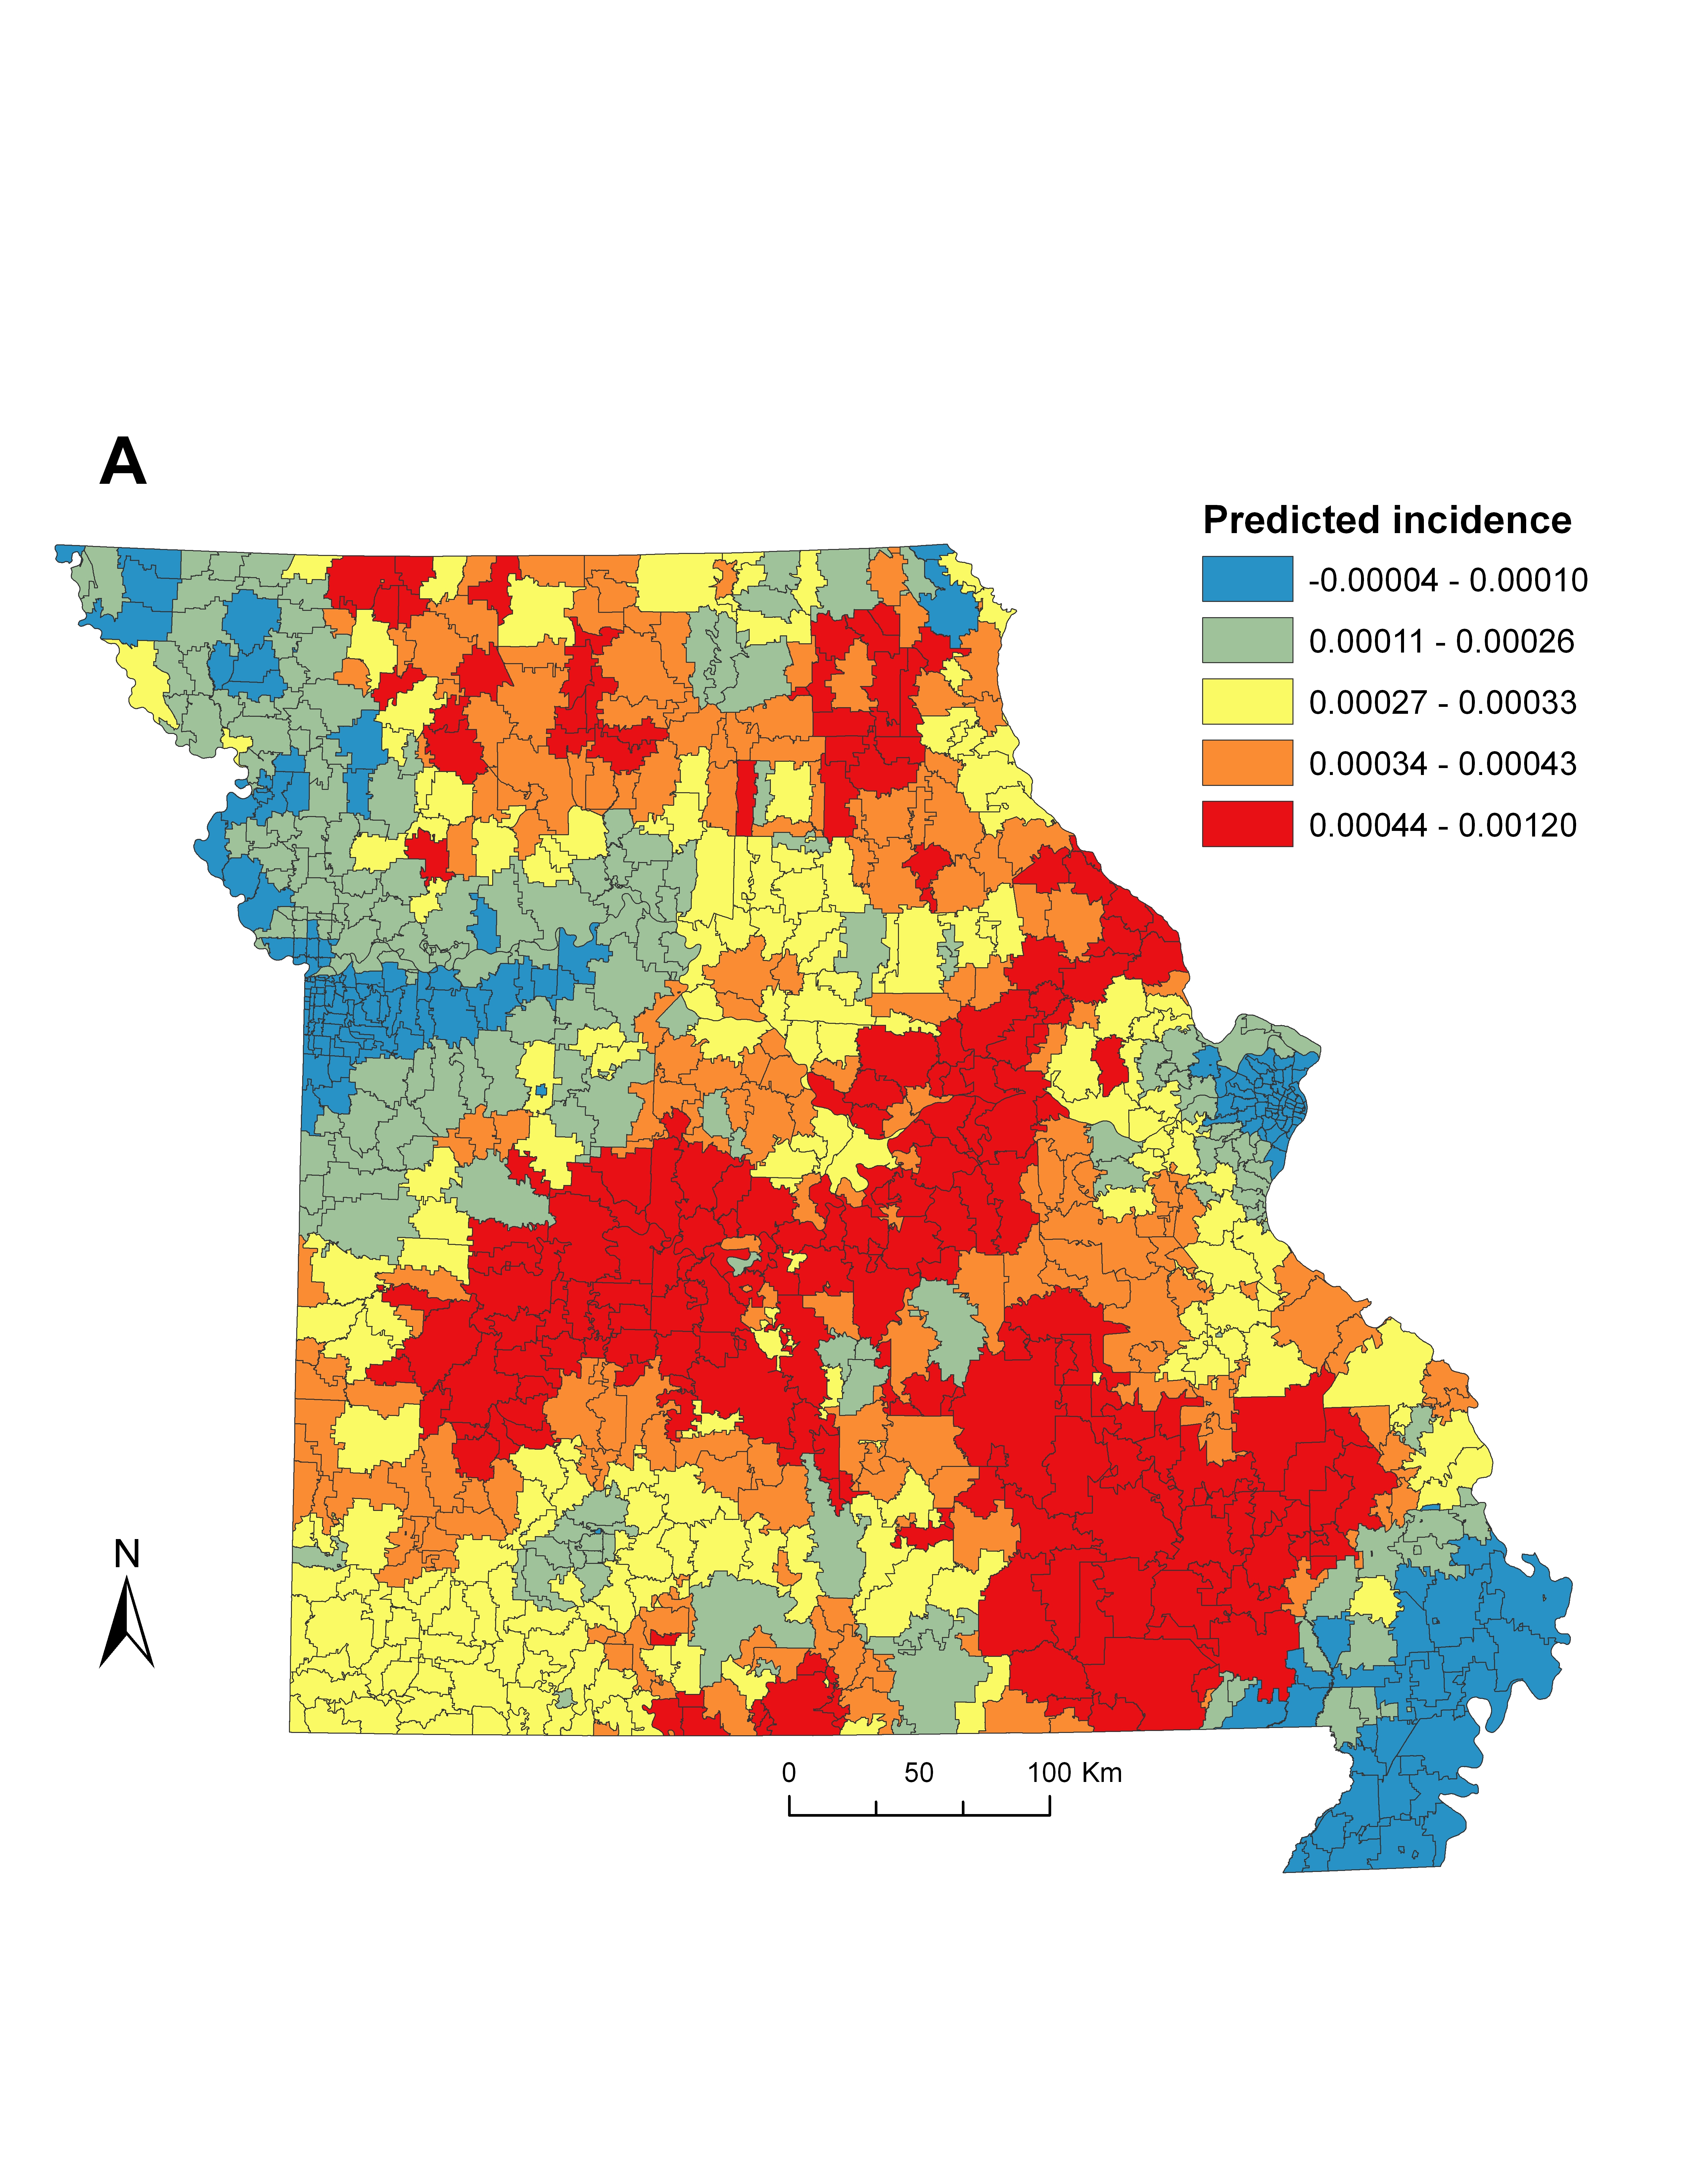
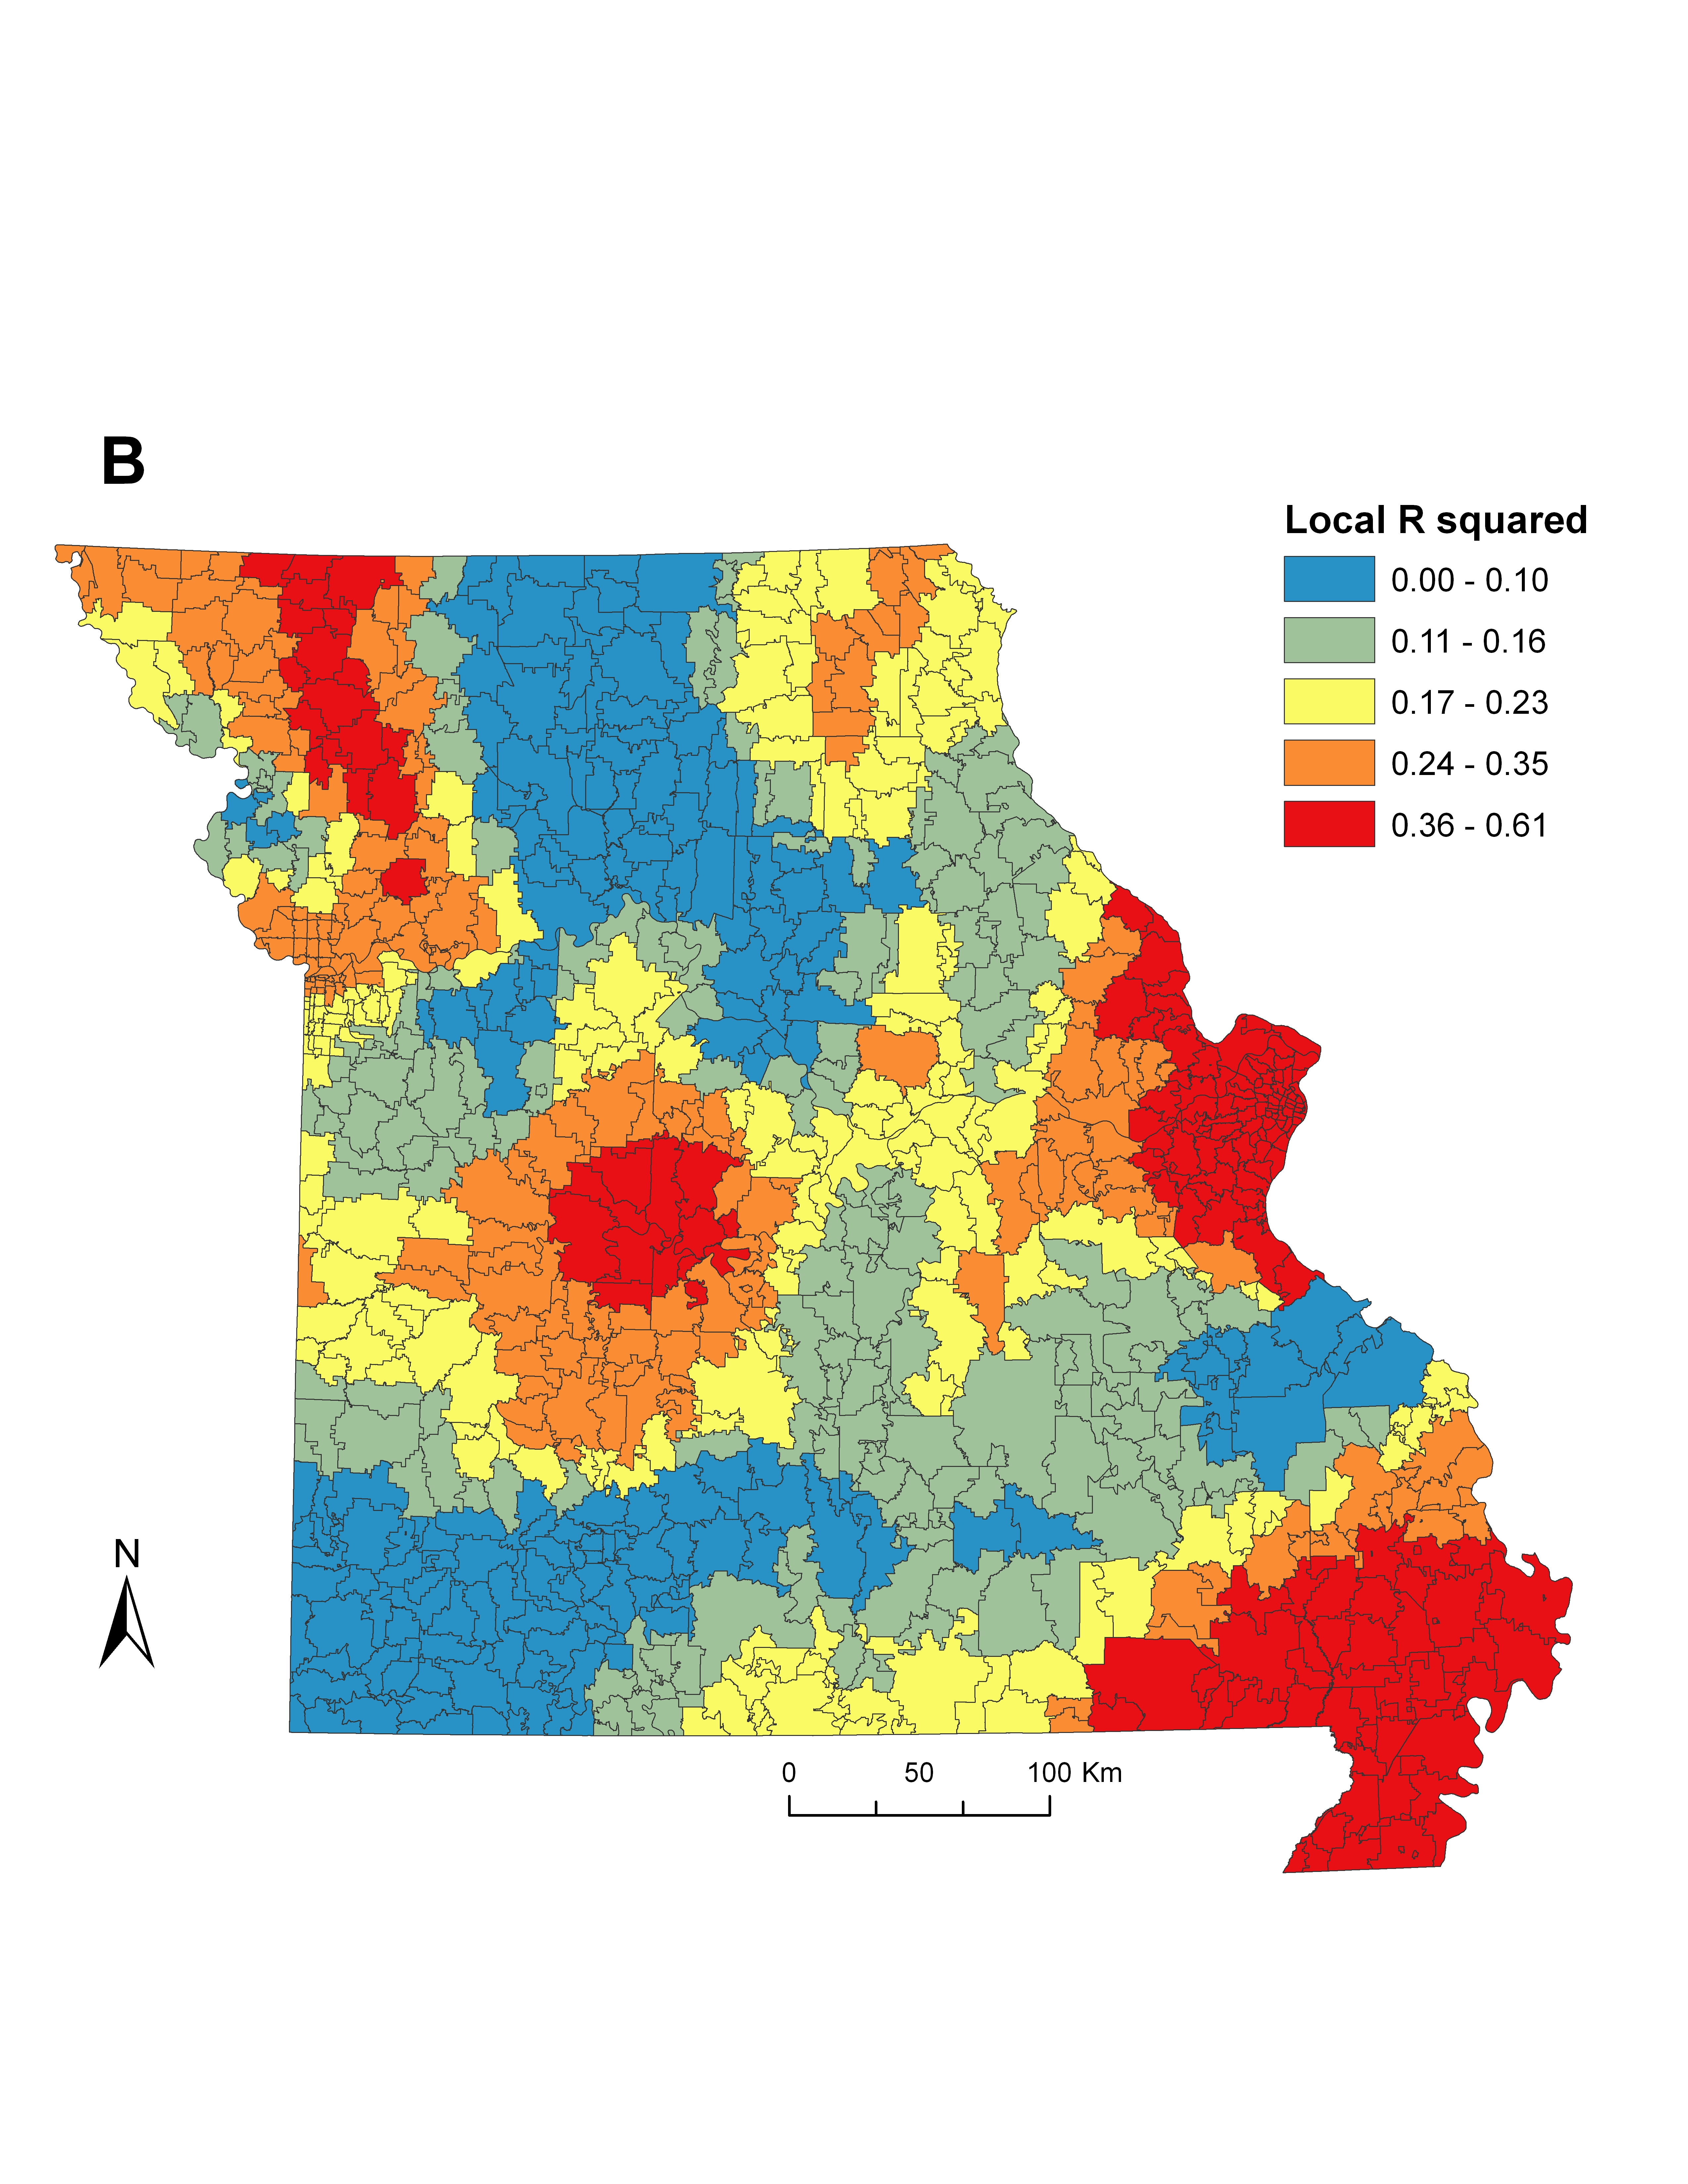
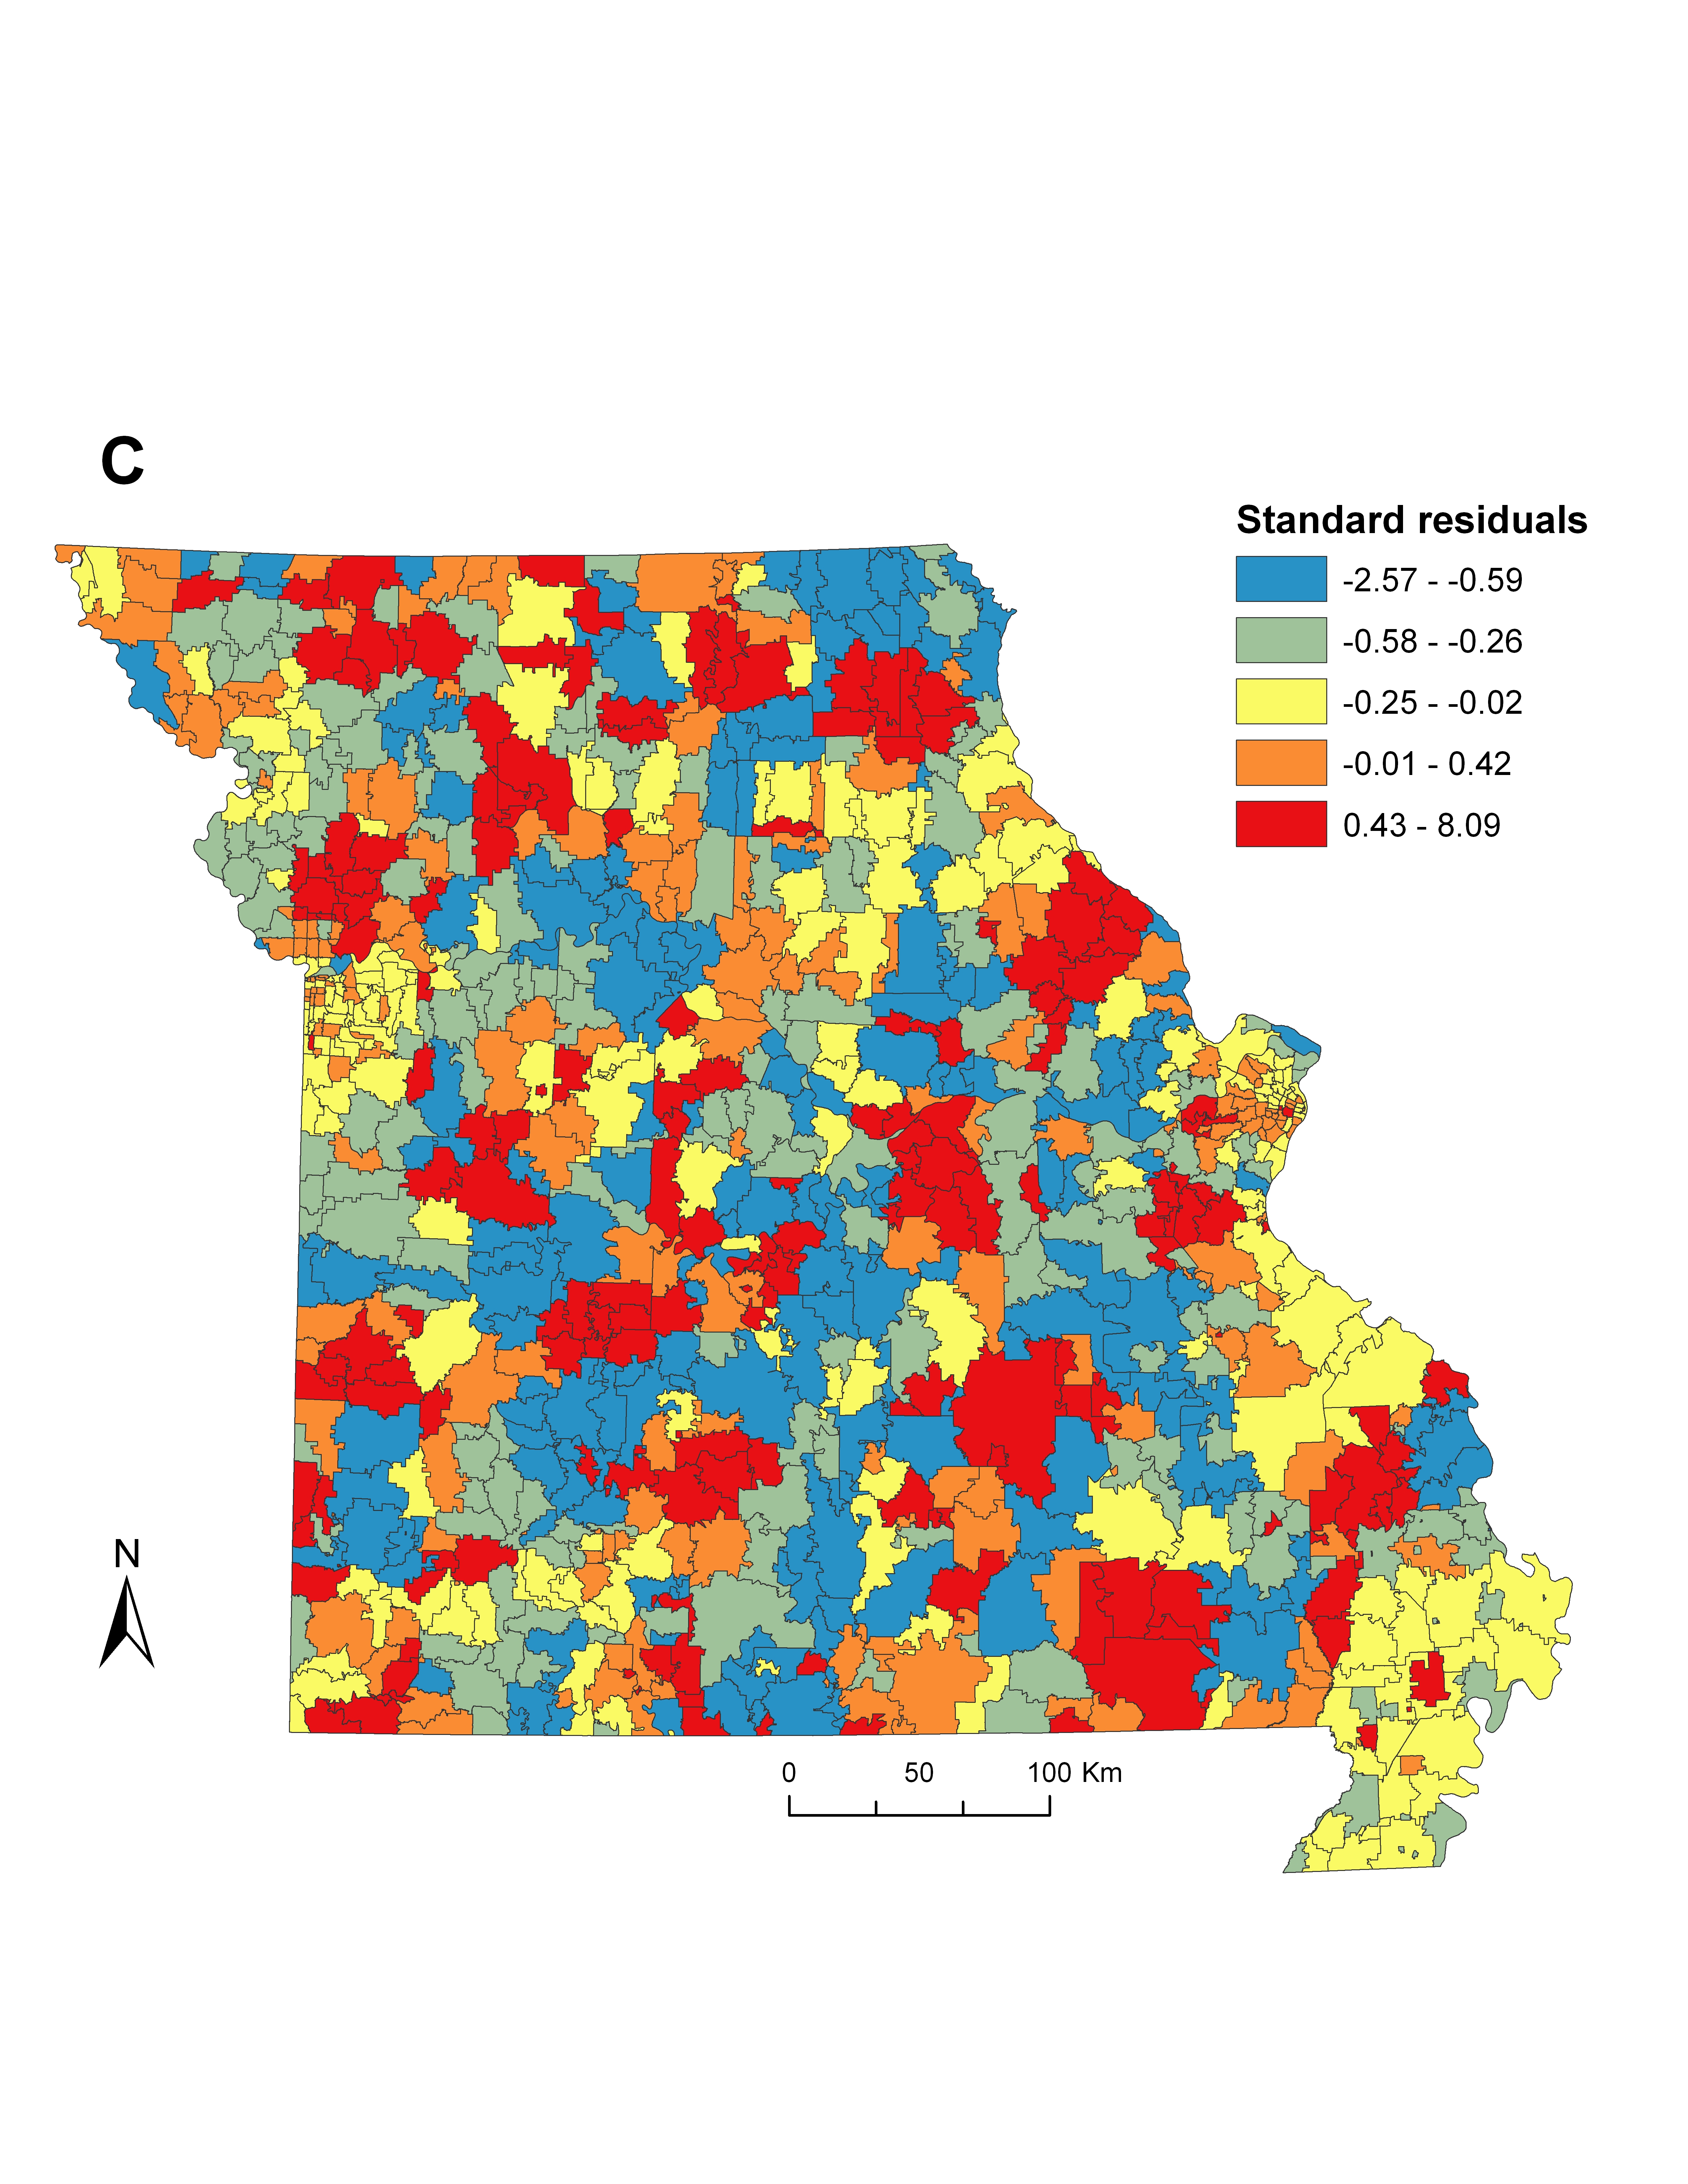
We first built a global OLS regression to fit a set of social-ecological variables. Combinations of significant covariates were retained in the final OLS model by measuring the reduction of Akaike's Information Criterion (AIC), a technique that favours parsimony over complexity [Reference Glatting31] (Supplementary Table S4). The model was screened for evidence of collinearity in the variables by ensuring all variance inflation factors remained low (<3·0). Screening the OLS residuals for spatial heterogeneity using Moran's I statistic indicated that a non-random (P < 0·05) spatial structure was present in the variables, justifying the inclusion of spatial weighting techniques. Therefore, we entered variables from the global OLS model into a GWR framework to explore the local variability in significant model parameters and incidence. Adaptive bandwidth selection was used to minimize AIC and ensure a sufficient number of zip codes were selected for each local model [Reference Fotheringham, Brunsdon and Charlton32]. We measured improvement in model fit between the OLS and GWR models by comparing the corrected AIC (AICc) and adjusted R 2 values (Table 3, Supplementary Fig. S1B). In addition, we tested for spatial autocorrelation in the GWR residuals (Supplementary Fig. S1C) using Moran's I statistic as a means of model validation and to ensure non-biased parameter estimates. To visualize the significance of each local parameter estimate for every zip code in the state, we plotted absolute t values by dividing each coefficient by its standard error and compared it against the magnitude of the coefficient [Reference Fotheringham, Charlton and Brunsdon33]. Both OLS and GWR models were produced using ArcGIS v. 10.0 (ESRI, USA).
RESULTS
Spatial distribution of incidence
The average cumulative incidence of ehrlichiosis in Missouri was 37/100 000 persons, with incidence ranging from 0/100 000 to 1010/100 000 for the 11-year time period (Fig. 1 b). At least one human case was reported in 423/1025 (41·3%) zip codes during this time. The EBS analysis revealed a clearer representation of areas with elevated incidence, particularly the Ozark Highlands ecoregion (Fig. 1 c). Moran's I was 0·586 (P < 0·001), indicating that neighbouring zip codes have statistically more similar incidence than would be found at random. The LISA analysis revealed that multiple (n = 80) zip codes had significantly similar high incidence (Fig. 1 d). Within these clusters, the average cumulative incidence was 130/100 000 compared to 29/100 000 for the rest of the state.
Determinants of elevated incidence
We found significant differences in the social-ecological characteristics between zip codes within and outside of high-incidence clusters. In the bivariate analysis, low population density, increased proportion aged ⩾65 years, increased proportion white race, increased proportion of vacant housing units, increased proportion working in the agriculture, forestry, fishing, or hunting occupational sector, increased proportion with at least a high-school-level education, increased proportion living in poverty, increased proportion of deciduous forest cover, and high deer density were all significantly predictive of membership in a high-incidence cluster (Table 1, Supplementary Table S3). Several variables remained significant after inclusion in a multivariate model. The odds of membership in a high-incidence zip code decreased for every one unit increase in human population density [adjusted odds ratio (aOR) 0·98, 95% confidence interval (CI) 0·97–0·99], increased for every one unit increase in deer density (aOR 1·27, 95% CI 1·08–1·50), and increased with every 1% increase in vacant housing (aOR 1·04, 95% CI 1·02–1·06) and deciduous forest cover (aOR 1·03, 95% CI 1·02–1·04) (Table 1).
Socioeconomic and environmental factors associated with elevated incidence clusters

LISA, Local indicator of spatial autocorrelation; aOR, adjusted odds ratio; CI, confidence interval.
* Values are presented as proportions unless referring to density/km2.
† Proportion working in agriculture, forestry, mining, fishing, or hunting industries.
‡ Proportion aged >25 years with high school or equivalent-level education.
§ Proportion living under the Federal poverty line.
Disease incidence, socioeconomic and environmental indicators all differed significantly across ecoregions (Table 2). The Ozark Highlands contained the largest number of high-incidence zip codes (n = 55) and the highest cumulative incidence (52·5/100 000 persons). Both the Western Corn Belt and Mississippi Alluvial Plain had no high-incidence clusters and the lowest cumulative incidence (10·6 and 9·4/100 000 persons, respectively). The Ozark Highlands had the lowest population density (60·26/km2), while the Western Corn Belt and Interior River had the highest (244·55/km2 and 659·24/km2, respectively). The Central Irregular Region had the highest proportion of residents aged >64 years (15·75%), largest proportion of residents with at least a high-school education (42·95%), highest proportion of outdoor occupations (9·92%) and the greatest density of deer (1·20/km2).
EPA level III ecoregion comparison

EPA, Environmental Protection Agency; LISA, local indicator of spatial autocorrelation; EBS, empirical Bayesian smoothing.
* Frequencies compared using the Fisher's exact test.
† Empirical Bayesian smoothed incidence.
‡ Standardized cases/100 000 people.
Clear regional differences in the associations between incidence and social-ecological variables were further explained with the ecoregion-specific multivariate models (Table 3). In the Ozark Highlands, nine variables were significantly associated with ehrlichiosis incidence in the bivariate analysis. After entering these in the multivariate model, two remained significant predictors. Ehrlichiosis incidence was negatively associated with population density (aOR 0·60, 95% CI 0·50–0·71) and positively associated with the proportion of vacant housing units (aOR 1·03, 95% CI 1·00–1·05). In the Central Irregular Plains, there were 10 variables significantly associated with incidence in the bivariate analysis. When entered into a multivariate model, four variables remained significant. Elevated incidence was positively associated with white race (aOR 1·06, 95% CI 1·02–1·11), proportion of vacant housing units (aOR 1·10, 95% CI 1·05–1·16), proportion living in poverty (aOR 1·06, 95% CI 1·02–1·11), and proportion of deciduous forest cover (aOR 1·03, 95% CI 1·00–1·06).
Ecoregion-specific logistic regression analysis

aOR, Adjusted odds ratio; CI, confidence interval.
* Wald χ 2 statistic.
Evidence of spatial non-stationarity
The global OLS model revealed that incidence was negatively associated with human population density, and positively associated with vacant housing, deciduous forest cover, and deer density (Table 4). Using these variables in a local GWR model resulted in improved overall model fit (∆AICc = 8·4) and explained a larger proportion of the variance (36·1%) compared to the global OLS model (25·4%). While the local GWR model supported the associations between incidence and the independent variables, the association between these covariates showed considerable differences across the state, suggesting spatial non-stationarity in some of the most significant predictors of elevated ehrlichiosis incidence (Supplementary Fig. S1A).
Global OLS and local GWR model summary

OLS, Ordinary least squares; GWR, geographically weighted regression.
* Beta coefficient (standard error).
† Beta coefficients presented as the range of values across all zip codes, with median value derived from the interquartile range.
The relationship between incidence and human population density was generally negative across the state; however, there were several strong positive associations in the northeast and parts of the Kansas City and St Louis metropolitan areas (Fig. 2 a). The distribution of vacant housing units had a strong positive relationship in the northwestern and northeastern portions of the state, as well as many parts of the Ozark Highlands (Fig. 2 b). The proportion of deciduous forest cover was significantly positively associated with increased incidence in the Mississippi Alluvial Plains, the St Louis metropolitan region, and portions of the Ozark Highlands and Central Irregular Plains (Fig. 2 c). Deer density was generally positively associated with incidence; however, there were multiple regions where this relationship was significantly inversed, including the south-central portion of the state and the Western Corn Belt (Fig. 2 d).
[colour online]. Geographically weighted regression models predicting incidence of ehrlichiosis for the four variables selected from the global ordinary least squares analysis. Panels depict the local parameter beta coefficients (darker shades indicate a positive relationship while lighter shades indicate a negative relationship) and absolute value of the local t value (larger dots indicate a stronger statistical relationship) for: (a) human population density, (b) proportion of vacant housing units, (c) proportion of deciduous forest cover, and (d) white-tailed deer density.

DISCUSSION
Understanding spatial heterogeneity in environmentally transmitted infectious diseases, particularly zoonoses, is inherently challenging due to the numerous spatial scales at which interactions between hosts, vectors, pathogens and their environment occur. Further complicating these efforts is that human socioeconomic factors and behaviours relevant to disease risk may also vary across gradients in human land-use [Reference Bayles, Evans and Allan15, Reference Killilea34], requiring a synthesis of both ecological and social factors to fully understand the causes of disease. Here, we demonstrate how a spatial epidemiological approach can both refine estimates of disease distribution and offer an improved understanding of the factors associated with transmission dynamics of an emerging vector-borne disease within a highly endemic sate. To our knowledge, this study is the first to demonstrate a subcounty-level analysis of the distribution of human ehrlichiosis in Missouri. Unlike metrics of risk based on entomological modelling, the use of incidence data decidedly demonstrates human contact with pathogen-infected vectors. This has allowed for the exploration of associations of epidemiologically important social-ecological factors that constrain human tick exposure.
Spatially explicit statistical analysis revealed that there were non-random patterns in the distribution of cases, including significantly high clustering of cases in the Ozark Highlands and Central Irregular Plains ecoregions. Identification of high-incidence clusters could prove invaluable for public health officials tasked with implementing disease surveillance and control programmes. We also identified social-ecological variables associated with incidence, including a generally positive association with an increased proportion of forest cover, increased proportion of vacant housing units, an increased density of white-tailed deer, and a generally negative association with human population density. This information may be used by public health agencies to develop integrated vector-borne disease mitigation programmes to include both environmental (e.g. deer population management) and social (e.g. awareness campaigns in rural communities) interventions.
Incidence significantly differed across ecoregions, suggesting that biogeographical-scale ecological factors may determine where humans are at greatest risk of exposure to ehrlichiosis. There was a significantly high clustering of cases in the Ozark Highlands and Central Irregular Plains, and environmental features of these two ecoregions that may facilitate high entomological risk include forest type (primarily oak-hickory woodlands, compared to bottomland deciduous forest, swamp forest and/or landscapes historically dominated by prairie grasslands converted into agricultural land in the other Missouri ecoregions), a relatively long frost-free period (140–230 and 165–235 days, respectively, potentially increasing over-winter survival for A. americanum) and occurring on a boundary between a humid continental climate and a humid subtropical climate [Reference Ricketts24]. Recent studies concerning A. americanum and other tick species have shown support for biogeographical-scale determinants of tick-borne disease risk and incidence [Reference Cohen35]. A statewide survey in Tennessee determined that E. chaffeensis-infected A. americanum were only present in two of the seven ecoregions [Reference Cohen36], while a field survey in southern Missouri found the presence and abundance of A. americanum to be positively associated with forest cover and increasing relative humidity during June [Reference Brown17]. A constellation of biogeographical factors may ultimately determine disease risk at these large spatial scales, but empirical support has been demonstrated for factors such as elevation, vapour pressure deficit, and forest area [Reference Diuk-Wasser11].
Results from the multivariate analysis predicting membership of a LISA cluster revealed that lower population density, higher deer density, and greater proportions of vacant houses and deciduous forest cover were associated with elevated incidence. These factors taken together may be indicative of forces that drive higher incidence in rural portions of the state, where a convergence of demographic and environmental characteristics across different spatial scales may be occurring. The overlap between these factors suggests that, within biogeographical regions that support deciduous forest growth and maintenance of large deer populations, the risk of disease transmission may be higher where population density is low and the proportion of vacant houses is high. However, we found further regional differences in many of the factors significantly associated with LISA clusters (Table 3), suggesting that the strength of these relationships vary with changes in biological and socioeconomic conditions. Identifying these clusters may provide public health officials with a new set of metrics to implement proactive, early detection and control initiatives.
A novel finding of this analysis was that an increased proportion of vacant housing units per zip code was consistently associated with elevated incidence of ehrlichiosis. This factor may serve as a proxy for anthropogenic influences contributing to focal points for high transmission risk in the peridomestic environment. Previous studies on the socioeconomic risk factors associated with risk for other vector-borne diseases have suggested that poor maintenance associated with these housing characteristics may result in higher levels of established vegetation cover, resulting in micro-level vector propagation or host aggregation [Reference Reisen37]. Therefore, vacant housing units may represent a new measure for identifying regions where socioeconomic conditions result in high-risk land-use practices. This finding may be used to direct future entomological sampling efforts and serve as a beacon for targeted, active surveillance efforts in areas that may now be considered focal points for high vector–human contact.
A negative correlation between tick-borne disease incidence and human population density has been observed previously for ehrlichiosis [Reference Cromley38]. However, this association is often attributed to environmental factors such as increased host–vector habitat or density. Here, we control for the contributions of several social-ecological factors and still find a widespread negative association with human population density. This may be indicative of behavioural factors that associate with low population density, such as an increase in behaviours that contribute to risk of exposure. To wit, a survey of human behaviours spanning an urban–rural human land-use gradient in Missouri found respondents from rural areas significantly less likely to engage in tick-borne disease prevention behaviours [Reference Bayles, Evans and Allan15]. Our results may therefore be of use to public health agencies tasked with promulgating disease prevention messages in areas we now show to be epidemiologically important.
Using global and locally varying regression methods, we provide a framework for identifying factors that contribute to elevated risk for disease in susceptible human populations spanning numerous biological and socioeconomic gradients. Multiple factors proved to be important in determining human incidence of ehrlichiosis in Missouri, and for several of these factors management would fall outside the traditional institutional boundaries of public health agencies (e.g. density of white-tailed deer). Therefore, our results may be of interest to multiple stakeholders with a vested interest in enhanced spatial understanding of the transmission dynamics of ehrlichiosis in this region. Based on these results, we propose an integrated approach to reducing ehrlichiosis emergence in Missouri by refining wildlife management programmes, improving vector and medical surveillance efforts, and targeting health education campaigns to high-risk areas based upon the combination of factors that associate with high human incidence. Our findings may also be used to increase physician awareness in specific areas, which may improve rates of true positive diagnoses, ultimately resulting in more precise surveillance estimates and timelier administration of antibiotic therapies to those most at risk of serious disease complications (e.g. the elderly or immunocompromised) [Reference Dumler13, Reference Demma14].
It is important to note potential sources of bias in the data used for these analyses. For example, incidence data are subject to surveillance bias due to underreporting or misdiagnoses of cases, particularly for newly emerging diseases. A prospective study in rural southeastern Missouri suggested that cases may be significantly underreported in this region [Reference Olano39]. Further, geographical estimates of incidence are based on the residence of each individual, rather than knowledge of the location where disease transmission occurred. However, studies have suggested that transmission risk for tick-borne diseases may be highest in the peridomestic environment [Reference Connally40]. Finally, estimates of spatial variation in the abundance of A. americanum may have improved our model estimates of key environmental factors that drive ehrlichiosis incidence. However, as no statewide survey data currently exist, and tick abundance has been shown to correlate with broad-scale biogeographical factors in numerous recent studies [Reference Brown17, Reference Yabsley18], we instead utilized available environmental data in place of estimates of tick abundance.
Our findings illustrate the value of synthesizing social-ecological factors to understand spatial variability in the incidence of a vector-borne, zoonotic disease. The manifestation of this disease in human populations is a product of both ecological factors that drive pathogen amplification within the enzootic transmission cycle, and the socioeconomic and demographic conditions that influence which human populations are at greatest risk of exposure. These results provide an increased knowledge base of the spatial distribution of ehrlichiosis in Missouri, and represent several opportunities for greatly improved surveillance and targeted health interventions.
SUPPLEMENTARY MATERIAL
For supplementary material accompanying this paper visit http://dx.doi.org/10.1017/S0950268813002951.
ACKNOWLEDGEMENTS
We thank Karen Yates (MDHSS) and the MDC for their assistance with access to and interpretation of the databases used for this research. Funding was provided by Environmental Protection Agency grant no. 834495 and by the North Central Integrated Pest Management Center of the United States Department of Agriculture.
DECLARATION OF INTEREST
None.