


Introduction
Weeds are a major constraint to crop yields worldwide (Oerke, Reference Oerke2006). In tropical regions, particularly in low-input cropping systems where farmers have low to no access to mechanization or herbicides, weeding is one of the most time-consuming practices (Gianessi, Reference Gianessi2013; Ogwuike et al., Reference Ogwuike, Rodenburg, Diagne, Agboh-Noameshie and Amovin-Assagba2014; Dahlin and Rusinamhodzi, Reference Dahlin and Rusinamhodzi2019). Additionally, weeding is especially critical within the first weeks after crop sowing. Delays frequently result in severe crop yield losses. In rice (Oryza sativa L.), yield losses are generally estimated to range from 9 to 32%, pertaining to actual and potential losses, respectively (Oerke and Dehne, Reference Oerke and Dehne2004). Rodenburg and Johnson (Reference Rodenburg and Johnson2009) estimated total crop yield losses due to weeds in sub-Saharan Africa to reach 2.2 million tons per year.
In the mid-west region of Madagascar, rice has traditionally been grown in irrigated lowlands, where soil flooding and transplanted seedlings confer a competitive advantage against weeds. However, due to limited irrigable fields and the need to meet the growing food demands of the local population, upland rainfed rice cropping systems have recently become widely adopted by farmers (Raboin et al., Reference Raboin, Randriambololona, Radanielina, Ramanantsoanirina, Ahmadi and Dusserre2014). In these upland rainfed systems, rice is directly seeded on dry soil and depends exclusively on rainfall. Rainfed rice is more susceptible to weed infestation, as the crop lacks the suppressive effects of flooded systems and the initial advantage of large transplanted seedlings. Effective weed control is therefore required during the early stages, when rice plants are weak competitors with weeds. However, this period coincides with peak labour demands for other tasks, such as transplanting lowland rice and sowing other upland crops. The resulting labour bottlenecks often delay weeding in upland rice fields, resulting in crop yield losses due to weed competition.
Weed impact varies throughout the crop growth cycle: there are phases in the crop cycle when weeds have relatively little effect on yield, and others when their presence is particularly detrimental. Identifying the critical period of weed interference (CPWI) is one of the key aspects of integrated weed management (Swanton and Weise, Reference Swanton and Weise1991). The CPWI is defined as the period in the crop growth cycle during which weeds must be controlled to prevent important yield losses (Knezevic et al., Reference Knezevic, Evans, Blankenship, Van Acker, Lindquist, Evans and Blankenship2002; Nieto et al., Reference Nieto, Brondo and Gonzalez1968). This concept helps optimize the timing of weed control practices. However, determining the CPWI for rice systems is complicated by the wide diversity of rice varieties and the large range of agronomic and climate conditions (Rodenburg and Johnson, Reference Rodenburg and Johnson2009). In recent years, various studies have been conducted on the CPWI for different types of rice cropping systems. These studies reported that the CPWI is influenced by different factors, such as crop management, rice cultivars and the level of weed infestation. For example, Chauhan and Johnson (Reference Chauhan and Johnson2011) showed that reducing the row spacing from 30 cm to 15 cm decreased the CPWI for rainfed rice in Philippines from 15-58 days after sowing (DAS) to 18-52 DAS. Touré et al. (Reference Touré, Sogbedji and Gumedzoé2013) observed in Mali that the CPWI for the rice cultivar NERICA-4 was between 14-42 DAS, but it was reduced to 28-42 DAS when a more weed competitive cultivar, Oryza glaberrima (CG14), was used. Singh et al. (Reference Singh, Bhullar and Chauhan2014) confirmed that the CPWI varies with the type of rice cultivar and the level of weed infestation in dry-seeded rice systems in India, showing that the higher the weed infestation, the longer the CPWI. Importantly, these studies were conducted under relatively favourable conditions, with adequate fertilization, and irrigation in the case of upland rice. In contrast, in the Malagasy context, where weed infestation may be high (> 1000 individuals.m- 2, Ranaivoson et al., Reference Ranaivoson, Naudin, Ripoche, Rabeharisoa and Corbeels2019), fields are strictly rainfed and fertilization is sub-optimal, since farmers rarely use mineral fertilizers and at most have access to manure of poor quality. How the crop-weed competition dynamics shift under these conditions of water and nutrient limitation remains unclear. Determining the CPWI in such systems is thus crucial to design effective and context-specific weed management strategies.
Different approaches have been proposed to enhance integrated weed and crop management in rainfed rice systems (Rodenburg and Johnson, Reference Rodenburg and Johnson2009; Singh et al., Reference Singh, Bhullar and Chauhan2015). For instance, conservation agriculture, based on no-tillage with soil cover provided by crop residues, cover crops or intercrops, has been identified as an effective, integrated weed management practice (Bajwa, Reference Bajwa2014; Chauhan et al., Reference Chauhan, Singh and Mahajan2012). For example, a study conducted in Madagascar by Ranaivoson et al. (Reference Ranaivoson, Naudin, Ripoche, Rabeharisoa and Corbeels2018) reported that weed emergence and weed biomass were significantly reduced when 10 t ha-1 or more of crop residues were applied. Besides the use of crop residues, cover crops, or living mulches, can effectively control weeds. For example, Stylosanthes guianensis Aubl., a perennial legume shrub can be successfully used as a living mulch in rice cropping systems, as was first demonstrated in Laos (Shelton and Humphreys, Reference Shelton and Humphreys1975). In a more recent study conducted in southern Benin, Saito et al. (Reference Saito, Azoma and Oikeh2010) demonstrated that a fallow of Stylosanthes reduced weed biomass by up to 95% in upland rice. In the mid-west region of Madagascar, Stylosanthes was first introduced in upland rice systems as a fallow crop during the dry season and a living mulch during the rice growth cycle. It is often sown as a relay intercrop between rice rows at a later stage in the rice cycle to avoid competition during early growth. After rice harvest, it may be maintained as a fallow or terminated by rolling and slashing to provide a dry mulch. In the following cropping season, rice or another crop like maize can be directly sown in this dead mulch (Rodenburg et al., Reference Rodenburg, Randrianjafizanaka, Büchi, Dieng, Andrianaivo, Ravaomanarivo and Autfray2020). In these conditions, Stylosanthes has proven more effective than other commonly used intercrops like cowpea or velvet bean in reducing Striga asiatica infestations (Randrianjafizanaka et al., Reference Randrianjafizanaka, Autfray, Andrianaivo, Ramonta and Rodenburg2018) and suppressing other weeds, particularly dominant grass weeds, while maintaining rice yield at levels equal to or higher than those in conventionally tilled rainfed systems (Rafenomanjato et al. Reference Rafenomanjato, Ripoche, Marnotte, Letourmy, Autfray, Randriamampianina, Bàrberi and Moonen2023). Furthermore, Stylosanthes improves soil fertility as a result of its nitrogen fixation capacity and the decomposition of its biomass (Zemek et al., Reference Zemek, Frossard, Scopel and Oberson2018). Yet, Ranaivoson et al. (Reference Ranaivoson, Naudin, Ripoche, Rabeharisoa and Corbeels2019) demonstrated that the observed yield advantages with Stylosanthes living mulch were primarily due to reduced weed pressure rather than improvements in soil moisture or nitrogen availability.
In the mid-west region of Madagascar, where rice fields are strictly rainfed and poorly fertilized, the CPWI is expected to be considerably longer than observed in other studies. In these conditions, the use of a living mulch may offer an interesting option to reduce the CPWI by supressing weeds, particularly during the early stages of the rice cycle.
In this study, we conducted field experiments comparing different weeding regimes – ranging from increasing weedy conditions to prolonged weed-free periods - to assess their effects on rice growth and yield under conventional tillage (CT) with low nitrogen fertilization. We then examined how a no-tillage system with Stylosanthes living mulch affects the CPWI.
Materials and methods
Site characterization
Field experiments were carried out at the experimental station of the Research and Training Platform, SPAD (Sustainable Highland Production Systems in Madagascar, https://www.dp-spad.org/) located in Ivory, in the mid-west region of Madagascar (19°33’ lat. S, 46°25’ long. E, 930 m a.s.l.). This region is characterized by a mid-altitude tropical climate, Cfa (Köppen classification), with a mean annual temperature of 22.9°C during the 2005–2015 period. The rainy season spans from November to March, which corresponds to the upland rice cropping season. The mean seasonal rainfall at the site during the period from 2005/06 to 2015/16 was 1296 mm. Experiments were conducted during two cropping seasons, 2016/17 and 2017/18. Temperature and rainfall during both experimental seasons were similar (24.6 and 24.9°C, 1329 and 1406 mm respectively for the 2017 and 2018 cropping seasons, Supplementary materials Figure S1). The soil type of the experimental field was an Oxisol (USDA) with a clay-silt-sand composition of 34-39-27% in the topsoil layer (0–10 cm), 17.2 g kg−1 C, 1.4 g kg−1total N, 2.5 mg kg−1 available P (Olsen), and with a pH H2O of 5.3 (Randrianjafizanaka et al., Reference Randrianjafizanaka, Autfray, Andrianaivo, Ramonta and Rodenburg2018).
Experimental design and treatments
The experiment began in October 2016 and was carried out over two cropping seasons, i.e., until April 2018 under CT. The experiment was established each year on a different field to eliminate residual treatment effects on the soil seed bank from one season to another, both fields being located at a maximum distance of ca. 60 m. During the second cropping season, in 2017/18, an additional field experiment was carried out to assess the effect of a no-tillage cropping system with a living mulch of Stylosanthes guinanensis (NTLM). This field was located near the CT experiment. All fields had a consistent management history: CT was practiced before the CT field experiments, and NTLM prior to the NTLM experiment. In CT fields, previous crops were a mixture of rice and bean grown prior to the experiment in 2016/17, and groundnut prior to the experiment in 2017/18 and in both cases, crop residues were removed from the field after harvest. In the NTLM field, previous crop was a fallow of Stylosanthes.
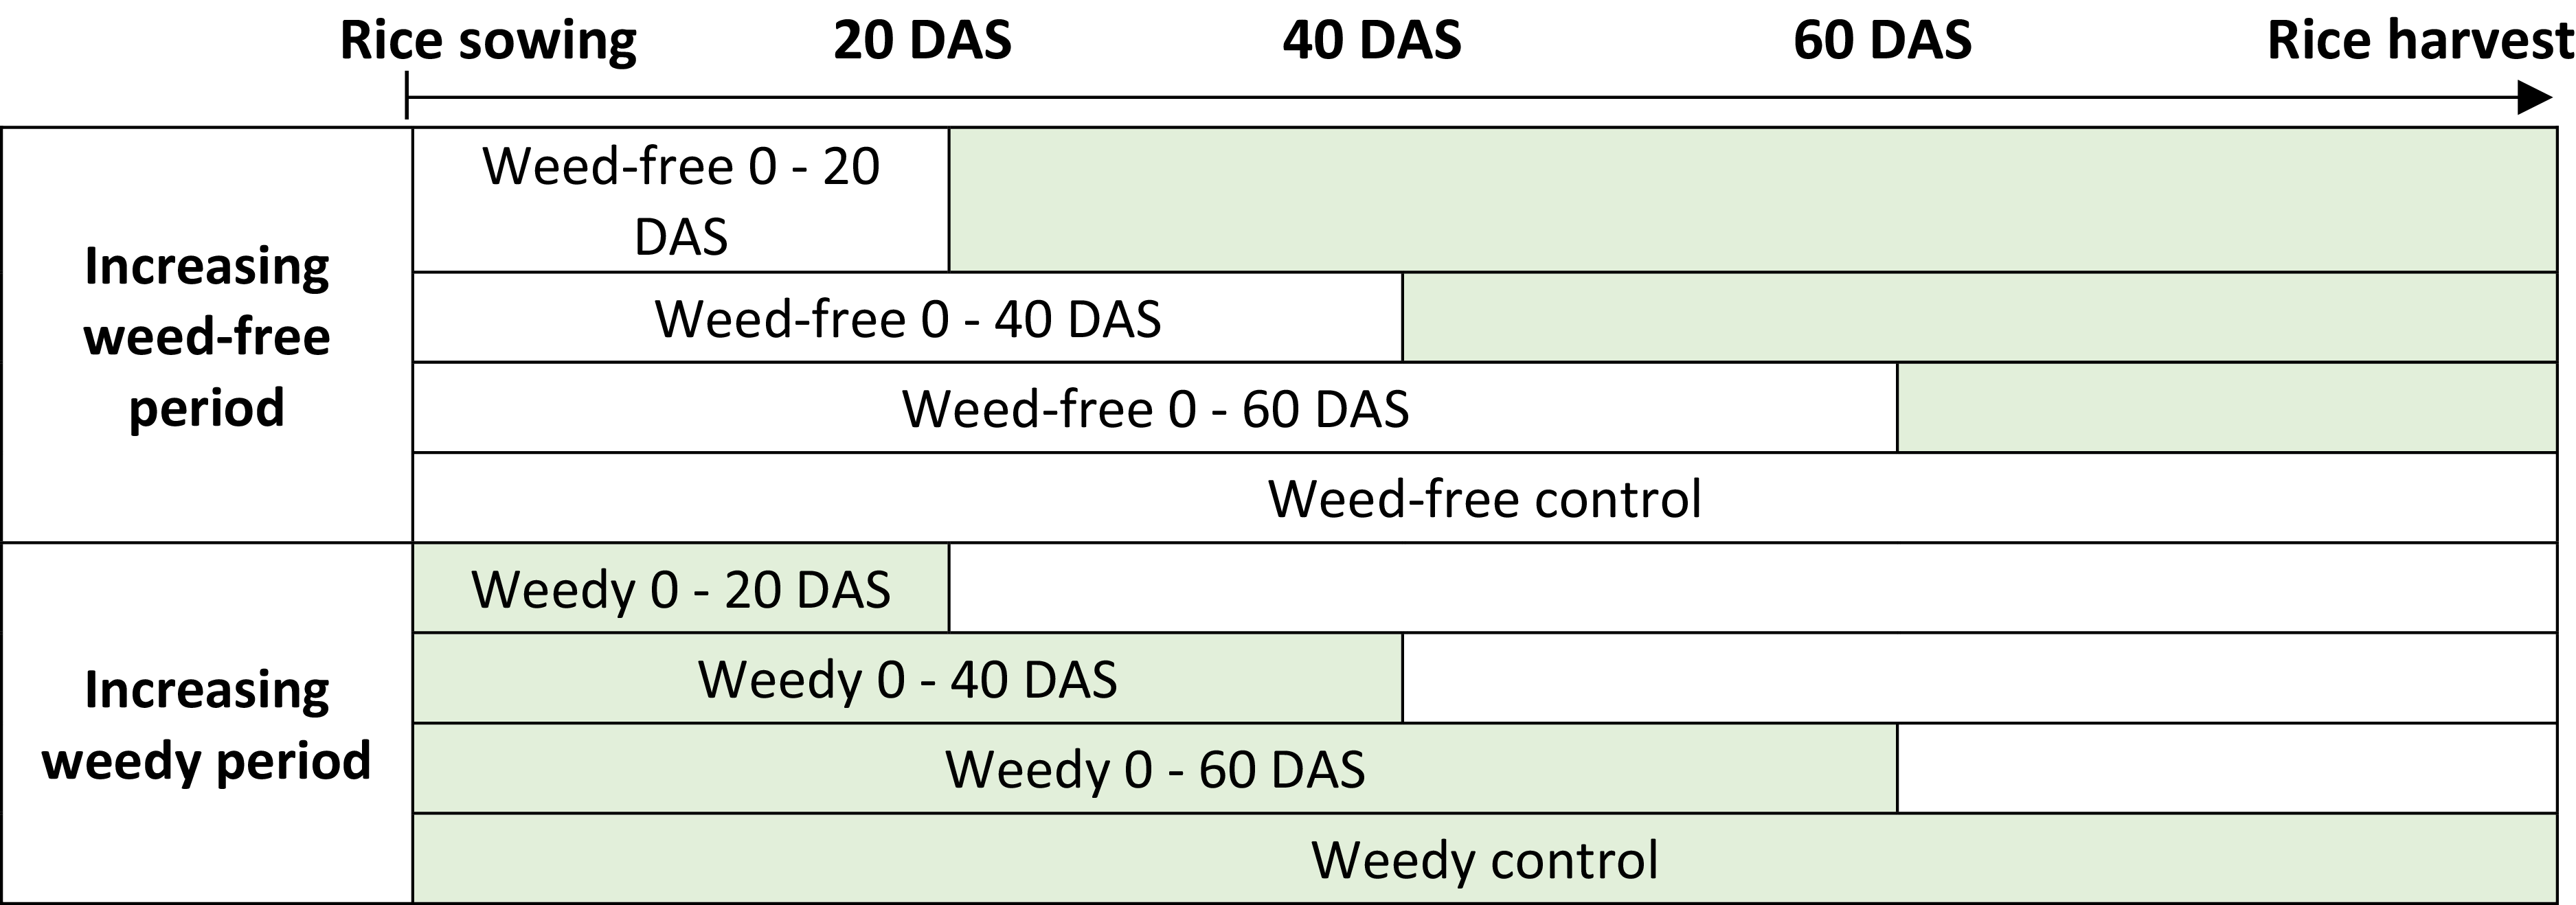
In each of the three fields, the experimental layout was a randomized complete block with four replications. Two weeding regimes were studied, one where the weedy period increased and another where the weed-free period increased. Four different durations of weedy or weed-free periods were tested: 20, 40, 60 or approximately 120 days (the full rice cycle duration). Treatments with a weedy or weed-free period of 120 days corresponded to the two control treatments, respectively called weedy and weed-free control. In total, eight different weeding treatments were tested (Figure 1). Treatments with increasing weedy periods aimed at determining the beginning of the CPWI, while treatments with increasing weed-free periods aimed at determining its end (Knezevic et al., Reference Knezevic, Evans, Blankenship, Van Acker, Lindquist, Evans and Blankenship2002; Nieto et al., Reference Nieto, Brondo and Gonzalez1968). Each treatment was implemented on a square plot of 25 m2 in 2016/17, reduced to 16 m2 in 2017/18 due to field size limitation. Weeding was done manually, either by hand pulling or hand hoeing, every five days during the weed-free periods on all plots except the weedy control plots.

Figure 1. Schematic representation of the eight weeding treatments applied in the field experiments, consisting of two weeding regimes: (i) increasing weed-free period, and (ii) increasing weedy period. Each regime has four treatments. White cells correspond to the weed-free periods while light green cells correspond to the weedy periods. DAS = Days After Sowing.
Crop management
The rice cultivar used was NERICA-4, one of the cultivars of interspecific rice hybrids developed by the Africa Rice Center. It was created from the wide cross between the Oryza sativa (L.) from Asia and the Oryza glaberrima (Steud.) (Rodenburg et al., Reference Rodenburg, Saito, Kakaï, Touré, Mariko and Kiepe2009). Its growth cycle is around 120 days in the mid-west region of Madagascar. Crop management was done according to common local farming practices, i.e. all crop management operations were performed manually. There were no applications of mineral fertilizers or herbicides.
In the CT system the soil was ploughed using a spade-like metal tool to 15–20 cm depth whereas in the NTLM system there was no ploughing. The Stylosanthes cultivar used was Stylosanthes guianensis (Aubl) Sw CIAT-184, imported from Central America. During the dry and cold season (May to October) previous to the experiment, the cover crop was rolled down three times by an oxen-driven roller crimper to become a dry mulch allowing to slow down the regrowth of the Stylosanthes before rice sowing.
Rice sowing was carried out at the end of November (22/11/2016 and 28/11/2017 for CT, 27/11/2017 for NTLM) by digging holes of ca. 5 cm depth, with an inter-row spacing of 30 cm and intra-row spacing of 20 cm, and by putting five to eight rice seeds in each hole. These holes were made using a spade-like metal tool. In the CT system the tool was dug directly into the bare soil two weeks after soil tillage, while in NTLM the spade was used to cut through the Stylosanthes mulch before reaching the soil beneath. Cattle manure was applied in the seeding holes at a rate of ca. 5 t ha-1 dry matter in all treatments (1.2% N, 0.5% P and 1.2 % K i.e. around 60 kg N ha-1, 25 kg P ha-1 and 60 kg K ha-1). Harvest was conducted manually using a sickle in March-April, at 119, 128, and 123 DAS respectively for CT in 2017 and 2018 and NTLM in 2018.
Measurements
The composition of the weed community and weed cover were determined at 20, 40, 60 DAS and at rice harvest. The whole plot, with exclusion of the two edge rows, was used for the weed surveys. All species inside the plot were recorded, and the percentage of total weed cover as well as the cover of each species was estimated using a visual notation method scoring weed cover from 1 (species present but rare corresponding to 1%) to 9 (full soil cover corresponding to 100%, Le Bourgeois et al., Reference Le Bourgeois, Auzoux, Boraud, Fayolle, Marnotte, Rafenomanjato, Randriamampianina, Ripoche and Kouakou2022).
In the treatments kept weedy until 20, 40, and 60 DAS, weeds were removed at those specified dates and their biomass was measured by separating them in three different groups (grasses, broadleaved species and sedges). The biomass was oven-dried at 60°C for 72 hours and weighted to obtain dry matter biomass.
To evaluate the effect of weed competition on rice growth, plant height, and tiller number were measured at 60 DAS on twelve rice plants randomly selected at the beginning of the experiment in each plot. Plant nitrogen status was also estimated using a chlorophyll metre (SPAD-502, Konica Minolta, Inc., Chiyoda, Japan). Chlorophyll metre readings were done at three different parts of the last fully expanded leave on ten randomly selected plants in each plot.
At harvest, rice grain yield, and weed biomass (from the weedy control and treatments kept weed-free until 20, 40 and 60 DAS) were determined on the whole plot, edge rows excluded. Rice and weed plants were cut at ground level. Panicles were hand-threshed; all spikelets were stripped from panicles. Unfilled spikelets were removed and filled spikelets were weighted to estimate grain yield. The fresh samples of rice grain and biomass and total weed biomass were oven-dried at 60°C for 72 hours to estimate the dry biomass. Grain yield was adjusted at 14% moisture content on an oven-dry basis.
In the NTLM system, the biomass of the mulch of Stylosanthes was measured just before sowing in 12 randomly selected 1 m2 sampling areas inside the experimental field, to assess the thickness of the physical barrier it provided. The biomass of Stylosanthes regrowth during the rice cycle was determined at harvest on the same sampling areas used for crop and weed biomass collection. Plants were cut at ground level and oven-dried at 60°C for 72 hours to obtain dry matter content.
Data analysis
Weed species were classified according to their frequency of occurrence and their abundance was expressed as weed cover. Frequency is the proportion of total sampling units (here the plots) in which the species was found, while weed cover is the average cover of a weed species in the plots where it was present. Species having at the same time a frequency greater than 40% and an average weed cover exceeding 5% were considered as dominant species.
Analysis of variance (ANOVA) was performed with the R program version 4.1.1 (R Core Team, 2023) using the package lme4 (Bates et al., Reference Bates, Machler, Bolker and Walker2015) in order to determine the effect of weeding treatments, season and their interaction on weed variables (weed cover and weed biomass) and on rice grain yield, plant height, tillering and nitrogen status, blocks being considered as a random effect when necessary. Sampling date was also tested as fixed factor for weed cover, and weed type was considered as a fixed factor for weed biomass. A specific ANOVA was performed to test the effect of soil/cover crop management (CT vs. NTLM) on the rice and weed response variables considering the 2017/18 cropping season. To ensure residue normality, the target variable was transformed using the Box-Cox function (powerTransform function from car R package, Fox and Weisberg, Reference Fox and Weisberg2019). Post hoc tests were performed on rice yield with the emmeans (Lenth, Reference Lenth2022) and multcomp packages (Hothorn et al., Reference Hothorn, Bretz and Westfall2008), using the Tukey’s all pair comparison method to compare the rice yields from different treatments.
To quantify the effect of weed biomass on rice yield loss, yield loss was defined as follows:
 $${\rm{Yield}}\;{\rm{loss}} = 100{\rm{*}}\;{{{\rm{Yiel}}{{\rm{d}}_{{\rm{WFC}}}} - {\rm{Yiel}}{{\rm{d}}_{\rm{W}}}} \over {{\rm{Yiel}}{{\rm{d}}_{{\rm{WFC}}}}}}$$
where Yield loss is expressed in %, YieldWFC (t ha-1) is the rice yield in the weed-free control plot and YieldW (t ha-1) the yield in the weed treatment plot.
An analysis of variance (ANOVA) was performed to test the effects of weed biomass and year on yield loss in the CT treatment, and the effect of weed biomass and soil/cover crop management on yield loss considering the CT and NTLM treatments. Then, the relationship between weed biomass and yield loss was tested using various models. Model selection was based on the Akaike Information Criterion (AIC) and Bayesian Information Criterion (BIC), with lower values indicating better model fit. The best-fitting model was the following (AIC and BIC for the three models tested are provided in Supplementary Materials, Tables S1):
 $${\rm{Yield}}\;{\rm{loss}} = {\rm{a*ex}}{{\rm{p}}^{ - 0.5{\rm{*}}{{\left( {{{\log \left( {{{{\rm{Weed}}\;{\rm{biomass}}} \over {\rm{b}}}} \right)} \over {\rm{c}}}} \right)}^2}}}$$
A logistic function (equation 3) in the stat package of the R program version 4.1.1 (R Core Team, 2021) was used to determine the beginning of CPWI, while a Gompertz function (equation 4) in the minpack.lm R package (Elzhov et al., Reference Elzhov, Mullen, Spiess and Bolker2023) was used to determine its end. These two models are the most common approaches for data analysis of CPWI (Knezevic et al., Reference Knezevic, Evans, Blankenship, Van Acker, Lindquist, Evans and Blankenship2002). CPWI was determined by using relative rice yield (% of weed-free control yield) and growing degree days (GDD) as quantitative variables in the regression analysis. Hereby, a standard threshold level for yield loss of 5% was used (Knezevic et al., Reference Knezevic, Evans, Blankenship, Van Acker, Lindquist, Evans and Blankenship2002). As starting point for the calculation of GDD, the date of rice emergence was used, which occurred at 7 DAS.
Logistic equation structure:
 $${\rm{Y}} = \;{{\rm{a}} \over {1 + {\rm{ex}}{{\rm{p}}^{\left( { - {{\left( {{\bf{x}} - {\bf{b}}} \right)} \over {\bf{c}}}} \right)}}}}$$
where Y is the relative rice yield (% weed-free control yield); x is the sum of GDD after rice emergence (base temperature for rice growth is 10°C, rice emergence date was 7 DAS); a, b and c are parameters estimated with R package stats, function nls and the Self Starting NLs Logistic model (SSlogis).
Gompertz equation structure:
 $${\rm{Y}} = {\rm{a*}}\;{\rm{ex}}{{\rm{p}}^{\left( { - {\rm{b*}}\;{\rm{ex}}{{\rm{p}}^{\left( { - {\rm{k*x}}} \right)}}} \right)}}$$
where Y is the relative rice yield (% weed-free control yield), x is the sum of GDD after rice emergence (base temperature for rice growth is 10°C, rice emergence date was 7 DAS) and a, b, k are parameters estimated with R package minpack.lm based on Levenberg-Marquardt Nonlinear Least-Squares Algorithm.
Results
Weed community composition
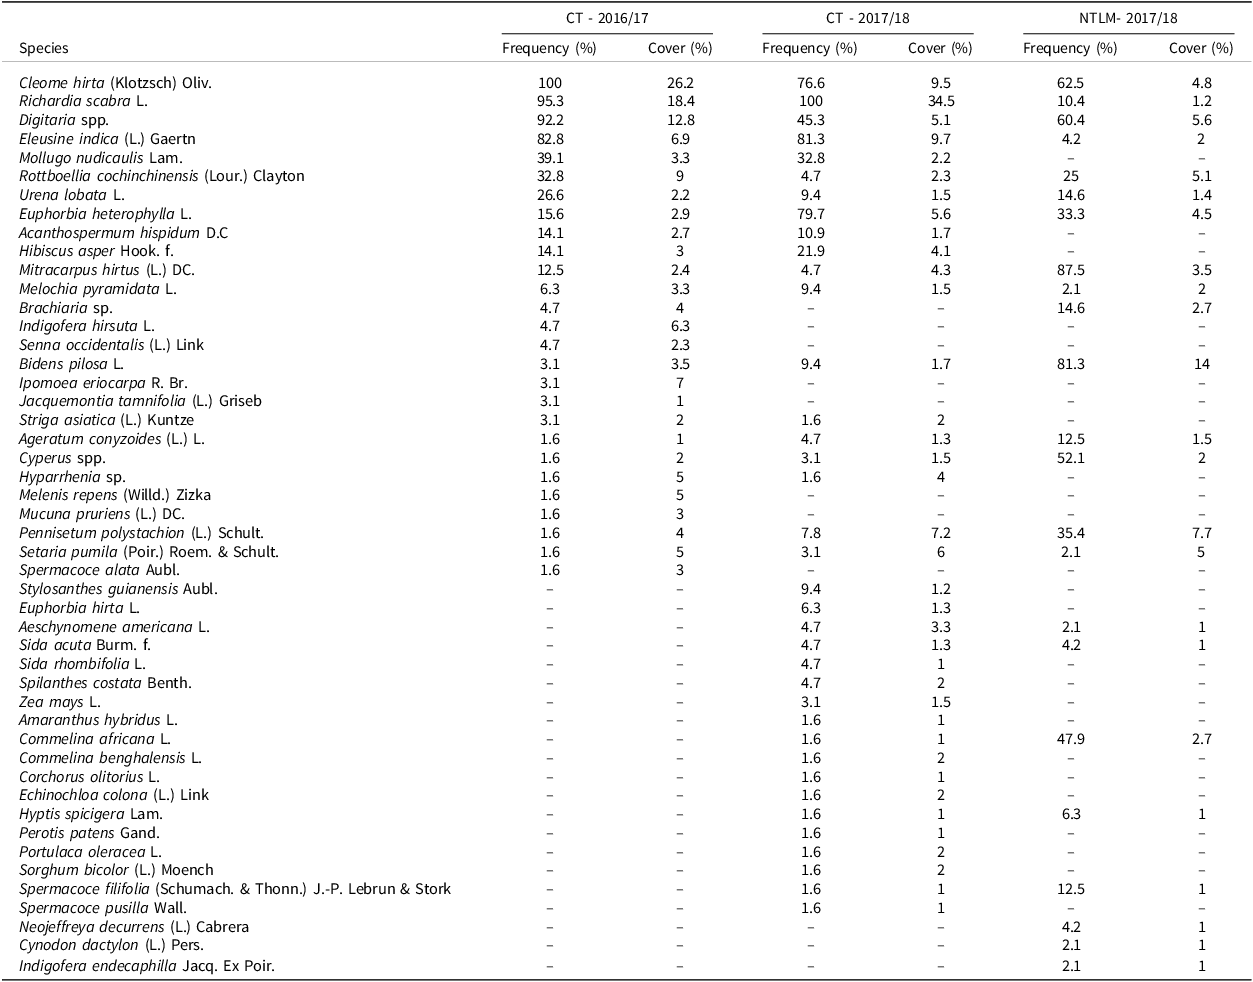
Overall, 50 weed species were recorded in the three experiments. Each experiment showed a different weed flora pattern. Weed species, their mean frequency and cover are shown in Table 1. In the CT treatment, 27 and 37 weed species were recorded in 2016/17 and 2017/18, respectively but dominant species (frequency > 40% and cover > 5 %) were similar in both seasons: Cleome hirta (Klotzsch) Oliv., Richardia scabra L., Digitaria spp. and Eleusine indica (L) Gaertn. In the NTLM treatment in 2017/18, 23 species were recorded, with only three not found in the two CT trials. Yet, dominant species differed in NTLM, as grass weeds occurred at much lower cover and frequency than under CT. Bidens pilosa L. and Digitaria spp. were the only dominant species whose frequency and cover exceeded 40% and 5% respectively.
Table 1. Weed species observed in the conventionally tilled plots (CT) in 2016/17 and 2017/18, and in the no-tilled plots with living mulch (NTLM) in 2017/18 with their average frequency (%) and cover (%)

Frequency (%): average frequency of occurrence of the weed species in the plots, Cover (%): average cover of the weed species in the plots where the species was present.
Effects of weeding treatments on weed cover
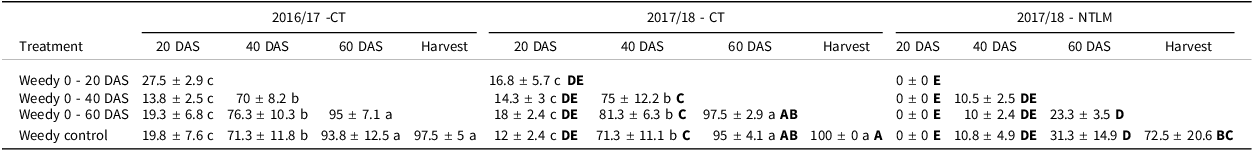
Under CT, total weed cover in the weedy plots was not affected by season but by the date of sampling (p < 0.001; Supplementary materials, Table S2A). During both cropping seasons, weed cover increased until halfway through the rice growth cycle (60 DAS), reaching more than 90% and remaining stable until harvest (Table 2). Weed cover increased significantly (p < 0.001) at each sampling, rising from 20% at 20 DAS to 70% at 40 DAS—more than a threefold increase. Early weeding during the first 20 days slowed the weed cover dynamics compared to weedy plots, yet it reached similar levels at harvest (about 86% vs. 95–98% of weed cover respectively, Supplementary material Table S3). When weeds were removed the first 60 days, weed cover was low (around 20%), similarly to plots left weedy the first 20 days.
Table 2. Weed cover (%, mean ± confidence interval at 95%) observed during the rice crop cycle at 20, 40, 60 days after sowing and at harvest, under the different weedy treatments in the conventional tillage (CT) in the 2016/17 and 2017/18 cropping seasons, and in the no-tillage cropping system with a living mulch of Stylosanthes (NTLM) in the 2017/18 cropping season

CT = conventional tillage, NTLM = no-tillage with living mulch, DAS = days after sowing. Lower case letters indicate significant differences at 0.05 between weeding regimes in each year while bold upper case letters indicate differences between CT and NTLM.
Comparing CT and NTLM in 2017/18, total weed cover was affected by soil/cover crop management, date of sampling and their interaction (p < 0.001; Supplementary materials, Table S2B). Total weed cover dynamics under NTLM differed from CT with a delayed weed emergence. Weed cover was almost zero until 20 days, and it was significantly lower than in CT from 40 DAS until harvest, ultimately covering around 70% of the plots at rice harvest (Table 2). Under NTLM, as weed emergence was delayed, weed cover dynamics in case of early weeding during the first 20 days, was similar to those observed in the weedy control plots (Supplementary material, Table S3).
Effects of weeding treatments on weed biomass
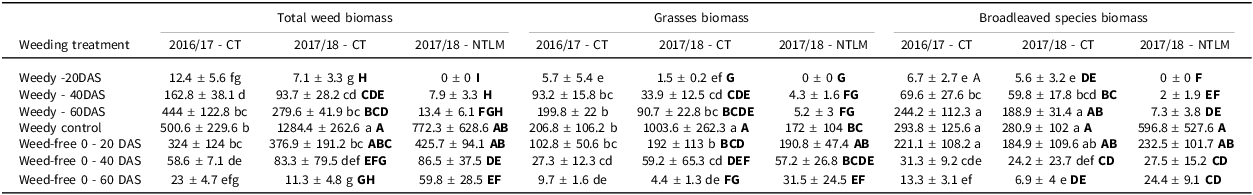
Weed dry biomass under CT was significantly affected by weeding treatment, the type of weeds and the ‘season x weeding treatment’ interaction (p < 0.001; Supplementary materials, Table S2A). It should be noted here that sedge weeds were not included in the analysis as their cover was null in both seasons under CT, and null or less than 2% under NTLM. Weed biomass of broadleaved species was similar between seasons for each weeding treatment, and increased significantly until 60 DAS to remain stable until harvest (Table 3). We observed the same trend for the total weed biomass (i.e., grasses and broadleaved species) and for grasses alone, except in the weedy control, where biomass was significantly higher in 2017/18 than in 2016/17 (p < 0.001 for total weed and p < 0.01 for grasses). Total weed biomass increased significantly from sowing to 60 DAS in 2016/17 and 2017/18, reaching 444 and 280 g m-2 respectively. Then, it showed contrasting dynamics until harvest, reaching 500 and 1290 g m-2 in 2016/17 and 2017/18 respectively, mainly due to a significant increase of the grass biomass that reached 1003 g m-2 at harvest in 2017/18 (vs. 206 g m-2 in 2016/17, Table 3).
Table 3. Weed biomass at harvest (g m-2, mean ± confidence interval at 95%) for the different weedy treatments and the different weed types (grasses, broadleaved species and total weed biomass including both types together), under conventional tillage (CT) in 2016/17 and 2017/18 and no-tillage with living mulch (NTLM) in 2017/18

Lower case letters indicate significant differences at 0.05 between weeding regimes under CT considering both seasons while bold upper case letters indicate differences between CT and NTLM in 2017/18.
Comparing CT and NTLM in 2017/18, weed dry biomass was affected by soil/cover crop management, type of weeds, weeding treatment and the ‘soil/cover crop management x weeding treatment’ interaction (p < 0.001; Supplementary materials, Table S2B). Under NTLM in 2017/18, weed biomass in weedy treatments remained below 15 g m-2 until 60 DAS, whether broadleaved species, grasses or total weed biomass were considered, before increasing significantly until harvest (Table 3). Thus, weed biomass was significantly lower under NTLM than in CT from 20 to 60 DAS whatever weed type except for grasses at 20 DAS. No significant difference was observed between NTLM and CT for the weedy control except for grasses whose biomass was much lower under NTLM than CT (172 g m- 2 vs. 1000 g m- 2 respectively). In case of early weeding, the only difference between NTLM and CT was observed when weeding was done until 60 DAS, with total weed biomass being significantly higher under NTLM than under CT.
The dry biomass of the Stylosanthes mulch measured before sowing was 23 ± 5 t ha-1, and the dry biomass from the regrowth of Stylosanthes collected at harvest was 0,026 ± 0,01 t ha-1, without any observed differences between weed treatments.
Effects of weeds on rice growth
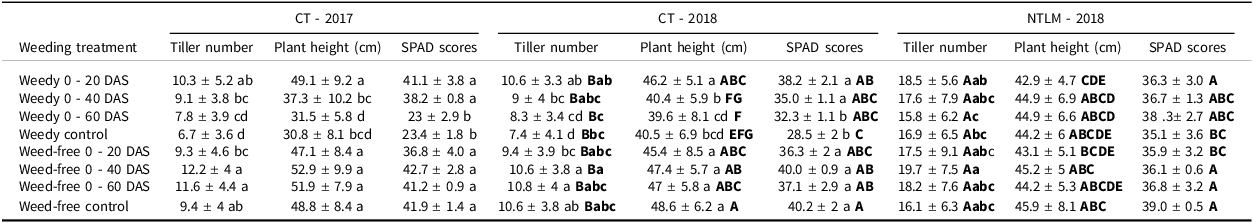
Under CT, weed infestation affected rice growth during the vegetative phase (Table 4). No seasonal effects were detected on plant height, tiller number, or the rice nitrogen status estimated by SPAD scores (Supplementary materials, Table S1). Tiller number was affected by weeding treatments (p < 0.001), while plant height and SPAD scores were affected by weeding treatments and their interaction with season (p < 0.001). A significant reduction of tiller number was observed for a weedy period of 60 DAS or longer, while highest tillering was observed when weeding occurred until 40 to 60 DAS. Similarly, a significant reduction in plant height was observed for a weedy period of 40 DAS or longer. SPAD scores were also significantly reduced for a weedy period of 60 DAS or longer. On the contrary, an early short weedy period or a long weed-free period (from 20 DAS to harvest) did not affect plant height nor the SPAD scores (Table 4).
Table 4. Effect of the weeding treatments on rice plant height, tillering and nitrogen status (estimated using SPAD chlorophyll metre scores) under conventional tillage (CT) in 2016/17 and 2017/18, and no-tillage with living mulch (NTLM) in 2017/2018. mean ± standard error

Lower case letters indicate significant differences at 0.05 between weeding regimes under CT. Bold upper case letters indicate differences between CT and NTLM in 2017/18; bold lower case letters indicate differences between weeding regimes for CT and NTLM for tiller number.
Tiller number was significantly higher under NTLM than under CT (p < 0.001, Supplementary materials Table S2B). A weed-free period of 40 DAS led to the highest number of tillers while a weedy period of 60 DAS to harvest led to the lowest number. Plant height was significantly lower under CT than NTLM in case of a weedy period from 40 to 60 DAS. No difference was detected between weeding treatments under NTLM. Finally, SPAD scores did not significantly (p = 0.434) differ between CT and NTLM, but in general, the longer the weedy period, the lower the SPAD scores.
Effects of weeding treatments and weed biomass on rice grain yield
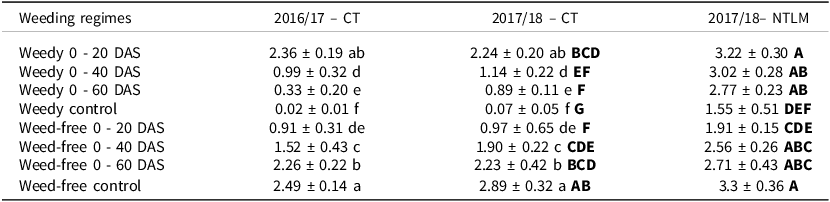
Under CT, rice grain yield was significantly affected by season (p < 0.01) and weeding treatments (p < 0.001, Supplementary materials, Tables S2A). Rice grain yield was significantly lower in 2016/17 than in 2017/18 (Table 5). For both seasons, rice grain yield in the weeded control (around 2.7 t ha-1) was similar to that observed when weeds were removed from 20 DAS (around 2.3 t ha-1). Significant yield loss under CT started after a weedy period of 40 DAS or occurred when weed interference started at 60 DAS or earlier. Thus, the longer the weed-free period or the shorter the weedy period, the higher the rice yield (Table 5).
Table 5. Rice grain yield (t ha-1, mean ± confidence interval at 95%) of the different weeding treatments under conventional tillage (CT) in 2016/17 and 2017/18, and no-tillage with a living mulch (NTLM) in 2017/18

Lower case letters indicate significant differences between weeding treatments, while upper bold case letters indicate significant differences between CT and NTLM (p-value < 0.05).
Under NTLM, rice grain yield observed in the weed-free control (3.3 t ha-1) was similar to that observed in the plots maintained weedy 20 to 60 DAS or weed-free from 40 to 60 DAS (on average 2.9 t ha-1). The lowest yield was observed in the weedy control plots (1.6 t ha-1). Rice yield was significantly (p < 0.001, Supplementary materials Table S2B) affected by soil/cover crop management, weeding treatments and their interaction. Yield was significantly (p < 0.001) higher under NTLM than under CT except in the plots weeded 40 DAS or longer, in which the yields were similar between NTLM and CT (Table 5).
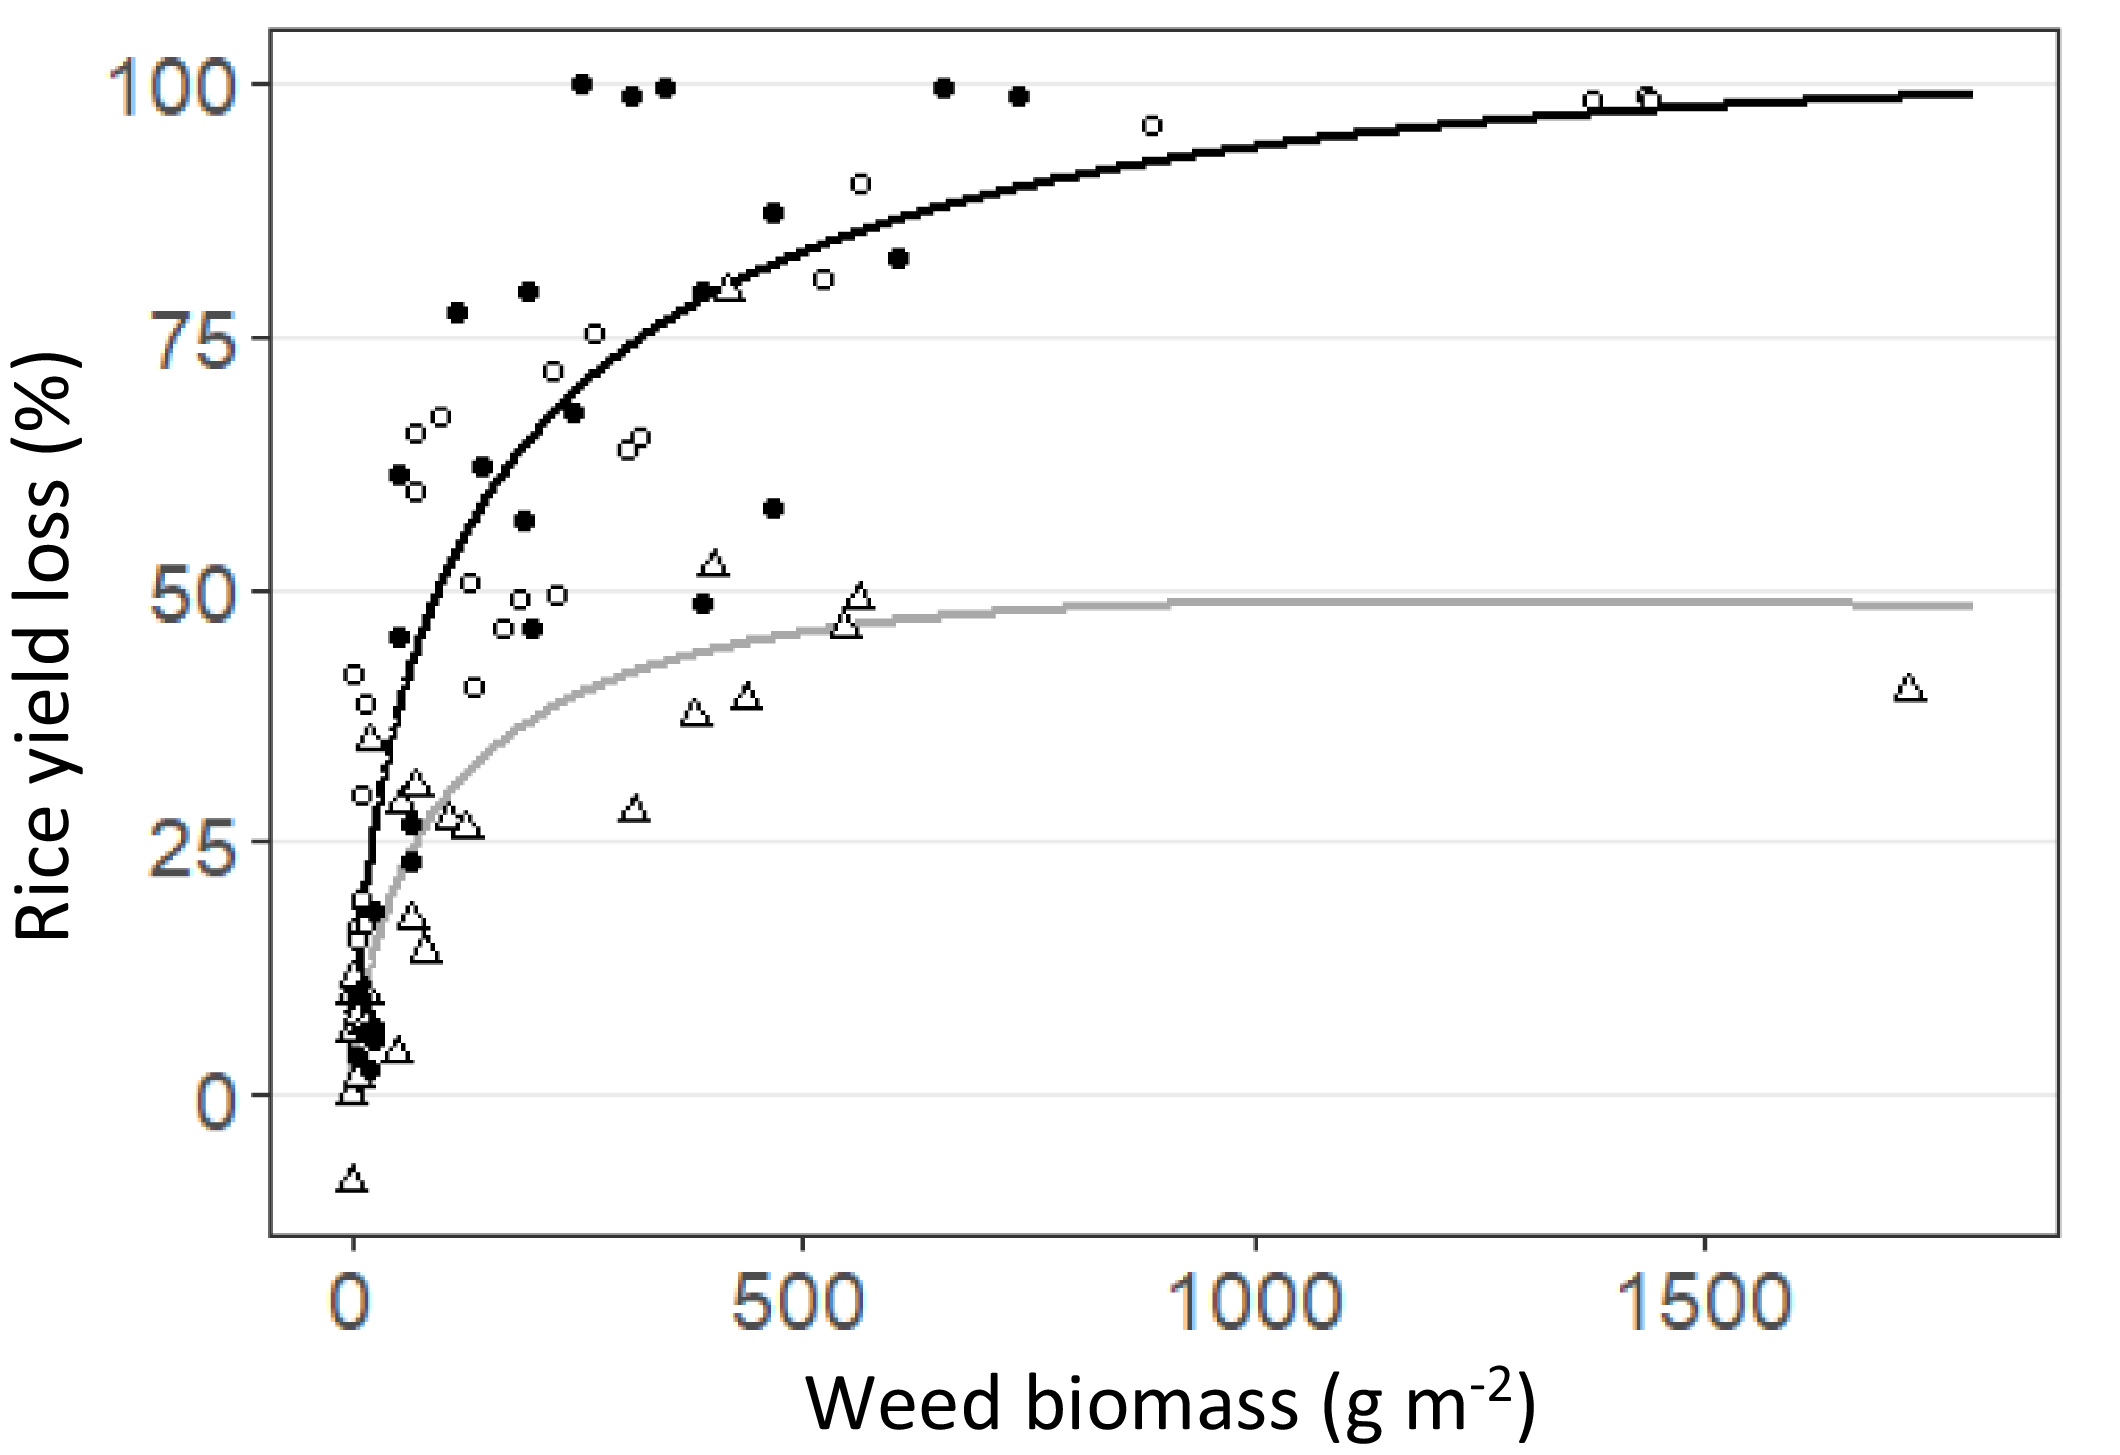
Yield loss was affected by weed biomass under CT and also by soil/cover crop management under NTLM (p < 0.001, Supplementary materials Table S2A,B). The maximum rice yield loss observed was 98% under CT while it reached 51% under NTLM. Weed biomass explained 78% and 70% of the rice yield loss under CT and NTLM, respectively (Figure 2).

Figure 2. Relationship between rice yield loss (in %) and total weed biomass (g m-2) under conventional tillage (CT) in 2016/17 and 2017/18, and no-tillage with living mulch in 2017/18 (NTLM). • = CT in 2016/17; ○ = CT in 2017/18; Δ = NT in 2017/18. The relationships are shown by a black solid line for CT (R2=0.78), and a dark grey solid line for NTLM (R2 = 0.70).
 $${\rm{For}}\,\,{\rm{CT}}{:}\ Yield\,loss = 100*{\exp ^{ - 0.5*\left( {{{\log \left({{weed\,biomass} \over {2839.404}}\right)} \over {2.858}}} \right)^2}}$$
 $${\rm{For}}\,\,{\rm{NTLM}}{:}\ Yield\,loss = 48.75*{\exp ^{ - 0.5*{{\left( {{{\log \left({{weed\,biomass} \over {1226.55}}\right)} \over {2.45}}} \right)}^2}}}$$
Critical period of weed interference
Using a 5% yield loss threshold, we found that CPWI occurred between 17 and 76 DAS (155 and 1043 GDD) under CT in 2016/17 (Figure 3a), between 9 and 92 DAS (47 and 1288 GDD) under CT in 2017/18 (Figure 3b) and between 31 and 91 DAS (366 and 1280 GDD) under NTLM in 2017/18 (Figure 3c). Interestingly, at a 10% yield loss threshold, the CPWI under NTLM occurred much later (at 47 DAS, 602 GDD) and was shorter (ending at 75 DAS, 1003 GDD), resulting in a shorter duration compared to CT. Under CT, the 10% threshold only causes a 4-day delay in the beginning of the CPWI in both years, and a shortening of 12 or 17 DAS respectively in 2016/17 and 2017/18, leading to CPWI occurring between 21 and 64 DAS (209 – 864 GDD) in 2016/17 and between 13 and 75 DAS (86 – 981 GDD) in 2017/18.

Figure 3. Effect of weed interference on relative rice yield in upland rice cropping systems under conventional tillage (CT) in 2016/17 (a) and 2017/18 (b), and under no-tillage with living mulch (NTLM) in 2017/18 (c). Rice yields observed under increasing weedy periods and weed-free periods are represented by empty and filled symbols, respectively. The fitted models based on logistic and Gompertz equations are indicated by grey and black curves, respectively. The dotted horizontal line indicates the 5% yield losses threshold (relative yield of 95%), while grey and black vertical lines indicate the beginning and the end of the critical period of weed interference (CPWI) considering this 5% threshold.
Discussion
Weed interference effects on rice growth, yield and duration of the CPWI under conventional cropping systems
Rice growth was particularly affected by early weed competition, when weeding was delayed beyond three weeks after sowing, consistent with previous studies (Anwar et al., Reference Anwar, Juraimi, Samedani, Puteh and Man2012; Touré et al., Reference Touré, Sogbedji and Gumedzoé2013). Early vigour is an important trait for weed competitiveness of rice cultivars (Zhao et al., Reference Zhao, Atlin, Bastiaans and Spiertz2006). Reduced growth led to significant lower yields compared to the treatments experiencing later weed interference. Low chlorophyll metre scores in the treatments with the longest periods of weed interference since the beginning of the crop cycle indicated a strong competition between rice and weeds for nitrogen. This competition for nitrogen, and likely for other nutrients, reduced rice plant height and tillering. These findings are in accordance with previous studies reporting that crops suffering from a long weed interference period showed lower contents of nitrogen, phosphorus, potassium and other elements, with nitrogen content being the most affected (Lehoczky et al., Reference Lehoczky, Márton and Nagy2013). Besides, weeds may also be more effective than crops for nutrient uptake in the early season, further disadvantaging rice (Qasem, Reference Qasem1992). On the contrary, rice growth was not or slightly reduced in case of late weed competition, as rice plants had already established a height advantage over weeds. Nevertheless, the lower yields we observed under late-season weed competition indicated that yield components (panicles, grains/panicles and 1000-seed weight) were still negatively affected, as also observed by Anwar et al. (Reference Anwar, Juraimi, Samedani, Puteh and Man2012).
Rice grain yield losses due to weed infestation observed in the conventionally tilled cropping system (CT) in our experiments were similar to those reported for upland rice in India and the Philippines (Chauhan and Johnson, Reference Chauhan and Johnson2011; Singh et al., Reference Singh, Bhullar and Chauhan2014), reaching almost 100%. Other studies reported lower yield losses: 66 to 85% in upland rainfed rice in the Guinea savannah (Touré et al., Reference Touré, Sogbedji and Gumedzoé2013), 53% in upland rice in Malaysia (Anwar et al., Reference Anwar, Juraimi, Samedani, Puteh and Man2012), and 47 to 49% in irrigated rice in the Sahel (Johnson et al., Reference Johnson, Wopereis, Mbodj, Diallo, Powers and Haefele2004). In all these studies, the highest yield losses corresponded to the highest amounts of weed biomass recorded (450 to 700 g m-2), values slightly lower than those we observed in our experiments. These results confirm previous findings of a strong correlation between rice yield losses and weed biomass (Rafenomanjato et al., Reference Rafenomanjato, Ripoche, Marnotte, Letourmy, Autfray, Randriamampianina, Bàrberi and Moonen2023; Ranaivoson et al., Reference Ranaivoson, Naudin, Ripoche, Rabeharisoa and Corbeels2019; Ripoche et al., Reference Ripoche, Barkaoui, Allouch, Christina, Heuclin, Rafenomanjato, Moonen, Autfray and Marnotte2024).
The variability in the effect of weeds on rice yield losses across studies may be attributed to differences in weed biomass, but also to cultivar, climate and the inherent characteristics of the cropping systems. In the mid-west region of Madagascar, upland rice cropping typically does not involve the application of mineral fertilizers, due to high costs (Razafimahatratra et al., Reference Razafimahatratra, Raharison, Bélières, Autfray, Salgado and Rakotofiringa2017). Instead, farmers usually use manure as their primary source of nutrient inputs, which is, however, of low quality (< 1 % N on a dry matter basis, Razafimahatratra et al., Reference Razafimahatratra, Raharison, Bélières, Autfray, Salgado and Rakotofiringa2017; Ripoche et al., Reference Ripoche, Autfray, Rabary, Randriamanantsoa, Blanchart, Trap, Sauvadet, Becquer and Letourmy2021). In these soils that are highly deficient in nutrients (Raminoarison et al., Reference Raminoarison, Razafimbelo, Rakotoson, Becquer, Blanchart and Trap2020), weed interference likely exacerbates nutrient shortages for rice. Timely application of mineral fertilizers could contribute to reduce weed interference, as observed by Ripoche et al. (Reference Ripoche, Barkaoui, Allouch, Christina, Heuclin, Rafenomanjato, Moonen, Autfray and Marnotte2024). Besides, weed community composition may also affect the competition dynamics between crop and weeds (Adeux et al., Reference Adeux, Vieren, Carlesi, Bàrberi, Munier-Jolain and Cordeau2019; Chauhan and Johnson, Reference Chauhan and Johnson2011). This may partly explain the longer CPWI we observed in our study (around 59 – 83 days) compared to the studies cited above with short cycle rice cultivars (around 28 – 46 days), as well as the observed differences between both seasons in our study. In 2017/18, the CPWI started earlier and ended later leading to an extension of 24 days compared to 2016/17. This large difference may be due to a combination of factors, including higher rainfall since the beginning of the cropping season (Figure S1), differences in field conditions (as a result of different preceding crops), in addition to differences in the weed community composition with a high prevalence of Richardia scabra. Interviews with farmers, revealed that this species causes substantial damages to rice compared to other species (Rafenomanjato, Reference Rafenomanjato2018; Ripoche et al., Reference Ripoche, Barkaoui, Allouch, Christina, Heuclin, Rafenomanjato, Moonen, Autfray and Marnotte2024) and various studies reported that R. scabra is a dominant and particularly troublesome weed species in parts of America and Africa (Chandran and Singh, Reference Chandran and Singh2003; Muoni et al., Reference Muoni, Rusinamhodzi, Rugare, Mabasa, Mangosho, Mupangwa and Thierfelder2014; Namatsheve et al., Reference Namatsheve, Cardinael, Chikowo, Corbeels, Rugare, Mabasa and Ripoche2024).
Interest of a no-tillage with living mulch cropping system to reduce weed interference
The results of our study confirmed the hypothesis that no-tillage with Stylosanthes as cover crop (NTLM) delayed and shortened the CPWI for rainfed rice. It turned out that the CPWI started 20 days later in the NTLM system compared to the CT system, while its end was not modified. This delay was explained by the significantly reduced weed emergence early in the cropping season in the NTLM system. Indeed, at 20 DAS weeds had not yet emerged in NTLM and weed biomass remained substantially low until rice flowering, while in CT weed biomass had already reached 200 to 360 g m-2. While other studies have suggested that the living part of a cover crop can suppress weed infestation by smothering them (Lu et al., Reference Lu, Watkins, Teasdale and Abdul-Baki2000), this was not the case likely in our study. The regrowth of Stylosanthes during the rice growing season in our experiment, with less than 0.03 t ha-1, was certainly insufficient to exert significant weed suppression. The delay in weed emergence in the NTLM system was most likely due to the presence of the thick Stylosanthes mulch (more than 20 t ha-1) that acted as a physical barrier, effectively preventing weed germination and weed growth, particularly at the beginning of the cropping season (Teasdale, Reference Teasdale1996). Results from a study conducted in Madagascar by Ranaivoson et al. (Reference Ranaivoson, Naudin, Ripoche, Rabeharisoa and Corbeels2018) reported that crop residue amounts of 10 t ha-1 or more were needed to significantly reduce weed emergence whatever the climate conditions. The strong suppressive effect in NTLM may also have been enhanced by the preceding Stylosanthes fallow, as reported by Saito et al. (Reference Saito, Azoma and Oikeh2010) who observed a 70 to 95% reduction in weed biomass during the fallow period. Moreover, cropping systems with no-tillage may lead to a shifts in the weed community composition (Bajwa, Reference Bajwa2014; Trichard et al., Reference Trichard, Alignier, Chauvel and Petit2013). Rafenomanjato et al. (Reference Rafenomanjato, Ripoche, Marnotte, Letourmy, Autfray, Randriamampianina, Bàrberi and Moonen2023) reported that these shifts were rather favourable to broadleaved species in similar conditions to our study. They noticed a significant suppressive effect on grasses, like Eleusine indica or Digitaria spp. that are particularly noxious and abundant in rainfed rice cropping systems (Rodenburg and Johnson, Reference Rodenburg and Johnson2009), but also on R. scabra that cannot emerge in darkness (Paul et al., Reference Paul, Crayton and Biswas1976). Consequently, this provided rice with an important early-season advantage, enabling stronger vegetative growth leading to significantly higher yields under NTLM than CT. This is consistent with a fundamental principle of crop-weed competition: crops that emerge before weeds, gain preferential access to the available resources and outcompete later-emerging weeds (Asif et al., Reference Asif, Iqbal, Randhawa and Spaner2014). Here, the sowing method played a significant role in enabling rice to emerge through the thick mulch layer. During rice sowing, a spade was used to create an opening through the Stylosanthes mulch, allowing rice seeds to access the soil while maintaining mulch cover around planting holes, thus minimizing physical obstruction to rice emergence. On the other hand, Stylosanthes, being a legume crop, has the potential to supply nitrogen (Saito et al., Reference Saito, Linquist, Keobualapha, Phanthaboon, Shiraiwa and Horie2006; Zemek et al., Reference Zemek, Frossard, Scopel and Oberson2018). Yet, even in the presence of Stylosanthes, the weedy treatments displayed a low chlorophyll metre score, indicating that rice still suffered from competition for nitrogen.
The limited impact of raising the yield loss threshold on the CPWI onset in conventional cropping systems indicated that early weeding is crucial under upland conditions. From a farmer’s perspective, a delay of the onset of weed-rice competition can be highly advantageous, especially when intensive weeding is required during periods of high workload. This situation often happens as the calendars for different cropping activities overlap in the mid-west region of Madagascar (Razafimahatratra et al., Reference Razafimahatratra, Raharison, Bélières, Autfray, Salgado and Rakotofiringa2017). A delay in weeding allows for the completion of other activities without risking substantial yield losses due to weeds left uncontrolled in the rice fields. Furthermore, even if farmers are unable to dedicate time to remove weeds throughout the growing season, they can still expect to obtain ca. 50% of the attainable yield in a NTLM system, while in a CT system a total crop failure is expected, as indicated by the 98-99% yield loss observed in the CT weedy controls. Although our results are consistent with previous studies showing strong weed suppression under high mulch levels (Rafenomanjato et al., Reference Rafenomanjato, Ripoche, Marnotte, Letourmy, Autfray, Randriamampianina, Bàrberi and Moonen2023; Ranaivoson et al., Reference Ranaivoson, Naudin, Ripoche, Affholder, Rabeharisoa and Corbeels2017, Reference Ranaivoson, Naudin, Ripoche, Rabeharisoa and Corbeels2018), further research is needed to consolidate them. Moreover, the amounts of mulch in our experiments are well above those achieved by farmers (Naudin et al., Reference Naudin, Scopel, Andriamandroso, Rakotosolofo, Andriamarosoa Ratsimbazafy, Rakotozandriny, Salgado and Giller2012). Assessing the performance of the no-tillage cropping system with living mulch under diverse, farmer-managed conditions is thus necessary to provide practical and context-specific guidelines for farmers.
Conclusion
This study provides crucial information to improve weed management in low-input rainfed rice-based cropping systems. Our results showed that rice fields must be weeded carefully until 60 DAS to avoid significant yield losses; weeds emerging subsequently are not expected to significantly affect the yield. Results further suggest that, in case of strong infestation by competitive weed species like Richardia scabra, the first weeding intervention to prevent substantial yield losses should be performed before 10 DAS in a conventional, tillage-based, rice cropping system. Otherwise weeding can be delayed with a few days to a week. This implies that farmers should be able to assess the dominant weed species in their fields in order to determine the appropriate timing for weeding. Additionally, this study showed that no-tillage cropping with a living mulch of Stylosanthes is a promising option to allow farmers to postpone weeding by two weeks or more. While these findings need to be confirmed under on-farm conditions, they are very promising for farmers, since the possibility to delay weeding after rice sowing would allow them to allocate time to other urgent farm activities during this labour-intensive period.
Supplementary material
The supplementary material for this article can be found at https://doi.org/10.1017/S0014479725100215
Data availability statement
The dataset is available at CIRAD dataverse, with the following link: https://doi.org/10.18167/DVN1/WCVA7Z.
Acknowledgements
The authors would like to thank the International PhD Programme in Agrobiodiversity of the Scuola Superiore Sant’Anna, Pisa (Italy), CIRAD – dP SPAD, Antsirabe (Madagascar), Stradiv Project (no. 1504-003) funded by Agropolis fundation and CRP Rice program (CGIAR) for providing financial and scientific support. They also thank field technicians for their invaluable field works and N.Motisi and R.Loison for their help and relevant comments to improve the manuscript.


 Open access